
95% of researchers rate our articles as excellent or good
Learn more about the work of our research integrity team to safeguard the quality of each article we publish.
Find out more
ORIGINAL RESEARCH article
Front. Astron. Space Sci. , 01 November 2021
Sec. Space Physics
Volume 8 - 2021 | https://doi.org/10.3389/fspas.2021.761875
This article is part of the Research Topic Coupled Feedback Mechanisms in the Magnetosphere-Ionosphere System View all 25 articles
 K. A. Sorathia1*
 A. Michael1
 V.G. Merkin1
 A.Y. Ukhorskiy1D. L. Turner1
 J.G. Lyon2J. Garretson1
 M. Gkioulidou 1
 F.R. Toffoletto3
During geomagnetically active periods ions are transported from the magnetotail into the inner magnetosphere and accelerated to energies of tens to hundreds of keV. These energetic ions, of mixed composition with the most important species being H+ and O+, become the dominant source of plasma pressure in the inner magnetosphere. Ion transport and acceleration can occur at different spatial and temporal scales ranging from global quasi-steady convection to localized impulsive injection events and may depend on the ion gyroradius. In this study we ascertain the relative importance of mesoscale flow structures and the effects of ion non-adiabaticity on the produced ring current. For this we use: global magnetohydrodynamic (MHD) simulations to generate self-consistent electromagnetic fields under typical driving conditions which exhibit bursty bulk flows (BBFs); and injected test particles, initialized to match the plasma moments of the MHD simulation, and subsequently evolved according to the kinetic equations of motion. We show that the BBFs produced by our simulation reproduce thermodynamic and magnetic statistics from in situ measurements and are numerically robust. Mining the simulation data we create a data set, over a billion points, connecting particle transport to characteristics of the MHD flow. From this we show that mesoscale bubbles, localized depleted entropy regions, and particle gradient drifts are critical for ion transport. Finally we show, using identical particle ensembles with varying mass, that O+ non-adiabaticity creates qualitative differences in energization and spatial distribution while H+ non-adiabaticity has non-negligible implications for loss timescales.
The modern understanding of transport processes, and their multiscale nature, through the magnetotail transition region has advanced considerably in the decades following the early work that first recognized their importance (e.g., Mauk and McIlwain, 1974). The definition of what constitutes the transition region varies in the literature (e.g., Ohtani and Motoba, 2017; Sergeev et al., 2018); for the purposes of this work we will take a more expansive definition of the magnetotail transition region,
A theoretical description of these flow bursts was provided by Pontius and Wolf. (1990) who identified fast flows as entropy-depleted “bubbles” that would be interchange unstable within the ambient entropy profile radially-decreasing away from Earth. Confirming that flow bursts are bubbles using in situ data is complicated by both the sparsity of spacecraft in the transition region and the necessity of extrapolating flux tube entropy from point measurements of fast flows (e.g., Wolf et al., 2006). However, it has been found that inferred entropy-depletion from spacecraft measurements is a good predictor of the penetration depth of flow bursts (Dubyagin et al., 2011; Kim et al., 2012). This interpretation was supported by regional modeling, i.e., localized subdomains of the global magnetosphere, which highlighted the role of reconnection, and the resultant reduction in flux tube volume, in creating bubbles (e.g., Birn et al., 2009, 2011; Liu et al., 2014) and the role of buoyancy (e.g., Yang et al., 2010, Yang et al., 2015; Sadeghzadeh et al., 2021) in the subsequent transport of these bubbles into the inner magnetosphere.1
Despite these advances, a full multiscale understanding of the transition region has remained elusive due to both observational and modeling limitations. Important questions remain regarding: the relative role of large-scale versus mesoscale convection; the statistical distribution of bubble lengthscales and the physical mechanisms that govern the size of bubbles; and the mechanisms of ion energization. Sparse spacecraft coverage of the transition region makes it difficult to spatially localize injections, although there has been progress using multi-mission conjunctions (Turner et al., 2017) and remote imaging (Keesee et al., 2021). Modeling multiscale transport in the transition requires: energy-dependent drifts, not included in global magnetohydrodynamic (MHD) models which approximate the bulk flow with the E × B drift; fast flows outside the quasi-static slow-flow approximation of typical ring current models (see e.g., Toffoletto, 2020, and references therein); global models that produce mesoscale magnetotail structures (Wiltberger et al., 2015; Cramer et al., 2017; Merkin et al., 2019), requiring high spatial resolution and low dissipation algorithms; a representation of wave-particle interactions that contribute to ion heating (e.g., Chaston et al., 2014; Cheng et al., 2020); and finite gyroradius effects, as H+ in the transition region is known to be quasi-adiabatic (Runov et al., 2017), while heavier ion species like O+, likely exhibit highly non-adiabatic behavior (e.g., Moebius et al., 1987; Delcourt et al., 1997; Nosé et al., 2000; Keika et al., 2013; Bingham et al., 2020). The latter point is particularly important. While the details of the O+ energization mechanisms and transport into the ring current are not yet fully understood (Ohtani et al., 2011; Keika et al., 2013; Gkioulidou et al., 2019), O+ is known to contribute a significant, if not dominant, amount of the total ring current energy density during increasingly disturbed geomagnetic conditions (Nosé et al., 2005).
Given these challenges it is perhaps not surprising that there has been little work studying bubble-mediated transport through the transition region in a global context. Ukhorskiy et al. (2018) used global MHD and test particle modeling to investigate particle interactions with a single bubble to demonstrate the importance of the mesoscale structure of the bubbles to trap the particles, whereas Cramer et al. (2017) performed a more expansive study over a range of stormtime events to demonstrate the importance of bubbles in transport. In a series of papers representing the most self-consistent work to date (Lin et al., 2017, 2021; Cheng et al., 2020), global hybrid simulations were used to demonstrate that reconnection creates depleted bubbles that are anisotropic, non-Maxwellian, and not in equilibrium. However, spatial rescaling is necessary for global hybrid simulations to be computationally tractable and even then the duration of these simulations remains limited.
Regional modeling has been used to reveal many aspects regarding transport through the transition region, while global modeling faces substantial intrinsic difficulties. Despite this, global modeling of the transition region is necessary to probe the complex magnetosphere-ionosphere coupling that binds the two geospace domains together. Mesoscale plasma sheet injections have global-scale consequences through their role in the ring current build-up. The partial ring current drives “Region 2” field-aligned currents (FACs; e.g., Roelof, 1989) into the ionosphere where they connect to the “Region 1” currents driven by magnetospheric processes at higher-latitudes. The mutual closure of these currents in the ionosphere occurs across the electrojets (Baumjohann, 1982), the most intense electrical currents in the ionosphere. It is in these auroral regions where strong Joule heating and momentum transfer between the ions and neutrals occur, stirring up the thermosphere. Changes in the high-latitude neutral temperature and winds are transmitted to lower latitudes through non-linear, coupled, dynamical processes, causing global-scale variations in neutral temperature, winds and composition (Li et al., 2019). This alters global ionospheric plasma densities through chemistry and plasma transport (e.g., Fuller-Rowell et al., 1994; Wang et al., 2010; Lu et al., 2016). Changes in plasma densities are also produced by energetic particle precipitation at different altitudes, depending on their energy spectra. All this results in complex ionospheric conductivity changes and electrodynamic feedback to the magnetosphere. Furthermore, Joule heating, soft electron precipitation, and plasma transport cause upwelling of ionospheric ions that enables mass coupling with the magnetosphere by providing the source for ion outflow. Therefore a systems-level understanding of geospace requires a self-consistent and cross-scale (global, meso-, and ion kinetic) treatment of the transition region.
It is the goal of this work, which extends aspects of Wiltberger et al. (2015) and Ukhorskiy et al. (2018), to better inform what aspects of the transition region transport are most critical for a global, self-consistent model to capture. To this end we utilize an approach combining MHD and test particle simulations wherein we create a test particle “mirror” of the plasma sheet, matching the spatiotemporal variations of density and temperature, whose evolution we can follow to gauge the importance of certain kinetic effects. This approach allows us to include the self-consistent formation and propagation of BBFs, within the framework of the MHD approximation, and the effects of drift physics and particle non-adiabaticity, within the framework of test particle trajectories. However, as these are test particles, there is no kinetic feedback to the global MHD electromagnetic fields. This caveat must be taken into account in the interpretation of these results. Nevertheless, our approach allows us to use very highly-resolved fluid models that produce mesoscale flow structures and to study their implications on ion transport and acceleration in the transition region.
With the appropriate caveats in mind, we will assess the importance of flow and particle characteristics to the transport of ions across the transition region. In particular we consider: flow characteristics like entropy-depletion and mesoscale structure; and particle characteristics like energy, and consequently energy-dependent drifts, and gyroradius. With the combined MHD and test particle approach we employ, we are able to mine simulation data to construct a database, exceeding a billion points, of instantaneous correlations between the inward radial transport of particle energy and properties of the ambient MHD flow. Given the importance of entropy, we find it critical to investigate the ability of our simulation to accurately reproduce the thermodynamic plasma properties of BBFs, which we verify by comparing with the THEMIS-based study of Runov et al. (2015). Next, by comparing identical test particle ensembles whose initial state is informed by MHD and are subsequently evolved with varying gyroradii, we are able to quantitatively assess the importance of non-adiabaticity and its implications to both the build-up and decay of the ring current.
This work is an extension of Ukhorskiy et al. (2018) but incorporates significant advances to the methodology. Ukhorskiy et al. (2018) seeded test particles into a single bubble and followed the evolution for
Having outlined the goals and limitations of our study, we now describe the plan for the remainder of the paper. In the next section, we provide an overview of the MHD (Section 2.1) and test particle (Section 2.2) simulations as well as the diagnostics (Section 2.3) we employ. Our main results are presented in Section 3 and include: a comparison of the thermodynamic properties of our modeled BBFs to observations (Section 3.1); a statistical study of the correlation between flow and particle properties to the transport and acceleration of test particle energy into the inner magnetosphere (Section 3.2); and a study of the effects of increasing non-adiabaticity relative to a guiding center ensemble (Section 3.3). Finally, we present a discussion of our results and their implications for future magnetospheric modeling in Section 4.
Our technical approach combines two simulation methods: GAMERA (Zhang et al., 2019; Sorathia et al., 2020), a global MHD model, is used to generate electromagnetic fields; and CHIMP (Sorathia et al., 2018), a test particle code, is used to calculate particle trajectories through the time-dependent MHD electromagnetic fields and weight the test particles to match a specified phase space density (PSD). In the remainder of this section we will describe in turn the details of the global magnetospheric simulation (Section 2.1), the test particle parameters and weighting (Section 2.2), and the diagnostics we will employ (Section 2.3). For convenience, however, we will provide a brief, high-level overview here. We drive the global magnetospheric simulation in an idealized configuration using pure southward interplanetary magnetic field (IMF), following a period of preconditioning. Within that global magnetospheric simulation we continuously seed new test particles in a thin arc on the nightside and weight them using the instantaneous density and temperature from the MHD simulation. In other words, we create a test particle “mirror” of the MHD flow moving through the nightside injection region. This is a mirror only within the injection region, upon moving inwards the test particles will evolve differently than the MHD flow they were created to mimic due to the kinetic equations of motion they are governed by. We seed test particles for a period of 1 h, beginning at T =−1 h and ending at T = 0 h, and continue to evolve those test particles that remain in the closed field region for an additional 1 h period, ending at T = + 1 h. Finally, we look at the instantaneous correlation between the transport of test particle energy into the inner magnetosphere and the properties of the ambient MHD flow. In particular, we focus on the importance of the characteristic lengthscale of the ambient magnetic field, assessing the multiscale flows of the transition region, and the deviation of the flux tube entropy from an averaged background value, i.e., buoyancy, to assess the role of bubbles.
A visualization of the combined model output half-way through the simulation is illustrated in Figure 1. It depicts both the residual, or non-dipolar, magnetic field calculated by GAMERA, defined as the northward component (BZ) with dipole contribution subtracted, and a sample of test particles with markers denoting the projection from their 3D position along the local magnetic field to the equator with the marker colored by energy and sized so that its diameter is proportional to the logarithm of the test particle’s weight. The thin nightside region where test particles are continuously seeded for T < 0 is marked in blue. The inset of Figure 1 shows a zoomed-in view of a BBF having recently moved through the test particle injection region; the test particles inside the BBF are higher energy and lower weight than those outside, reflecting, as expected, the hotter, less dense plasma inside the BBF.
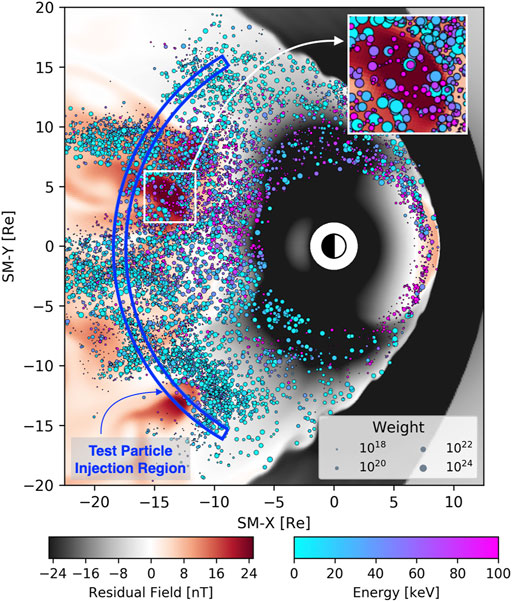
FIGURE 1. Simulation at a glance. Combined visualization of the MHD simulation and test particle data. Background color (bottom let color bar) denotes residual, i.e., non-dipolar, vertical magnetic field. Test particles are marked at the location of their field-line projection to the equatorial plane, colored by their energy (bottom right color bar), and denoted with a marker whose surface area is proportional to the logarithm of their weight. The region where test particles are seeded is marked in blue. Figure inset shows a close-up view of the test particle population in a typical BBF.
The first step in our model pipeline is the generation of electromagnetic fields and plasma moments using our global magnetosphere model GAMERA. The details of GAMERA’s core MHD numerics and its validation via a standard portfolio of MHD test problems (e.g., Stone et al., 2008) were presented in detail by Zhang et al. (2019) and its first magnetospheric application by Sorathia et al. (2020). Zhang et al. (2019) also showed the critical importance of algorithmic details beyond simply the size of grid cells. In particular, the use of high-order spatial reconstruction can dramatically improve the preservation of sharp structures compared to lower-order schemes on an otherwise identical spatial grid (see Zhang et al., 2019, Section 4). For typical MHD test problems they find that lower-order reconstruction (e.g. 2nd-order) requires 4–8× finer grid resolution as the higher-order (7th- or 8th-order) reconstruction used by GAMERA for the same effective resolving capability. Mapped to 3D, 4–8× the grid resolution becomes a factor of
As a first study of particle transport with GAMERA, we adopt a similar approach used in previous BBF studies with GAMERA’s predecessor LFM (Lyon et al., 2004). As in Wiltberger et al. (2015), we utilize an idealized magnetospheric configuration to generate an SMC-like period. Specifically, after a preconditioning phase of alternating northward and southward IMF, the IMF turns southward and remains so for the remainder of the simulation. The solar wind driving uses typical values: 5/cc density, 400 km/s velocity with only an SM-X component, and an IMF of 5 nT directed either northwards or southwards. Two hours after the final southward IMF turning, at which point steady reconnection has begun producing regular BBFs moving earthward, we begin injecting test particles whose properties are described below (Section 2.2). The inner boundary condition of the simulation is imposed at a spherical surface of 2RE via closing the field-aligned currents through a thin-shell ionosphere as described by Merkin and Lyon. (2010). In the idealized configuration we present here, we use a constant Pedersen conductance of ΣP = 10 S with no Hall conductance and an ionospheric grid of 1° × 1°. It is important to note that these are ideal MHD simulations without an explicit resistivity, although there is numerical resistivity that allows reconnection. While this can have an effect on the specific details of reconnection onset (e.g., Raeder et al., 2001), we do not expect this to affect the transport and acceleration of our test particles that are seeded earthward of the reconnection line.
GAMERA, like LFM before it, uses for its magnetospheric simulations a warped spherical grid, whose spherical axis is aligned with the SM-X axis. The grid encompasses a region extending sunward to 30RE and tailward to −350RE, and to 120RE radius in the YZ-plane. The warped grid is distorted to maximize resolution in the regions where it is most important, e.g. the bow shock, the magnetopause, and the near-Earth plasma sheet. This simulation was run using 192 × 192 × 256 cells in the radial, polar, and azimuthal directions and is comparable to the highest-resolution capability of LFM, known as “OCT” resolution, which has been used to study mesoscale plasma sheet flows before (Wiltberger et al., 2015; Merkin et al., 2019). In particular, the nominal resolution in the near-Earth plasma sheet is approximately 600 km.
2 h after the final southward turning, we begin injecting test particles continuously into an arc tailward of Earth (see Figure 1). The arc is of width ΔR = 1RE and centered on R = 18RE, extending azimuthally 8 h in MLT centered at midnight. We refer to the beginning of test particle injections as T = −1 h, and inject test particles continuously into the arc for a period of 1 h. At T = 0, the injections are ceased and the existing particles are evolved until T = + 1 h. Over the hour of continuous injection we create 20M test particles, or
The numerical details of how test particle trajectories are calculated and how each test particle is weighted are described in detail in Sorathia et al. (2018) and more recent improvements to the interpolation of GAMERA electromagnetic fields by CHIMP in Sorathia et al. (2019). We, however, provide a brief overview here for convenience. For ion trajectories we advance the particle position using the Lorentz force and Boris integrator. For electrons or positrons, we use a mixed integrator alternating between a guiding center formulation, utilizing the conservation of the first invariant, and the Lorentz trajectory depending on the ratio of the particle gyroradius to local magnetic field lengthscale. When a test particle encounters a region where ϵ > 10–2, where ϵ is the ratio of particle gyroradius to magnetic field lengthscale (Sorathia et al., 2018, Eq. (3)), a random gyrophase is chosen and the test particle is subsequently evolved using the full Lorentz equations of motion. The test particle can be converted back to the guiding center approximation when ϵ < 10–2 by calculating an approximate guiding center location, which we do in the manner of Snicker et al. (2010), and the first invariant at the guiding center location.
In the work we present here we consider the evolution of an ensemble of test particles with identical initial conditions, but evolved as either positrons, i. e a guiding center ring current (GCRC), H+ (PRC), or heavy ions (HRC), specifically O+. This will allow us investigate separately the adiabatic interaction of particles with MHD-produced flow structures (GCRC), as well as the effects of increasing non-adiabaticity (PRC and HRC). Note that while we use the terminology RC for ring current because our ultimate interest is the role of these particles in building the ring current, our investigation includes their behavior throughout the nightside near-Earth plasma sheet. Data Sets S1-S3 contain a random sample of test particle trajectories for GCRC, PRC, and HRC respectively.
Given a collection of test particles and their trajectories, we assign each particle a weight such that the overall collection reproduces a desired initial condition for the PSD. Here the test particle weights represent the number of real particles each test particle acts as a proxy for, i.e. macroparticles. Note, however the weighting does not alter the underlying statistics of the test particles themselves it merely assigns weights to each pre-existing test particle. The flexibility of this approach is that if we have a collection of test particles that properly samples the phase space then we can easily change the choice of PSD initial condition, and thus the weighting, without recalculating any test particle trajectories.
For this study our PSD initial condition is directly informed by the MHD flow properties. Test particles are weighted using a κ-distribution with the density and temperature of the MHD flow in the location and time of the test particles injection. Here we use κ = 6 consistent with ion observations for this region of the near-Earth tail (Runov et al., 2015). We note that we use the same κ value across all species so as to focus on the role of non-adiabaticity on an otherwise identical ensemble, although we do not expect sensitivity to the choice of κ (Ukhorskiy et al., 2018).
Weighting is done on a 4D discretized phase space spanning cylindrical radius, MLT, pitch angle, and energy. The phase space is reduced by one in each of its spatial and momentum components: phase space densities are averaged over entire flux tubes, corresponding to the radius and MLT of their equatorial crossing; and over gyrophase. In this work we use a phase space, Γ(R, ϕ, αEQ, K), spanning [3, 22] RE, [0, 2π], [0, π], and [0.1, 500] keV respectively. The phase space grid is discretized linearly in the angular variables with Nϕ = 72 and Nα = 36 and logarithmically in radius and energy with NR = 30 and NK = 30. Newly-seeded test particles are weighted collectively at a cadence of δT = 5 s. We ensure that the resolution of the phase space and number of test particles are appropriate by verifying the approximate invariance of the results when changing the discretization or number of test particles used for weighting.
While there are a number of technical details involved in this process, the result is merely to constrain the test particles in the injection region (Figure 1, blue arc) so that they reproduce, up to the phase space discretization chosen, the distribution corresponding to a κ-distribution using the MHD moments. Effectively we create a test particle mirror of the MHD flow passing through the test particle injection region. This is similar to Sorathia et al. (2018), which used three discrete wedge-shaped injection regions on the nightside but with much finer spatial granularity.
Our goal in this study is to connect properties of the background MHD flow, e.g., deviations of integrated flux tube entropy from the background, to metrics quantifying the transport and acceleration of test particles within those flow regions, e.g., the velocity of the equatorial crossing of a test particle. Here we will define the metrics we use for the background MHD flow and the test particles. Our primary interest is the “transition region,” which for our purposes we define in an expansive way to encompass the region where fast flows and particle drift physics are both non-negligible. We define a “Data Collection Region”, marked in Figure 2, as −22.5 ≤ X ≤ −8 and |Y| ≤ 15 from which we will take statistics.
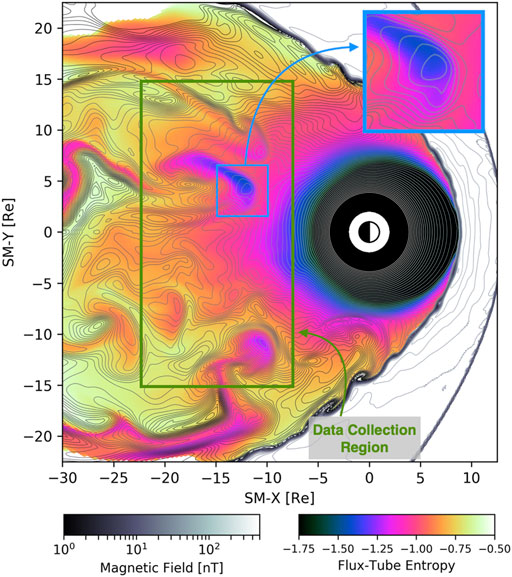
FIGURE 2. MHD flow structures in the transition region. Snapshot of the simulation at the same time as Figure 1 showing the integrated flux tube entropy (logarithmic scale) in the equatorial plane and contours of constant total magnetic field strength. Green boundary depicts the domain from which we compile statistics of transport and acceleration in the transition region. Figure inset shows a typical “magnetic island” field structure exhibited by BBFs in MHD.
Interchange instability, due to flux tube entropy imbalance, has long been believed to play an important role in the earthward transport of plasma (see recent review by Toffoletto, 2020, and references therein). To identify interchange unstable regions, we use the entropy function (e.g. Birn et al., 2009):
where the integral is taken along the flux tube that contains the cylindrical coorinate (R, ϕ, z = 0). The quantity
Interchange instability is governed by deviation of the local entropy from the background (Rosenbluth and Longmire, 1957), which we can quantify using what we henceforth refer to as the “relative buoyancy”,
where
with Δt = 10 min. The timescale for averaging is chosen to lie between the timescales characterizing the propagation of individual bubbles and those governing global reconfiguration of the tail during the SMC-like event we simulate. Eq. (2), the relative buoyancy, quantifies the fractional deviation of the local entropy from the background. Negative relative buoyancy corresponds to regions that will tend to move earthwards, i.e. bubbles, and positive relative buoyancy regions will tend to move outward, i.e. blobs.
An example of the relative buoyancy,
Previous work (Gabrielse et al., 2017; Ukhorskiy et al., 2017; Sorathia et al., 2018; Ukhorskiy et al., 2018) has identified the role of mesoscale magnetic structures within BBFs to induce “trapping” of sufficiently energetic particles within closed contours of constant magnetic field strength. An example of these “magnetic islands” can be seen in the inset of Figure 2. To identify these types of mesoscale structures in the background flow, we define the quantity
where the denominator is taken to be the L2 norm of the Jacobian, restricted to equatorial derivatives, of the magnetic field.
Turning now to the test particles, we seek to investigate the correlation of particle transport and acceleration to properties of the background flow. To this end we consider the motion of each test particle’s equatorial crossing point through the nominal transition region highlighted in Figure 2. For this exercise we focus on GCRC as our interest is really in the motion of the equatorial crossing point of the particle guiding center, and using GCRC allows us to remove the additional noise that would be introduced by gyromotion. We accomplish this by projecting each test particle to the equator at a temporal cadence of ΔT = 5 s, with
which we restrict to those for which (XEQ, YEQ) lie in our nominal transition region. A randomly selected subset of these is included in Data Set S4.
The collection defined this way, i.e. tuples of the form given by Eq. (5) for which (XEQ, YEQ) is in the nominal transition region, creates a data set of over a billion points. Our data analysis benefited from the use of fast-histogram2 as intrinsic numpy routines were often insufficient to handle data at this scale. From this data set we construct statistical populations defined by a membership criteria and weighting of each data point. These statistical populations are:
• Population (
• Transport (
• Acceleration (
With these definitions,
In the sections that follow we use weighted test particles to study particle transport and acceleration due to the global and mesoscale flow, as captured by our combined MHD and test particle simulations. In our model, test particles are weighted based on the density, temperature, and flux tube volume in the MHD simulation at the location and time of their injection. Therefore, prior to our discussion of particle transport, we show that the statistical properties of the BBFs, particularly those related to the quantities used in particle weighting, produced by our model are in agreement with observations (Section 3.1). Having established this, we next turn to an investigation of energetic, but adiabatic, particle transport through the transition region (Section 3.2). Here we show the critical role of energetic particle drifts and entropy-depleted bubbles. Given the importance of the latter, we also discuss the sensitivity of our results to numerical resolution. Finally, we go beyond the guiding center approximation and quantify the effects of increasing particle gyroradius (Section 3.3). We find that non-adiabaticity results in significant and qualitative differences in particle behavior for heavier ions, and that even for H+ there are non-negligible effects.
In the context of a study of BBFs using GAMERA’s predecessor, the LFM, and a similar global magnetosphere simulation to ours Wiltberger et al. (2015) used simulation data to conduct a superposed epoch analysis mirroring the Geotail study of Ohtani et al. (2004). Wiltberger et al. (2015) found that the model was able to qualitatively reproduce statistical profiles of velocity, magnetic field, and density within the BBFs. Before moving on to an analysis of particle transport and acceleration, we pause here to expand upon the validation efforts of Wiltberger et al. (2015) in a similar statistical manner.
Runov et al. (2015) have conducted a statistical study, using THEMIS data over a 2 year period, quantifying the relative thermodynamic and magnetic properties of intruding regions, or dipolarizing flux bundles (DFBs), to the background flow. They identify intruding regions using a criteria informed by large dBz/dt and maximum Bz, indicating a sharp magnetic front, small Bx to exclude events when the spacecraft are in the lobes, and decreasing number density, to help select for depleted flux tubes. These criteria select approximately 300 events which are separated based into 4 groups based on their equatorial radius: R < 9.5, R ∈ [9.5, 12], R ∈ [12, 15.5], and R ∈ [15.5, 25]. Within each of these radial groups they calculate the ratio of density, temperature, and vertical magnetic field between the intruding to background populations. Their results (see Runov et al., 2015, Table 1) are reproduced here in Table 1 under the “DATA” columns, and demonstrate clear statistical relationships that are observed in nature.
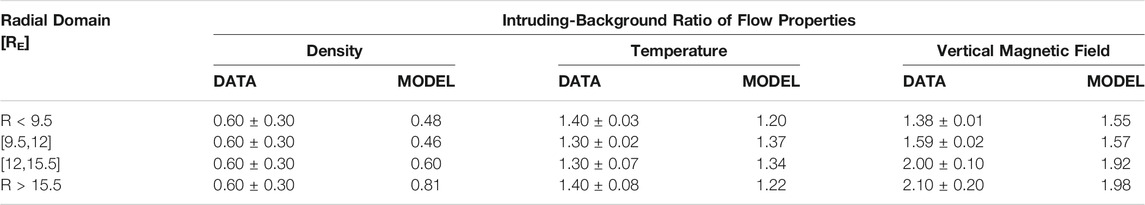
TABLE 1. Data-model comparison of BBF statistics. Shown are the results of a statistical study (DATA; Runov et al., 2015) looking at the relative density, temperature and magnetic field strength of BBFs to the background plasma. We construct analogous, although not identical, statistics (MODEL) from our simulation to compare against.
In this paper, our approach to model validation is to consider data-model comparison as a question of whether the model can reproduce observed statistical relationships. This statistical approach helps alleviate, but not eliminate, the difficulties associated with comparing in situ measurements, characterized by low spatial density over a long time duration, with high-resolution models, featuring high spatial density over a very limited temporal duration. Runov et al. (2015) use 300 measurements collected over 2 years, whereas we (as described below) can generate millions, or even billions when including test particles, of measurements over only 2 hours of, in this case, synthetic southward IMF driving. Care must be taken in how we interpret comparisons of a population with sparse sampling of a large event space to dense sampling of a very limited event space. With these caveats in mind, we return to the data from our simulation.
To construct our statistics, we calculate flux tube entropy throughout the nominal transition region defined in Section 2.3 at a cadence of 5 s. We identify the intruding population using a criteria defined by the relative buoyancy and density depletion, although we return to the significance of the latter criterion shortly. The background population is defined by
With the criteria as defined above we generate approximately 107 total data points, of which
The quantities we have considered in our data-model comparison are of direct relevance to how we weight test particles: the thermodynamic quantities directly inform the κ-distribution function used as an initial condition of the PSD; and the magnetic field, via the flux tube volume, is included in the phase space volume element. Beyond their importance to the initial configuration of the test particles, we expect these flow characteristics to shape their subsequent development. Hotter flows will have a higher fraction of their energy density carried by particles whose energy-dependent drifts, i.e. gradient and curvature, are comparable to the bulk E × B flow (see e.g., Sorathia et al., 2017, Figure 12). More strongly magnetized flows may have lower flux tube volumes and possibly lower flux tube entropy,
The first particle study we consider is the transport of particle energy in the adiabatic limit. To this end we use positrons, which we refer to as “GCRC” for guiding center ring current, whose gyro- and bounce-frequencies are much higher than the MHD frequencies. An animation of the combined MHD and test particle simulation is shown in Supplementary Video S2 in the same format as Figure 1. In Figure 3 we show the evolution of energy content contained within various equatorial shells. The energy content within a shell of (cylindrical) radius R is simply ∑wpKp where the sum is taken over all test particles whose equatorial projection is within the given radius. The shaded region in Figure 3 denotes the period in which new test particles are being continuously created (T < 0), whereas for T > 0 only the existing test particles within the domain are evolved. For the outer radial shells, R > 8, there is a drop off between the maximum energy content shortly after T = 0 to the energy content at the end of the simulation. This is due to the loss, without replacement, of particles on open drift orbits. Inside of R = 8 the energy content increases during the period of active injection and is largely flat afterwards as particles that penetrate that far reach closed drift orbits and remain trapped. This highlights how sensitive the energy content of the inner magnetosphere is to the penetration depth of the injected particles.
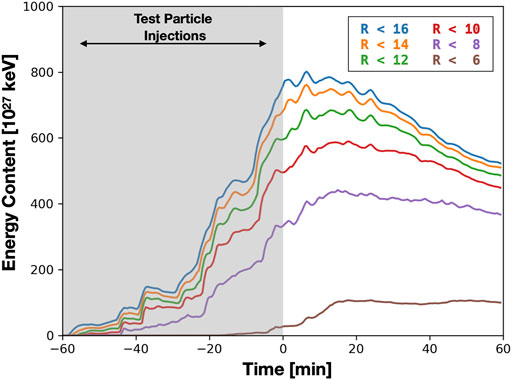
FIGURE 3. Total energy content from injected guiding center test particles (GCRC) as a function of time for different (cylindrical) radial shells based on equatorial projection of 3D test particle location. Shaded region denotes period where test particles are being actively injected into the nightside arc at R ≈ 18.
Next we turn to one of our core goals in this study, namely the identification of the ambient flow properties that lead to the transport and acceleration of particle energy into the inner magnetosphere, i.e. the formation of the ring current. Using the method we describe in Section 2.3 we construct
Each of the statistical samples we defined in Section 2.3 are a collection of tuples of the form of Eq. (5), defined via a sample-dependent membership criteria and weight. We define the contribution of a quantity, Q in the range Q0 + ΔQ, as the weighted-sum of the elements that satisfy both the sample membership criteria and Q ∈ [Q0, Q0 + ΔQ]. In other words, the contribution of a given relative buoyancy is: to population (
Absent any correlation between the particle or flow characteristic to transport, the population contribution and transport contribution would be the same. Regions for which the contribution to transport/acceleration is higher than the contribution to the population represents a characteristic favorable to the delivery of energy to the inner magnetosphere, e.g., we find that particles with energies above 10 keV “punch above their weight” and contribute more to transport and acceleration than their fraction of the population. Figure 4 compares the relative contribution of particles of different energies (Figure 4A) and in different ambient flows (Figures 4B,C) to the overall population versus transport and acceleration. Before proceeding to the more fine-grained discussion of the individual characteristics, we note that contribution to transport, specifically inward radial transport from the wpKΔREQ weighting, correlates almost identically with that of acceleration. This is perhaps unsurprising as the transition region bridges the stretched tail and dipolar inner magnetosphere and therefore adiabatic transport (for GCRC) across it would lead to both betatron and Fermi acceleration via conservation of the first and second adiabatic invariant.
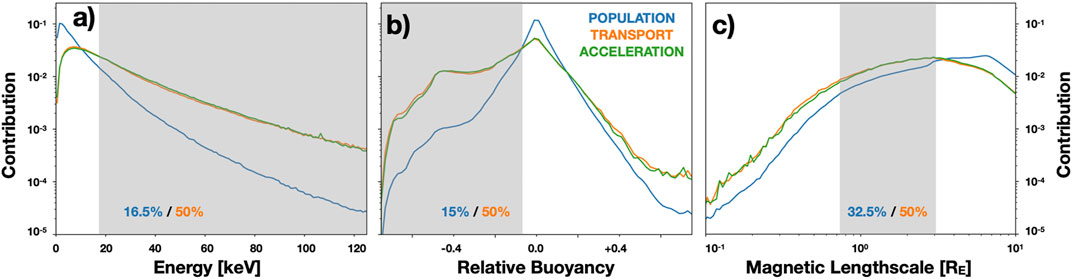
FIGURE 4. Efficiency of transport and acceleration in the transition region. Here we compare for various particle and flow properties their fraction of: the total population, the total inward energy transport, and the total energization as defined in Section 2.3. Regions where the contribution of a quantity to transport/acceleration is greater than population are “efficient” for ring current buildup. Shown are particle energy (A), relative buoyancy Eq. (2); (B), and magnetic lengthscale Eq. (4); (C). In each panel the shaded region is chosen to highlight approximately 50% of the total energy transport.
In each panel of Figure 4, the shaded region corresponds to a contribution of 50% of the total transport of energy through the transition region. The overlaid percentages represent the contribution within the shaded region to the population and the 50% contribution to transport. We can summarize the results of Figure 4 as follows: ambient flows that exhibit depleted entropy or spatial mesoscale structure of the magnetic field are particularly effective at delivering particle energy into the inner magnetosphere; similarly, particles with energies above
From Figure 4a, particles with K > 20 keV account for half the energy transport in the statistical sample despite making up only
respectively, and define
the energy for which the two velocities are equal (see Sorathia et al., 2017, Figure 12). For typical values inferred from the MHD simulation, E = 2.5 mV/m and L∇B = 2RE, K∇ ∼ 25 keV. This is an estimate of the energy at which gradient drift magnitude would exceed the bulk flow, it would be non-negligible for lower energies.
Using the statistics we have derived from this simulation, we can more quantitatively assess the role of particles whose trajectories deviate appreciably from the bulk flow. We find that the fraction of transport that occurs for V∇/VEB > 0.5 and V∇/VEB > 1 is 48 and 30% respectively. In other words, we find that the majority of transport through the transition region is via particles with non-negligible energy-dependent drift speed. Ukhorskiy et al. (2018) show that for particles with K > 10 keV, comparable to where we find the contribution to transport exceeds population (Figure 4A), magnetic gradient trapping is necessary to confine particles within azimuthally localized flow long enough to reach the inner magnetosphere. While we do not try to distinguish magnetic gradient trapping in individual cases of our billion data points, the importance of K > 10 keV particles (Figure 4A) and L∇B < 3RE (Figure 4C) strongly suggests the potential importance of this mechanism.
Focusing now on Figure 4B we see the critical role of entropy in particle transport. Low-entropy “bubbles”, which we define here conservatively as
Finally, we consider the importance of the characteristic lengthscale of the ambient magnetic field as shown in Figure 4C. Here we find that while regions with L∇B < 3RE are efficient, the effect beyond their contribution to the population is not as significant as that of particle energy or depleted entropy. From Figure 2 (inset) we see that regions of smaller magnetic lengthscale may correspond to: the interior of the depleted entropy bubble, which is particularly efficient at transport; the region ahead of the bubble, which is somewhat efficient; or the regions azimuthally adjacent to the flow channel for which we expect, if anything, outwards flow from the vorticity at the edges of the flow channel. We can instead consider the magnetic lengthscale statistics differently and look at the characteristic lengthscales of deeply depleted bubbles,
with Pr (A∣B) denoting the conditional probability of A given B. Supplementary Figure S3 shows the probability distribution of magnetic lengthscales for all bubbles,
Taken together, we find: bubbles are very efficient at transport, bubbles are mesoscale, and that bubbles transport particles whose energy-dependent drifts are comparable to the ambient flow. Given the critical role of buoyancy in transporting particle energy across the transition region, and consequently building the ring current, understanding the role of numerical resolution in producing these bubbles is vital. To this end we show in Figure 5 a resolution study of the buoyancy statistics for simulations with resolutions 2× coarser (QUAD) and 2× finer (HEX) than the simulation we consider in this paper (OCT). An analogous comparison of L∇B is shown in Supplementary Figure S4.
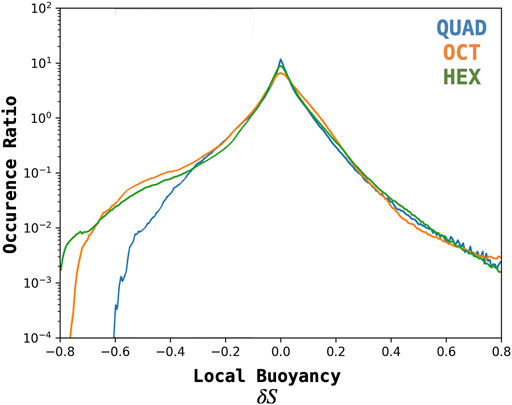
FIGURE 5. Grid resolution study of the statistics of bubble depletion during SMC-like activity. Shown are statistics calculated using a grid 2× coarser (QUAD) and 2× finer (HEX) than the grid resolution we use elsewhere in this paper (OCT).
From our resolution study, we find that the lowest resolution differs most notably from the two higher resolutions, and that the two higher resolution simulations are largely similar for all but the most depleted bubbles,
In the preceding section we considered the transport and acceleration of positrons (GCRC) as a proxy for adiabatic ion processes. Here we broaden our experiment to assess the role of non-adiabatic effects by considering more realistic ion masses. To this end we consider the exact same ensemble of created test particles, defined by their location and time of seeding, energy, and pitch angle and evolve them with a different mass. In addition to positrons (GCRC), we also include H+ (PRC), and heavier O+ ions (HRC). While the GCRC test particles are evolved using a hybrid guiding-center and Lorentz trajectory approach, for PRC and HRC we solely use the Lorentz trajectories. The formulation of our experiment is solely to explore the role of non-adiabaticity in the evolution of an otherwise identical ensemble of particles. It does not attempt to account for differences in plasma sheet ion properties due to different source populations, e.g. ionospheric O+ versus solar wind H+. Animations of the MHD and test particle simulations for PRC and HRC are shown in Supplementary Video S2 and S3 in the same format as Figure 1.
A comparison of the energy content at different penetration depths across the test particle ensembles of varying mass is shown in Figure 6, where the shaded region denotes the period of active test particle seeding. While the bulk energization and spatial distribution of H+ (PRC) evolve relatively similarly to positrons (GCRC), there is a qualitative change in behavior when going to heavier ions (HRC). We find that HRC is more energetic at further distances and during the period of active seeding, with the deviation between HRC and GCRC/PRC diminishing closer to Earth and rapidly in time after the source of newly-injected particles is shut off.
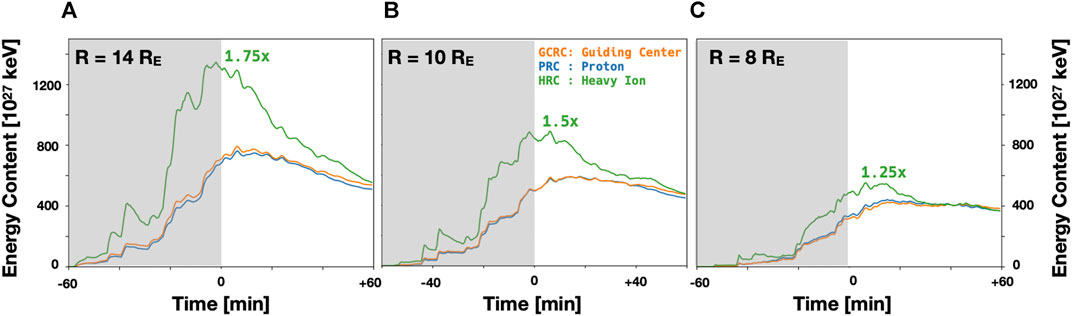
FIGURE 6. Comparison of total energy content for identical test particle ensembles evolved with increasing gyroradius within equatorial radius R = 14 (A), R = 10 (B), and R = 8 (C). Shaded region denotes period where test particles are being actively injected into the nightside arc at R ≈ 18. Overlaid text is the approximate ratio of energy content at peak between HRC and PRC.
The overlaid text on each panel of Figure 6 is approximately the ratio of energy content at peak between HRC and PRC, which we find to be: 1.75× (14RE), 1.5× (10RE), 1.25× (8RE). Recall that in this comparison we have evolved the same ensemble of test particles using varying mass, so the excess energy content of HRC is a proxy for the effects of non-adiabaticity in these particles interactions with the same flow structures. While not a precise analog, we can use the O+ enhancement factor introduced by Moebius et al. (1987) and studied as a function of downtail distance using Geotail statistics by Nosé et al. (2000). The O+ enhancement factor, EO+ = RO+/RH+, where RX is the ratio of the differential flux os species X prior to and following substorm onset. By comparing the ratio of ratios, the enhancement factor helps control for ambient differences in the properties of different ion species, e.g., due to their different sources, and makes it a good metric for comparison with our simulation that neglects these potential differences. In their study, Nosé et al. (2000) find EO+ to be, averaging over ± 1RE: EO+ = 1.77 (14RE), EO+ = 1.35 (12RE), and EO+ = 1.26 (10RE). This is very much in line with the results of our simulation, although we do find that the comparison of HRC to PRC energy content decreases more slowly towards Earth than these statistics. We suspect this is due to differences in ambient conditions; the ratio of HRC to PRC energy content in the simulation is taken after several hours of southward IMF as compared to the Geotail statistics of local dipolarizations over 3 years. In particular it is likely that our simulation has a less stretched magnetotail configuration after several hours of SMC-like activity as compared to the broader statistical sample and this in turn would affect where and how strongly O+ ions are scattered.
As can be seen in Figure 6, the significant excess energy content of HRC that penetrates inside 14RE is largely absent from the region inside 8RE, i.e. the majority of this excess energy is lost prior to reaching the inner magnetosphere. Supplementary Video S2 through Supplementary Video S4 show the evolution of GCRC, PRC, and HRC respectively and Supplementary Figure S5 shows a comparison of the state of GCRC, PRC, and HRC at T = 0. Most evident in these comparisons is the strong duskward skew of the highly non-adiabatic HRC. To make this more quantitative we show in Figure 7 a comparison of the MLT distribution of energy inside R = 12RE at T = 0 for the three ensembles. There is a broad similarity across all the ensembles: a dominant peak near midnight sharply falling off towards dawn and more gradually towards dusk, and a smaller secondary peak in the post-noon sector, approximately 1400 MLT. However, we find an appreciably stronger duskward bias in HRC as compared to GCRC/PRC. The primary pressure peak of HRC is shifted several hours of MLT duskward with a broader pre-midnight extension with the secondary pressure peak extending across the dayside into the pre-noon sector. The exaggerated dawn-dusk asymmetry due to non-adiabaticity is consistent with observational statistics of plasma sheet O+ (e.g., Ohtani et al., 2011).
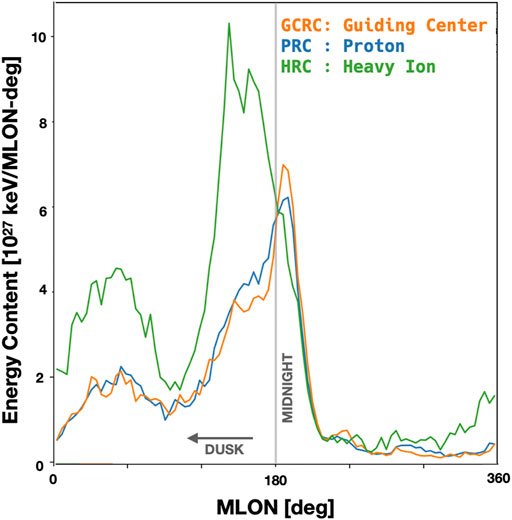
FIGURE 7. Comparison of the magnetic longitude distribution of total energy content, within R = 12 at T = 0, for identical test particle ensembles evolved with increasing gyroradius.
The duskward bias of HRC evident in Figure 7 provides a clue to the ultimate fate of the HRC energy content inside R = 14RE (Figure 6A) that is largely missing at R = 8RE (Figure 6C). Test particles are evolved until the end of the simulation or until the test particle leaves the simulation domain, in this case a spherical annulus spanning 2–30 RE. When the test particles exit the domain, they are marked out of bounds at the location they intersected the boundary. Therefore we can identify lost energy content and distinguish its manner of exit either through precipitation, for particles lost to the inner boundary, or the dusk or dawn flank based on the sign of the SM–Y coordinate. For PRC, we find the lost energy content is distributed 20%/70%/10% to precipitation, dusk, and dawn flank respectively. For HRC, we find approximately 4× more lost energy content compared to PRC and the distribution to be approximately 10%/85%/5% to precipitation, dusk, and dawn. In other words, HRC provides a great deal of non-adiabatic energy relative to PRC which reside primarily on open drift shells that lead to significant magnetopause losses on the dusk flanks. This excess energy content is rapidly lost when the source population is extinguished.
The non-adiabatic effects we find in HRC result in a dramatic difference when compared to GCRC. Additionally, despite the fact that Figure 6 shows that GCRC and PRC have very similar overall energy content and spatial distribution, we find that there are subtle but important differences in how that energy density is distributed in momentum space, i.e. pitch angle and energy spectrum.
That there should be some degree of non-adiabaticity is perhaps unsurprising as both data (e.g., Runov et al., 2017) and particle simulations (e.g., Birn et al., 2013; Ukhorskiy et al., 2018) have shown that ions at dipolarization fronts are only quasi-adiabatic. Here we find that for the energy content inside of 8RE at the end of the simulation: the energy-weighted mean equatorial pitch angle,
For trapped ring current ions it is generally believed that charge exchange (CX) is the dominant loss mechanism for typical magnetospheric conditions (e.g., Jordanova, 2020, and references therein). The CX lifetime can be estimated as,
where
Both the equatorial anisotropy and hotter distribution will tend to increase τCX. Here we make a simple estimate of the combined effect using the energy-weighted mean pitch angle and energy as properties of a fiducial particle at L = 8 combined with: the geocorona density at L = 8 from Østgaard et al. (2003), and the approximation (Smith and Bewtra, 1976),
where τEQ is the lifetime of an equatorial particle and λM is the actual mirror latitude. This yields τPRC/τGCRC ≈ 1.6, an appreciable change in the typical particle lifetime, which has important implications for longer-term ring current decay in the aftermath of active periods. This only serves to further complicate the already difficult modeling of ring current decay due to the sensitivity to different geocorona density models (Ilie et al., 2013).
We have presented results of tracing a large number of test particles (20 M per species) in a high resolution MHD simulation of an idealized SMC-like period (Section 2.1), where particles were initialized to “mirror” the bulk properties of the MHD plasma in the plasma sheet. We continuously seed test particles in a thin (ΔR = 1RE) nightside arc at R ≈ 18 RE and weight those test particles using the density, temperature, and flux tube volume calculated from the MHD flow at that time and location (Section 2.2). Due to the importance of the MHD flow quantities to the weighting of test particles we begin with a statistical validation exercise comparing the relative thermodynamics and magnetization of BBFs in our simulation to similar statistics derived from in situ data. We use the correlations between test particles and MHD flow properties to study the transport of particle energy through the transition region, where we use an expansive definition of the transition region to encompass the domain where both fast flows and particle drift physics are both non-negligible. These correlations generate a massive database, over a billion data points connecting particle energy transport, via the motion of the equatorial projection of a particle, and local flow properties, via the magnetic lengthscale and local buoyancy (Section 2.3). Finally, we consider the importance of non-adiabaticity by comparing the evolution, using increasing mass, of identical test particle ensembles, as defined by their initial configuration and weights. Our key results are summarized as follows:
• The mesoscale bursty bulk flows (BBFs) in our global MHD simulation yield thermodynamics, magnetization, and spatial scales (Table 1 and Supplementary Figure S3) that largely reproduce statistics from in situ THEMIS measurements (Nakamura et al., 2004; Runov et al., 2015). We further demonstrated that the transport-critical properties of the modelled BBFs are principally independent of the simulation resolution, as long as the simulation possesses sufficient resolving power (Figure 5 and Supplementary Figure S4).
• Mesoscale bubbles, or localized regions of depleted entropy, are critical to particle energy transport through the transition region and, for a significant fraction of the particles, the gradient and curvature drifts are non-negligible.
• The effects of ion non-adiabaticity (Section 3.3), i.e. finite gyroradius, for heavy ions (O+) are consistent with in situ measurements of relative enhancement (Nosé et al., 2000) and create qualitative differences in the bulk energization and spatial distribution (radial and MLT) of the heavy ion energy density. The overall energization and spatial distribution of H+ is largely similar to the adiabatic control run, however differences in the momentum space distribution, i.e. energy and pitch angle, have implications for recovery timescales that are non-negligible.
Although we find that MHD is able to create BBFs that reproduce observed statistical properties, this is only at sufficiently high resolution and using a low-dissipation algorithm. The importance of proper resolution to building the ring current is likely even higher than suggested in Section 3.2, where we estimate 20% of the energy transport would be lost in the lower versus higher resolution simulation by considering the energy transport for
We also have found here that adiabatic particle dynamics is insufficient to capture the building, and subsequent decay, of the ring current. For H+ non-adiabaticity plays a minor role in the bulk energization and spatial distribution of particle energy in the inner magnetosphere, but even relatively small alterations to the momentum space distribution can have important implications. Non-adiabaticity leads to a more anisotropic distribution, with perpendicular bias, which can provide free energy to the wave populations of the inner magnetosphere, and a harder energy spectrum. Taken together, the more equatorial and higher energy distribution will decay more slowly due to charge exchange (Section 3.3).
More dramatic, although not unexpected (e.g., Moebius et al., 1987; Nosé et al., 2000; Delcourt et al., 1997; Keika et al., 2013; Bingham et al., 2020) is the non-adiabaticity exhibited by O+. Our results show that O+ non-adiabaticity creates an excess energy density, exceeding 1.5× the adiabatic energy density for R > 10 RE (Figure 6), whose contribution to the ring current is qualitatively different than H+. For O+ versus H+ we find: shallower penetration depth, greater duskward-biased asymmetry, and a rapid depletion of the excess when the source in the plasma sheet is shut off. The inclusion of O+ in ring current composition is known to affect recovery timescales via charge exchange (e.g., Hamilton et al., 1988; Ilie et al., 2013; Jordanova, 2020), due to the disparate collision cross-sections and their dependence on energy. We see here that recovery timescales via magnetopause losses will also be affected by O+ composition due to non-adiabaticity. In their review, Keika et al. (2013) discuss possible mechanisms to explain the stronger O+ energization as compared to H+. These include: direct finite gyroradius particle processes, e.g. Speiser orbits or interactions with transient and localized electric fields, which will result in preferential duskward deflection; resonant interaction with inner magnetospheric waves; and differences in the underlying source population. Of these, our simulations only include the first but produce O+ enhancement factors with similar radial dependence as observed (Nosé et al., 2000), highlighting the importance of non-adiabatic interactions with the background flow. Given the importance of O+ energy density in the ring current during disturbed geomagnetic conditions (Nosé et al., 2005), modeling these non-adiabatic effects is crucial.
In the simulation presented here we did not include ring current feedback on the global magnetosphere simulation. For the relatively undisturbed magnetospheric configuration we have considered here this omission is likely acceptable. However, expanding this type of study to more disturbed periods, such as storms, will require at least coupling to an inner magnetosphere model. Even so, our work shows that models coupling global MHD magnetosphere and ring current models, while the current state of the art for simulating typical geospace timescales, are insufficient in the transition region, where both fast flows, excluded from typical inner magnetosphere models, and energy-dependent drifts, missing from MHD, are important. The results of this work stress the importance of comprehensive modeling of ion transport across the transition region which requires: producing numerically robust mesoscale bubbles with appropriate entropy depletion; resolving energetic particle interactions with the sharp boundaries and internal magnetic structure of these mesoscale bubbles; and including the effects of non-adiabatic ion particle dynamics, particularly for heavier ion species. In other words, to properly model the buildup of the H+ ring current in the inner magnetosphere, a model must account for both fast flows and energy-dependent drifts in the transition region as the transport processes operate more effectively on the higher-energy tail of the thermal distribution. Further, for heavier ions, e.g. O+, including non-adiabatic effects is necessary as they qualitatively change the character of the contribution, in the magnitude and distribution of energy density, to the ring current.
The datasets presented in this study can be found in online repositories. The names of the repository/repositories and accession number(s) can be found in the article/Supplementary Material. Supporting information (Movies S1–S4 and Datasets S1–S4) are archived and available online (via https://doi.org/10.5281/zenodo.5542601). In addition, raw simulation data are preserved on the Cheyenne supercomputer and can be made available upon request.
All authors listed have made a substantial, direct, and intellectual contribution to the work and approved it for publication.
This work was supported by NASA grants 80NSSC19K0241, 80NSSC20K1833, 80NSSC17K0679, NNX16AG73G, NNX17AI54G, and 80NSSC19K0071; the Van Allen Probes contract NNN06AA01C and by the NASA DRIVE Science Center for Geospace Storms (CGS) under grant 80NSSC20K0601.
The authors declare that the research was conducted in the absence of any commercial or financial relationships that could be construed as a potential conflict of interest.
All claims expressed in this article are solely those of the authors and do not necessarily represent those of their affiliated organizations, or those of the publisher, the editors and the reviewers. Any product that may be evaluated in this article, or claim that may be made by its manufacturer, is not guaranteed or endorsed by the publisher.
We would like to acknowledge the use of computational resources (doi:10.5065/D6RX99HX) at the NCAR-Wyoming Supercomputing Center provided by the National Science Foundation and the State of Wyoming and supported by NCAR’s Computational and Information Systems Laboratory.
The Supplementary Material for this article can be found online at: https://www.frontiersin.org/articles/10.3389/fspas.2021.761875/full#supplementary-material
1See Sitnov et al. (2019) for a more comprehensive review.
2https://github.com/astrofrog/fast-histogram.
Angelopoulos, V., Baumjohann, W., Kennel, C. F., Coroniti, F. V., Kivelson, M. G., Pellat, R., et al. (1992). Bursty Bulk Flows in the Inner central Plasma Sheet. J. Geophys. Res. 97, 4027–4039. doi:10.1029/91ja02701
Angelopoulos, V., Kennel, C. F., Coroniti, F. V., Pellat, R., Kivelson, M. G., Walker, R. J., et al. (1994). Statistical Characteristics of Bursty Bulk Flow Events. J. Geophys. Res. 99, 21257–21280. doi:10.1029/94ja01263
Baumjohann, W. (1982). Ionospheric and Field-Aligned Current Systems in the Auroral Zone: a Concise Review. Adv. Space Res. 2, 55–62. Proceedings of the Topical Meeting of the COSPAR Interdisciplinary Scientific Commission C of the COSPAR Twenty-fourth Plenary Meeting. doi:10.1016/0273-1177(82)90363-5
Baumjohann, W., Paschmann, G., and Lühr, H. (1990). Characteristics of High-Speed Ion Flows in the Plasma Sheet. J. Geophys. Res. 95 (1978–2012), 3801–3809. doi:10.1029/ja095ia04p03801
Bingham, S. T., Nikoukar, R., Cohen, I. J., Mauk, B. H., Turner, D. L., Mitchell, D. G., et al. (2020). Evidence for Non-adiabatic Oxygen Energization in the Near-Earth Magnetotail from MMS. Geophys. Res. Lett. 20. doi:10.1029/2020JA028144
Birn, J., Hesse, M., Nakamura, R., and Zaharia, S. (2013). Particle Acceleration in Dipolarization Events. J. Geophys. Res. Space Phys. 118, 1960–1971. doi:10.1002/jgra.50132
Birn, J., Hesse, M., Schindler, K., and Zaharia, S. (2009). Role of Entropy in Magnetotail Dynamics. J. Geophys. Res. 114, n/a. doi:10.1029/2008ja014015
Birn, J., Nakamura, R., Panov, E. V., and Hesse, M. (2011). Bursty Bulk Flows and Dipolarization in MHD Simulations of Magnetotail Reconnection. J. Geophys. Res. 116, a–n. doi:10.1029/2010ja016083
Chaston, C. C., Bonnell, J. W., and Salem, C. (2014). Heating of the Plasma Sheet by Broadband Electromagnetic Waves. Geophys. Res. Lett. 41, 8185–8192. doi:10.1002/2014gl062116
Cheng, L., Lin, Y., Perez, J. D., Johnson, J. R., and Wang, X. (2020). Kinetic Alfvén Waves from Magnetotail to the Ionosphere in Global Hybrid Simulation Associated with Fast Flows. J. Geophys. Res. Space Phys. 125. doi:10.1029/2019ja027062
Cramer, W. D., Raeder, J., Toffoletto, F. R., Gilson, M., and Hu, B. (2017). Plasma Sheet Injections into the Inner Magnetosphere: Two-Way Coupled OpenGGCM-RCM Model Results. J. Geophys. Res. Space Phys. 122. doi:10.1002/2017ja024104
Delcourt, D. C., Sauvaud, J.-A., and Moore, T. E. (1997). Phase Bunching during Substorm Dipolarization. J. Geophys. Res. 102, 24313–24324. doi:10.1029/97ja02039
Dubyagin, S., Sergeev, V., Apatenkov, S., Angelopoulos, V., Runov, A., Nakamura, R., et al. (2011). Can Flow Bursts Penetrate into the Inner Magnetosphere?: FAST FLOW PENETRATION. Geophys. Res. Lett. 38. doi:10.1029/2011gl047016
Fuller-Rowell, T. J., Codrescu, M. V., Moffett, R. J., and Quegan, S. (1994). Response of the Thermosphere and Ionosphere to Geomagnetic Storms. J. Geophys. Res. 99, 3893–3914. doi:10.1029/93ja02015
Gabrielse, C., Angelopoulos, V., Harris, C., Artemyev, A., Kepko, L., and Runov, A. (2017). Extensive Electron Transport and Energization via Multiple, Localized Dipolarizing Flux Bundles. J. Geophys. Res. Space Phys. 122, 5059–5076. doi:10.1002/2017ja023981
Gabrielse, C., Harris, C., and Angelopoulos, V. (2016). The Role of Localized Inductive Electric fields in Electron Injections Around Dipolarizing Flux Bundles. Physics, Geology. 16 doi:10.1002/2016ja023061
Gabrielse, C., Spanswick, E., Artemyev, A., Nishimura, Y., Runov, A., Lyons, L., et al. (2019). Utilizing the Heliophysics/Geospace System Observatory to Understand Particle Injections: Their Scale Sizes and Propagation Directions. J. Geophys. Res. Space Phys. 124, 5584–5609. doi:10.1029/2018ja025588
Gkioulidou, M., Ohtani, S., Ukhorskiy, A. Y., Mitchell, D. G., Takahashi, K., Spence, H. E., et al. (2019). Low‐Energy (. J. Geophys. Res. Space Phys. 124, 405–419. doi:10.1029/2018ja025862
Gkioulidou, M., Ukhorskiy, A. Y., Mitchell, D. G., Sotirelis, T., Mauk, B. H., and Lanzerotti, L. J. (2014). The Role of Small-Scale Ion Injections in the Buildup of Earth's Ring Current Pressure: Van Allen Probes Observations of the 17 March 2013 Storm. J. Geophys. Res. Space Phys. 119, 7327–7342. doi:10.1002/2014ja020096
Hamilton, D. C., Gloeckler, G., Ipavich, F. M., Stüdemann, W., Wilken, B., and Kremser, G. (1988). Ring Current Development during the Great Geomagnetic Storm of February 1986. J. Geophys. Res. 93, 14343–14355. doi:10.1029/ja093ia12p14343
Ilie, R., Skoug, R. M., Funsten, H. O., Liemohn, M. W., Bailey, J. J., and Gruntman, M. (2013). The Impact of Geocoronal Density on Ring Current Development. J. Atmos. Solar-Terrestrial Phys. 99, 92–103. doi:10.1016/j.jastp.2012.03.010
Jaynes, A. N., Baker, D. N., Singer, H. J., Rodriguez, J. V., Loto'aniu, T. M., Ali, A. F., et al. (2015). Source and Seed Populations for Relativistic Electrons: Their Roles in Radiation belt Changes. J. Geophys. Res. Space Phys. 120, 7240–7254. doi:10.1002/2015ja021234
Jordanova, V. K. (2020). “Ring Current Decay,” in Ring Current Investigations. Editors V. K. Jordanova, R. Ilie, and M. W. Chen (Elsevier), 181–223. doi:10.1016/B978-0-12-815571-4.00006-8
Keesee, A. M., Buzulukova, N., Mouikis, C., and Scime, E. E. (2021). Mesoscale Structures in Earth's Magnetotail Observed Using Energetic Neutral Atom Imaging. Geophys. Res. Lett. 48. doi:10.1029/2020gl091467
Keika, K., Kistler, L. M., and Brandt, P. C. (2013). Energization of O+ Ions in the Earth's Inner Magnetosphere and the Effects on Ring Current Buildup: A Review of Previous Observations and Possible Mechanisms. J. Geophys. Res. Space Phys. 118, 4441–4464. doi:10.1002/jgra.50371
Kim, H.-S., Lee, D.-Y., Ohtani, S., Park, M.-Y., and Ahn, B.-H. (2012). On Near-Tail Bubble Penetration into Geosynchronous Altitude. J. Geophys. Res. 117, a–n. doi:10.1029/2012ja017749
Lemon, C., Wolf, R. A., Hill, T. W., Sazykin, S., Spiro, R. W., Toffoletto, F. R., et al. (2004). Magnetic Storm Ring Current Injection Modeled with the Rice Convection Model and a Self-Consistent Magnetic Field. Geophys. Res. Lett. 31, a–n. doi:10.1029/2004gl020914
Li, J., Wang, W., Lu, J., Yue, J., Burns, A. G., Yuan, T., et al. (2019). A Modeling Study of the Responses of Mesosphere and Lower Thermosphere Winds to Geomagnetic Storms at Middle Latitudes. J. Geophys. Res. Space Phys. 124, 3666–3680. doi:10.1029/2019ja026533
Lin, Y., Wang, X. Y., Fok, M. C., Buzulukova, N., Perez, J. D., Cheng, L., et al. (2021). Magnetotail‐Inner Magnetosphere Transport Associated with Fast Flows Based on Combined Global‐Hybrid and CIMI Simulation. J. Geophys. Res. Space Phys. 126. doi:10.1029/2020ja028405
Lin, Y., Wing, S., Johnson, J. R., Wang, X. Y., Perez, J. D., and Cheng, L. (2017). Formation and Transport of Entropy Structures in the Magnetotail Simulated with a 3‐D Global Hybrid Code. Geophys. Res. Lett. 44, 5892–5899. doi:10.1002/2017gl073957
Lindsay, B. G., and Stebbings, R. F. (2005). Charge Transfer Cross Sections for Energetic Neutral Atom Data Analysis. J. Geophys. Res. 110, A12213. doi:10.1029/2005ja011298
Liu, J., Angelopoulos, V., Runov, A., and Zhou, X.-Z. (2013). On the Current Sheets Surrounding Dipolarizing Flux Bundles in the Magnetotail: The Case for Wedgelets. J. Geophys. Res. Space Phys. 118, 2000–2020. doi:10.1002/jgra.50092
Liu, Y. H., Birn, J., Daughton, W., Hesse, M., and Schindler, K. (2014). Onset of Reconnection in the Near Magnetotail: Pic Simulations. J. Geophys. Res. Space Phys. 119, 9773–9789. doi:10.1002/2014JA020492
Lu, G., Richmond, A. D., Lühr, H., and Paxton, L. (2016). High‐latitude Energy Input and its Impact on the Thermosphere. J. Geophys. Res. Space Phys. 121, 7108–7124. doi:10.1002/2015ja022294
Lyon, J. G., Fedder, J. A., and Mobarry, C. M. (2004). The Lyon-Fedder-Mobarry (LFM) Global MHD Magnetospheric Simulation Code. J. Atmos. Solar-Terrestrial Phys. 66, 1333–1350. doi:10.1016/j.jastp.2004.03.020
Mauk, B. H., and McIlwain, C. E. (1974). Correlation ofKpwith the Substorm-Injected Plasma Boundary. J. Geophys. Res. 79, 3193–3196. doi:10.1029/ja079i022p03193
Merkin, V. G., Panov, E. V., Sorathia, K., and Ukhorskiy, A. (2019). Contribution of Bursty Bulk Flows to the Global Dipolarization of the Magnetotail during an Isolated Substorm. J. Geophys. Res. Space Phys. 19. doi:10.1029/2019ja026872
Merkin, V., and Lyon, J. (2010). Effects of the Low-Latitude Ionospheric Boundary Condition on the Global Magnetosphere. J. Geophys. Res. Space Phys. 115. doi:10.1029/2010ja015461
Moebius, E., Scholer, M., Klecker, B., Hovestadt, D., and Gloeckler, G. (1987). Acceleration of Ions of Ionospheric Origin in the Plasma Sheet during Substorm Activity. 231–234.
Nakamura, R., Baumjohann, W., Mouikis, C., Kistler, L. M., Runov, A., Volwerk, M., et al. (2004). Spatial Scale of High-Speed Flows in the Plasma Sheet Observed by Cluster. Geophys. Res. Lett. 31, a–n. doi:10.1029/2004gl019558
Nosé, M., Lui, A. T. Y., Ohtani, S., Mauk, B. H., McEntire, R. W., Williams, D. J., et al. (2000). Acceleration of Oxygen Ions of Ionospheric Origin in the Near-Earth Magnetotail during Substorms. J. Geophys. Res. 105 (1978–2012), 7669–7677. doi:10.1029/1999ja000318
Nosé, M., Taguchi, S., Hosokawa, K., Christon, S. P., McEntire, R. W., Moore, T. E., et al. (2005). Overwhelming O+contribution to the Plasma Sheet Energy Density during the October 2003 Superstorm: Geotail/EPIC and IMAGE/LENA Observations. J. Geophys. Res. 110 (1978–2012), 110. doi:10.1029/2004ja010930
Ohtani, S.-I., Shay, M. A., and Mukai, T. (2004). Temporal Structure of the Fast Convective Flow in the Plasma Sheet: Comparison between Observations and Two-Fluid Simulations. J. Geophys. Res. 109, A03210. doi:10.1029/2003ja010002
Ohtani, S., and Motoba, T. (2017). Equatorial Magnetic Field of the Near-Earth Magnetotail. J. Geophys. Res. Space Phys. 122, 8462–8478. doi:10.1002/2017ja024115
Ohtani, S., Nosé, M., Christon, S. P., and Lui, A. T. Y. (2011). Energetic O+and H+ions in the Plasma Sheet: Implications for the Transport of Ionospheric Ions. J. Geophys. Res. 116, a–n. doi:10.1029/2011ja016532
Østgaard, N., Mende, S. B., Frey, H. U., Gladstone, G. R., and Lauche, H. (2003). Neutral Hydrogen Density Profiles Derived from Geocoronal Imaging. J. Geophys. Res. 108 (1978–2012), 108. doi:10.1029/2002ja009749
Pembroke, A., Toffoletto, F., Sazykin, S., Wiltberger, M., Lyon, J., Merkin, V., et al. (2012). Initial Results from a Dynamic Coupled Magnetosphere-Ionosphere-Ring Current Model. J. Geophys. Res. 117, a–n. doi:10.1029/2011ja016979
Pontius, D. H., and Wolf, R. A. (1990). Transient Flux Tubes in the Terrestrial Magnetosphere. Geophys. Res. Lett. 17, 49–52. ISSN 0094-8276. doi:10.1029/gl017i001p00049
Raeder, J., McPherron, R. L., Frank, L. A., Kokubun, S., Lu, G., Mukai, T., et al. (2001). Global Simulation of the Geospace Environment Modeling Substorm challenge Event. J. Geophys. Res. 106, 381–395. doi:10.1029/2000ja000605
Ripoll, J. F., Claudepierre, S. G., Ukhorskiy, A. Y., Colpitts, C., Li, X., Fennell, J. F., et al. (2020). Particle Dynamics in the Earth's Radiation Belts: Review of Current Research and Open Questions. J. Geophys. Res. Space Phys. 125. doi:10.1029/2019ja026735
Roelof, E. C. (1989). Remote Sensing of the Ring Current Using Energetic Neutral Atoms. Adv. Space Res. 9, 195–203. doi:10.1016/0273-1177(89)90329-3
Rosenbluth, M. N., and Longmire, C. L. (1957). Stability of Plasmas Confined by Magnetic fields. Ann. Phys. 1, 120–140. doi:10.1016/0003-4916(57)90055-6
Runov, A., Angelopoulos, V., Artemyev, A., Birn, J., Pritchett, P. L., and Zhou, X. Z. (2017). Characteristics of Ion Distribution Functions in Dipolarizing Flux Bundles: Event Studies. J. Geophys. Res. Space Phys. 122, 5965–5978. doi:10.1002/2017ja024010
Runov, A., Angelopoulos, V., Gabrielse, C., Liu, J., Turner, D. L., and Zhou, X. Z. (2015). Average Thermodynamic and Spectral Properties of Plasma in and Around Dipolarizing Flux Bundles. J. Geophys. Res. Space Phys. 120, 4369–4383. doi:10.1002/2015ja021166
Sadeghzadeh, S., Yang, J., Wang, C. P., Mousavi, A., Wang, W., Sun, W., et al. (2021). Effects of Bubble Injections on the Plasma Sheet Configuration. J. Geophys. Res. Space Phys. 126. doi:10.1029/2021ja029127
Sergeev, V. A., Gordeev, E. I., Merkin, V. G., and Sitnov, M. I. (2018). Does a Local B-Minimum Appear in the Tail Current Sheet during a Substorm Growth Phase?. Geophys. Res. Lett. 45, 2566–2573. doi:10.1002/2018gl077183
Sitnov, M., Birn, J., Ferdousi, B., Gordeev, E., Khotyaintsev, Y., Merkin, V., et al. (2019). Explosive Magnetotail Activity. Space Sci. Rev. 215, 31. doi:10.1007/s11214-019-0599-5
Smith, P. H., and Bewtra, N. K. (1976). Dependence of the Charge Exchange Lifetimes on Mirror Latitude. Geophys. Res. Lett. 3, 689–692. doi:10.1029/gl003i011p00689
Snicker, A., Kurki-Suonio, T., and Sipila, S. K. (2010). Realistic Simulations of Fast-Ion Wall Distribution Including Effects Due to Finite Larmor Radius. IEEE Trans. Plasma Sci. 38, 2177–2184. doi:10.1109/tps.2010.2056705
Sorathia, K. A., Merkin, V. G., Panov, E. V., Zhang, B., Lyon, J. G., Garretson, J., et al. (2020). Ballooning‐Interchange Instability in the Near‐Earth Plasma Sheet and Auroral Beads: Global Magnetospheric Modeling at the Limit of the MHD Approximation. Geophys. Res. Lett. 47 18. doi:10.1029/2020gl088227
Sorathia, K. A., Merkin, V. G., Ukhorskiy, A. Y., Allen, R. C., Nykyri, K., and Wing, S. (2019). Solar Wind Ion Entry into the Magnetosphere during Northward Imf. J. Geophys. Res. Space Phys. 124, 5461–5481. doi:10.1029/2019ja026728
Sorathia, K. A., Merkin, V. G., Ukhorskiy, A. Y., Mauk, B. H., and Sibeck, D. G. (2017). Energetic Particle Loss through the Magnetopause: A Combined Global MHD and Test-Particle Study. J. Geophys. Res. Space Phys. 122, 9329–9343. doi:10.1002/2017ja024268
Sorathia, K. A., Ukhorskiy, A. Y., Merkin, V. G., Fennell, J. F., and Claudepierre, S. G. (2018). Modeling the Depletion and Recovery of the Outer Radiation Belt during a Geomagnetic Storm: Combined MHD and Test Particle Simulations. J. Geophys. Res. Space Phys. 123, 5590–5609. doi:10.1029/2018ja025506
Sorathia, K., Ukhorskiy, A. Y., and Merkin, V. G. (2018). The Role of Mesoscale Electrodynamics in Ring Current Evolution: Global MHD and Test Particle Simulations. In AGU Fall Meeting Abstracts. vol. 2018,SM22A–06.
Stone, J. M., Gardiner, T. A., Teuben, P., Hawley, J. F., and Simon, J. B. (2008). Athena: A New Code for Astrophysical MHD. Astrophys J. Suppl. S 178, 137–177. doi:10.1086/588755
Toffoletto, F. (2020). “Modeling Techniques,” in Ring Current Investigations. Editors V. K. Jordanova, R. Ilie, and M. W. Chen (Elsevier), 99–151. doi:10.1016/B978-0-12-815571-4.00004-4
Toffoletto, F. R., Wolf, R. A., and Schutza, A. M. (2020). Buoyancy Waves in Earth’s Nightside Magnetosphere: Normal-Mode Oscillations of Thin Filaments. J. Geophys. Res. Space Phys. 125, 17–20. doi:10.1029/2019ja027516
Turner, D. L., Fennell, J. F., Blake, J. B., Claudepierre, S. G., Clemmons, J. H., Jaynes, A. N., et al. (2017). Multipoint Observations of Energetic Particle Injections and Substorm Activity during a Conjunction between Magnetospheric Multiscale (MMS) and Van Allen Probes. J. Geophys. Res. Space Phys. 122, 11,481–11,504. doi:10.1002/2017ja024554
Ukhorskiy, A. Y., Sitnov, M. I., Merkin, V. G., Gkioulidou, M., and Mitchell, D. G. (2017). Ion Acceleration at Dipolarization Fronts in the Inner Magnetosphere. J. Geophys. Res. Space Phys. 122, 3040–3054. doi:10.1002/2016ja023304
Ukhorskiy, A. Y., Sorathia, K., Merkin, V. G., Sitnov, M. I., Mitchell, D. G., and Gkioulidou, M. (2018). Ion Trapping and Acceleration at Dipolarization Fronts: High-Resolution MHD and Test-Particle Simulations. J. Geophys. Res. Space Phys. 27, 1–5589. doi:10.1029/2018ja025370
Wang, W., Lei, J., Burns, A. G., Solomon, S. C., Wiltberger, M., Xu, J., et al. (2010). Ionospheric Response to the Initial Phase of Geomagnetic Storms: Common Features. J. Geophys. Res. Space Phys. 115. doi:10.1029/2009ja014461
Wiltberger, M., Merkin, V., Lyon, J. G., and Ohtani, S. (2015). High‐resolution Global Magnetohydrodynamic Simulation of Bursty Bulk Flows. J. Geophys. Res. Space Phys. 120, 4555–4566. doi:10.1002/2015ja021080
Wolf, R. A., Kumar, V., Toffoletto, F. R., Erickson, G. M., Savoie, A. M., Chen, C. X., et al. (2006). Estimating Local Plasma sheetPV5/3from Single-Spacecraft Measurements. J. Geophys. Res. 111. doi:10.1029/2006ja012010
Yang, J., Toffoletto, F. R., and Song, Y. (2010). Role of Depleted Flux Tubes in Steady Magnetospheric Convection: Results of RCM-E Simulations. J. Geophys. Res. 115, a–n. doi:10.1029/2010ja015731
Yang, J., Toffoletto, F. R., Wolf, R. A., and Sazykin, S. (2015). On the Contribution of Plasma Sheet Bubbles to the Storm Time Ring Current. J. Geophys. Res. Space Phys. 120, 7416–7432. doi:10.1002/2015ja021398
Yang, J., Toffoletto, F. R., Wolf, R. A., and Sazykin, S. (2011). RCM-E Simulation of Ion Acceleration during an Idealized Plasma Sheet Bubble Injection. J. Geophys. Res. 116, 4027. doi:10.1029/2010ja016346
Keywords: plasma sheet, ring current, buoyancy, mesoscale, bursty bulk flows, injections, geospace
Citation: Sorathia KA, Michael A, Merkin V, Ukhorskiy A, Turner DL, Lyon J, Garretson J, Gkioulidou M and Toffoletto F (2021) The Role of Mesoscale Plasma Sheet Dynamics in Ring Current Formation. Front. Astron. Space Sci. 8:761875. doi: 10.3389/fspas.2021.761875
Received: 20 August 2021; Accepted: 11 October 2021;
Published: 01 November 2021.
Edited by:
Jean-Francois Ripoll, CEA DAM Île-de-France, FranceReviewed by:
Fabio Bacchini, University of Colorado Boulder, United StatesCopyright © 2021 Sorathia, Michael, Merkin, Ukhorskiy, Turner, Lyon, Garretson, Gkioulidou and Toffoletto. This is an open-access article distributed under the terms of the Creative Commons Attribution License (CC BY). The use, distribution or reproduction in other forums is permitted, provided the original author(s) and the copyright owner(s) are credited and that the original publication in this journal is cited, in accordance with accepted academic practice. No use, distribution or reproduction is permitted which does not comply with these terms.
*Correspondence: K. A. Sorathia, a2FyZWVtLnNvcmF0aGlhQGdtYWlsLmNvbQ==
Disclaimer: All claims expressed in this article are solely those of the authors and do not necessarily represent those of their affiliated organizations, or those of the publisher, the editors and the reviewers. Any product that may be evaluated in this article or claim that may be made by its manufacturer is not guaranteed or endorsed by the publisher.
Research integrity at Frontiers
Learn more about the work of our research integrity team to safeguard the quality of each article we publish.