
95% of researchers rate our articles as excellent or good
Learn more about the work of our research integrity team to safeguard the quality of each article we publish.
Find out more
ORIGINAL RESEARCH article
Front. Astron. Space Sci. , 20 December 2021
Sec. Space Physics
Volume 8 - 2021 | https://doi.org/10.3389/fspas.2021.758241
This article is part of the Research Topic Micro- to Macro-Scale Dynamics of Earth’s Flank Magnetopause View all 17 articles
 Kyung Sun Park1,2*
We performed high-resolution three-dimensional global MHD simulations to determine the impact of weak southward interplanetary magnetic field (IMF) (Bz = −2 nT) and slow solar wind to the Earth’s magnetosphere and ionosphere. We considered two cases of differing, uniform time resolution with the same grid spacing simulation to find any possible differences in the simulation results. The simulation results show that dayside magnetic reconnection and tail reconnection continuously occur even during the weak and steady southward IMF conditions. A plasmoid is generated on closed plasma sheet field lines. Vortices are formed in the inner side of the magnetopause due to the viscous-like interaction, which is strengthened by dayside magnetic reconnection. We estimated the dayside magnetic reconnection which occurred in relation to the electric field at the magnetopause and confirmed that the enhanced electric field is caused by the reconnection and the twisted structure of the electric field is due to the vortex. The simulation results of the magnetic field and the plasma properties show quasi-periodic variations with a period of 9–11 min between the appearances of vortices. Also the peak values of the cross-polar cap potential are both approximately 50 kV, the occurrence time of dayside reconnections are the same, and the polar cap potential patterns are the same in both cases. Thus, there are no significant differences in outcome between the two cases.
Dayside magnetic reconnection between the geomagnetic field and the interplanetary magnetic field (IMF) is the most important for understanding the Earth’s magnetosphere dynamics. There have been many observations, simulations and theory studies on the reconnection process of the magnetosphere. Dungey (1961) first examined magnetic reconnection for a purely southward IMF. The magnetic reconnection occurs efficiently in the dayside when IMF is southward and the rate is the largest where the magnetosheath magnetic field is antiparallel to the geomagnetic field (Sonnerup, 1974; Crooker, 1979; Luhmann et al., 1984; Park et al., 2006). Also, Park et al. (2010) found that antiparallel reconnection occurs dominantly on the magnetosphere outer boundary even in complicated cases where northward IMF, non-zero dipole tilt, and non-zero IMF By existed.
On the other hand, viscous-like interaction such as the Kelvin-Helmholtz (KH) instability (Dungey, 1955; Miura, 1984, 1995; Kivelson and Chen, 1995) is generally known to be driven by the velocity shear with a rapid magnetosheath plasma at the boundary for northward IMF condition. There are MHD simulation studies that the KH vortices have properties with short time intervals of about 2–4 min (Otto and Fairfield, 2000; Guo, et al., 2010; Ogino, 2011). Merkin et al. (2013) also examined the double-vortex sheet with vortex trains propagating along the inner and outer edges of the boundary layer.
The magnetosphere boundary can also fluctuate in response to solar wind dynamic pressure pulse. In particular, observations of the magnetospheric magnetic field response showed quasi-periodic pulses with a period of 8 min (Sibeck et al., 1989; Sibeck 1990, 1992; Sibeck and Gosling, 1996). Sibeck (1990) reviewed that the pressure pulses mean large-amplitude solar wind dynamic pressure pulses recurring on time scales of 5–15 min that impact the Earth’s bow shock. Lysak and Lee (1992) used a numerical model to show that field line resonances are dependent on the frequency of the driving pulse. Using a global MHD simulation, Claudepierre et al. (2010) found that the solar wind dynamic pressure fluctuations drive toroidal mode field line resonances on the dayside.
There have been few studies on the vortices in the magnetospheric boundary layer under southward IMF conditions. Claudepierre et al. (2008) performed high-resolution global MHD simulations to show that the pulsations of surface waves were generated by the KH instability at the magnetopause boundary for varying solar wind velocities under a southward IMF condition. Additionally, developed KH waves in the magnetopause have been reported using observational data and simulation under the southward IMF conditions (Hwang et al., 2011; Kavosi and Raeder 2015; Nakamura et al., 2020). Hwang et al. (2011) showed that the first in situ observation by Cluster of nonlinearly developed KH wave during ∼17 min under southward IMF conditions. Kavosi and Raeder (2015) reported the relative KH waves occurrence rate as a function of solar wind parameters by 7 years of THEMIS(Time History of Events and Macro scale Interactions during Substorms) data. The statistical analysis showed that KH waves rate increase with solar wind speed, and Alfven Mach number and number density and also the KH waves occur about 10% for southward IMF. Park et al. (2020) found that the dayside reconnection leads to the quasi-periodic vortex with 8–10 min in the inner magnetopause boundary under the long duration of the solar wind and weak southward IMF.
However, it still needs to be understood what kind of factors of magnetopause boundary are more important depending on the solar wind and IMF conditions. There has been no previous study examining the significance of applying different grid spacing and time resolution to understand the magnetic field topology and magnetosphere and ionosphere response using MHD simulations, as attempted in this paper.
In Simulation Model, we briefly introduce the simulation model. In Simulation Results, we present the simulation results. In Summary and Discussion, a summary and discussion of the results are presented.
The three-dimensional simulation is based on solving the normalized resistive MHD and Maxwell’s equation as an initial value problem by using a modified leap-frog scheme. We provide only a brief review of the simulation model as it has been described in detail elsewhere (Ogino et al., 1992; Park et al., 2006). We used a quarter simulation box with -60 RE ≤ X ≤ 20 RE, 0 RE ≤ Y ≤ 40 RE, and 0 RE ≤ Z ≤ 40 RE dimensions in Cartesian solar magnetospheric coordinates, assuming symmetry conditions are consistent with the dipole magnetic field. The number of grid points was (nX, nY, nZ) = (800, 400, 400), with a uniform grid spacing of 0.1 RE. A mirror dipole field was applied to the solar wind at time t = 0, to form the shape of the magnetosphere. A smoothing function damps all perturbations near the ionosphere, including parallel currents. The parallel current does not close in the ionosphere, it partly closes above the ionospheric boundary. The internal ionospheric boundary conditions are set by forcing a static equilibrium at r = 2.5 RE. A uniform solar wind conditions a velocity, Vsw = 300 km/s, a number density, nsw = 5 cm−3 with a pure northward IMF Bz (= 5 nT) was held constant for up 2 h in order to obtain quasi-steady state of the magnetospheric configuration as the initial condition.
In the following three conditions, the weak and steady southward IMF of Bz = −2 nT entered the upstream boundary for 2 h. The beginning time of this simulation results are t = 0. The time resolutions are 1 min (Case 1), 30 s (Case 2), and 10 s (Case3) respectively in this simulation.
We demonstrate the response of the magnetospheric configuration of the 3D magnetic field lines in Figure 1. The Earth is located at the origin, closed field lines that connect to the Earth in both hemispheres are colored green, open field lines that connect to the ionospheres at one end and to the distant IMF at the other end are colored blue, and the twisted field lines in tail region are colored pink in Figure 1. The dayside reconnection initially and continuously occurs near the subsolar region (the magnetic equator) at t = 9 min during the simulation in the two cases of weak southward IMF. The dayside reconnection regions are located between the northern and southern hemispheres with highly kinked open field lines. The reconnected open field lines on the dayside move tailward through the dusk (dawn) side with a magnetosheath flow. The closed plasma sheet field line in tail is widely stretched tailward until the occurrence of tail reconnection. Plasmoids are generated near the midnight region (about ∼14.5RE) after precisely 85 min in Case 1 and after precisely 85 min and 30 s in Case 2.
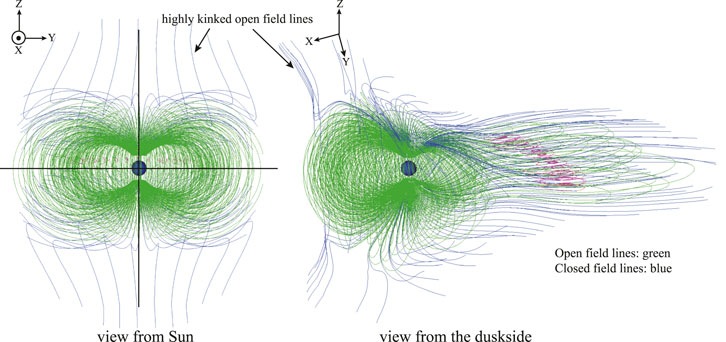
FIGURE 1. 3D magnetic field line configuration at a specific time, t = 85 min (Case 1) in simulation. Closed field lines that connect to the Earth in both hemispheres are green, open field lines that connect to the ionospheres at one end and to the distant IMF at the other end are blue, and the twisted field lines in tail region refer to pink.
Figure 2 shows the time evolutions with specific location at (X, Y, Z)= (−25, 0, 0) RE the strength of magnetic field, |B|, z-component of magnetic field, Bz, and the total velocity |V|, x-component of velocity, Vx, the density (ρ) and the plasma (P) for two cases. The vertical dashed lines denote the center of the plasmoid. In a plasmoid the Bz component of the magnetic field has a bipolar signature and the By component is nearly zero in both cases. The magnetic field strength of magnetic field decreases slightly when the plasma pressure reaches the maximum and the density decrease in the center of the plasmoid. These are typical feature for a plasmoid. In both cases, there was no helical magnetic field line in the center of plasmoid during the simulation for weak solar wind and southward IMF conditions. The plasmoid moves tailward with a velocity above 100 km/s as plasmasheet reconnection continues to involve lobe field lines.
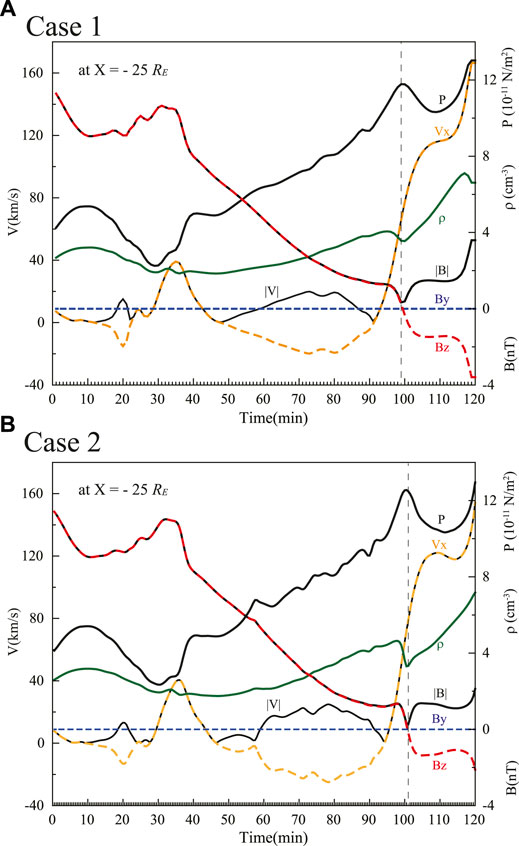
FIGURE 2. The time evolutions of the strength of magnetic field, |B|, z-component of magnetic field, Bz, and the total velocity |V|, x-component of velocity, Vx, the density (ρ) and the plasma (P) for two cases.
Figure 3 shows the plasma flow vectors in the XZ (top) and XY planes (bottom) at time t = 90 min in Case 1 (A) and in Case 2 (B). The red curves refer to BZ = 0 regions. The bow shock is located approximately at X = 16 RE and the magnetopause is located approximately at X = 12 RE at the nose throughout the simulation in both cases during the weak uniform southward IMF. The calculated convection electric fields, Ec = |ηJc| = η|B×J|/|B|, are plotted with the color contour. The basic calculation method of the electric field has been described in detail by Park et al. (2006). The electric field becomes larger in the dayside and tail reconnection region in both cases. Also, the simulation results show that the high electric fields in the magnetopause are related to the vortex in Figure 3. The vortex-like structures are generated in the inner boundary of the magnetopause after t = 47 min after the steady weak southward IMF constantly impacts the magnetosphere. And the vortex propagates anti-sunward with a velocity 158 km/s in Case 1 (A) and 120 km/s for Case 2 (B). The vortices are counterclockwise in the duskside magnetopause in this simulation. The center of the region of vortex A is at (X, Y) = (9.0, 9.4) RE in Case 1 (A) and (X, Y) = (6.0, 9.9) RE in Case 2 (B) respectively. In Case 1, the size of the vortex changes from 3 RE to 4.5 RE during the move to the tail in Figure 3A. In Case 2, the size of vortex A is 2.3 RE and increases to 3.5 RE during the move to the tail.
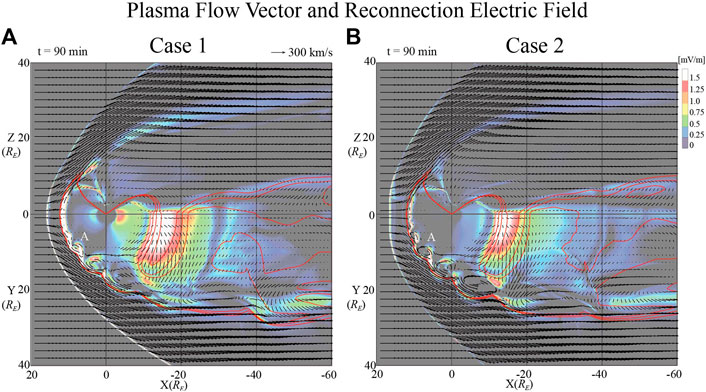
FIGURE 3. The plasma flow vectors in the XZ (top) and XY planes (bottom) at time t = 90 min in simulation during the weak southward condition in Case 1 (A) and in Case 2 (B). The red lines are contours of the Bz = 0 region. The color contour is convection electric field.
Figure 4 shows 3D closed magnetic field lines indicated in green and tail reconnection field lines indicated in red at t = 120 min in Case1 (A) and in Case2 (B). The black arrow indicates the equatorial magnetospheric convection. The plasma flow in the near tail clearly moves earthward due to the tail reconnection. This is clearly shown in Figure 4. The tail reconnection region is at approximately X = −14.2 RE where plasma flow diverges. A strong earthward plasma flow appears at the near-Earth line with a velocity of 40 km/s up to 194 km/s due to the tail reconnection in Case 1. In Case 2, the tail reconnection occurs at approximately X = −13.4 RE and the peak value of velocity is about 200 km/s. Some closed field lines on the dusk (and dawn) are linked to the vortex and move duskward and then toward the tail.
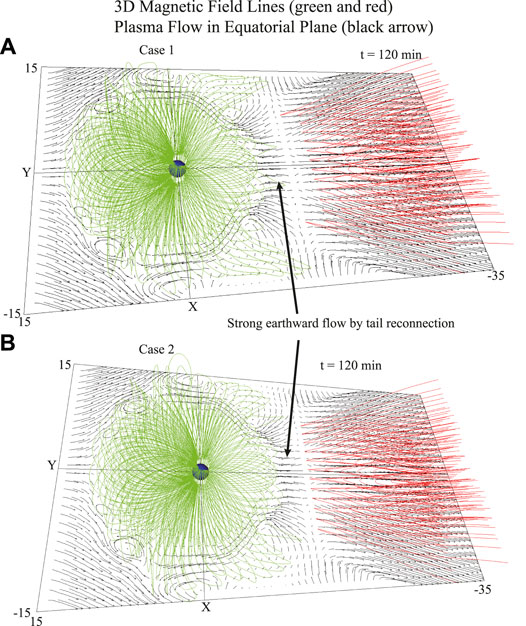
FIGURE 4. 3D closed magnetic field lines that indicate green and tail reconnection field lines it indicate red at t = 120 min in Case1 (A) and in Case2 (B). The black arrow indicate equatorial magnetospheric convection.
Figure 5 shows the temporal variations of the magnetic field and plasma properties from t = 65–120 min in Case 1 (A), from t = 60–115 min in Case 2 (B) during the simulation. For the data, the following coordinates were designated to observe the movement of the vortices: X = 6.9 RE, Y = 9.9 RE and Z = 0 RE for Case 1, X = 8.9 RE, Y = 8.1 RE and Z = 0 RE for Case 2. The center of the vortices was indicated with dashed vertical lines. This figure clearly shows quasi-periodic behavior with an interval of 9–11 min. Observing the center of the vortices, the sizes of the bipolar magnetic field perturbation and the total magnetic field intense increase. The velocity is low at the center of the vortices and variations in the Vx and Vy components were roughly 90° out of phase. The density and the plasma pressure are low at the center of the vortices but the current is high. Some observation and model studies are related to KH waves under the southward IMF condition. It has been reported that the KH waves involve both with the magnetosheath and the magnetopause boundary. Hwang et al. (2011) examined by using a global MHD simulation under southward IMF condition that KH are well developed, but they quickly become unstable due to both subsolar fluctuations and external dynamics of FTEs. However, it is not clear whether these simulation results are a feature of KH waves. The vortices are generated in the inner boundary of the magnetopause and they exhibit stable, periodic fluctuations during the simulation Therefore, it is necessary to perform the simulations under various conditions.
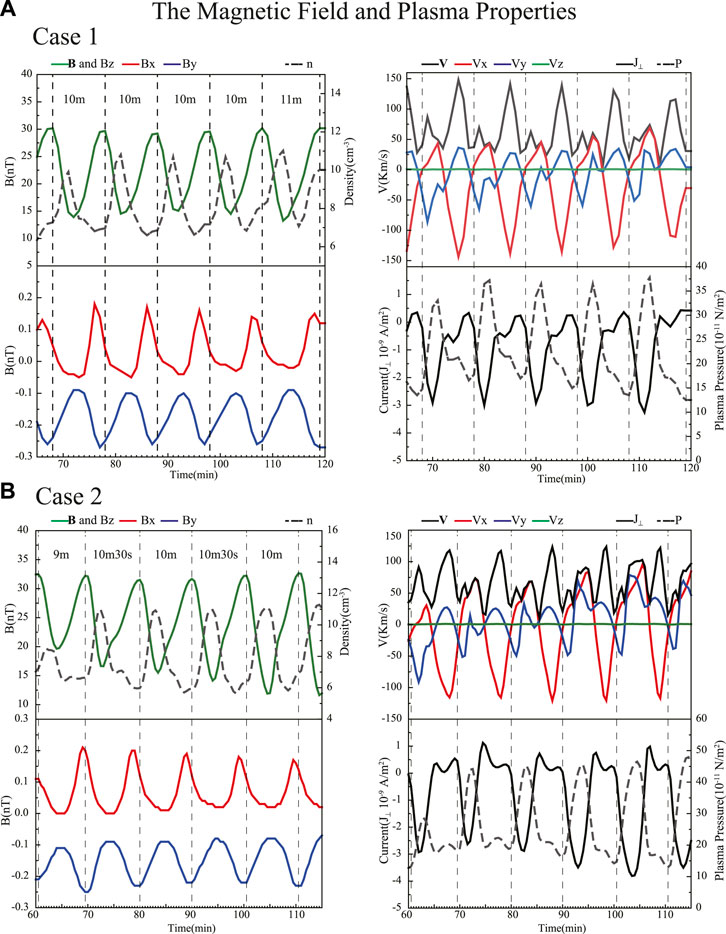
FIGURE 5. The time evolution of the magnetic field and plasma density (left) and the plasma flow vector, current density and plasma pressure (right) from 65 to 120 min in Case 1 (A) and from 60 to 115 min in Case 2 (B). The data were selected at the X = 6.9 RE, Y = 9.9 RE and Z = 0 RE in Case 1 and X = 8.9 RE, Y = 8.1 RE and Z = 0 RE in Case 2 across the vortex A in Figure 3.
The size, propagation speed and the intervals of the vortices in the two cases simulation results are similar to those obtained in our previous studies (Park et al., 2020). That study showed that the density and the plasma pressure are high, and the current is low at the center of the vortices at a 0.3 RE grid spacing simulation. There are different simulation conditions with variances in the initial magnetosphere condition, simulation grid spacing, and time resolution. However, further effects of other conditions should be investigated.
Figure 6 shows the simulation results of the evolution of the cross-polar cap potential mapped onto the polar region. The maximum value of the cross-polar cap potential reaches approximately 50 kV after 40–50 min with a strong dayside reconnection in both cases. Also, the cross-polar cap potential increased until t = 90 min as the tail reconnection persisted and intensified. In both cases, the cross-polar cap potential increase to more than 30 kV was observed during the simulation. Many studies suggested that the peak potential was substantial enough to set a growth phase condition for the later release of the energy such as substorm triggering (e.g., Milan, 2004; Lockwood et al., 2009; Liu et al., 2011; Andalsvik et al., 2012). Lockwood et al. (2009) determined the transpolar voltage as a function of the IMF Bz for quiet times and the growth phase of a substorm, reporting values of 10–60 kV for -10 nT < Bz < 10 nT. Liu et al. (2011) reported an increase in the cross-polar cap potential ranging from 16 to 29 kV associated with substorm occurrences. These results suggest that substorm energy storage and eventual release are possible as the cross-polar cap potential value exceed 30 kV even during the weak and long duration of southward IMF.
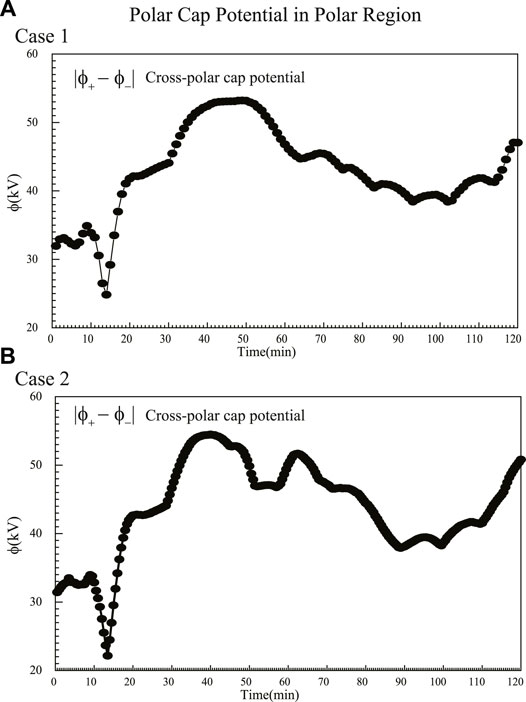
FIGURE 6. The simulation results of the evolution over time of the cross-polar cap potential mapped onto the polar region for 1 min time resolution in Case 1 (A) and for 30 s time resolution in Case 2 (B).
Figure 7 shows 2D electric potential patterns in the polar region at selected times. The blue and red contours indicate negative and positive potentials respectively. A double green line delimits the open-closed field lines boundary. The four-cell pattern is shown in the polar region due to the initial state of the northward IMF condition simulation at Figure 7 (top). A two-cell pattern appears after the weak southward IMF impacted with the magnetosphere in Figure 7 (bottom panels). The open-closed boundary is located between 77° and 70° on the nightside, 83° and 78° on the dayside, and 79° and 74° on dawn and dusk regions during the simulation. The open-closed boundary extends close to 70° near midnight after the tail reconnection strengthened at t = 90 min while ionospheric convection is enhanced in the night side (plot not shown). The potential pattern and open-closed boundary in the polar region exhibit the same results during the simulation in both cases.
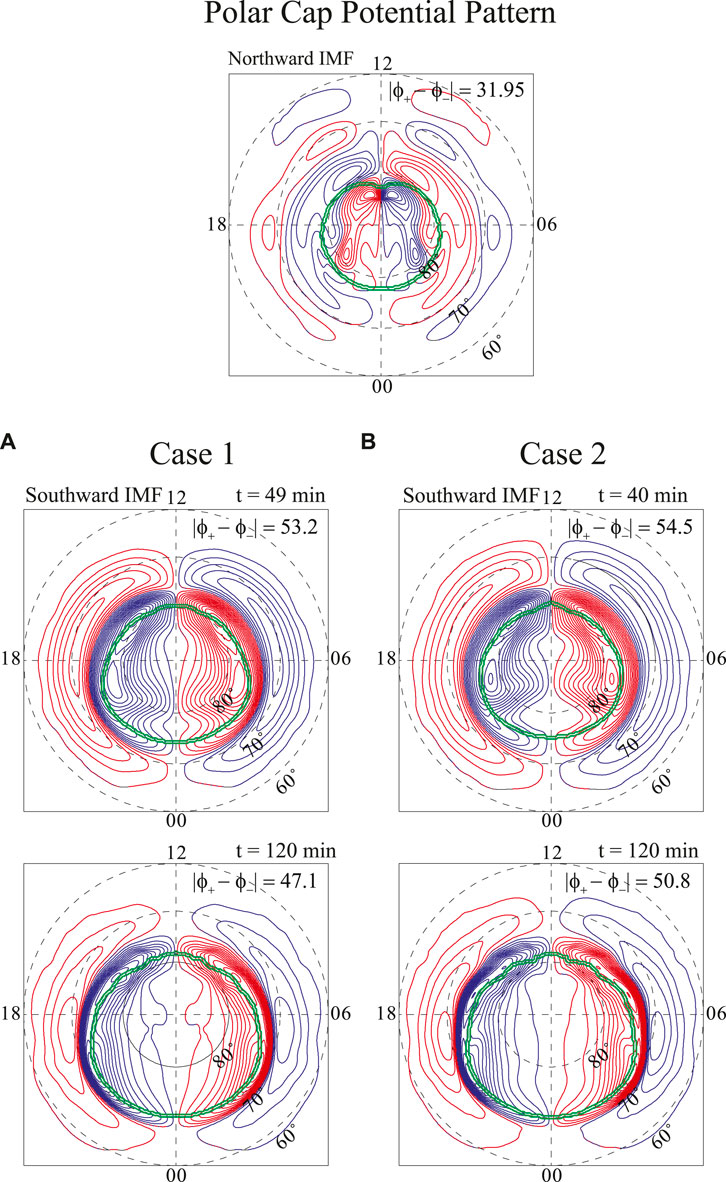
FIGURE 7. 2D electric potential pattern in the polar region at selected times. The blue and red contours indicate negative and positive potentials, respectively. A double green lines delimit the open-closed field lines boundary.
In this work, we studied the response of the magnetosphere and the ionosphere using a 3D global MHD simulation in high resolution grid spacing and time when the IMF is purely weak southward. The main features of the simulation results are summarized below;
(i) The magnetic reconnection starts in the subsolar region and magnetic equator region at t = 9 min during the weak southward IMF impacts. The vortices are generated in t = 47 min in the inner boundary of the magnetopause. The direction of motion of the reconnected open field line on the dayside changes from dusk (dawn) to tailward with the plasma flow. The stretched closed plasma sheet field lines in the tail led to a plasmoid formation near the midnight region (about 14.5 RE) after approximately 85 min.
(ii) Vortices propagate anti-sunward with a quasi-periodicity of 9–11 min 30 s in the inner boundary of the magnetosphere. A strong convection electric field occurs in the magnetopause boundary which indicates that there is a dominant occurrence of a magnetic reconnection. Also, the twisted structure of the convection electric field in the magnetopause is the result of vortices.
(iii) The cross-polar cap potential reaches up to ∼50 kV after 40–50 min with a strong dayside reconnection and then gradually decreased to 40 kV. Case 2 had a second peak different from Case 1. The cross-polar cap potential gradually increased until t = 90 min as the tail reconnection persisted and intensified in both cases.
(iv) The two-cell pattern appeared in the polar region during the weak southward IMF simulation. The location of the open-closed field boundary is 77°–70° at night (24:00 MLT), around 83°–78° at 12:00 MLT, and 79°–74° at 6:00 and 18:00 MLT.
The magnetic reconnection is the most important mechanism for magnetospheric phenomena even in the case of weak and steady southward IMF. The dayside reconnection first occurs and then vortices are generated near the inner magnetopause boundary. Park et al. (2020) showed that the velocity shear exists in the dayside magnetopause boundary because the plasma flows near the magnetic equator deformed by reconnection. They suggested that reconnection played a role in generating vortices with a periodicity in the dayside magnetopause boundary under a weak southward IMF in a simulation with a grid spacing of 0.3 RE. These results are similar to those simulation results despite the different grid spacing of 0.1 RE and different time resolution. Nakamura et al. (2020) reported using 3D full kinetic simulation of the KHI at the magnetopause under the southward IMF condition. They showed that the KH waves due to the enhanced reconnection rate are decay within the magnetopause boundary layer.
In addition, Figure 8A show the simulation results for 10 s time resolution of the plasma flow vector in XZ panel (upper) and in XY panel (bottom) at time t = 100 min. Figure 8B show the time evolution of the magnetic field and plasma properties from t = 60 to t = 120 min. The location of selected data is near the center of vortices at X = 8.5 RE, Y = 8.1 RE and Z = 0 RE (asterisked). This figure clearly shows quasi-periodic behavior with an interval of 9 min 20 s to 11 min 30 s for high resolution simulation. In Figure 8A, the vortex structure is also formed in the inner boundary magnetopause. The results of the simulation with a 10 s time resolution have no significant difference from either the 1 min or 30 s time resolution simulations. Details will be discussed in a future paper.
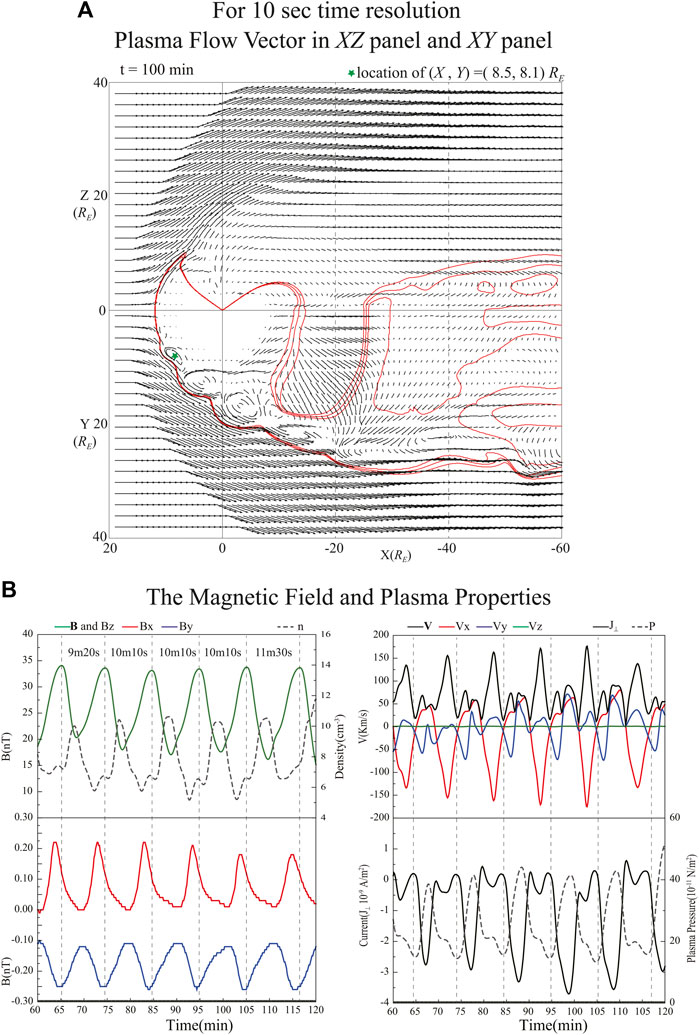
FIGURE 8. The plasma flow vectors in the XZ (top) and XY planes (bottom) at time t = 100 min in simulation of 10 s time resolution for the weak southward condition in (A). The red lines are contours of the Bz = 0 region. (B) show the time evolution of the magnetic field and plasm properties in the region of X = 8.5 RE, Y = 8.1 RE and Z = 0 RE.
The observational study by Hwang et al. (2012) indicate that KH waves can occur at high-latitude magnetopause during strongly dawnward IMF conditions. When the IMF By is non-zero, the dayside reconnection occur at the high-latitude flanks to satisfy the antiparallel field conditions (Park et al., 2006). They examined using the global MHD simulation the direction of the plasma flow flowing the magnetic reconnection. It was showed that after the reconnection, open field lines easily move from dusk to dawn in the dayside polar region under the duskward IMF conditions. The fast transverse plasma flow moved dawnward simultaneously. The velocity shear could exist at high-latitude deformed plasma flow by the reconnected even high-speed magnetosheath flow. It is necessary to further study the effects of IMF strength, direction, and variable solar wind parameter using global MHD simulation with different grid spacing and time resolution.
The simulation data supporting the conclusions of this paper will be made available by the authors, without undue reservation.
The author confirms being the sole contributor of this work and has approved it for publication.
This research was supported by Basic Science Research Program through the National Research Foundation of Korea (NRF) funded by the Ministry of Education (No. NRF-2018R1D1A1B07043924) and by National Research Foundation of Korea (NFR) funded by Korea government (MSIP) (No. NRF-2019M1A3B2A04103464).
The author declares that the research was conducted in the absence of any commercial or financial relationships that could be construed as a potential conflict of interest.
All claims expressed in this article are solely those of the authors and do not necessarily represent those of their affiliated organizations, or those of the publisher, the editors and the reviewers. Any product that may be evaluated in this article, or claim that may be made by its manufacturer, is not guaranteed or endorsed by the publisher.
I would like to thank the referees for their helpful comments. I am also grateful to Tatsuki Ogino.
Andalsvik, Y., Sandholt, P. E., and Farrugia, C. J. (2012). Substorms and polar cap convection: the 10 January 2004 interplanetary CME case. Ann. Geophys. 30, 67–80. doi:10.5194/angeo-30-67-2012
Claudepierre, S. G., Elkington, S. R., and Wiltberger, M. (2008). Solar Wind Driving of Magnetospheric ULF Waves: Pulsations Driven by Velocity Shear at the Magnetopause. J. Geophys. Res. 113, a–n. doi:10.1029/2007JA012890
Claudepierre, S. G., Hudson, M. K., Lotko, W., Lyon, J. G., and Denton, R. E. (2010). Solar Wind Driving of Magnetospheric ULF Waves: Field Line Resonances Driven by Dynamic Pressure Fluctuations. J. Geophys. Res. 115, a–n. doi:10.1029/2010JA015399
Crooker, N. U. (1979). Dayside Merging and Cusp Geometry. J. Geophys. Res. 84, 951. doi:10.1029/ja084ia03p00951
Dungey, J. W. (1955). “Electrodynamics of the Outer Atmosphere,” in Proceedings of the Ionosphere Conference. Phys. Soc. of London, London. 255p.
Dungey, J. W. (1961). Interplanetary Magnetic Field and the Auroral Zones. Phys. Rev. Lett. 6, 47–48. doi:10.1103/physrevlett.6.47
Guo, X. C., Wang, C., and Hu, Y. Q. (2010). Global MHD Simulation of the Kelvin-Helmholtz Instability at the Magnetopause for Northward Interplanetary Magnetic Field. J. Geophys. Res. 115, A10218. doi:10.1029/2009JA0115193
Hwang, K.-J., Goldstein, M. L., Kuznetsova, M. M., Wang, Y., Viñas, A. F., and Sibeck, D. G. (2012). The First In Situ Observation of Kelvin-Helmholtz Waves at High-Latitude Magnetopause during Strongly Dawnward Interplanetary Magnetic Field Conditions. J. Geophys. Res. 117, a–n. doi:10.1029/2011JA017256
Hwang, K.-J., Kuznetsova, M. M., Sahraoui, F., Goldstein, M. L., Lee, E., and Parks, G. K. (2011). Kelvin-Helmholtz Waves under Southward Interplanetary Magnetic Field. J. Geophys. Res. 116, a–n. doi:10.1029/2011JA016596
Kavosi, S., and Raeder, J. (2015). Ubiquity of Kelvin-Helmholtz Waves at Earth's Magnetopause. Nat. Commun. 6, 7019. doi:10.1038/ncomms8019
Kivelson, M. G., and Chen, S. H. (1995). “The Magnetopause: Surface Waves and Instabilities and Their Possible Dynamical Consequences,” in AGU Monograph 90, Physics of Magnetopause. Song and B. U. Ö. Sonnerup. (Washington, D.C: AGU), 257.
Liu, J.-M., Zhang, B.-C., Kamide, Y., Wu, Z.-S., Hu, Z.-J., and Yang, H.-G. (2011). Spontaneous and Trigger-Associated Substorms Compared: Electrodynamic Parameters in the Polar Ionosphere. J. Geophys. Res. 116, a–n. doi:10.1029/2010JA015773
Lockwood, M., Hairston, M., Finch, I., and Rouillard, A. (2009). Transpolar Voltage and Polar Cap Flux during the Substorm Cycle and Steady Convection Events. J. Geophys. Res. 114, a–n. doi:10.1029/2008JA013697
Luhmann, J. G., Walker, R. J., Russell, C. T., Crooker, N. U., Spreiter, J. R., and Stahara, S. S. (1984). Patterns of Potential Magnetic Field Merging Sites on the Dayside Magnetopause. J. Geophys. Res. 89, 1739. doi:10.1029/ja089ia03p01739
Lysak, R. L., and Lee, D.-H. (1992). Response of the Dipole Magnetosphere to Pressure Pulse. Geophys. Res. Lett. 19, 97–940. doi:10.1029/92gl00625
Merkin, V. G., Lyon, J. G., and Claudepierre, S. G. (2013). Kelvin-Helmholtz Instability of the Magnetospheric Boundary in a Three-Dimensional Global MHD Simulation during Northward IMF Conditions. J. Geophys. Res. Space Phys. 118, 5478–5496. doi:10.1002/jgra.50520
Milan, S. E. (2004). Dayside and Nightside Contributions to the Cross Polar Cap Potential: Placing an Upper Limit on a Viscous-like Interaction. Ann. Geophys. 22, 3771–3777. doi:10.5194/angeo-22-3771-2004
Miura, A. (1984). Anomalous Transport by Magnetohydrodynamic Kelvin-Helmholtz Instabilities in the Solar Wind-Magnetosphere Interaction. J. Geophys. Res. 89, 801–818. doi:10.1029/ja089ia02p00801
Miura, A. (1995). “Kelvin-Helmholtz Instability at the Magnetopause: Computer Simulations,” in AGU Monograph 90, Physics of MagnetopauseP. Song and B. U. Ö. Sonnerup (Washington, D.C: AGU), 285.
Nakamura, T. K. M., Plaschke, F., Hasegawa, H., Liu, Y. H., Hwang, K. J., Blasl, K. A., et al. (2020). Decay of Kelvin‐Helmholtz Vortices at the Earth's Magnetopause under Pure Southward IMF Conditions. Geophys. Res. Lett. 47, e2020GL087574. doi:10.1029/2020GL087574
Ogino, T. (2011). “Magnetic Reconnection in the Magnetotail on Southward Turning of IMF, Proceeding of Conference on Earth-Sun System Exploration: Variability in Space Plasma Phenomena January,” in 16-21. Hawaii, USA: Kona, 2011.
Ogino, T., Walker, R. J., and Ashour-Abdalla, M. (1992). A Global Magnetohydrodynamic Simulation of the Magnetosheath and Magnetosphere when the Interplanetary Magnetic Field Is Northward. IEEE Trans. Plasma Sci. 20 (6), 817–828. doi:10.1109/27.199534
Otto, A., and Fairfield, D. H. (2000). Kelvin-Helmholtz Instability at the Magnetotail Boundary: MHD Simulation and Comparison with Geotail Observation. J. Geophys. Res. 105, NO. A9 21, 21175–21190.
Park, K. S., Lee, D-Y., and Kim, K- H. (2020). Global MHD Simulation of a Prolonged Steady Weak Southward Interplanetary Magnetic Field Condition. J. Astron. Space Sci. 37 (2), 77–84. doi:10.5140/JASS.2020.37.2.77
Park, K. S., Ogino, T., and Kim, Y. H. (2010). Effects of the Dipole Tilt and Northward and Duskward IMF on Dayside Magnetic Reconnection in a Global MHD Simulation. J. Geophys. Res. 115, a–n. doi:10.1029/2009JA014212
Park, K. S., Ogino, T., and Walker, R. J. (2006). On the Importance of Antiparallel Reconnection when the Dipole Tilt and IMFByare Nonzero. J. Geophys. Res. 111, A05202. doi:10.1029/2004JA010972
Sibeck, D. G. (1990). A Model for the Transient Magnetospheric Response to Sudden Solar Wind Dynamic Pressure Variations. J. Geophys. Res. 95, 3735–3771. doi:10.1029/ja095ia04p03755
Sibeck, D. G., Baumjohann, W., Elphic, R. C., Fairfield, D. H., Fennell, J. F., Gail, W. B., et al. (1989). The Magnetospheric Response to 8-minute Period strong-amplitude Upstream Pressure Variations. J. Geophys. Res. 94, 2505–2519. doi:10.1029/ja094ia03p02505
Sibeck, D. G., and Gosling, J. T. (1996). Magnetosheath Density Fluctuations and Magnetopause Motion. J. Geophys. Res. 101, 31–40. doi:10.1029/95ja03141
Sibeck, D. G. (1992). Transient Events in the Outer Magnetosphere: Boundary Waves or Flux Transfer Events. J. Geophys. Res. 97, 4009–4026. doi:10.1029/91ja03017
Keywords: global MHD simulation, reconnection, vortex, magnetopause, cross-polar cap potential
Citation: Park KS (2021) Global MHD Simulation of the Weak Southward IMF Condition for Different Time Resolutions. Front. Astron. Space Sci. 8:758241. doi: 10.3389/fspas.2021.758241
Received: 13 August 2021; Accepted: 22 November 2021;
Published: 20 December 2021.
Edited by:
Kyoung-Joo Hwang, Southwest Research Institute (SwRI), United StatesReviewed by:
Steven Petrinec, Lockheed Martin Solar and Astrophysics Laboratory (LMSAL), United StatesCopyright © 2021 Park. This is an open-access article distributed under the terms of the Creative Commons Attribution License (CC BY). The use, distribution or reproduction in other forums is permitted, provided the original author(s) and the copyright owner(s) are credited and that the original publication in this journal is cited, in accordance with accepted academic practice. No use, distribution or reproduction is permitted which does not comply with these terms.
*Correspondence: Kyung Sun Park, a3NwYXJrQGNodW5nYnVrLmFjLmty
Disclaimer: All claims expressed in this article are solely those of the authors and do not necessarily represent those of their affiliated organizations, or those of the publisher, the editors and the reviewers. Any product that may be evaluated in this article or claim that may be made by its manufacturer is not guaranteed or endorsed by the publisher.
Research integrity at Frontiers

Learn more about the work of our research integrity team to safeguard the quality of each article we publish.