- 1Department of Physics, University of Texas at Arlington, Arlington, TX, United States
- 2Laboratory for Atmospheric and Space Physics, University of Colorado Boulder, Boulder, CO, United States
- 3Department of Astrophysical and Planetary Sciences, University of Colorado Boulder, Boulder, CO, United States
- 4Department of Physics, Davidson College, Davidson, NC, United States
- 5Southwest Research Institute, San Antonio, TX, United States
- 6Department of Physics, University of New Hampshire, Durham, NH, United States
- 7Department of Earth, Planetary and Space Sciences, University of California, Los Angeles, Los Angeles, CA, United States
- 8NASA Goddard Space Flight Center, Greenbelt, MD, United States
The Kelvin-Helmholtz instability (KHI) is thought to be an important driver for mass, momentum, and energy transfer between the solar wind and magnetosphere. This can occur through global-scale “viscous-like” interactions, as well as through local kinetic processes such as magnetic reconnection and turbulence. An important aspect of these kinetic processes for the dynamics of particles is the electric field parallel to the background magnetic field. Parallel electric field structures that can occur in the KHI include the reconnection electric field of high guide field reconnection, large amplitude ion acoustic waves, as well as time domain structures (TDS) such as double layers and electrostatic solitary waves. In this study, we present a survey of parallel electric field structures observed during three Kelvin Helmholtz events observed by NASA’s Magnetospheric Multiscale (MMS), each at different positions along the magnetosphere’s dusk flank. Using data from MMS’s on-board solitary wave detector (SWD) algorithm, we statistically investigate the occurrence of TDS within the KHI events. We find that early in the KHI development, TDS typically occur in regions with strong field-aligned currents (FACs) on the magnetospheric side of the vortices. Further down the flanks, as the vortices become more rolled up, the prevalence of large electric currents decreases, as well as the prevalence of SWDs. These results suggest that as the instability develops and vortices grow in size along the flanks, kinetic-scale activity becomes less prevalent.
Introduction
In addition to magnetic reconnection at the dayside magnetopause, viscous-like interactions at magnetospheric flanks are also thought to transfer energy and momentum from the solar wind to the magnetosphere (Axford and Hines, 1961). This viscous-like interaction is also important for the transer of energy and momentum from the solar wind to the magnetospheres of gas giants, such as Jupiter and Saturn (Johnson et al., 2014). Although it was once unclear what these “viscous” interactions were, the main mechanism by which this momentum and energy transfer occurs along the magnetospheric flanks is now thought to be the Kelvin-Helmholtz instability (KHI) (Hasegawa et al., 2004; Johnson et al., 2014; Kavosi and Raeder, 2015). The KHI manifests as surface waves that form on the magnetopause in response to flow shear between the magnetosheath and magnetospheric plasma. In the non-linear phase of the instability, these surface waves roll up and form vortices that propagate anti-sunward down the flanks (Johnson et al., 2014).
The mechanisms by which the KHI transfers energy and momentum from the solar wind to the magnetosphere is a topic of ongoing study. One mechanism that has been suggested to facilitate this transfer is magnetic reconnection. As the KHI grows, converging flows on the edges of the vortices lead to compressed current sheets where magnetic reconnection can occur, facilitating the mixing and transport of plasma across the magnetopause boundary (Nakamura et al., 2013). Additionally, reconnection can occur on current sheets within the vortices (Nykyri and Otto, 2001) and at higher latitudes as the instability twists up the magnetic field (Johnson et al., 2014). Further, in the intervals between the compressed current sheets, simulations show that turbulence can develop within the vortices as they roll up (Karimabadi et al., 2013; Nakamura and Daughton, 2014). Turbulent cascades transfer energy from large to small scales and can lead to a variety of kinetic processes that dissipate the injected energy and can heat particles in the plasma. Additionally, reconnection could occur on intermittent current sheets that develop in a turbulent cascade (Phan et al., 2018; Sharma-Pyakurel et al., 2019).
On September 8, 2015, the NASA Magnetospheric Multiscale mission, which was launched to study the physics of collisionless magnetic reconnection, observed a KHI event in the post-noon sector of the flank magnetopause for a prolonged (∼3 h) period during northward interplanetary magnetic field (IMF) conditions. The presence of periodic compressed current sheets in the equatorial plane were confirmed, with reconnection jets observed in ∼50% of the current sheets (Eriksson et al., 2016a) Additionally, between the compressed current sheets, the spectra of the magnetic field fluctuations showed a power law indicative of fully developed turbulence, as well as the presence of intermittent currents at small scales (Stawarz et al., 2016). There was also evidence for the mixing of multiple particle populations in the middle of the vortices, leading to strong ion-acoustic-like parallel electric field fluctuations that did not appear to be current-driven (Wilder et al., 2016a; Wilder et al., 2020). The study of another KHI event, on September 27, 2016, suggested that lower hybrid waves that arise during the instability could also facilitate the diffusion of plasma across the flank magnetopause (Tang et al., 2018).
One aspect of the KHI that has not been observed in detail is the role of non-linear plasma structures in dissipating the turbulence. In particular, we focus on broadband electric field solitary structures called “Time Domain Structures” (TDS) (Mozer et al., 2015). These structures are typically on the order of a few to 10°s Debye lengths, and move at speeds ranging from the ion acoustic to the electron thermal speed. Due to their small size, they manifest as short time-duration fluctuations in the electric field, typically in the component of the electric field parallel to the background magnetic field
The NASA MMS mission’s on-board digital signal processing (DSP) board includes an algorithm to detect TDS, particularly ESWs (Ergun et al., 2016). This solitary wave detector (SWD) algorithm has been tested on THEMIS electric field burst data and detected 70% of ESWs identified by visual inspection, and had a less than 10% “false positive” rate. Analysis of an event in the Earth’s magnetotail observed by MMS suggested comparable success rates for detecting ESWs (Hansel et al., 2021). The SWD algorithm reports a histogram (binned by amplitude) of the total TDS counts detected per reporting period. The reporting period used here is 1s. These data are ideal for studying the occurrence and prevalence of TDS in the KHI, where often, more than an hour of burst observations are available from the MMS spacecraft.
In this study, we investigate three KHI events observed by MMS at different positions along the flanks, and different stages of the instability’s development. We use SWD data to investigate the occurrence and prevalence of TDS both within the vortices for each event, as well as cross-event comparisons. We find that TDS are more likely to occur on the magnetospheric side of the vortex intervals between compressed current sheets, particularly in the presence of turbulent magnetic field fluctuations and enhanced field-aligned currents. We also find that at positions of increasing anti-sunward distances along the flanks, the electric currents within the KHI become weaker, and TDS observed by the SWD become less prevalent.
The 8 September 2015 Kelvin-Helmholtz Event
The study of TDS in the KHI will begin with the September 8, 2015 event. This was the first KHI interval observed by MMS with enough periods to do statistical analysis of the instability. Previous studies of this event have shown magnetic reconnection on compressed current sheets (Eriksson et al., 2016a; Eriksson et al., 2016b), turbulence in the vortex-like intervals between the current sheets (Stawarz et al., 2016), and large-amplitude ion-acoustic waves in the plasma mixing regions on the magnetospheric side of the vortex-like intervals (Wilder et al., 2016a; Wilder et al., 2020).
Event Overview and Time Domain Structure Example
Figure 1 shows an overview of MMS survey data from 9:00–12:00 UT on September 8, 2015. Plasma data is from the MMS Fast Plasma Investigation (FPI) (Pollock et al., 2016), and magnetic field data comes from the fluxgate magnetometers (FGM) (Russel et al., 2016). At the beginning of the interval, MMS observed magnetospheric plasma, as evidenced by hot ions and electrons in the omni-directional spectra shown Figures 1A,B. At the end of the interval, cooler ions centered at a few hundred eV suggest MMS was in the magnetosheath. This can also be seen in Figure 1C where the ion and electron temperatures are higher at the beginning of the interval, and significantly lower at the end of the interval. Figure 1D shows the electron and ion number density, which was near 1 cm−3 when the spacecraft was in the magnetosphere, and near 20 cm−3 in the magnetosheath. Figure 1E shows the ion bulk velocity, Vi, in Geocentric Solar Ecliptic (GSE) coordinates. The x-component of Vi begins at 0 km/s at the beginning of the interval and rises to a value near −250 km/s (anti-sunward), consistent with magnetosheath plasma. Finally, Figure 1F shows the magnetic field vector, B, in GSE coordinates. The positive
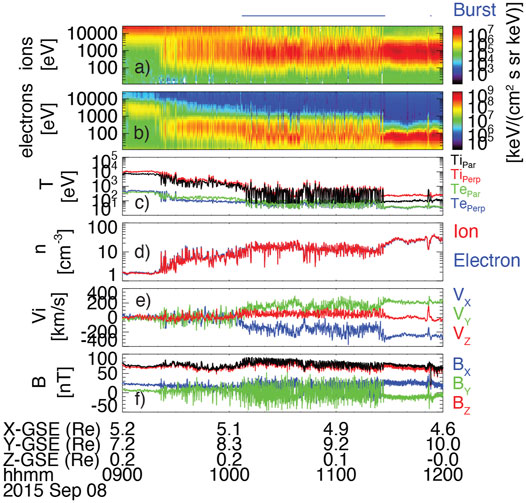
FIGURE 1. MMS survey data during the September 8, 2015 KHI event: (A) Ion omni-directional energy spectra, (B) electron omni-directional energy spectra, (C) electron and ion temperatures perpendicular (Perp) and parallel (Par) to the background magnetic field, (D) ion and electron number density, (E) ion bulk velocity in GSE coordinates, (F) magnetic field vector in GSE coordinates.
During the slow boundary layer crossing between the magnetosphere and magnetosheath, Figure 1 shows that the spacecraft periodically crossed back and forth between magnetosphere-like and magnetosheath-like plasma. This is most easily seen in the ion spectra (Figure 1A) and ion temperature (Figure 1C). This periodic motion becomes especially pronounced after about 10 UT. During this time, there are also periodic reversals in the
To show the structure of the KHI in more detail, Figure 2 shows a time series of burst data from MMS for three periods of the KHI from the September 8, 2015 event shown in Figure 1. From Figures 2A,B, there are three sudden transitions from hotter magnetosphere-like to cooler magnetosheath-like electrons and ions. Coincident with these transitions is a change in density from small (∼2–3 cm−3) to larger (∼20–30 cm−3) plasma densities, and a sudden change from higher to lower temperature in both the ions and electrons. Coinciding with each of these three temperature drops, there is a sharp reversal in
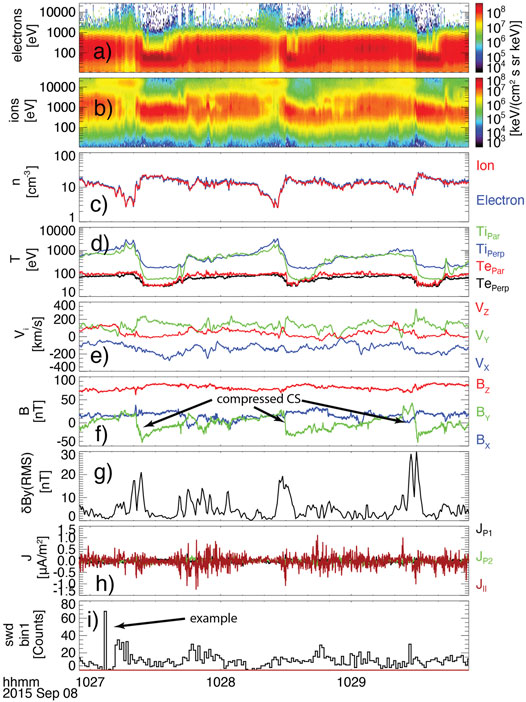
FIGURE 2. MMS data showing two periods of KHI during the September 8, 2015 event. (A) electron omni-directional energy spectra, (B) ion omni-directional energy spectra, (C) electron and ion number density, (D) electron and ion temperature perpendicular and parallel to the background magnetic field, (E) ion bulk velocity in GSE coordinates, (F) magnetic field vector in GSE coordinates, (G) dBY(RMS), (H) the electric current density in field-aligned coordinates, (I) swd bin 1 counts.
Between the compressed current sheets, there is a slow rotation of BY from negative back to positive. From Figures 2A,B, magnetosphere-like plasma begins to appear during this rotation. Additionally, there is high variability in
Figure 2I shows counts from the lowest amplitude bin (0.5–3 mV/m) from the on-board solitary wave detector (SWD) that is designed to detect ESWs in the burst data (up to 256 kSps). The SWD uses one pair of the spin-plane probes and a sliding window of 1/256th of a second, examining the time series electric field data in each window for spikes at least 4x above the pseudo-RMS (Ergun et al., 2016). The number of spike detections are summed over 1s intervals. A version of this algorithm has been checked against THEMIS data and found to detect about 70% of ESWs with a less than 10% false positive rate (Andersson et al., 2009). These spikes are sorted into four amplitude bins: 0.5–3, 3–12, 12–50, and 50 + mV/m, with an instrument saturation at 500 mV/m. In the September 8, 2015 event, the lowest amplitude bin had almost all of the counts, but this is likely due to the fact that the magnetic field has a large Z-GSE component, and therefore, only a small portion of the parallel electric field will map to a single spin-plane probe pair that is mostly aligned with the X-Y GSE plane. Therefore, the present study will focus on counts from the SWD algorithm rather than the individual amplitude bins. Throughout the interval there is significant variability in the detection of solitary waves, with many of the largest-count intervals occurring in the “vortex” intervals between the compressed current sheet.
As an example of what the SWD detects, Figure 3 shows MMS burst data surrounding the interval with the largest number of counts (>60). From Figure 3A, it can be seen that during the interval with high counts, the electric current density is dominated by
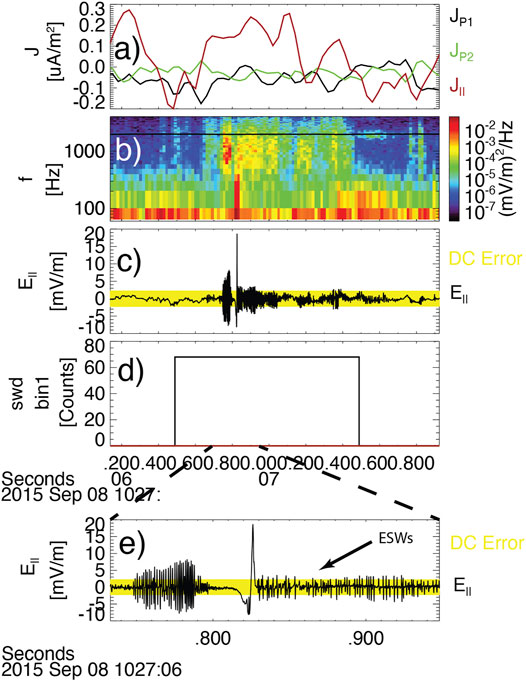
FIGURE 3. Zoom on burst data for the interval with highest SWD counts from Figure 2. (A) electric current density in field-aligned coordinates, (B) electric field power spectral density, (C) parallel electric field at 8,192 Samples/s, (D) SWD bin1 counts, (E) zoom on the data from (C) to showcase ESWs.
Solitary Wave Detector Statistics
From Figure 2, it is apparent that the SWD detects TDS throughout the three periods of the KHI, with a high variability in count levels. Additionally, the presence of turbulent cascades in the vortex intervals suggests that the behavior of the instability is highly stochastic, therefore, statistical analysis of SWD detections is needed to determine their occurrence with respect to the larger structure of the KHI. To do this, we calculated 1s averages of plasma data which provides information about the position within the KHI to match the cadence of the SWD. All data comes from the burst interval between 10:07 and 11:27 UT in order to ensure that the time cadence of FPI can be reliably interpolated to the SWD cadence. This is also the interval where the compressed current sheets were observed by (Eriksson et al., 2016a). Histograms of these data are shown by the blue lines in Figure 4. These data in Figure 4 include 1) the magnetic field BY (GSE) component, 2) the total ion temperature,
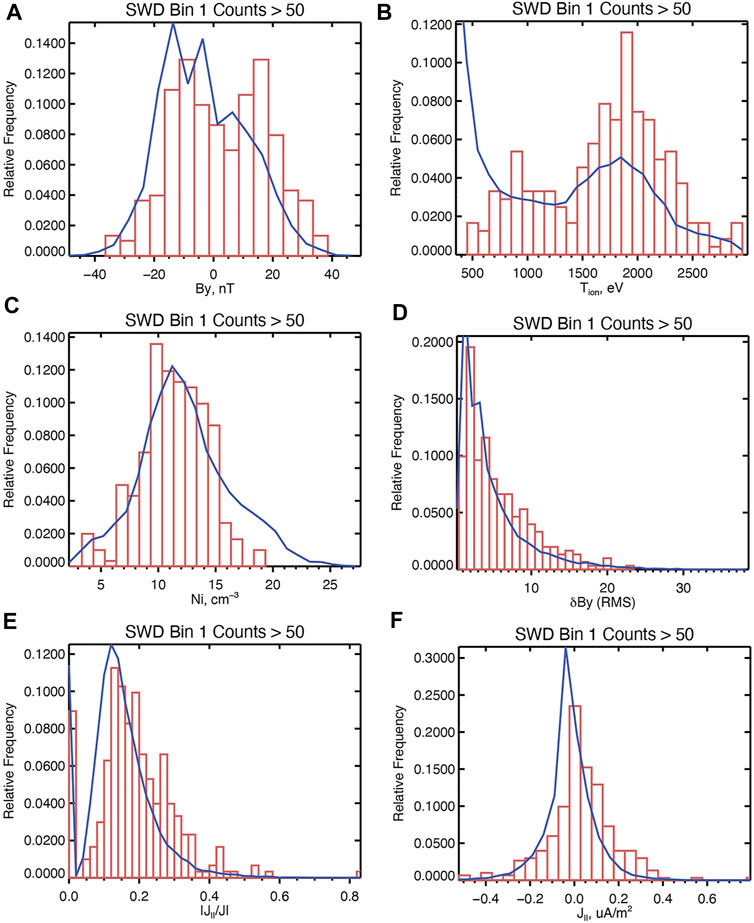
FIGURE 4. Histograms of magnetic field and plasma quantities during the September 8, 2015 burst interval for (red bars) 1s intervals with SWD bin1 counts greater than 50 and (blue line) all 1s intervals during the burst selections. (A) Magnetic field GSE BY, (B) Ion temperature, Tion, (C) Ion number density, Ni, (D) δBY,RMS, (E) |J∥/J|, (F) J∥.
The magnetic field
In addition to identifying the presence of compressed current sheets,
Kelvin-Helmholtz Events Further Down the Flanks
The KHI event on September 8, 2015 was observed in the post-noon sector, and therefore was likely early in the development of the KHI. In order to understand how the prevalence and location of TDS evolve as the instability evolves, the analysis in Solitary Wave Detector Statistics is repeated for events further down the Earth’s magnetospheric flank. We introduce two additional KHI events: one on September 27, 2016 and one on September 26, 2017. Figure 5 shows MMS survey data for the two additional events, given in the same format as Figure 1. The September 27, 2016 event was first reported by (Tang et al., 2018). The interval from 19:50–20:06 UT, while shorter in duration than the September 8, 2015 observations, shows similar activity. Specifically, there are periodic boundary crossings apparent in the ion and electron spectra and temperature. There were also periodic reversals in the magnetic field GSE BY component. One significant difference between the September 27, 2016 event and the September 8, 2015 event was that the periodic fluctuations in the anti-sunward (-VX) component of the flow were much larger compared to the maximum negative value than in the September 8, 2015, suggesting more “rolled up” conditions. This will be investigated further in Event Comparison.
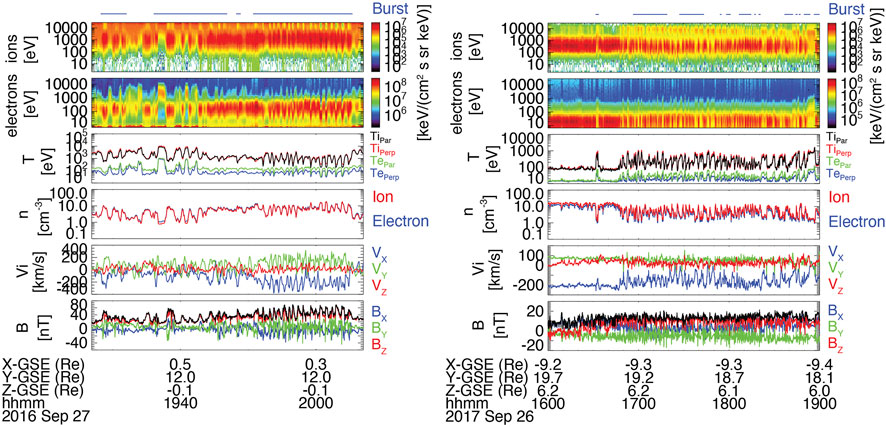
FIGURE 5. Overview of additional KHI events observed by MMS on (left) September 27, 2016 and (right) September 26, 2016. Both are given in the same format as Figure 1.
The September 26, 2017 event has, to our knowledge, not been previously reported. From Figure 5, there are some immediate similarities with the other events. First, between 16:50 and 19:00 UT, there were periodic boundary crossings apparent in the ion and electron spectra and temperature, as well as the plasma density, with a dominant periodicity of 230°s, which is longer than the terminator event (∼45°s) (Tang et al., 2018) One difference is that the reductions in the anti-sunward flow are even more significant than in the other two events. The challenge in analyzing this event is that immediately after this event is that immediately after the plotted interval in Figure 5, the MMS exited fast survey mode, and therefore the complete crossing into the magnetospheric side of the boundary was not recorded. This makes linear growth analysis difficult; however, given the similarities with the other events, as well as behavior consistent with rolled up vortices (Event Comparison), the interval is likely a KHI event.
Figure 6 shows the locations of the MMS constellation in the X-Y GSE plane when it observed the three events, with the dashed line being the nominal magnetopause as determined by (Shue et al., 1997). From Figure 6 it is clear that the magnetosphere was more compressed than usual, since all three spacecraft observed the magnetopause inside the nominal location. Additionally, the three events exist on three different positions along the flanks. The September 8, 2015 event previously discussed is in the post-noon sector but still on the dayside and will be referred to as the “post-noon” event henceforth. The September 27, 2016 event was near the dusk terminator (X ∼ 0 Re) and will be referred to as the “terminator” event. Finally, the September 26, 2017 event was approximately −9 Re down the dusk flank and will be referred to as the “down-tail” event. For the terminator and down-tail events, the MMS burst data coverage is less frequent than in the post-noon event; however, the burst selections that were downlinked still managed to capture 16 and 25 periods for the terminator and down-tail events, respectively.
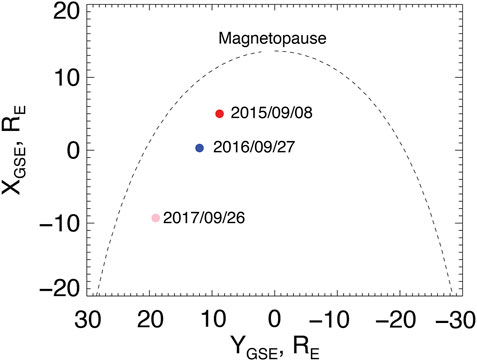
FIGURE 6. The location of MMS in the X-Y GSE plane during the three KHI events shown in this study. The dashed line shows the nominal magnetopause from Shue et al. (1997).
Figure 7 shows solar wind conditions for each event from the OMNI database (King and Papitashvili, 2005). All three events exhibit northward IMF BZ conditions, although the downtail exhibits a brief southward turning of the IMF. The relative strength of BX, BY, and BZ also varies between events, with the September 8, 2015 being the most IMF BZ-dominant. The solar wind was fastest during the post-noon event, and slowest during the downtail event. Because each event is occurring during a different year and under different solar wind conditions, it is impossible to do a one-to-one comparison, however, it is worth comparing events at different positions and under different IMF conditions to determine how the behavior of TDS in the KHI varies. One thing that can be quantified is the state of vortex rollup for each event, which is discussed in Event Comparison.
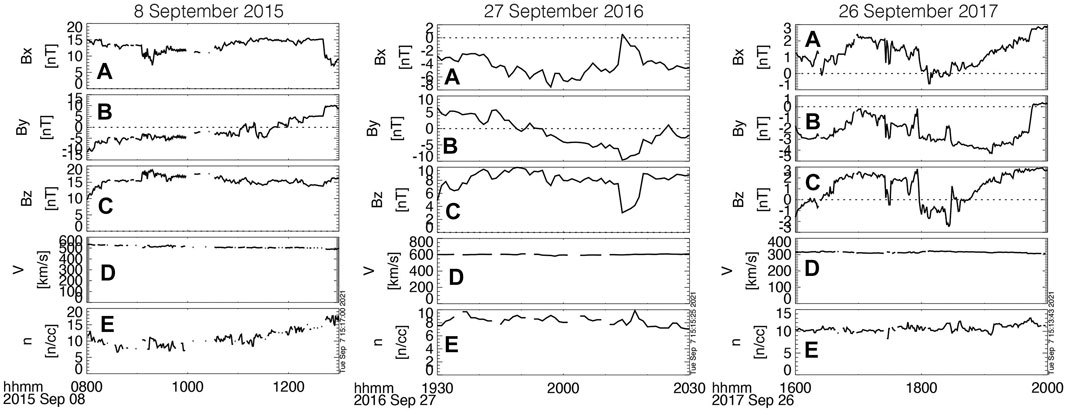
FIGURE 7. Solar wind conditions from OMNI during the (left) September 8, 2015 (center) September 27, 2016, and (right) September 26, 2017 events. Panels include (A) interplanetary magnetic field (IMF) BX GSE component, (B) IMF BY GSE component, (C) IMF BZ GSE component, (D) solar wind bulk speed, (E) solar wind proton number density.
Event Comparison
From Figure 5, there are some similarities between the post-noon event and the two events further down the flank. In all three, there are periodic crossings of the boundary as seen in the spectra, temperature and density plots. Additionally, both events show frequent reversals of the
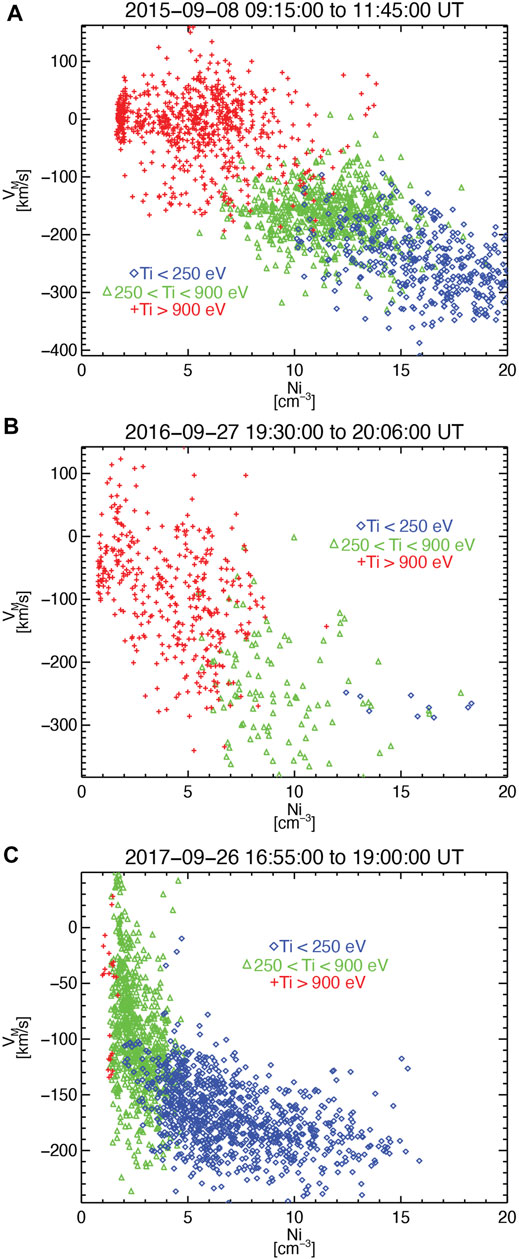
FIGURE 8. VM vs. plasma number density color coded by ion temperature, for three K-Helmholtz intervals on (A) 2015-09-08, (B) 2016-09-27, and (C) 2017-09-26.
Since the three events at different positions along the flanks exhibit different amounts of “rollup” in the vortices, they can be used to study the occurrence and prevalence of TDS at different stages of the instability. Figure 9 shows histograms of SWD bin 1 counts for all three events. The time interval used for the post-noon event was the 10:07–11:27 UT burst interval studied by (Eriksson et al., 2016a). For the terminator event, the time period from 19:50–20:06 UT was used, which was the most similar in behavior to the post-noon event. For the downtail event, times from 16:50–19:00 UT were used, which was when periodic boundary crossings comparable to the other two events were observed. From Figure 5, contiguous burst data was not available, and so only times when burst selections were made were used. Comparing Figures 9A,B, the post-noon and terminator events show comparable prevalence of SWDs. One difference with the terminator event is that there are significantly more counts found in bin 2 (not shown) than in the post-noon event. This suggests that there was more ESW activity in the terminator event, which could point to the presence of more kinetic instabilities in the non-linear stage in this event. This can also be seen in the number of 1s intervals where the SWD counts exceeded 50, which were 358 out of 3,280, or ∼11% of intervals. For the down-tail event, shown in Figure 9C, the SWD counts were much lower. There were no intervals where the counts exceeded 50. Using a much smaller threshold of 10 counts, we found 41 out of the 11,200 1s intervals, or 0.3%. This suggests that TDS activity was extremely rare during the event.
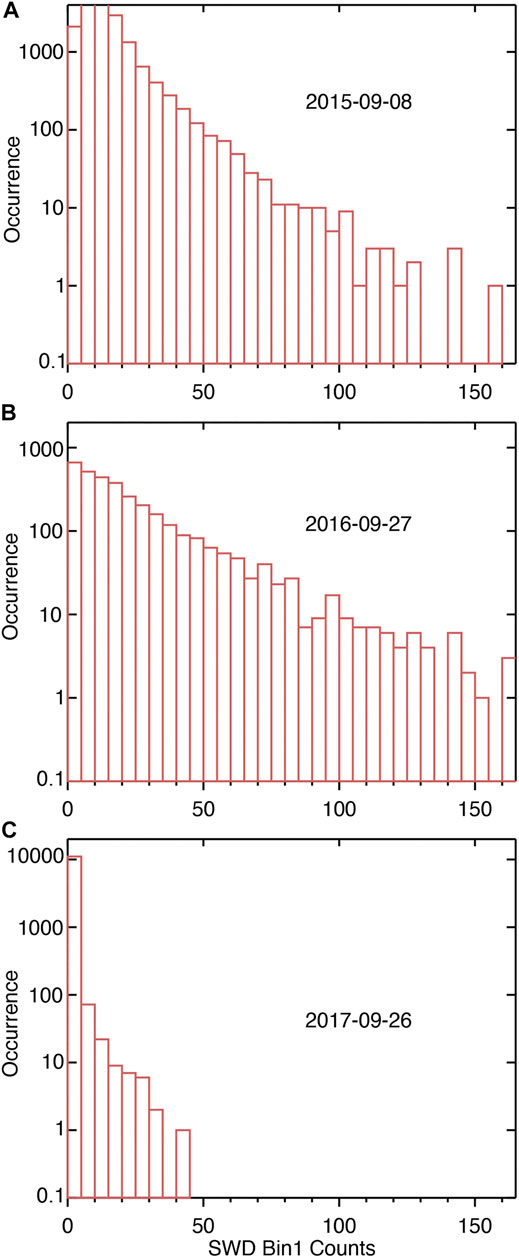
FIGURE 9. Histograms of SWD bin 1 counts for the three KHI intervals on (A) 2015-09-08, (B) 2016-09-27, and (C) 2017-09-26.
Figure 10 shows histograms of the magnitude of electric current density measured by FPI for all three events using the same time ranges as Figure 9. From Figure 10, the post-noon event exhibits the strongest currents and the electric current density on average becomes weaker for observations at increasing anti-sunward distances along the flank. Since from Figures 4E,F, high SWD counts tend to occur in the presence of large field-aligned current, one expects the SWD counts to be lower for the down-tail event, and this could be one explanation of the low prevalence of solitary waves shown in Figure 8C. One possible explanation for this is that as one moves further down the flanks, the vortices may grow in size. Additionally, the magnetic field on the magnetospheric side becomes weaker. These two conspire to reduce
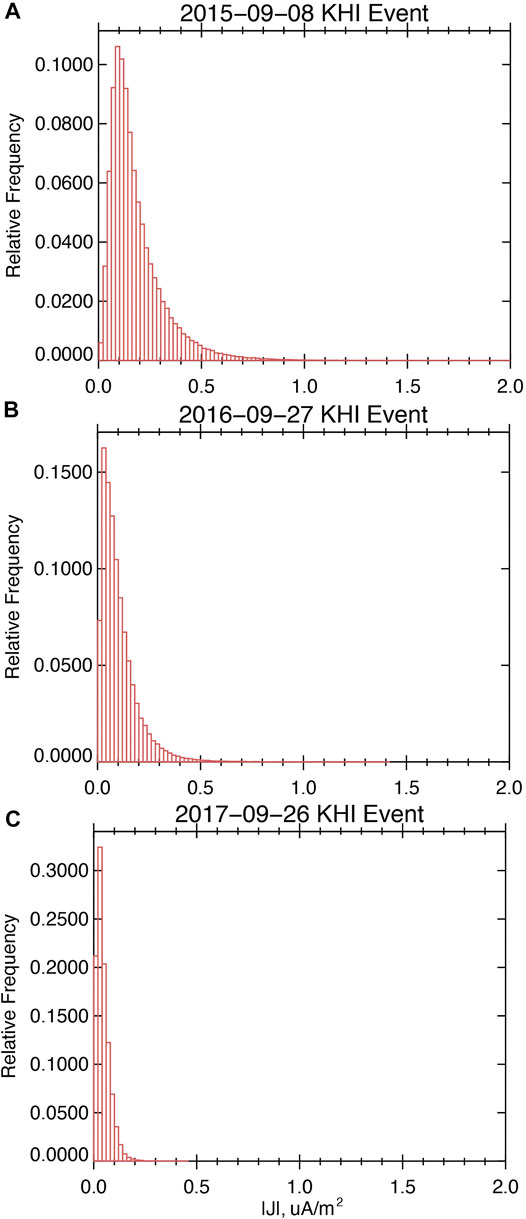
FIGURE 10. Histograms of electric current density, measured using data from the Fast Plasma Investigation (FPI) for the three KHI intervals on (A) 2015-09-08, (B) 2016-09-27, and (C) 2017-09-26.
Solitary Wave Detector Statistics
In order to compare the occurrence of solitary waves in the terminator and down-tail event with the post-noon event, the analysis from Solitary Wave Detector Statistics is repeated for each event. Figure 11 shows histograms of plasma parameters during the post-noon event, given in the same format as Figure 4, using the burst interval from 19:50 to 20:06 UT. This burst interval was chosen because it was when the periodicity was most apparent, as well as the presence of reversals in the BY. This allows for more ready comparison to the September 8, 2015 event. From Figure 11, several similarities between the post-noon event and the terminator event are apparent. First, from Figure 11A, there is still a bias in the high SWD count events towards positive
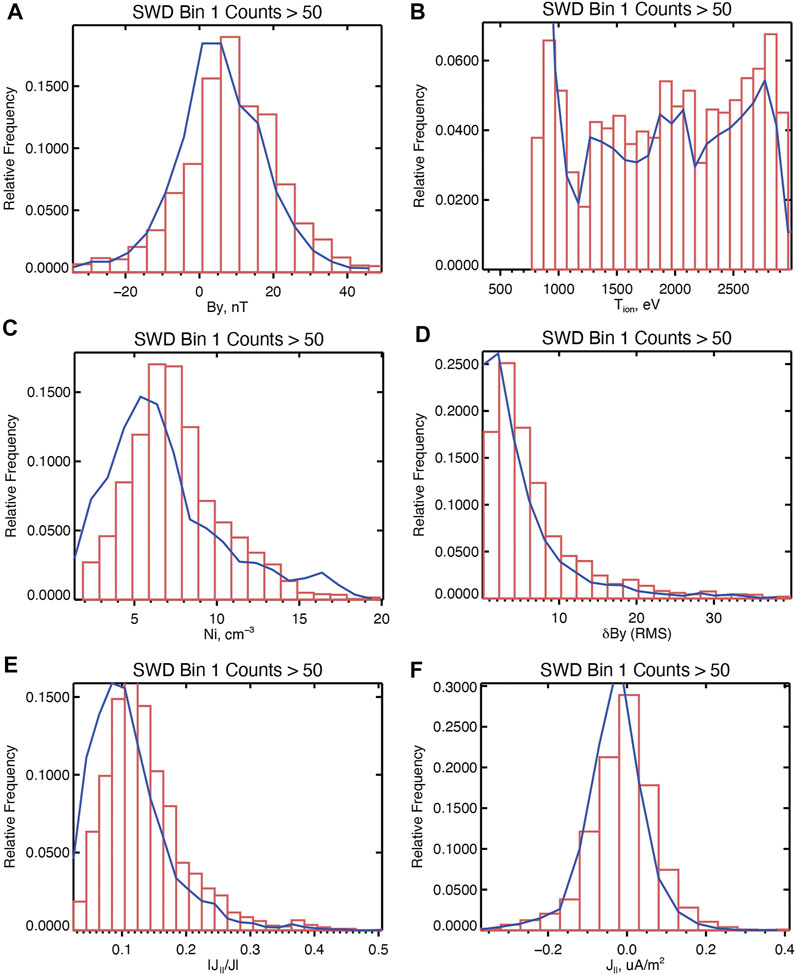
FIGURE 11. Histograms of magnetic field and plasma quantities during the September 27, 2016 burst interval, given in the same format as Figure 4. (A) Magnetic field GSE BY, (B) Ion temperature, Tion, (C) Ion number density, Ni, (D) δBY,RMS, (E) |J∥/J|, (F) J∥.
Figure 12 shows histograms for the down-tail event given in the same format as Figures 4, 11, using all burst data between 16:50 to 18:20 UT. For Figure 12, the threshold for “high SWD counts” for bin 1 was reduced to 10, given the reduced prevalence in solitary wave activity shown in Figure 9. Several similarities and several differences are immediately apparent. First, for the overall event, the temperatures were significantly lower and the
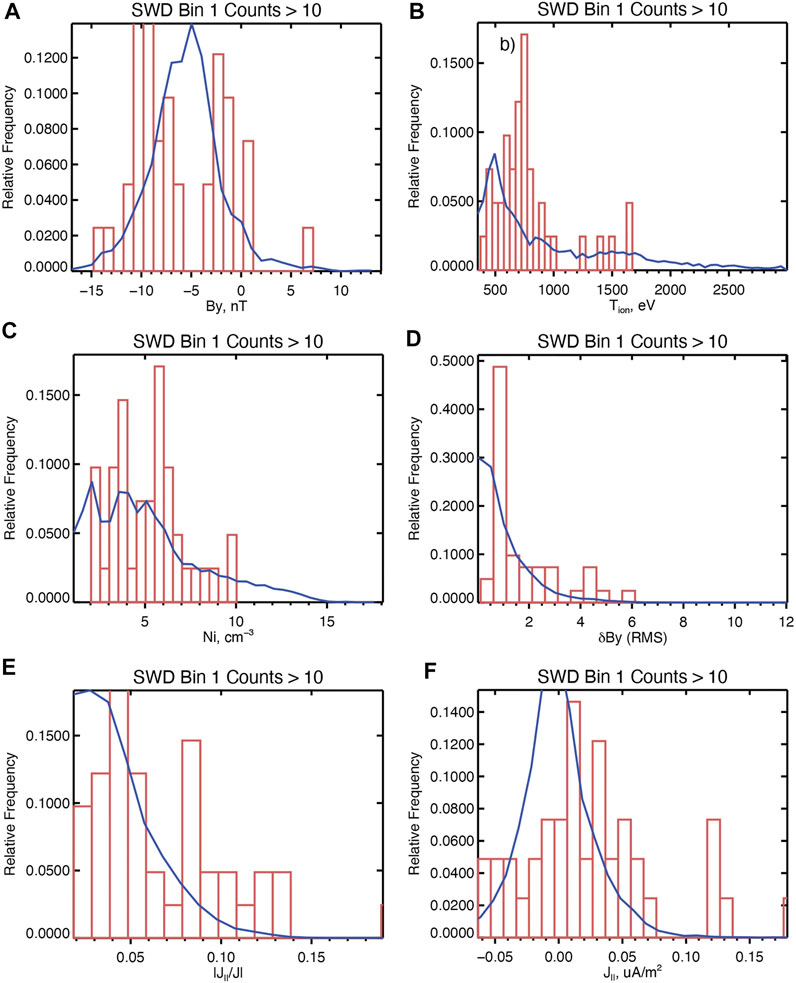
FIGURE 12. Histograms of magnetic field and plasma quantities during the September 26, 2017 burst interval, given in the same format as Figure 4. (A) Magnetic field GSE BY, (B) Ion temperature, Tion, (C) Ion number density, Ni, (D) δBY,RMS, (E) |J∥/J|, (F) J∥.
Summary and Conclusion
In this study, we investigated the occurrence and prevalence of time domain structures (TDS) in the Kelvin-Helmholtz instability (KHI) observed by MMS at different positions along the dusk magnetospheric flank. The events investigated included an event observed in the post-noon sector on September 8, 2015, one near the dusk terminator on September 27, 2016 and one further down the magnetospheric flanks on September 26, 2017. In each event, a different stage of the instability’s development were observed, with the post-noon event including the least rolled up vortices, and the down-tail event having the most. To investigate the location of TDS in the vortices for each event, we used data from the MMS mission’s on-board solitary wave detector (SWD) algorithm (Ergun et al., 2016). For each event, we identified 1s intervals where the SWD counts exceeded a threshold, and then investigated the plasma parameters where these intervals were most likely to occur.
In the post-noon event, it was shown that intervals with high SWD counts were more likely to be on the magnetospheric side of the “vortex” intervals between the compressed current sheets. This was similar to the observations of ion-acoustic waves during the post-noon event, which found the waves were most likely to occur on the magnetospheric side (Wilder et al., 2020). One difference between the prevalence of TDS and ion-acoustic waves is that the latter did not appear to have any correlation with the presence of magnetic fluctuations, while in the present study, intervals with high SWD counts were more likely to be seen when moderate-to-large (10–20 nT) RMS fluctuations in the magnetic field normal to the magnetopause boundary. It was also shown that high SWD count intervals were more likely to be observed during times when the field-aligned current was significant compared to the total current density. This is consistent with the idea that the instabilities and processes that can drive TDS (e.g., double layers, streaming instabilities) are likely to occur in the presence of strong FACs (Ergun et al., 2001; Mozer et al., 2014). One surprising result was that the intervals with high SWD counts were more likely to occur on positive field-aligned currents, while the compressed current sheets are negative. This suggests that the processes that drive TDS in the KHI are more likely to occur inside the vortices rather than on the compress current sheets on the edge. Also—since the TDS seem to occur in the presence of currents, while the previously-reported ion-acoustic waves do not, the present study supports the hypothesis by (Wilder et al., 2016a, Wilder et al., 2020) that the ion-acoustic waves in the KHI are driven by plasma mixing rather than being current-driven.
One immediate difference between the three events was that the down-tail event had significantly less SWD counts than the post-noon and terminator. Consistent with this, MMS also observed increasingly weak electric current densities as the KHI evolved towards more rolled up vortices. It is unclear why this happens, but one hypothesis is that as the KHI evolves along the flank, the smaller-scale turbulent features largely dissipate by the time the vortices reach an anti-sunward distance of −10 Re from the terminator. Another hypothesis is that the vortices may grow in size as they propagate down the flanks, and since the magnetic field also becomes weaker at increasing distance from Earth, the electric current densities become smaller by way of Ampere’s law. This is consistent with the reduced SWD counts in the down-tail event, as for all three events, the intervals with higher SWD counts were more likely to occur in the presence of field-aligned currents. More events along the flanks need to be studied to understand the difference in electric current density between observations of the KHI at different positions along the flanks.
The importance of the KHI for magnetospheric physics is that it is thought to be one of the mechanisms by which energy and momentum are transferred from the solar wind to the magnetosphere Axford and Hines, 1961; Kavosi and Raeder, 2015. Exactly how this transfer is facilitated is a topic of ongoing research. Suggested mechanisms include magnetic reconnection (Nykyri and Otto, 2001; Nakamura et al., 2013, Eriksson et al., 2016a) and diffusion via particles interacting with waves, such as lower hybrid waves (Tang et al., 2018). Turbulent cascades have also been observed within the vortices (Stawarz et al., 2016), and it is unclear how they impact the overall mass-energy transfer in the KHI. It has long been suggested that time domain structures and parallel electric fields may be a mechanism by which turbulent cascades can be dissipated. For example, electron phase space holes and double layers have been observed in the bursty bulk flow braking region, where magnetic field spectra consistent with a turbulent cascade were observed (Ergun et al., 2014; Stawarz et al., 2015) The present study shows that TDS tend to occur on the magnetospheric side of the vortices near strong fluctuations in the magnetic field and field-aligned currents, which suggests that the processes that lead to their occurrence are also likely to happen there. Future studies should investigate what these processes and instabilities that lead to the presence of TDS are, and what role they play in the overall mass/energy transfer between the solar wind and magnetosphere, as well as the dissipation of turbulence on the flanks.
Data Availability Statement
Publicly available datasets were analyzed in this study. This data can be found here: https://lasp.colorado.edu/mms/sdc/public/.
Author Contributions
FW performed the bulk of the analysis and wrote the paper, RE developed the SWD algorithm, DG and SE identified KHI events for study, PH and DM assisted in validating the SWD algorithm, NA calibrated the electric field booms, JB and RT confirmed appropriate use of MMS data and worked as scientist in the loop to identify events, RS calibrated the magnetometer, BG calibrated the fast plasma investigation.
Funding
This work was funded by the NASA MMS project and NASA Grant 80NSSC18K1359.
Conflict of Interest
The authors declare that the research was conducted in the absence of any commercial or financial relationships that could be construed as a potential conflict of interest.
Publisher’s Note
All claims expressed in this article are solely those of the authors and do not necessarily represent those of their affiliated organizations, or those of the publisher, the editors and the reviewers. Any product that may be evaluated in this article, or claim that may be made by its manufacturer, is not guaranteed or endorsed by the publisher.
References
Andersson, L., Ergun, R. E., Tao, J., Roux, A., LeContel, O., Angelopoulos, V., et al. (2009). New Features of Electron Phase Space Holes Observed by the THEMIS mission. Phys. Rev. Lett. 102, 225004. doi:10.1103/PhysRevLett.102.225004
Axford, W. I., and Hines, C. O. (1961). A Unifying Theory of High-Latitude Geophysical Phenomena and Geomagnetic Storms. Can. J. Phys. 39, 1433–1464. doi:10.1139/p61-172
Ergun, R. E., Goodrich, K. A., Stawarz, J. E., Andersson, L., and Angelopoulos, V. (2015). Large-amplitude Electric fields Associated with Bursty Bulk Flow Braking in the Earth’s Plasma Sheet. J. Geophys. Res. Space Phys. 120, 1832–1844. doi:10.1002/2014JA020165
Ergun, R. E., Su, Y.-J., Andersson, L., Carlson, C. W., McFadden, J. P., Mozer, F. S., et al. (2001). Direct Observation of Localized Parallel Electric fields in a Space Plasma. Phys. Rev. Lett. 87, 045003. doi:10.1103/PhysRevLett.87.045003
Ergun, R. E., Tucker, S., Westfall, J., Goodrich, K. A., Malaspina, D. M., Summers, D., et al. (2016). The Axial Double Probe and Fields Signal Processing for the MMS Mission. Space Sci. Rev. 199, 167–188. doi:10.1007/s11214-014-0115-x
Eriksson, S., Lavraud, B., Wilder, F. D., Stawarz, J. E., Giles, B. L., Burch, J. L., et al. (2016a). Magnetospheric Multiscale Observations of Magnetic Reconnection Associated with Kelvin-Helmholtz Waves. Geophys. Res. Lett. 43, 5606–5615. doi:10.1002/2016GL068783
Eriksson, S., Wilder, F. D., Ergun, R. E., Schwartz, S. J., Cassak, P. A., Burch, J. L., et al. (2016b). Magnetospheric Multiscale Observations of the Electron Diffusion Region of Large Guide Field Magnetic Reconnection. Phys. Rev. Lett. 117, 1. doi:10.1103/PhysRevLett.117.015001
Graham, D. B., Khotyaintsev, Y. V., Vaivads, A., and André, M. (2016). Electrostatic Solitary Waves and Electrostatic Waves at the Magnetopause. J. Geophys. Res. Space Phys. 121, 3069–3092. doi:10.1002/2015JA021527
Hansel, P., Wilder, F., Malaspina, D., Ergun, R., Ahmadi, N., Holmes, J., et al. (2021). Mapping MMS Observations of Solitary Waves in Earth’s Magnetic Field. J. Geophys. Res. 1, 1. Under Review.
Hasegawa, H., Fujimoto, M., Phan, T.-D., Rème, H., Balogh, A., Dunlop, M. W., et al. (2004). Transport of Solar Wind into Earth's Magnetosphere through Rolled-Up Kelvin-Helmholtz Vortices. Nature 430, 755–758. doi:10.1038/nature02799
Holmes, J. C., Ergun, R. E., Nakamura, R., Roberts, O., Wilder, F. D., and Newman, D. L. (2019). Structure of Electron‐Scale Plasma Mixing along the Dayside Reconnection Separatrix. J. Geophys. Res. Space Phys. 124, 8788–8803. doi:10.1029/2019JA026974
Johnson, J. R., Wing, S., and Delamere, P. A. (2014). Kelvin Helmholtz Instability in Planetary Magnetospheres. Space Sci. Rev. 184, 1–31. doi:10.1007/s11214-014-0085-z
Karimabadi, H., Roytershteyn, V., Wan, M., Matthaeus, W. H., Daughton, W., Wu, P., et al. (2013). Coherent Structures, Intermittent Turbulence, and Dissipation in High-Temperature Plasmas. Phys. Plasmas 20 (1), 012303. doi:10.1063/1.4773205
Kavosi, S., and Raeder, J. (2015). Ubiquity of Kelvin-Helmholtz Waves at Earth's Magnetopause. Nat. Commun. 6, 7019. doi:10.1038/ncomms8019
Lindqvist, P.-A., Olsson, G., Torbert, R. B., King, B., Granoff, M., Rau, D., et al. (2016). The Spin-Plane Double Probe Electric Field Instrument for MMS. Space Sci. Rev. 199, 137–165. doi:10.1007/s11214-014-0116-9
Main, D. S., Newman, D. L., and Ergun, R. E. (2006). Double Layers and Ion Phase-Space Holes in the Auroral Upward-Current Region. Phys. Rev. Lett. 97, 185001. doi:10.1103/PhysRevLett.97.185001
Mozer, F. S., Agapitov, O., Krasnoselskikh, V., lejosne, S., Reeves, G. D., and Roth, I. (2014). Direct Observation of Radiation-Belt Electron Acceleration from Electron-Volt Energies to Megavolts by Nonlinear Whistlers. Phys. Rev. Lett. 113, 035001. doi:10.1103/PhysRevLett.113.035001
Mozer, F. S., Agapitov, O. V., Artemyev, A., Drake, J. F., Krasnoselskikh, V., Lejosne, S., et al. (2015). Time Domain Structures: What and where They Are, what They Do, and How They Are Made. Geophys. Res. Lett. 42, 3627–3638. doi:10.1002/2015GL063946
Muschietti, L., Ergun, R. E., Roth, I., and Carlson, C. W. (1999). Phase-space Electron Holes along Magnetic Field Lines. Geophys. Res. Lett. 26, 1093–1096. doi:10.1029/1999GL900207
Muschietti, L., Roth, I., Carlson, C. W., and Ergun, R. E. (2000). Transverse Instability of Magnetized Electron Holes. Phys. Rev. Lett. 85, 94–97. doi:10.1103/PhysRevLett.85.94
Nakamura, T. K. M., Daughton, W., Karimabadi, H., and Eriksson, S. (2013). Three-dimensional Dynamics of Vortex-Induced Reconnection and Comparison with THEMIS Observations. J. Geophys. Res. Space Phys. 118, 5742–5757. doi:10.1002/jgra.50547
Nakamura, T. K. M., and Daughton, W. (2014). Turbulent Plasma Transport across the Earth's Low‐latitude Boundary Layer. Geophys. Res. Lett. 41 (24), 8704–8712. doi:10.1002/2014gl061952
Newman, D., Goldman, M., Ergun, R., and Mangeney, A. (2001). Formation of Double Layers and Electron Holes in a Current-Driven Space Plasma. Phys. Rev. Lett. 87, 255001. doi:10.1103/PhysRevLett.87.255001
Nykyri, K., and Otto, A. (2001). Plasma Transport at the Magnetospheric Boundary Due to Reconnection in Kelvin-Helmholtz Vortices. Geophys. Res. Lett. 28, 3565–3568. doi:10.1029/2001GL013239
Phan, T. D., Eastwood, J. P., Shay, M. A., Drake, J. F., Sonnerup, B. U. Ö., Fujimoto, M., et al. (2018). Electron Magnetic Reconnection without Ion Coupling in Earth's Turbulent Magnetosheath. Nature 557, 202–206. doi:10.1038/s41586-018-0091-5
Pollock, C., Moore, T., Jacques, A., Burch, J., Gliese, U., Saito, Y., et al. (2016). Fast Plasma Investigation for Magnetospheric Multiscale. Space Sci. Rev. 199, 331. doi:10.1007/s11214-016-0245-4
Russell, C. T., Anderson, B. J., Baumjohann, W., Bromund, K. R., Dearborn, D., Fischer, D., et al. (2016). The Magnetospheric Multiscale Magnetometers. Space Sci. Rev. 1, 1. doi:10.1007/s11214-014-0057-3
Sharma Pyakurel, P., Shay, M. A., Phan, T. D., Matthaeus, W. H., Drake, J. F., TenBarge, J. M., et al. (2019). Transition from Ion-Coupled to Electron-Only Reconnection: Basic Physics and Implications for Plasma Turbulence. Phys. Plasmas 26, 082307. doi:10.1063/1.5090403
Shue, J.-H., Chao, J. K., Fu, H. C., Russell, C. T., Song, P., Khurana, K. K., et al. (1997). A New Functional Form to Study the Solar Wind Control of the Magnetopause Size and Shape. J. Geophys. Res. 102 (A5), 9497–9511. doi:10.1029/97JA00196
Stawarz, J. E., Ergun, R. E., and Goodrich, K. A. (2015). Generation of High-Frequency Electric Field Activity by Turbulence in the Earth's Magnetotail. J. Geophys. Res. Space Phys. 120, 1845–1866. doi:10.1002/2014JA020166
Stawarz, J. E., Eriksson, S., Wilder, F. D., Ergun, R. E., Schwartz, S. J., Pouquet, A., et al. (2016). Observations of Turbulence in a Kelvin-Helmholtz Event on 8 September 2015 by the Magnetospheric Multiscale mission. J. Geophys. Res. Space Phys. 121, 021–111. doi:10.1002/2016JA023458
Tang, B., Li, W., Wang, C., Dai, L., Khotyaintsev, Y., Lindqvist, P.-A., et al. (2018). Magnetic Depression and Electron Transport in an Ion-Scale Flux Rope Associated with Kelvin-Helmholtz Waves. Ann. Geophys. 36, 879–889. doi:10.5194/angeo-36-879-2018
Wilder, F. D., Ergun, R. E., Eriksson, S., Phan, T. D., Burch, J. L., Ahmadi, N., et al. (2017). Multipoint Measurements of the Electron Jet of Symmetric Magnetic Reconnection with a Moderate Guide Field. Phys. Rev. Lett. 118 (26), 1. doi:10.1103/PhysRevLett.118.265101
Wilder, F. D., Ergun, R. E., Goodrich, K. A., Goldman, M. V., Newman, D. L., Malaspina, D. M., et al. (2016b). Observations of Whistler Mode Waves with Nonlinear Parallel Electric fields Near the Dayside Magnetic Reconnection Separatrix by the Magnetospheric Multiscale mission. Geophys. Res. Lett. 43, 5909–5917. doi:10.1002/2016GL069473
Wilder, F. D., Ergun, R. E., Hoilijoki, S., Webster, J., Argall, M. R., Ahmadi, N., et al. (2019). A Survey of Plasma Waves Appearing Near Dayside Magnetopause Electron Diffusion Region Events. J. Geophys. Res. Space Phys. 124, 7837–7849. doi:10.1029/2019JA027060
Wilder, F. D., Ergun, R. E., Schwartz, S. J., Newman, D. L., Eriksson, S., Stawarz, J. E., et al. (2016a). Observations of Large-Amplitude, Parallel, Electrostatic Waves Associated with the Kelvin-Helmholtz Instability by the Magnetospheric Multiscale mission. Geophys. Res. Lett. 43, 8859–8866. doi:10.1002/2016GL070404
Keywords: Kelvin–Helmholtz instability, flank magnetopause, electrostatic solitary waves, satellite observation, magnetospheric multiscale (MMS)
Citation: Wilder FD, Ergun RE, Gove D, Eriksson S, Hansel P, Ahmadi N, Malaspina DM, Burch JL, Torbert RB, Strangeway RJ and Giles BL (2021) The Occurrence and Prevalence of Time Domain Structures in the Kelvin-Helmholtz Instability at Different Positions Along the Earth’s Magnetospheric Flanks. Front. Astron. Space Sci. 8:756563. doi: 10.3389/fspas.2021.756563
Received: 10 August 2021; Accepted: 17 September 2021;
Published: 15 October 2021.
Edited by:
Simon Wing, Johns Hopkins University, United StatesReviewed by:
Adam Michael, Johns Hopkins University, United StatesAlexei V. Dmitriev, Lomonosov Moscow State University, Russia
Copyright © 2021 Wilder, Ergun, Gove, Eriksson, Hansel, Ahmadi, Malaspina, Burch, Torbert, Strangeway and Giles. This is an open-access article distributed under the terms of the Creative Commons Attribution License (CC BY). The use, distribution or reproduction in other forums is permitted, provided the original author(s) and the copyright owner(s) are credited and that the original publication in this journal is cited, in accordance with accepted academic practice. No use, distribution or reproduction is permitted which does not comply with these terms.
*Correspondence: F. D. Wilder, ZnJlZGVyaWNrLndpbGRlckB1dGEuZWR1
 F. D. Wilder
 R. E. Ergun2,3
 N. Ahmadi
 D. M. Malaspina
 J. L. Burch