 Larry. R. Lyons
 Yukitoshi Nishimura
 Chih-Ping Wang
 Jiang Liu1,3
- 1Department of Atmospheric and Oceanic Sciences, University of California Los Angeles, Los Angeles, CA, United States
- 2Center for Space Physics and Department of Electrical and Computer Engineering, Boston University, Boston, MA, United States
- 3Department of Earth, Planetary, and Space Sciences, University of California Los Angeles, Los Angeles, CA, United States
- 4Department of Meteorology and Atmospheric Science, 621 Walker Building, The Pennsylvania State University, State College, PA, United States
Flow bursts are a major component of transport within the plasma sheet and auroral oval (where they are referred to as flow channels), and lead to a variety of geomagnetic disturbances as they approach the inner plasma sheet (equatorward portion of the auroral oval). However, their two-dimensional structure as they approach the inner plasma sheet has received only limited attention. We have examined this structure using both the Rice Convection Model (RCM) and ground-based radar and all sky imager observations. As a result of the energy dependent magnetic drift, the low entropy plasma of a flow burst spreads azimuthally within the inner plasma sheet yielding specific predictions of subauroral polarization stream (SAPS) and dawnside auroral polarization stream (DAPS) enhancements that are related to the field-aligned currents associated with the flow channel. Flow channels approximately centered between the dawn and dusk large-scale convection cells are predicted to give significant enhancements of both SAPS and DAPS, whereas flow channel further toward the dusk (dawn) convection cell show a far more significant enhancement of SAPS (DAPS) than for DAPS (SAPS). We present observations for cases having good coverage of flow channels as they approach the equatorward portion of the auroral oval and find very good qualitative agreement with the above RCM predictions, including the predicted differences with respect to flow burst location. Despite there being an infinite variety of flow channels’ plasma parameters and of background plasma sheet and auroral oval conditions, the observations show the general trends predicted by the RCM simulations with the idealized parameters. This supports that RCM predictions of the azimuthal spread of a low-entropy plasma sheet plasma and its associated FAC and flow responses give a realistic physical description of the structure of plasma sheet flow bursts (auroral oval flow channels) as they reach the inner plasma sheet (near the equatorward edge of the auroral oval).
Introduction
Bursts of flows with an equatorward component are seen within the nightside auroral oval (Sergeev et al., 1990; Kauriste et al., 1996; Yeoman & Lühr, 1999), these being the ionospheric counterpart of earthward flow bursts in the plasma sheet (Angelopoulos et al., 1992). Within flow bursts, flux tubes with lower total entropy than the surrounding plasma are brought earthward via interchange motion as seen in both theory (e.g., Pontius & Wolf, 1990; Yang et al., 2011) and observations (e.g., Angelopoulos et al., 1994; Dubyagin et al., 2010; Panov et al., 2010; Xing et al., 2010; Sergeev et al., 2012).
Flow bursts in the ionosphere (often referred to “meso-scale” flow channels) drive convergence of ionospheric currents to the right of their the flow direction. This convergence is related via current continuity to upward field-aligned currents (FACs) that can require magnetic-field-aligned electric fields that energize electrons and form discrete aurora (e.g., Lyons, 1981). This gives rise to intensifications along the poleward boundary of the auroral oval (de la Beaujardière et al., 1994; Lyons et al., 1999; Zesta et al., 2000) that are the most common auroral disturbance and have become referred to as poleward boundary intensifications (PBIs). PBIs can extend equatorward from the poleward boundary of the auroral oval along with the meso-scale flow bursts and become elongated in very roughly the north-south direction forming what are referred to as streamers (Rostoker et al., 1987; Nakamura et al., 1993; Gallardo-Lacourt et al., 2014).
Flow bursts in the ionosphere have also been observed to lead to a variety of other important geomagnetic disturbances as the reach to near the equatorward boundary of the auroral oval, which maps to the inner plasma sheet. These disturbances include thin substorm growth phase aurora arc formation or intensification (Nishimura et al., 2011), substorm onset (e.g., Nishimura et al., 2010), and omega bands (Henderson et al., 2002; Liu et al., 2018). Flow bursts moving earthward/equatorward are also important because they can give particle injections (Gabrielse et al., 2014; Liu et al., 2016), including into the storm-time ring current e.g., Gkioulidou et al. (2014) and radiation belts (e.g., Kim et al., 2021).
Thus the physics of flow bursts as they move earthward within the plasma sheet is of critical importance to understanding geomagnetic activity. Evaluation of flow bursts from an ideal MHD perspective e.g., Birn and Hesse (2013), Birn and Hesse (2014) has yielded much insight into flow burst dynamics in the more distant magnetotail, but is not appropriate for investigation of what happens as the flowing plasma encounters the inner plasma sheet where magnetic drift becomes significant. In ideal MHD, flow bursts come to rest where the flux tube integrated entropy of the plasma within the flow burst equals that of the background plasma (Wolf et al., 2012). However, the energy dependence of magnetic drift should dramatically change this result. As predicted by the Rice Convection Model (RCM), the low entropy plasma should spread azimuthally, be accompanied by substantial azimuthal drift (Yang et al., 2014; Yu et al., 2017), and lead to a substantial reduction of flux tube integrated entropy as plasma moves earthward (Lyons et al., 2009; Wang et al., 2018a; Wang et al., 2020).
This paper provides an observational test of the RCM predictions of the fate of the reduced entropy, flow burst plasma as it enters the near-Earth plasma sheet. We base our test on the Wang et al. (2018) RCM results. The model gives predictions of azimuthal flow relative to upward FAC regions when a localized plasma perturbation is introduced into the outer plasma sheet and leads to a reduced entropy plasma bubble. The model also shows important differences in response when these perturbations are introduced at three different MLTs relative to the near midnight model boundary between the large-scale dusk and dawn convection cells. Our test uses observations of upward FACs and flows within the ionosphere. The upward FACs are inferred from the aurora obtained primarily from the Time History of Events and Macroscale Interactions during Substorms (THEMIS) white-light all sky imager (ASI) array, which offers continent-scale coverage of the North American auroral zone with high temporal and spatial resolution (Mende et al., 2008). Poker Flat 557.7 nm ASI observations are included for events over Alaska. Flows are identified from Super Dual Auroral Radar Network (SuperDARN) observations, and presented as maps of flow vectors obtained with the Bristow et al. (2016) technique. This technique gives spatial resolution set by that of the underlying measurements and not by the smoothing from the global fits that are typically used for global SuperDARN convection maps. The resulting vectors are determined by the local line-of-sight (LOS) observations and the divergence-free condition. They are not strongly influenced by information beyond a distance of a few grids, so that localized steep gradients can be represented without influencing the remainder of the domain. Flow vector maps are available every 2 min.
RCM Results
The RCM (Harel et al., 1981; Toffoletto et al., 2003) computes species- and energy-dependent particle transport and convection electric field self-consistently using the bounce–averaged electric drift and magnetic curvature/gradient drift. Drift due to the induced electric field, which is associated with magnetic field changes, are included in computing motions in the magnetosphere. Particles are released from the RCM outer/tail boundary, proton loss by charge exchange and electrons loss by precipitation are considered, and the RCM computes electric field potential in the ionosphere self-consistently through the requirement for current continuity. Conductance includes Solar-EUV-generated conductance and Hall and Pedersen auroral conductance computed from the simulated particle spectra and precipitation loss rates based on (Robinson et al., 1987). The cross polar-cap potential is the external driver of the large-scale convection.
In the RCM simulations presented in this study (Wang et al., 2018b), the UCLA version of the RCM, UCLA-RCM, is used. Three modules developed separately have been incorporated in the UCLA-RCM: (1) observation-based tail particle boundary conditions (Wang et al., 2011), (2) force-balanced magnetic field (Liu et al., 2006; Gkioulidou et al., 2011), and (3) observation-based electron loss rates (Chen & Schulz, 2001; Gkioulidou et al., 2012).
Figure 1 shows UCLA-RCM results in the equatorial plane and ionosphere from Run one of Wang et al. (2018b) for times 3, 9, and 15 min after a meso-scale perturbation with a 1 h in MLT width and centered at 24 MLT was imposed on the RCM outer boundary, which is near X = −20 RE at midnight. A cross-polar cap potential drop of 90 kV was used. The perturbation had a density decrease by a factor of six and a temperature increase by a factor of 6, so that the bubble was created by the heat flux vector divergence due to the higher magnetic drift speeds of the hotter particles relative to those of the cooler background. As the bubble moves earthward, the lower energy ions tend to follow the electric field drift (along equipotentials, which are shown in the ionosphere as the black contours in the right column), while the higher energy ions magnetic drift more duskward. As a result, the bubble spreads in longitude, consistent with magnetotail observations (Liu et al., 2015), and its entropy decreases and as it moves earthward. The spreading can very clearly be seen in the left column of Figure 1, which shows the ratio of flux tube integrated entropy S to the integrated entropy So at t = 0 (S = PV5/3, where P is plasma pressure and V is flux tube volume). A crimson curve outlines the approximate boundary of the expanding bubble for each of the three times. S typically has a tailward gradient in the plasma sheet. However, the bubble spreading leads to an approximately azimuthal-aligned decrease in the tailward gradient in S at t = 15 min. As shown in Lyons et al. (2021a), there are enhancements of the Region 1 and 2-sense FACs as the bubble moves earthward (t = 9 min), and these FACs become longitudinally broad Region 1 and Region 2-sense currents as the bubble moves earthward to the inner plasma sheet. The enhanced Region 1-sense FACs are located approximately within the bubble itself, whereas the enhanced Region 2-sense FACs are earthward of the bubble, consistent with magnetotail observations (Liu et al., 2013; Sun et al., 2013).
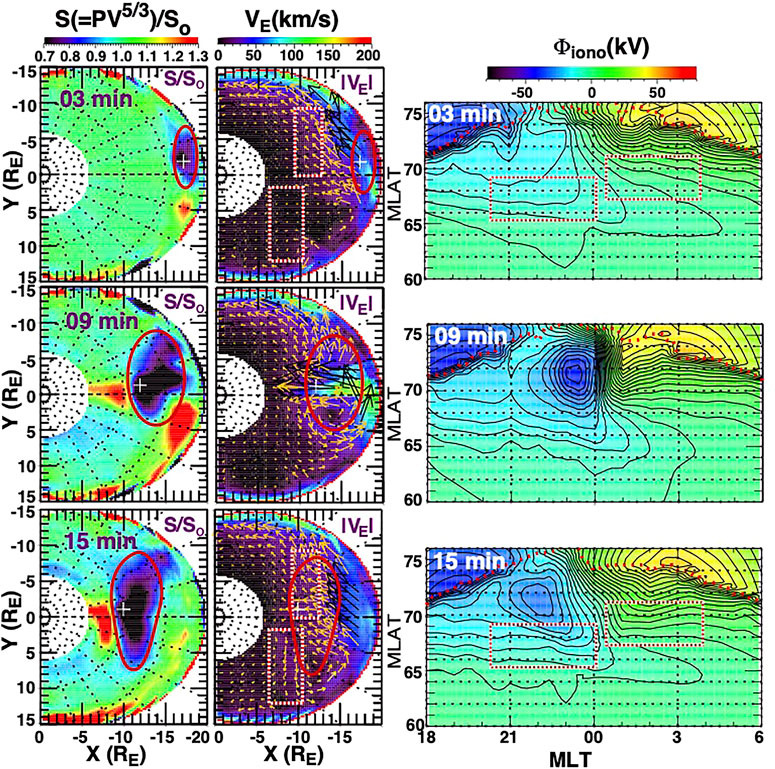
FIGURE 1. UCLA-RCM results in the equatorial plane and ionosphere from Run one of Wang et al. (2018a) for times 3, 9, and 15 min after a meso-scale perturbation with a 1 h in MLT width and centered at 24 MLT was imposed on the RCM outer boundary A cross-polar cap potential drop of 90 keV was used. The perturbation had a density decrease by a factor of six and a temperature increase by a factor of 6. The left column shows the ratio of flux tube integrated entropy S to the integrated entropy So at t = 0, and the middle column shows the electric field drift velocity VE. Both are of these columns are in the equatorial plane. In the left panel, a crimson curve outlines the approximate boundary of the expanding bubble for each of the three times. In the middle column, red and white rectangles are drawn to help identify the locations for comparing VE at t = 3 and t = 15 min. Electric potential and equipotential contours are shown in the right column.
The electric field changes as the FACs develop to maintain current continuity in both the ionosphere and magnetosphere. These changes can be seen in the middle row of Figure 1 as azimuthal turnings of the electric field drift vector (VE) as the flow channel moves earthward (t = 9 min). By t = 15 min, the electric field changes give significant enhancements in the subauroral polarization stream (SAPS) and dawnside polarization stream (DAPS) Liu et al. (2020) flows in the regions of the enhanced downward FACs, where conductivities are substantially lower than in the upward FAC regions. These enhancements can be seen by comparing the equatorial-plane electric field drift velocities in the middle column and the spacing of ionospheric equipotentials in the right column at t = 3 and t = 15 min. Red and white rectangles in Figure 1 are drawn to help identify the locations for making this comparison, and comparison with the crimson curve shows that the DAPS increase is within the plasma sheet bubble, while the SAPS increase is adjacent to the equatorward boundary of the bubble. (The nightside auroral oval and plasma sheet can have both the well-known SAPS region and an analogous DAPS’ region as discussed in Liu et al. (2020). SAPS are strong westward flows in the low conductivity region of downward (duskside) Region two field-aligned currents (FACs) that lies just equatorward of the electron auroral oval. DAPS consist of strong eastward flows in the more poleward, downward (dawnside) Region one FAC portion of the dawnside auroral oval, where auroral precipitation Lyons and Fennell (1986), Zou et al. (2009) and thus conductivities are much lower than within the more equatorward dawnside upward Region two FAC portion of the dawnside auroral oval.)
The bubble in Figure 1 was approximately centered between the dawn and dusk large-scale convection cells. Run 2, shown in Figure 2, is for the same conditions as Run 1 except the perturbation leading to the bubble was centered at 23 MLT and thus further toward the dusk convection cell. The important differences from Run 1 are that the bubble expands further towards dusk and less towards dawn, leading to a stronger SAPS region flow enhancement and a substantially smaller and weaker DAPS region for enhancement. Run 3, shown in Figure 3 is also for the same conditions as Run 1 except the perturbation leading to the bubble was centered at 01 MLT and thus further within the dawn convection cell. This bubble expanded further dawnward than did the bubble in Run 1, and led to a substantial DAPS region flow enhancement but no discernable enhancement of SAPS.
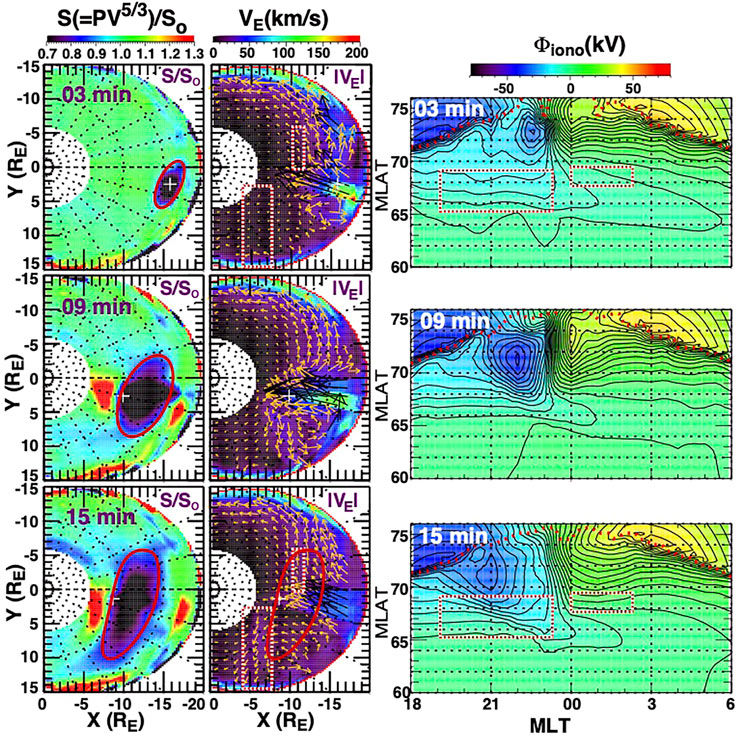
FIGURE 2. UCLA-RCM results in the equatorial plane and ionosphere from Run two of Wang et al. (2018b). Format is the same as Figure 1, and all model parameters were the same except the perturbation with centered at 23 MLT.
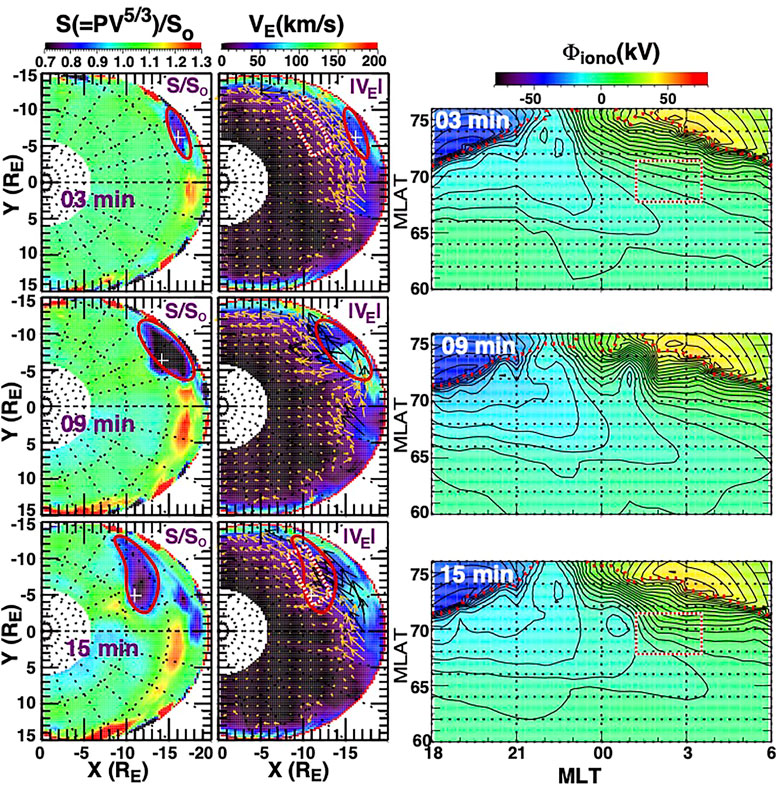
FIGURE 3. UCLA-RCM results in the equatorial plane and ionosphere from Run three of Wang et al. (2018b). Format is the same as Figure 1, and all model parameters were the same except the perturbation with centered at 01 MLT
Analysis
We started with 14 nights that were selected for having good auroral viewing from Poker Flat, Alaska that we have used in previous studies [most in Lyons et al. (2021a); Lyons et al. (2021b)], and identified six flow channel events having good auroral viewing conditions and good radar coverage of flows moving to the equatorward portion of the auroral oval and of their connection to azimuthal flows. We first show two examples with a flow channel that appears to be near the boundary between the dusk-side and dawn-side convection cells, approximately corresponding to the RCM model run in Figure 1. We then show one example each of a flow channel that appears to be more within the dusk-side or dawn-side convections cells, resembling the RCM model runs in Figures 2, 3, respectively. This is followed by examples with two or more flow channels.
We only examine the two-dimensional structure of the flow channels, its location relative to upward FACs as indicated by bright auroral arcs, and the dependence on whether the flow channel is between the two large-scale convection cells or more within the dusk or dawn cell. We do not have the combination of time resolution with consistent echo coverage to consistently see the evolution of flow channels as they move equatorward within the auroral oval. We do, however, show sequences of flow and ASI measurement to show that the two-dimensional pattern is maintained for several minutes and is not just a coincidental pattern seen during a single measurement interval, and to also show that the flow channel appears to come in from higher latitudes (probably the polar cap).
November 11, 2012 and February 20, 2014: Between-Cell Examples
Figure 4 shows 557.7 nm images from the Poker Flat ASI, with THEMIS ASI image mosaics for the region surrounding the Poker image FOV, for a flow channel near midnight (cyan line) on November 11, 2012. This flow channel appears to be in the region that separates the dawnside and duskside large-scale convection cells. Images are shown every 2–4 min, and SuperDARN flow vectors are overlaid on the images in each panel. The magnitude of each vector is shown by both its length and its color, the foot of the arrow being at the location of the measurement. Heavier flow vector arrows are at points with a LOS flow measurement. The further from a region of heavier arrows, the more the flows shown with the lighter arrows revert to a statistical model.
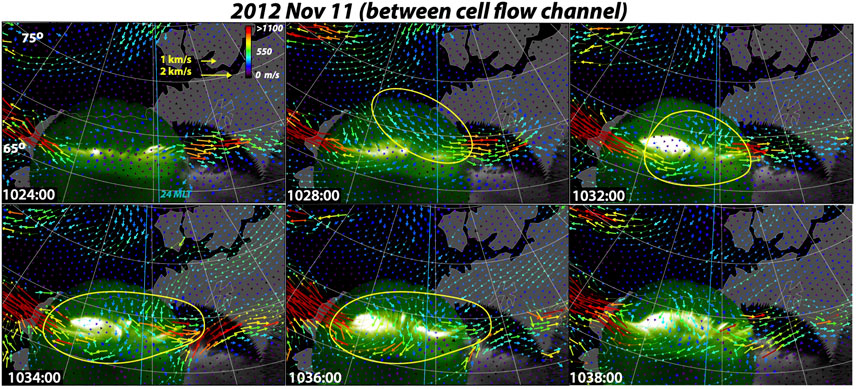
FIGURE 4. 557.7 nm images from the Poker Flat ASI, with THEMIS ASI image mosaics for the region surrounding the Poker image FOV for a flow channel near midnight (cyan line) on November 11, 2012. SuperDARN flow vectors are overlaid on the images in each panel. Vectors are scaled both by length and by color, the foot of the arrow being at the location of the measurement. Heavier flow vector arrows are at points with a LOS flow measurement. The further from a region of heavier arrows, the more the flows shown with the lighter arrows revert to a statistical model. Closed yellow curve approximately encircles the region where flows were enhanced relative to that seen at 1024 UT.
The first panel (1024 UT) shows conditions just before the start of a period of several consecutive 2 min SuperDARN maps showing a connection of the flow channel to flows within the equatorward portion of the auroral oval. Very weak flows are seen between 23 and 24 MLT, with westward/eastward flows at earlier/later MLTs. The stronger and more equatorward/poleward of these flow are SAPS/DAPS. In the next panel (1028 UT), a longitudinally localized region of enhanced flows (i.e., a flow channel) can be seen approaching the poleward boundary of the auroral oval at ∼23 to 24 MLT. The flow is equatorward with a significant eastward component, and it can be seen to connect to and enhance the eastward flows. (Flow direction variations are common for polar-cap flows approaching the auroral poleward boundary.). The eastward flows are poleward of a bright aurora arc on the dawnside, consistent them being DAPS. A closed yellow curve approximately encircles the region of the equatorward directed flow channel and DAPS flow that were enhanced relative to that seen at 1024 UT. There was not sufficient radar echo coverage at 1028 UT to determine if the flow channel connected to the SAPS region.
In the next three panels, we have sufficient measurement vectors to see that the flow channel simultaneously directly connected to, and enhanced, the duskside westward and dawnside eastward flows. The westward flows are equatorward of the brighter auroral emissions and within the region of uniform 557.7 nm emissions that results from the proton precipitation within the SAPS region (Zou et al., 2009; Lyons et al., 2015). The eastward flows are at distinctly higher latitudes than the westward flows. The dawnside aurora remains clear for this event, and the strongest eastward flows can be seen to lie adjacent to, but poleward of the dawnside bright auroral arc. This is characteristic of DAPS. Again, a closed yellow curve approximately encircles the region of the equatorward directed flow channel and SAPS and DAPS flows that were enhanced relative to that seen at 1024 UT. These are just the flows and location relative to the brighter auroral emissions expected from the near-midnight flow channel run of the RCM in Figure 1.
A second example of a flow channel in the region between the two large scale convection cells, on February 20, 2014, is shown in Figure 5. This channel is centered at ∼22.5 h in MLT. However, based on the background flow pattern, this flow channel appears to lie near the boundary between the large-scale dusk and dawn convection cells. At 0800 UT, some of the southeastward flows of the flow channel show a connection to strong DAPS flows just poleward of the lower latitude region of brighter morning aurora and an auroral arc identified by a magenta arrow. For this time, the flow channel appears to be partially within the dawn convection cell. However, in the next three panels, we see enhanced equatorward flow channels coming into the auroral oval from higher latitudes, and there are sufficient echoes to show a connection to both DAPS and SAPS at the next three times. The flow channel appears most clearly as between the convection cells in the 0808 UT panel. The closed yellow curve approximately encircles the region where flows were enhanced relative to that seen at 0800 UT. The flow speeds and echo coverage decrease by the times of the 0808 and 0810 UT panels. We see the flow connection to both SAPS and DAPS for ∼6 min in this case, and for ∼6–10 min for the case in Figure 4. These are reasonable durations for a flow channel, and their two-dimensional structure is as predicted by the RCM, including the predicted SAPS and DAPS enhancement location relative to the upward FAC as indicated by the bright auroral arcs.
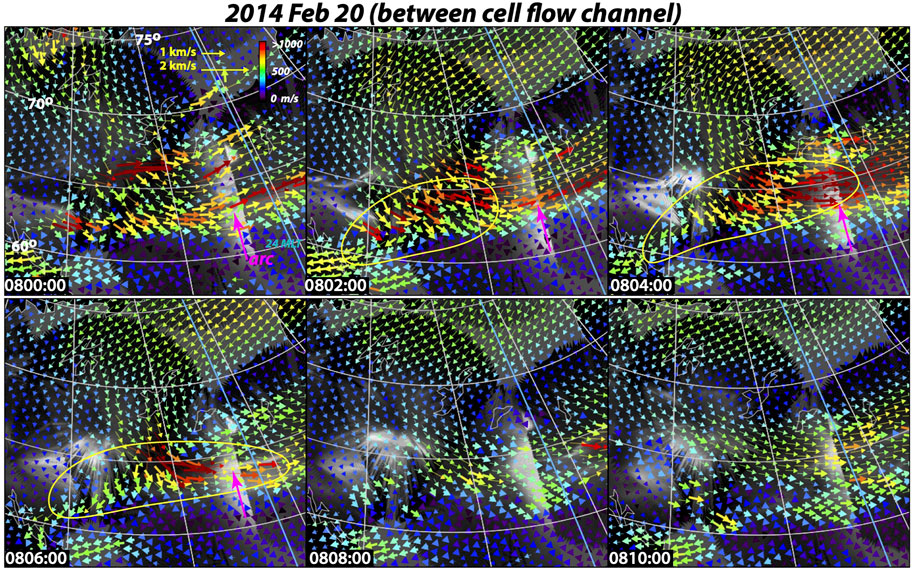
FIGURE 5. Same as Figure 4, except for a between cell flow channel on February 20, 2014, and the closed yellow curve approximately encircles the region where flows were enhanced relative to that seen at 0800 UT.
March 14, and 15 2013: Two-Dimensional TEC Coverage: Dusk and Dawn Cell Examples
The left- and right-hand sides, respectively, of Figure 6 show an example where an observed flow channel appears to enter the auroral oval from the polar cap and become primarily within the dusk or the dawn convection cell. We choose these examples in part because there are at least some echoes toward the dusk and dawn sides of the equatorward portion of the flow channel that show a decrease in flow speed. This indicates that the strongest flow of the channel did not extend more broadly in MLT, and, in particular, did not extend in MLT from the dusk/dawn cell to the dawn/dusk. In this figure, the closed yellow curves approximately encircle the region of the equatorward flows and where flows were enhanced relative to that seen in the first panel for each event.
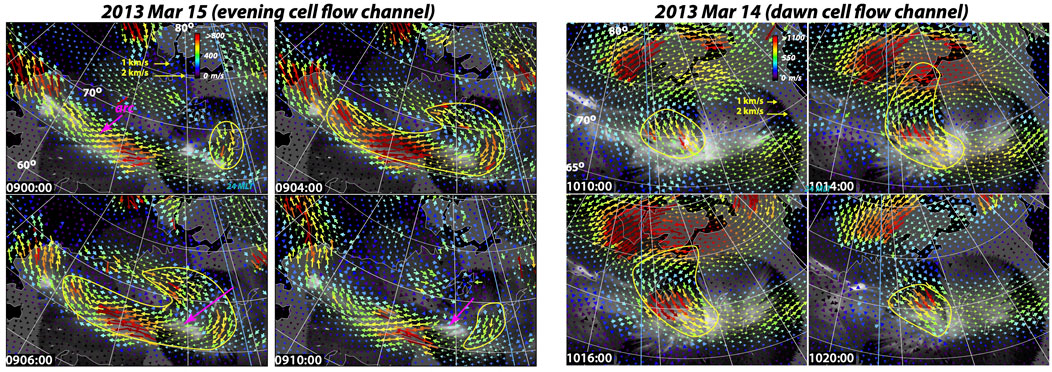
FIGURE 6. Same as Figure 4, except the left- and right-hand sides, respectively, show an example of a flow channel appearing to enter the auroral oval from the polar cap and becoming primarily within the dusk (March 15, 2013) and dawn (March 14, 2013) convection cell. The closed yellow curves approximately encircle the region of the equatorward flows and where flows were enhanced relative to that seen in the first panel for each event.
The equatorward flow channel on March 15, 2013 is seen in the 0900 UT panel. In the next two panels, the flows of the channel can be seen turning azimuthally towards the west, becoming connected to, and leading to an enhancement of, the SAPS flows. These flows lie equatorward of an auroral arc that was seen at 0900 UT as identified with a magenta arrow. At the later times shown, that arc was no longer visible, but the flows are within the region of uniform 557.7 nm emissions that results from the proton precipitation within the SAPS region. They were also equatorward of an arc observed to the east of the largest flows There are several radar echoes to the east of the flow channel, and they show only very weak flows with no evidence for a connection to DAPS flows. These observations are consistent with the pattern expected from the RCM results for a dusk cell flow channel in Figure 2. The flow channel then started to decrease as seen in the 0910 UT panel. The dawn cell flow channel on March 14, 2013 is first seen in the 1010 UT panel. It then increased and further turned towards the east, and then started to decrease by the time of the last panel shown (1020 UT). The flows turning toward the east are likely DAPS, though the auroral signature is not clear. Weak, diffuse auroral emissions are seen within the region of the flows on the dawn side. However, there may be brighter emissions towards the equatorward boundary of the ASIs FOVs, but this region of the FOVs is partially obscured by trees. Also, there are several radar echoes to the west of the flow channel, and they show only very weak flows with no evidence for a connection to SAPS flows This dawn cell example is consistent with the RCM pattern for a dawn cell flow channel in Figure 3.
As mentioned above, in neither the dusk-cell or dawn-cell examples in Figure 6 do we see a turning of the flows of the flow channel to the other azimuthal direction, that being to the east on 15 March and to the west on 14 March. This is a distinct difference to the connections to both SAPS and DAPS flow enhancements seen in the between cell examples in Figures 4, 5, showing further consistency with the RCM predictions in Figures 1–3.
Nov 19, 2012 and March 26, 2014: Evolution to Two or More Flow Channels
We identified single flow channels in the above events. Since there can be more than one streamer within the auroral oval at a given time (e.g., Lyons et al., 2012), we would expect there to often be more than one flow channel simultaneously within the oval. We thus turn attention to the two examples in Figure 7. Observations from November 19, 2012 are shown in the left portion of Figure 7. As outlined by the yellow curves, here we see a clear between-cell flow channel in the first panel (0636 UT), which then evolves into very distinct and separated dusk- and dawn-cell flow channels by the time times of the 0,650 and 0,656 panels. Observations from March 26, 2014 are in the right portion of the figure. As outlined by the yellow curves, in the first panel (0636 UT) we see a nice dusk-cell flow channel and a small equatorward flow channel to the east. The subsequent panels then show that the flows evolved toward four identifiable flow channels, with a dusk cell always being seen and three additional small equatorward flow channels appearing at 0650 UT. (Auroral features are difficult to identify for this event.)
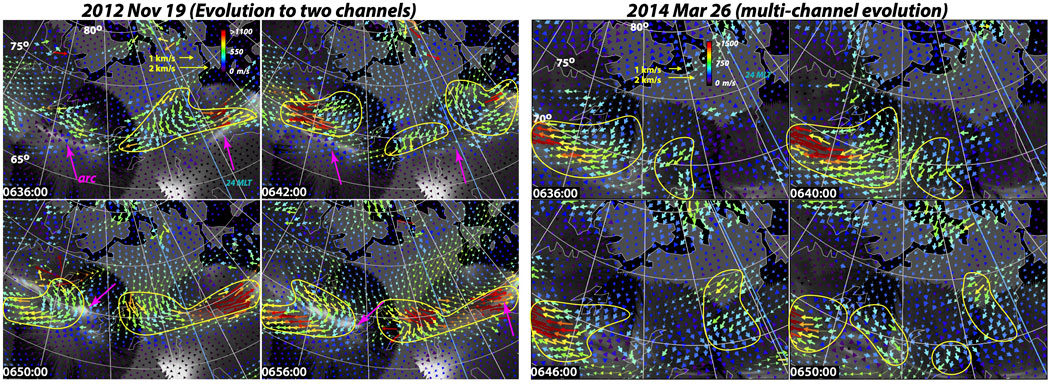
FIGURE 7. Same as Figure 4, except for two events (left: November 19, 2012; right: March 26, 2014) showing flow evolution to two or more flow channels. Yellow curves approximately encircle the identified flow channels in each panel.
We thus see that the idealized representations of a single flow channel that we have simulated with the RCM give patterns that compare remarkably well with the observations in examples with a single flow channel. However, the situation when there are multiple flow channels requires consideration and simulation of substantially more complicated scenarios where multiple bubbles are imposed on the RCM outer boundary.
Summary and Conclusion
While flow bursts are a major component of plasma sheet and auroral oval transport, and lead to a variety of other geomagnetic disturbances when they reach the inner plasma sheet (equatorward portion of the auroral oval), their two-dimensional structure as they approach the inner plasma sheet has not received much attention beyond that which is seen in ideal MHD simulations. We have examined this structure using both the RCM and ground-based radar and ASI observations. Specifically, we first presented the RCM predictions, and then tested these predictions using upward FACs identified from ASI images of the aurora and SuperDARN observations presented as maps of flow vectors obtained with the Bristow et al. (2016) technique. We used only observations for cases having good coverage of flow channels as they approach the equatorward portion of the auroral oval and the regions of possible connection to the azimuthal flows of SAPS and DAPS.
The energy dependence of magnetic drift becomes crucial within the inner plasma sheet, and as predicted by the RCM, the low entropy plasma of a flow burst should spread azimuthally and be accompanied by substantial azimuthal drift. We have taken advantage of the RCM results of Wang et al. (2018b) who ran three RCM simulations that were identical except for the MLT of a plasma perturbation applied at the model outer boundary that gives rise to a low-entropy plasma bubble. The results gave specific predictions of azimuthal flow enhancements in the SAPS and DAPS regions and their relation to flow-channel FACs that are associated with the azimuthal spreading of flow channels’ low entropy plasma as the flows reach to near the equatorward boundary of the auroral oval. We find consistency between the RCM pattern and the patterns seen in the observation results when a single flow channel is observed. The results also show clear response distinctions based on a flow channel’s location relative to the dusk-side and dawn-side large-scale convection cells, as seen in the RCM results of Figures 1–3 and the observations in Figures 4–6. The flow channels in Figures 1, 4, 5 were approximately centered between the dawn and dusk large-scale convection cells and gave significant flow enhancements of both SAPS and DAPS. The flow channels in Figure 2 and the left side of Figure 6 were further toward the dusk convection cell, and showed a far more significant enhancement of SAPS than for DAPS. The flow channels in Figure 3 and the right side of Figure 6 were further within the dawn convection cell. The low entropy plasma within these flow channels expanded further dawnward than did the between cell flow channels, and led to a substantial DAPS region flow enhancement but no discernable enhancement of SAPS.
It needs to be remembered that there is an infinite variety of flow channels plasma parameters and of background plasma sheet and auroral oval conditions. That the observations show the general trends predicted by the RCM simulations with the idealized parameters of Wang et al. (2018a) gives strong support that the azimuthal spread of a low-entropy plasma sheet plasma and its associated FAC and flow responses gives a realistic two-dimensional physical description of the structure of plasma sheet flow bursts (auroral oval flow channels) as they reach the inner plasma sheet (near the equatorward edge of the auroral oval).
That the structure of the flow bursts becomes approximately azimuthally aligned within the inner plasma sheet (equatorward portion of the auroral oval) may be quite important. For example, this alignment is likely critical for understanding the disturbances of the magnetosphere-ionosphere system that have east-west alignment, such as growth-phase auroral arcs, substorm onset, and dawnside auroral omega bands. Based on the few cases presented here, the auroral oval flow channels have a typical duration of several minutes. Also, based on the observations in Figure 7, the character of a flow channel can evolve with time, and more than one flow channel can significantly affect the plasma sheet and auroral oval at any specific time. Such evolution and the effects of multiple flow channels warrant further consideration, as does other effects of MLT location of bubble injection such as seen in (Nishimura et al., 2020).
Data Availability Statement
Publicly available datasets were analyzed in this study. This data can be found here: SuperDARN data is accessible viahttp://vt.superdarn.org/tiki-index.php?page = Data+Access. The University of Alaska ASI data is available from http://optics.gi.alaska.edu/optics/, and the THEMIS ASI data from http://themis.ssl.berkeley.edu/themisdata/.
Author Contributions
LL: All aspects of paper YN: Data coordination, analysis, and interpretation C-PW: Rice Convection Model simulations JL: Data analysis and interpretation WB: Two-dimensional radar flows and their interpretation.
Funding
Work at UCLA has been supported by NSF grant 1907483, NASA grant 80NSSC20K1314 and AFOSR FA9559-16-1-0364, at Boston University by AFOSR FA9559-16-1-0364, NASA NNX17AL22G, NSF AGS-1737823, and AFOSR FA9550-15-1-0179. SuperDARN work at Penn State was supported by AFOSR FA9559-16-1-0364. SuperDARN is a collection of radars funded by national scientific funding agencies of Australia, Canada, China, France, Italy, Japan, Norway, South Africa, United Kingdom and the United States of America. Operation of the Kodiak and Adak radars, and processing of the SuperDARN data for this study was supported by NSF grant AGS1934410 to the University of Alaska Fairbanks.
Conflict of Interest
The authors declare that the research was conducted in the absence of any commercial or financial relationships that could be construed as a potential conflict of interest.
Publisher’s Note
All claims expressed in this article are solely those of the authors and do not necessarily represent those of their affiliated organizations, or those of the publisher, the editors and the reviewers. Any product that may be evaluated in this article, or claim that may be made by its manufacturer, is not guaranteed or endorsed by the publisher.
References
Angelopoulos, V., Baumjohann, W., Kennel, C. F., Coroniti, F. V., Kivelson, M. G., Pellat, R., et al. (1992). Bursty Bulk Flows in the Inner Central Plasma Sheet. J. Geophys. Res. 97 (A4), 4027–4039. doi:10.1029/91JA02701
Angelopoulos, V., Kennel, C. F., Coroniti, F. V., Pellat, R., Kivelson, M. G., Walker, R. J., et al. (1994). Statistical Characteristics of Bursty Bulk Flow Events. J. Geophys. Res. 99 (A11), 280. doi:10.1029/94ja01263
Birn, J., and Hesse, M. (2013). The Substorm Current Wedge in MHD Simulations. J. Geophys. Res. Space Phys. 118 (6), 3364–3376. doi:10.1002/jgra.50187
Birn, J., and Hesse, M. (2014). The Substorm Current Wedge: Further Insights from MHD Simulations. J. Geophys. Res. Space Phys. 119 (5), 3503–3513. doi:10.1002/2014JA019863
Bristow, W. A., Hampton, D. L., and Otto, A. (2016). High‐spatial‐resolution Velocity Measurements Derived Using Local Divergence‐Free Fitting of SuperDARN Observations. J. Geophys. Res. Space Phys. 121 (2), 1349–1361. doi:10.1002/2015JA021862
Chen, M. W., and Schulz, M. (2001). Simulations of Storm Time Diffuse aurora with Plasmasheet Electrons in strong Pitch Angle Diffusion. J. Geophys. Res. 106 (A2), 1873–1886. doi:10.1029/2000JA000161
de la Beaujardière, O., Lyons, L. R., Ruohoniemi, J. M., Friis-Christensen, E., Danielsen, C., Rich, F. J., et al. (1994). Quiet-Time Intensifications along the Poleward Auroral Boundary Near Midnight. J. Geophys. Res. 99 (A1), 287–298. doi:10.1029/93JA01947
Dubyagin, S., Sergeev, V., Apatenkov, S., Angelopoulos, V., Nakamura, R., McFadden, J., et al. (2010). Pressure and Entropy Changes in the Flow-Braking Region during Magnetic Field Dipolarization. J. Geophys. Res. 115, a–n. doi:10.1029/2010JA015625
Gabrielse, C., Angelopoulos, V., Runov, A., and Turner, D. L. (2014). Statistical Characteristics of Particle Injections throughout the Equatorial Magnetotail. J. Geophys. Res. Space Phys. 119 (4), 2512–2535. doi:10.1002/2013JA019638
Gallardo-Lacourt, B., Nishimura, Y., Lyons, L. R., Zou, S., Angelopoulos, V., Donovan, E., et al. (2014). Coordinated SuperDARN THEMIS ASI Observations of Mesoscale Flow Bursts Associated with Auroral Streamers. J. Geophys. Res. Space Phys. 119 (1), 142–150. doi:10.1002/2013JA019245
Gkioulidou, M., Ukhorskiy, A. Y., Mitchell, D. G., Sotirelis, T., Mauk, B. H., and Lanzerotti, L. J. (2014). The Role of Small-Scale Ion Injections in the Buildup of Earth's Ring Current Pressure: Van Allen Probes Observations of the 17 March 2013 Storm. J. Geophys. Res. Space Phys. 119, 7327–7342. doi:10.1002/2014JA020096
Gkioulidou, M., Wang, C.-P., and Lyons, L. R. (2011). Effect of Self-Consistent Magnetic Field on Plasma Sheet Penetration to the Inner Magnetosphere: Rice Convection Model Simulations Combined with Modified Dungey Force-Balanced Magnetic Field Solver. J. Geophys. Res. 116 (A12), a–n. doi:10.1029/2011JA016810
Gkioulidou, M., Wang, C.-P., Wing, S., Lyons, L. R., Wolf, R. A., and Hsu, T.-S. (2012). Effect of an MLT Dependent Electron Loss Rate on the Magnetosphere-Ionosphere Coupling. J. Geophys. Res. Space Phys. 117 (A11), n/a. doi:10.1029/2012JA018032
Harel, M., Wolf, R. A., Reiff, P. H., Spiro, R. W., Burke, W. J., Rich, F. J., et al. (1981). Quantitative Simulation of a Magnetospheric Substorm 1. Model Logic and Overview. J. Geophys. Res. 86 (A4), 2217–2241. doi:10.1029/JA086iA04p02217
Henderson, M. G., Kepko, L., Spence, H. E., Connors, M., Sigwarth, J. B., Frank, L. A., and singer, H. J. (2002). “The Evolution of north-south Aligned Auroral Forms into Auroral Torch Structures: The Generation of omega Bands and Ps6 Pulsations via Flow Bursts,” in Sixth International Conference on Substorms. Editor R. M. Winglee (Seattle: The University of Washington), 169–174.
Kauristie, K., Sergeev, V. A., Pulkkinen, T. I., Pellinen, R. J., Angelopoulos, V., and Baumjohann, W. (1996). “Study of the Ionospheric Signatures of the Plasma Sheet Bubbles,” in Substorms 3 (Noordwijk: European Space Agency Publications Division), 93.
Kim, H. J., Lee, D. Y., Wolf, R., Bortnik, J., Kim, K. C., Lyons, L., et al. (2021). Rapid Injections of MeV Electrons and Extremely Fast Step‐Like Outer Radiation Belt Enhancements. Geophys. Res. Lett. 48 (9), e2021GL093151. doi:10.1029/2021GL093151
Liu, J., Angelopoulos, V., Runov, A., and Zhou, X.-Z. (2013). On the Current Sheets Surrounding Dipolarizing Flux Bundles in the Magnetotail: The Case for Wedgelets. J. Geophys. Res. Space Phys. 118 (5), 2000–2020. doi:10.1002/jgra.50092
Liu, J., Angelopoulos, V., Zhang, X. J., Turner, D. L., Gabrielse, C., Runov, A., et al. (2016). Dipolarizing Flux Bundles in the Cis‐geosynchronous Magnetosphere: Relationship between Electric fields and Energetic Particle Injections. J. Geophys. Res. Space Phys. 121 (2), 1362–1376. doi:10.1002/2015JA021691
Liu, J., Angelopoulos, V., Zhou, X.-Z., Yao, Z.-H., and Runov, A. (2015). Cross-tail Expansion of Dipolarizing Flux Bundles. J. Geophys. Res. Space Phys. 120 (4), 2516–2530. doi:10.1002/2015JA020997
Liu, J., Lyons, L. R., Archer, W. E., Gallardo‐Lacourt, B., Nishimura, Y., Zou, Y., et al. (2018). Flow Shears at the Poleward Boundary of Omega Bands Observed during Conjunctions of Swarm and THEMIS ASI. Geophys. Res. Lett. 45 (3), 1218–1227. doi:10.1002/2017GL076485
Liu, J., Lyons, L. R., Wang, C. P., Hairston, M. R., Zhang, Y., and Zou, Y. (2020). Dawnside Auroral Polarization Streams. J. Geophys. Res. Space Phys. 125 (8), e2019JA027742. doi:10.1029/2019JA027742
Liu, S., Chen, M. W., Schulz, M., and Lyons, L. R. (2006). Initial Simulation Results of Storm-Time Ring Current in a Self-Consistent Magnetic Field Model. J. Geophys. Res. 111 (A4). doi:10.1029/2005JA011194
Lyons, L. R., and Fennell, J. F. (1986). Characteristics of Auroral Electron Precipitation on the Morningside. J. Geophys. Res. 91 (A10), 11225–11234. doi:10.1029/JA091iA10p11225
Lyons, L. R., Liu, J., Nishimura, Y., Reimer, A. S., Bristow, W. A., Hampton, D. L., et al. (2021b). Radar Observations of Flows Leading to Substorm Onset over Alaska. J. Geophys. Res. Space Phys. 126 (2), e2020JA028147. doi:10.1029/2020JA028147
Lyons, L. R., Liu, J., Nishimura, Y., Wang, C. P., Reimer, A. S., Bristow, W. A., et al. (2021a). Radar Observations of Flows Leading to Longitudinal Expansion of Substorm Onset over Alaska. J. Geophys. Res. Space Phys. 126 (2), e2020JA028148. doi:10.1029/2020JA028148
Lyons, L. R., Nagai, T., Blanchard, G. T., Samson, J. C., Yamamoto, T., Mukai, T., et al. (1999). Association between Geotail Plasma Flows and Auroral Poleward Boundary Intensifications Observed by CANOPUS Photometers. J. Geophys. Res. 104 (A3), 4485–4500. doi:10.1029/1998JA900140
Lyons, L. R., Nishimura, Y., Gallardo‐Lacourt, B., Nicolls, M. J., Chen, S., Hampton, D. L., et al. (2015). Azimuthal Flow Bursts in the Inner Plasma Sheet and Possible Connection with SAPS and Plasma Sheet Earthward Flow Bursts. J. Geophys. Res. Space Phys. 120 (6), 5009–5021. doi:10.1002/2015JA021023
Lyons, L. R., Nishimura, Y., Xing, X., Runov, A., Angelopoulos, V., Donovan, E., et al. (2012). Coupling of Dipolarization Front Flow Bursts to Substorm Expansion Phase Phenomena within the Magnetosphere and Ionosphere. J. Geophys. Res. 117 (A2), a–n. doi:10.1029/2011JA017265
Lyons, L. R. (1981). “The Field-Aligned Current versus Electric Potential Relation and Auroral Electrodynamics,” in Geophysical Monograph Series. Editors S. I. Akasofu, and J. R. Kan (Washington, D. C: American Geophysical Union), Vol. 25, 252–259. Available at: http://www.agu.org/books/gm/v025/GM025p0252/GM025p0252.shtml.
Lyons, L. R., Wang, C.-P., Gkioulidou, M., and Zou, S. (2009). Connections between Plasma Sheet Transport, Region 2 Currents, and Entropy Changes Associated with Convection, Steady Magnetospheric Convection Periods, and Substorms. J. Geophys. Res. 114 (A9), a–n. doi:10.1029/2008JA013743
Mende, S. B., Harris, S. E., Frey, H. U., Angelopoulos, V., Russell, C. T., Donovan, E., et al. (2008). The THEMIS Array of Ground-Based Observatories for the Study of Auroral Substorms. Space Sci. Rev. 141 (1–4), 357–387. doi:10.1007/s11214-008-9380-x
Nakamura, R., Oguti, T., Yamamoto, T., and Kokubun, S. (1993). Equatorward and Poleward Expansion of the Auroras during Auroral Substorms. J. Geophys. Res. 98 (A4), 5743–5759. doi:10.1029/92JA02230
Nishimura, Y., Lyons, L. R., Angelopoulos, V., Kikuchi, T., Zou, S., and Mende, S. B. (2011). Relations between Multiple Auroral Streamers, Pre-onset Thin Arc Formation, and Substorm Auroral Onset. J. Geophys. Res. 116 (A9), a–n. doi:10.1029/2011JA016768
Nishimura, Y., Lyons, L., Zou, S., Angelopoulos, V., and Mende, S. (2010). Substorm Triggering by New Plasma Intrusion: THEMIS All-Sky Imager Observations. J. Geophys. Res. 115 (A7). doi:10.1029/2009JA015166
Nishimura, Y., Yang, J., Weygand, J. M., Wang, W., Kosar, B., Donovan, E. F., et al. (2020). Magnetospheric Conditions for STEVE and SAID: Particle Injection, Substorm Surge, and Field‐Aligned Currents. J. Geophys. Res. Space Phys. 125 (8), e2020JA027782. doi:10.1029/2020JA027782
Panov, E. V., Nakamura, R., Baumjohann, W., Angelopoulos, V., Petrukovich, A. A., Retinò, A., et al. (2010). Multiple Overshoot and Rebound of a Bursty Bulk Flow. Geophys. Res. Lett. 37 (8), n/a. doi:10.1029/2009GL041971
Pontius, D. H., and Wolf, R. A. (1990). Transient Flux Tubes in the Terrestrial Magnetosphere. Geophys. Res. Lett. 17 (1), 49–52. doi:10.1029/GL017i001p00049
Robinson, R. M., Vondrak, R. R., Miller, K., Dabbs, T., and Hardy, D. (1987). On Calculating Ionospheric Conductances from the Flux and Energy of Precipitating Electrons. J. Geophys. Res. 92 (A3), 2565. doi:10.1029/JA092iA03p02565
Rostoker, G., Lui, A. T. Y., Anger, C. D., and Murphree, J. S. (1987). North-south Structures in the Midnight Sector Auroras as Viewed by the Viking Imager. Geophys. Res. Lett. 14 (4), 407–410. doi:10.1029/GL014i004p00407
Sergeev, V. A., Aulamo, O. A., Pellinen, R. J., Vallinkoski, M. K., Bösinger, T., Cattell, C. A., et al. (1990). Non-substorm Transient Injection Events in the Ionosphere and Magnetosphere. Planet. Space Sci. 38 (2), 231–239. doi:10.1016/0032-0633(90)90087-7
Sergeev, V., Nishimura, Y., Kubyshkina, M., Angelopoulos, V., Nakamura, R., and Singer, H. (2012). Magnetospheric Location of the Equatorward Prebreakup Arc. J. Geophys. Res. 117 (A1), A01212. doi:10.1029/2011JA017154
Sun, W. J., Fu, S. Y., Parks, G. K., Liu, J., Yao, Z. H., Shi, Q. Q., et al. (2013). Field-aligned Currents Associated with Dipolarization Fronts. Geophys. Res. Lett. 40 (17), 4503–4508. doi:10.1002/grl.50902
Toffoletto, F., Sazykin, S., Spiro, R., and Wolf, R. (2003). Inner Magnetospheric Modeling with the Rice Convection Model. Space Sci. Rev. 107 (1), 175–196. doi:10.1007/978-94-007-1069-6_19
Wang, C.-P., Gkioulidou, M., Lyons, L. R., Wolf, R. A., Angelopoulos, V., Nagai, T., et al. (2011). Spatial Distributions of Ions and Electrons from the Plasma Sheet to the Inner Magnetosphere: Comparisons between THEMIS-Geotail Statistical Results and the Rice Convection Model. J. Geophys. Res. 116, a–n. doi:10.1029/2011JA016809
Wang, C. P., Gkioulidou, M., Lyons, L. R., and Wolf, R. A. (2018a). Spatial Distribution of Plasma Sheet Entropy Reduction Caused by a Plasma Bubble: Rice Convection Model Simulations. J. Geophys. Res. Space Phys. 123 (5), 3380–3397. doi:10.1029/2018JA025347
Wang, C. P., Gkioulidou, M., Lyons, L. R., and Wolf, R. A. (2018b). Spatial Distribution of Plasma Sheet Entropy Reduction Caused by a Plasma Bubble: Rice Convection Model Simulations. J. Geophys. Res. Space Phys. 123 (5), 3380–3397. doi:10.1029/2018JA025347
Wang, C. P., Yang, J., Gkioulidou, M., Lyons, L. R., and Wolf, R. A. (2020). Generation and Evolution of Two Opposite Types of Mesoscale Plasma Sheet Bubbles. J. Geophys. Res. Space Phys. 125 (9), e2020JA028072. doi:10.1029/2020JA028072
Wolf, R. A., Chen, C. X., and Toffoletto, F. R. (2012). Thin Filament Simulations for Earth’s Plasma Sheet: Interchange Oscillations. J. Geophys. Res. Space Phys. 117 (A2), n/a. doi:10.1029/2011JA016971
Xing, X., Lyons, L., Nishimura, Y., Angelopoulos, V., Larson, D., Carlson, C., et al. (2010). Substorm Onset by New Plasma Intrusion: THEMIS Spacecraft Observations. J. Geophys. Res. 115, a–n. doi:10.1029/2010JA015528
Yang, J., Toffoletto, F. R., and Wolf, R. A. (2014). RCM-E Simulation of a Thin Arc Preceded by a north-south-aligned Auroral Streamer. Geophys. Res. Lett. 41 (8), 2695–2701. doi:10.1002/2014GL059840
Yang, J., Toffoletto, F. R., Wolf, R. A., and Sazykin, S. (2011). RCM-E Simulation of Ion Acceleration during an Idealized Plasma Sheet Bubble Injection. J. Geophys. Res. 116. doi:10.1029/2010JA016346
Yeoman, T. K., and Lühr, H. (1999). CUTLASS/IMAGE Observations of High-Latitude Convection Features during Substorms. Ann. Geophys. 15 (6), 692–702. doi:10.1007/s00585-997-0692-z
Yu, Y., Cao, J., Fu, H., Lu, H., and Yao, Z. (2017). The Effects of Bursty Bulk Flows on Global‐scale Current Systems. J. Geophys. Res. Space Phys. 122 (6), 6139–6149. doi:10.1002/2017JA024168
Zesta, E., Lyons, L. R., and Donovan, E. (2000). The Auroral Signature of Earthward Flow Bursts Observed in the Magnetotail. Geophys. Res. Lett. 27 (20), 3241–3244. doi:10.1029/2000gl000027
Keywords: flow channels, flow bursts, saps, dawnside polarization stream, convection, aurora
Citation: Lyons LR, Nishimura Y, Wang C-P, Liu J and Bristow WA (2021) Two-Dimensional Structure of Flow Channels and Associated Upward Field-Aligned Currents: Model and Observations. Front. Astron. Space Sci. 8:737946. doi: 10.3389/fspas.2021.737946
Received: 07 July 2021; Accepted: 12 August 2021;
Published: 31 August 2021.
Edited by:
Jiansen He, Peking University, ChinaReviewed by:
Yiqun Yu, Beihang University, ChinaAlexei. V. Dmitriev, Lomonosov Moscow State University, Russia
Copyright © 2021 Lyons, Nishimura, Wang, Liu and Bristow. This is an open-access article distributed under the terms of the Creative Commons Attribution License (CC BY). The use, distribution or reproduction in other forums is permitted, provided the original author(s) and the copyright owner(s) are credited and that the original publication in this journal is cited, in accordance with accepted academic practice. No use, distribution or reproduction is permitted which does not comply with these terms.
*Correspondence: Larry. R. Lyons, bGFycnlAYXRtb3MudWNsYS5lZHU=