
94% of researchers rate our articles as excellent or good
Learn more about the work of our research integrity team to safeguard the quality of each article we publish.
Find out more
ORIGINAL RESEARCH article
Front. Astron. Space Sci., 04 October 2021
Sec. Space Physics
Volume 8 - 2021 | https://doi.org/10.3389/fspas.2021.714146
This article is part of the Research TopicCoupled Feedback Mechanisms in the Magnetosphere-Ionosphere SystemView all 25 articles
The chemical imprint of the energetic electron precipitation on the atmosphere is now acknowledged as a part of the natural forcing of the climate system. It has, however, been questioned to which degree current proxies are able to quantify the medium energy electron (MEE) (≳30 keV) precipitation and the associated daily and decadal variability. It is particularly challenging to model the high energy tail (≳300 keV) of MEE, both in terms of the intensity as well as the timing. This study explores the predictive capabilities of the AE index for the MEE precipitation. MEE measurements from the NOAA/POES over a full solar cycle from 2004 to 2014 are applied. We combine observations from the MEPED 0° and 90° detectors together with theory of pitch angle diffusion by wave-particle interaction to estimate the precipitating fluxes. To explore the energy dependent time scales, each of the MEPED energy channels, > 43, >114, and >292 keV are evaluated independently. While there is a strong correlation between the daily resolved AE index and >43 keV fluxes, it is a poor predictor for the >292 keV fluxes. We create new AE based MEE proxies by accumulating the AE activity over multiple days, including terms counting for the associated lifetimes. The results indicate that AE based proxies can predict at least 70% of the observed MEE precipitation variance at all energies. The potential link between the AE index, substorms and the MEE precipitation is discussed.
Precipitating auroral electrons (≲ 30 keV) and protons (≲ 1 MeV) from the plasma sheet will ionize the lower thermosphere and upper mesosphere. Medium energy electrons (MEE) (≳ 30 keV) from the radiation belts have sufficient energy to penetrate deep into the mesosphere (Turunen et al., 2009). The associated ionization enhances the production rate of NOx and HOx gasses, which in turn can reduce ozone in catalytic processes (e.g., Sætre et al., 2004; Andersson et al., 2012; Sinnhuber et al., 2016; Zawedde et al., 2016). During polar winter, the chemical impact can be long lasting and influence temperatures, winds, and wave propagation. This chain of reactions can impact the strength of the stratospheric polar vortex, causing a dynamical signal that may propagate all the way down to the surface (Seppälä et al., 2013; Maliniemi et al., 2016). To account for this natural solar forcing of the atmosphere, a parametrization of energetic electron precipitation is – for the first time – part of the official input to the Coupled Model Intercomparison Project phase 6 (CMIP 6) going into the Intergovernmental Panel on Climate Change sixth assessment report (Matthes et al., 2017). The MEE ionization rate dataset therein is based on observations from the Medium Energy Proton and Electron Detector (MEPED) instrument on board the NOAA/Polar Orbiting Environmental Satellites (POES), and the geomagnetic Ap index is used as a proxy to provide an extended time series beyond the satellite observation period (van de Kamp et al., 2016). There is, however, an active discussion to what extent this approach gives a representative flux and ionization rate level (Mironova et al., 2019; Nesse Tyssøy et al., 2019; Pettit et al., 2019; Clilverd et al., 2020). The CMIP6 flux is a general underestimate, largely ascribed to the use of the vertical (0°) detector on MEPED which only covers a small fraction of the loss cone (Nesse Tyssøy et al., 2019). Recent studies, however, also point out that the role of substorms in driving MEE precipitation is not readily explained by a single magnetic index value. Hence, substorms is one of the main unknowns in the existing proxies when considering the MEE precipitation and especially its high energy tail (≳ 300 keV) (Partamies et al., 2021).
Several processes in the magnetosphere contribute to the driving of the MEE precipitation. A globally induced electric field during southward interplanetary magnetic field accelerates and transports electrons from the magnetotail into the inner magnetosphere where they become a part of the radiation belts. In parallel, localized transient-induced electric fields, created from the magnetotail collapse during substorm activity, also energize and increase the MEE population in the radiation belts. So-called seed particles of 10–100 s keV can be directly injected into the inner magnetosphere during a substorm (Li et al., 2009; Jaynes et al., 2015). Further acceleration also occurs as the injection of source particles (tens of keV) gives rise to Very Low Frequency (VLF) wave growth, which may resonantly interact and accelerate radiation belt electrons to MEE (Borovsky & Yakymenko, 2017). Repeated substorm activity has been shown to be particularly important for MEE fluxes (Rodger et al., 2016; Partamies et al., 2021), possibly due the induction electric field directly energizing the trapped electrons as they drift across the nightside during substorm expansion phases (Dai et al., 2014). Partamies et al. (2021) identified the substorm occurrence by a regional AE index and used cosmic noise absorption enhancement as a measure of the MEE precipitation. They showed that for multi-night substorm events, the first night was rarely associated with the most intense absorption. Instead, the high-energy electron population, needed to cause the strongest absorption, was built up over one to two additional nights of substorm activity. This was further confirmed by MEPED in situ particle spectra. In the expansion phases the bulk of the spectra showed a local maximum flux in the range of a few keV to 10 keV, while in the recovery phases higher fluxes were seen in the range of tens of keV to hundreds of keV. Based on the SuperMAG substorm event list, Rodger et al. (2016) constructed a superposed epoch analysis differing between isolated and recurrent events. Even though their main focus was the trapped MEE fluxes, they also showed higher precipitating MEE fluxes in the epoch analysis for the recurrent events compared to isolated events, in particular with respect to the high energy tail (>300 keV). Although not commented on, Figure A1 in Rodger et al. (2016) showed an instant effect as well as a gradual build-up over the consecutive days. Seppälä et al. (2015) used the substorm model developed by Beharrell et al. (2015) to investigate the production of HOx and NOx and the subsequent depletion of mesospheric ozone with the Sondakylä Ion and Neutral Chemistry model (Turunen et al., 2009). The peak loss of mesospheric ozone was observed during the third and fourth day in the period of the repetitive substorm activity. This implies that the creation of MEE precipitation involves processes with various time constants and potentially accumulated effects, where there are increasing delays in flux buildup with energy (Boynton et al., 2016; Ødegaard et al., 2017; Stepanov et al., 2021).
Out of the International Association of Geomagnetism and Aeronomy (IAGA) recognized magnetic indices, the Auroral Electrojet (AE) index best corresponds to substorm activity. The AE index goes back to the 1960s and is constructed from the horizontal magnetic field component recorded with 1-min time resolution at 10–13 magnetic observatories located under the average auroral oval in the Northern Hemisphere (NH) (geomagnetic latitudes 60°–70°) (Davis & Sugiura, 1966; Kauristie et al., 2017, and references therein). The upper and lower envelope curves are defined to be the AU and AL indices which characterize the intensity of eastward and westward electrojets, respectively. The difference, AU—AL, defines the AE-index (Davis & Sugiura, 1966). The magnetotail energy release associated with the substorm expansion phase affects the intensity and spatial distribution of electric currents in the auroral oval region. In particular, the substorm current wedge causes sudden enhancements in the westward electrojet (Kauristie et al., 2017).
In this study, we explore the prediction capability of AE in regard to MEE precipitating fluxes. We combine observations from both the MEPED 0° and 90° detectors together with the theory of pitch angle diffusion by wave-particle interaction to quantify the MEE flux in the bounce loss cone. We treat the MEPED energy channels, > 43, >114, and >292 keV, independently to explore their associated time delays in respect to the geomagnetic activity. The objective is to determine the potential of AE as a proxy for MEE precipitating fluxes with a particular focus on the high energy tail. The paper is organised as follows: Section 2 describes the MEPED detectors and the methods applied to estimate the loss cone fluxes. It provides a short introduction to the AE index followed by a comparison between the AE index and the SuperMAG substorms list from the period 2004–2014. Section 3 starts with a simple inspection of the correlation between the AE index and the MEE fluxes, where the investigation of time delays and build-up effects points toward a more advanced model. Section 4 provides a discussion of the implication of the results and the potential role of substorms as the physical process linking the AE based proxies and the MEE fluxes.
The MEPED instrument is mounted on the NOAA/POES series and three EUMETSAT/MetOp spacecraft (Evans & Greer, 2004). The satellites are Sun-synchronous, low-altitude (∼ 850 km), polar orbiting spacecrafts. Their orbital period is about 100 min, resulting in 14–15 orbits for each satellite each day. The combined measurements offer a long, near continuous observation of MEE from 1979 until today. During the latest decades a constellation of up to six operating satellites has allowed for a more global magnetic local time coverage.
The MEPED instrument consists of two directional electron telescopes and two directional proton telescopes, as well as an omni-directional detector for very energetic protons measured over a wide range of angles (Evans & Greer, 2004). The field of view of both the 0° and 90° telescopes is 30° full width. The nominal energy limits of the MEPED telescopes are given as > 30, >100, and >300 keV. The true detector efficiency, however, will depend on the incoming energy spectrum (Yando et al., 2011). Ødegaard et al. (2017) utilize the geometric factors given in Yando et al. (2011) to determine new optimized effective integral energy limits >43, >114, and >292 keV and associated geometric factors based on a series of realistic power law and exponential spectra. Furthermore, the spurious response to contaminating protons is accounted for. The observed proton fluxes are first corrected for degradation due to radiation damage by applying correction factors derived by Sandanger et al. (2015) and Ødegaard et al. (2016). Subsequently, a monotonic piecewise cubic Hermite interpolating polynomial is applied to the corrected proton fluxes. The proton flux in the energy ranges known to impact the respective electron channels (Evans & Greer, 2004), are then retrieved and subtracted from the original measured electron fluxes.
A detailed discussion on which radiation belt populations the 0° and 90° telescopes measure has been presented in Appendix A in Rodger et al. (2010). In general, it shows that at middle and high latitudes the 0° telescopes measure particle fluxes that will be lost to the atmosphere, whereas the 90° telescopes detect precipitating particle fluxes and/or trapped particles in the radiation belts. This implies that in the frequent case of pitch angle anisotropy the 0° detector will underestimate, while the 90° detector will overestimate the flux of precipitating electrons (Nesse Tyssøy et al., 2016; Nesse Tyssøy et al., 2019). A more realistic estimate can be achieved by combining fluxes from both the 0° and 90° telescopes together with electron pitch angle distributions from theory of wave-particle interactions in the magnetosphere. We solve the Focker-Planck equation for particle diffusion (Kennel & Petschek, 1966; Theodoridis & Paolini, 1967) for a wide range of diffusion coefficients (The specific equations are also given in Nesse Tyssøy et al. (2016)). The solutions are then transformed to the satellite altitude and saved in a look-up table. When comparing the theoretical pitch angle distributions with the measured particle fluxes the procedure is as follows:
• Determine the pitch angles of center look directions of the 0° and 90° telescopes.
• Calculate the ratio between of the fluxes detected by the 0° and 90° detector.
• Calculate the ratio between the fluxes for the theoretical pitch angle distributions taking into account the look directions.
• Determine which of the theoretical pitch angle distributions best corresponds to the observed ratio.
Finally, the size of the loss cone, predicted based on the International Geomagnetic Reference Field (IGRF) model, are applied to estimate the precipitating fluxes. The loss cone flux estimate is done separately for each energy channel as the level of particle diffusion will vary with energy. A detail explanation of the method can be found in Nesse Tyssøy et al. (2016).
We use MEE precipitation estimates from a full solar cycle from 2004 to 2014. This includes the active years in the declining phase of cycle 23, the extreme minimum, and the moderate maximum of cycle 24. Figure 1 illustrates the number of NOAA and MetOp satellites applied throughout the 11 years alongside the MLT coverage in the NH. Although, the combination of satellites has a near global coverage on a daily scale, it is not equally distributed in terms of MLT. In particular, the evening sector and midnight sector are poorly represented in the NH. The daily average of the fluxes is therefore first calculated for four separate MLT sectors, 0–6 MLT, 6–12 MLT, 12–18 MLT, and 18–24 MLT over the CGM latitude band 55°–70°. Thereafter, a daily MEE flux is achieved as the average of the four MLT regions to ensure that the MEE flux is weighted equally in respect to MLT. Figure 2 shows the resulting daily integral fluxes for the energies >43 keV (blue line), >114 keV (red line), and >292 keV (black line) over the full solar cycle. The values are given as the logarithm of the flux value, illustrating that the flux of the high energy tail >292 keV are typically two order of magnitude less than the >43 keV fluxes.
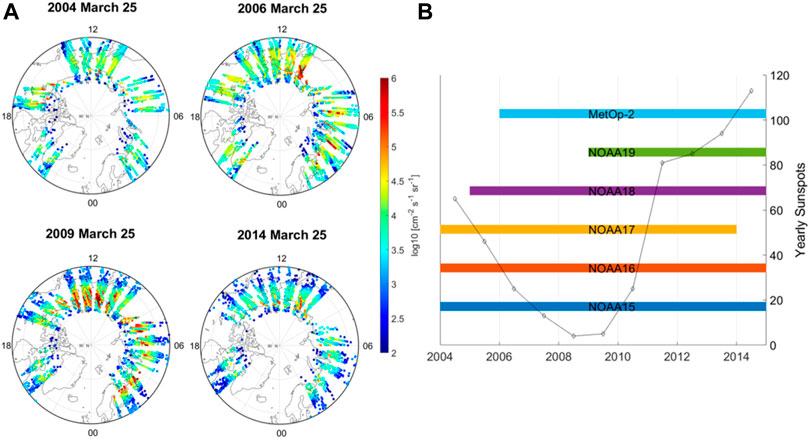
FIGURE 1. (A): The POES and MetOp satellite MLT coverage over a full day during March 25th in 2004, 2006, 2009 and 2014. (B): The POES and MetOp satellite coverage over a full solar cycle from 2004 to 2014.
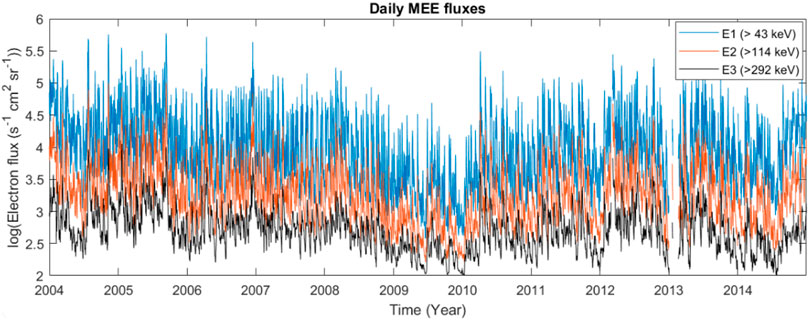
FIGURE 2. Daily MEE of >43 keV (blue line), >114 keV (red line), and >292 keV (black line) from 2004 to 2014. The fluxes are averaged over all MLT and the CGM latitude band 55°–70°N.
The AE-index is designed by Davis and Sugiura (1966) to monitor the electrojet activity. The link to substorm activity was assumed from the very beginning as the substorm current system lies in the ionosphere. However, its deficiency with respect to coarse geographic latitude and longitude coverage was quickly pointed out. The observations, limited to a geomagnetic latitude band of 60°–70°N, could not always detect the dynamic auroral oval, both expanding equatorward and contracting poleward of the 12–13 stations. Short-term and localized events in the midnight sector, such as substorms, can easily be missed by the coarse network of stations. Besides substorms, pseudo-breakups, steady magnetospheric convection events, sawtooth injections, poleward boundary intensifications, or a mixture of these modes have been recognized in the AE data (McPherron, 2015). To overcome some of these challenges, regional electrojet-indices have been created (Tanskanen, 2009), and multiple regional magnetometer chains have been combined to compile globally denser network of stations (Gjerloev, 2012). Analysis have been performed to identify individual substorms. However, no generally accepted method exists to identify substorm events from auroral electrojet indices, and different sets of criteria are used in different studies (e.g., Tanskanen et al., 2002; Newell & Gjerloev, 2011).
Figure 3 shows the daily averaged AE index alongside the daily number of substorms identified by Newell and Gjerloev (2011) from 2004 to 2014. The Pearson correlation coefficient, r, between the two datasets over the entire solar cycle is 0.89, giving r2 = 0.79. It should, however, be emphasized that using the AE index on a daily scale makes identification of substorm/non-substorm modes problematic in particular for long active periods. Therefore, Figure 3 shows a potential (but not proven) link between the daily averaged AE index and substorms.
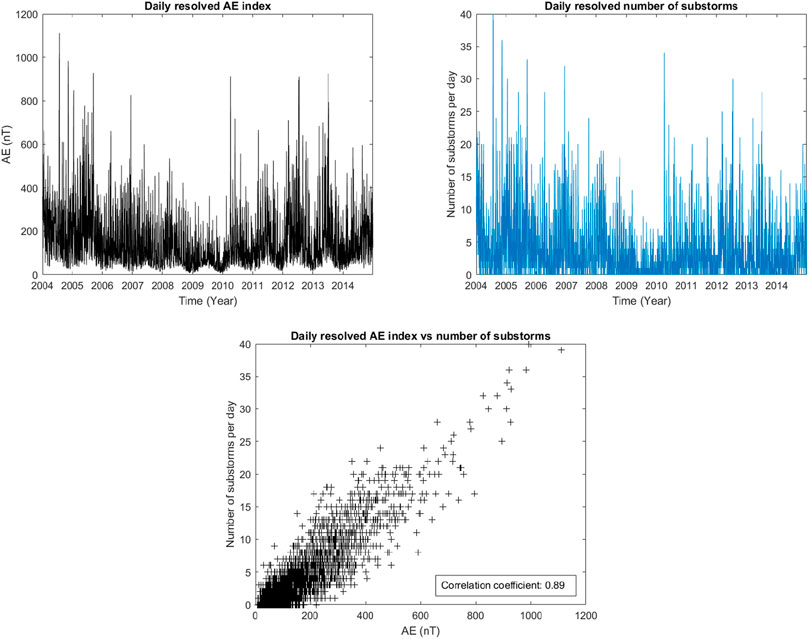
FIGURE 3. Upper left plot: Daily resolved AE index (black line). Upper right plot: The number of substorms per day (blue line) based on Newell and Gjerloev (2011). Upper right plot: Scatter plot of the number of substorms per day and the daily resolve AE index. All panels include the period from 2004 to 2014.
We note that the daily AE index has a pronounced seasonal bias where the AU and AL indices maximize during summer and equinoctial months, respectively (Ahn et al., 2000). The equinox bias is due to the seasonal bias of solar wind driving which also applies to MEE. While the summer maxima, clearly evident in Figure 3, is due to increased background ionization from UV. This implies that the relation between the AE index and other parameters such as the number of substorms or MEE flux will vary with season. It also means that if AE, based on observations only from NH, is to be used as a global proxy for both hemispheres the seasonal bias needs to be addressed. In the MEEproxy developed in this study, we remove the seasonal trend by subtracting the minimum daily AE value found in a moving window of ±14 days from the daily resolved AE index.
The daily AE index vary by three orders of magnitude over the 11 years. The daily fluxes of >43, >114, and >292 keV loss cone fluxes over the 55°–70° CGM latitude band varies by five, four, and three orders of magnitude over the same period, respectively. Figure 4 shows the scatter plots of a linear fit for 1) the linear value of the daily AE index and linear value of the daily >43 keV fluxes (Linear-Linear), 2) the linear value of the daily AE index and logarithmic value of the daily >43 keV fluxes (Linear-Logarithmic), and 3) the logarithmic value of the daily AE index and logarithmic value of the daily >43 keV fluxes (Logarithmic-Logarithmic). Despite a fairly good correlation of 0.83, the predictability of the Linear-Linear comparison is quite poor for low flux values. The Linear-Logarithmic and Logarithmic-Logarithmic comparison ensure equal weighting of errors associated to high and low flux values. Nevertheless, despite a high correlation coefficient of 0.81, the Linear-Logarithmic comparison systematically overestimates the high flux values and underestimate the low flux values. The Logarithmic-Logarithmic fit shows a clear linear dependence with the highest correlation coefficient of 0.88. As such, it is evident both in the correlation coefficients, and the scatter plots that using both the logarithmic values of the AE and the fluxes, ensures the strongest correspondence.
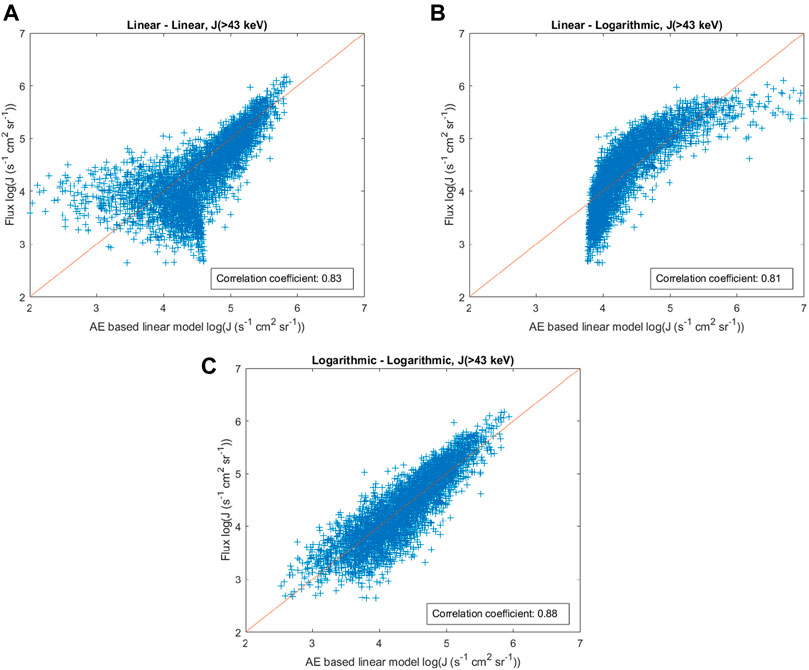
FIGURE 4. Scatter plots and a linear fit of (A) the linear value of the daily AE index and linear value of the daily >43 keV fluxes (Linear-Linear), (B) the linear value of the daily AE index and logarithmic value of the daily >43 keV fluxes (Linear-Logarithmic), and (C) the logarithmic value of the daily AE index and logarithmic value of the daily >43 keV fluxes (Logarithmic-Logarithmic).
Table 1 lists the Pearson correlation coefficient between the daily resolved logarithmic value of the AE index and the logarithmic value of >43, >114, and >292 keV The square value of the correlation coefficients of 0.88 and 0.73 implies that the AE regression models fit with 77% and 53% of the variability of the >43 keV and >114 keV fluxes, respectively. The correlation coefficient decreases with energy, where a value of 0.47 implies that the AE regression model can only fit 22% of the variability of the >292 keV fluxes. This might reflect that a larger fraction of the >43 keV and >114 keV electron fluxes are directly injected during the substorm activity, while relatively fewer electrons >292 keV are part of the initial seed population. Table 1 also shows that the AE index is best correlated with >43 keV and >114 keV electron fluxes in the post-midnight MLT sector which supports the link to substorm nightside injection and the subsequent eastward electron drift around the Earth and westward electrojet enhancements. The MLT bias is, however, not as prominent for >292 keV electron fluxes.

TABLE 1. The Pearson correlation coefficient between daily resolved AE index and the logarithmic value of >43 > 114, and >292 keV loss cone fluxes over the 55°–70° CGM latitude band for the years 2004–2014.
Figure 5A shows the Pearson correlation coefficients between the logarithmic value of the AE index 0–8 days prior to the logarithmic value of the observed MEE fluxes. The highest correlation is found on day zero, zero, and two for >43, >114, and >292 keV fluxes, respectively. The increasing offset as a function of energy substantiates that time is a prerequisite for the MEE high energy tail. The broad correlation peak and gradual decay further suggest that the MEE fluxes are influenced by the geomagnetic activity level of several days. Figure 5B shows the correlation between the logarithmic value of the AE index accumulated over consecutive longer periods prior to the logarithmic value of the observed MEE fluxes. The correlation coefficients between the accumulated AE index and the >43 keV fluxes peaks at 0.88 when both the zero and first preceding day are taken into account, which based on r-squared corresponds to approximately 77% of the flux variability. The correlation coefficient of the AE index for the >114 keV fluxes reaches about 0.83 when 3–4 days are accumulated, increasing the predictive capability of AE index from about 53% to 69%. The correlation coefficient between the accumulated AE index and the >292 keV fluxes increases rapidly the first few days and as many as seven preceding days are required for it to reach its peak of 0.81. Now, the predictive capability of the AE index has increased from about 22% to 66%.
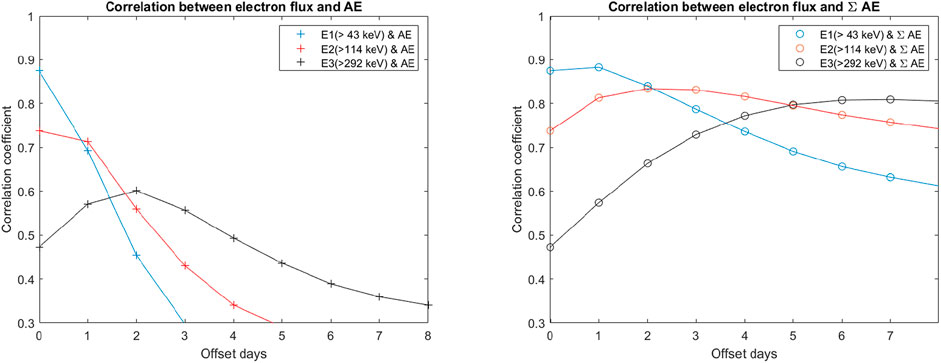
FIGURE 5. The Pearson correlation coefficients between the logarithmic value of the electron fluxes >43 keV (blue line), >114 keV (red line), and >292 keV (black line) and the logarithmic value of the AE index (left plot) and the logarithmic value of the accumulated AE values (right plot).
Based on the correlation coefficients shown in Figure 5A is unlikely that each of the preceding days are equally important as assumed in this simple model shown in Figure 5B. As time evolves the seed population injected during a specific substorm is not only accelerated, but it is likely to be lost to the atmosphere or to the magnetopause. A more realistic model, where the AE index is weighted in respect to lifetimes of the particle population, could increase the predictive capability of the AE index even more. We assume the following weighting of geomagnetic activity:
where i refers to the preceding days and τ is the assumed lifetime. Due to the broad peak found in Figure 5 for the >292 keV fluxes, the equation includes ten offset days. Furthermore, Figure 3 shows a clear seasonal trend in the daily AE index which could impact the correlation with the MEE fluxes. As described in Section 2.2, we remove the seasonal trend in the AE index by subtracting the minimum daily AE value found in a moving window of ±14 days from all AE values. Now, the maximum correlation coefficients increases to 0.91, 0.89, and 0.84, using the optimized lifetime, τ, of one, three, and 9 days for >43 keV, > 114 keV, and >292 keV, respectively.
For the >43 keV fluxes a correlation coefficient of 0.91 is a small improvement from the 0.88 found in Figure 5. In addition, to better model low and high extremes, we fit two separate linear equations based on the logarithmic value of the MEEproxy. The optimized separating boundary and the associated model equations are achieved by stepwise moving the limit over the entire MEEproxy interval while performing two independent linear regression fits for the fluxes associated with the MEEproxy values below and above the limit. The boundary giving the highest correlation coefficient and smallest RMSE for the two model fits combined are selected. An overview of the AE based MEEproxy, including the mathematical expressions, lifetime τ, and linear equations are given in Table 2 (Note that the limits are based on the MEEproxy and not the daily AE values.) These simple measures increase the correlation coefficients to 0.93, 0.90, and 0.85 for >43 keV, > 114 keV, and >292 keV, respectively. This implies that about 86%, 81% and 72% of the daily flux variability, considering all MLTs and the full solar cycle, can be accounted for by the MEEproxy models.

TABLE 2. The MEEproxy models for two separate MEEproxy intervals. The models give the logarithmic value of >43, >114, and >292 keV loss cone fluxes over the 55°–70° CGM latitude band.
The upper panel in Figure 6 shows the resulting linear fits to the AE-based MEEproxy for >43 keV electron fluxes. The model captures the day-to-day fluctuations. The lower panel shows the differences between the observed and modelled fluxes. Similarly to the flux, the error are given as log [J (s−1cm2sr−1)], which implies that values larger than one would correspond to one order of magnitude difference. The 5/95 percentile black, dashed lines demonstrate that the typical error is less than 0.4 log [J (s−1cm2sr−1)], corresponding to the value 100.40 ∼ 2.5. This means that for 90% of the days the model predicts fluxes that deviates from the observed fluxes by less than a factor of 2.5. The largest error found is 0.99 which correspond to a factor of 9.8. Hence, all values are within one order of magnitude of the observed fluxes. We note, however, specific periods in time where the model appears to have a bias. In the declining phase the model underestimates the flux level, while the opposite occurs for the extreme solar minimum year of 2009. There also appear to be a seasonal bias where the model overestimate/underestimate the flux values during summer/winter. Figure 7 shows the scatter plot of the MEEproxy model vs the observed >43 keV electron flux. It illustrates that the largest errors are found during low to moderate activity. Compared to Figure 4 the improvement using the MEEproxy model on a de-trended AE index is readily evident.
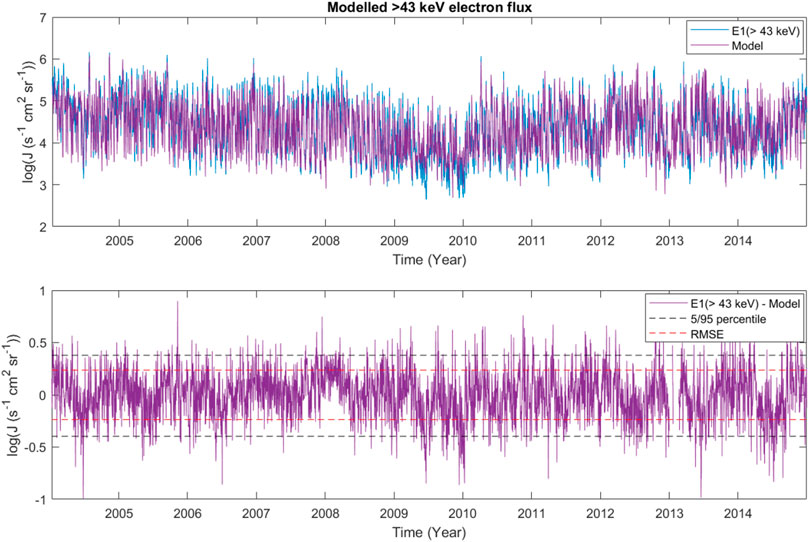
FIGURE 6. The upper panel shows the observed (blue) and modelled (purple) daily resolved fluxes >43 keV in the period from 2004 to 2014. The lower panel shows the difference between the observed and modelled fluxes.
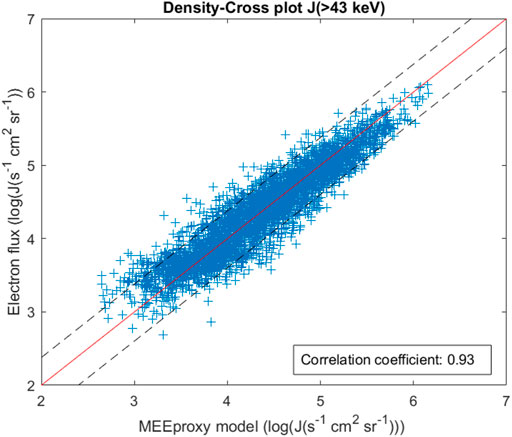
FIGURE 7. Scatter plot of a linear fit of the logarithmic value of the optimized MEEproxy and logarithmic value of the daily >43 keV fluxes. The black, dashed lines show the 95 and 5 percentile of the model errors.
Figure 8 shows the resulting linear fits to the AE-based MEEproxy for >114 keV electron fluxes. The accuracy and weaknesses of the modelled >114 keV fluxes are similar to the modelled >43 keV fluxes as shown in Figure 8. However, Figure 9 shows a tendency of the MEEproxy model to overestimate the fluxes during high activity. Figure 10 and Figure 11 confirm a similar trend for the modelled >292 keV fluxes. All correlation coefficients, including the MLT dependence are listed in Table 3.
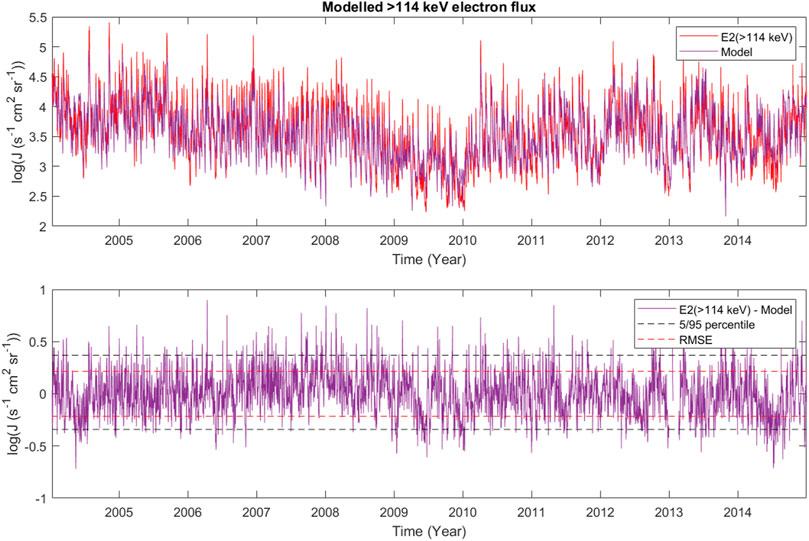
FIGURE 8. The upper panel shows the observed (red) and modelled (purple) daily resolved fluxes >114 keV in the period from 2004 to 2014. The lower panel shows the difference between the observed and modelled fluxes.
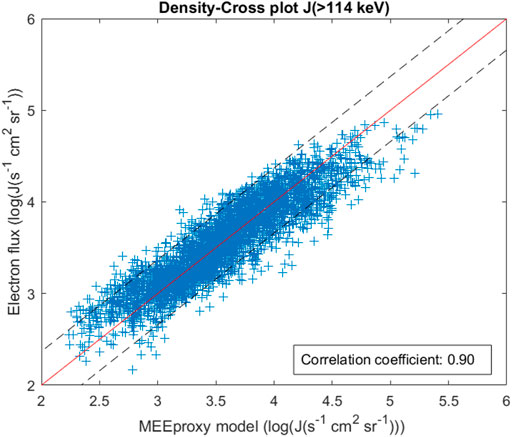
FIGURE 9. Scatter plot of a linear fit of the logarithmic value of the optimized MEEproxy and logarithmic value of the daily >114 keV fluxes. The black, dashed lines show the 95 and 5 percentile of the model errors.
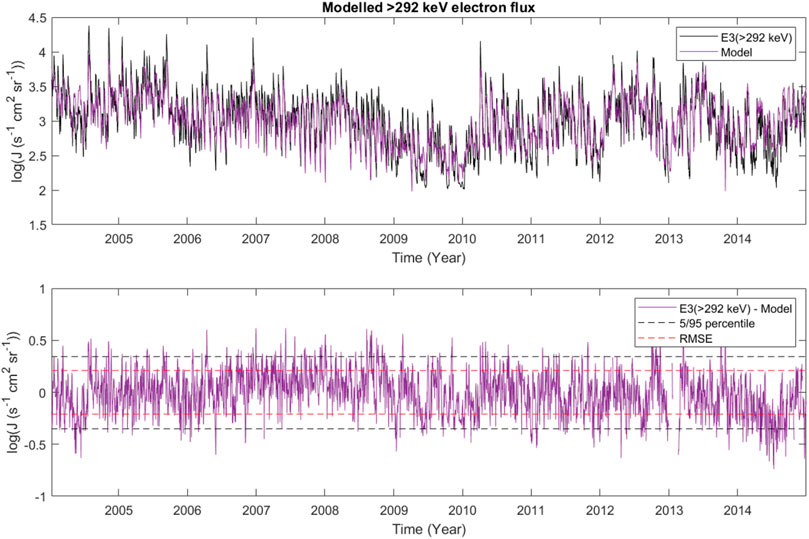
FIGURE 10. The upper panel shows the observed (black) and modelled (purple) daily resolved fluxes >292 keV in the period from 2004 to 2014. The lower panel shows the difference between the observed and modelled fluxes.
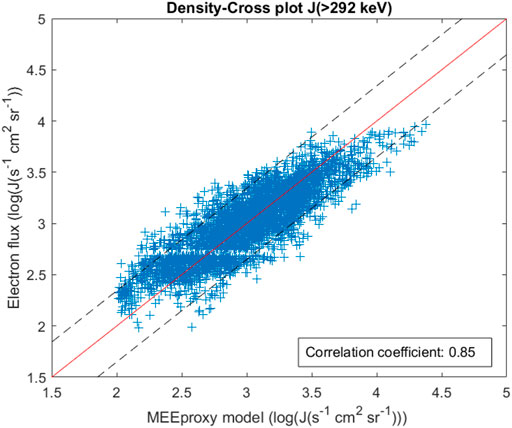
FIGURE 11. Scatter plot of a linear fit of the logarithmic value of the optimized MEEproxy and logarithmic value of the daily >292 keV fluxes. The black, dashed lines show the 95 and 5 percentile of the model errors.

TABLE 3. The Pearson correlation coefficient between daily resolved AE based MEEproxy and the logarithmic value of >43, >114, and >292 keV loss cone fluxes over the 55°–70° CGM latitude band for the years 2004–2014.
There is increasing evidence that substorms are key in driving MEE precipitation (Beharrell et al., 2015; Partamies et al., 2021). Nevertheless, the substorms remain partly unresolved in the existing proxies when considering the MEE precipitation (van de Kamp et al., 2016). In this study, we have explored the prediction capability of AE in regard to MEE precipitation on a daily scale over a full solar cycle. The potential link between the AE index, substorms, and MEE precipitation will be discussed, alongside the progressive time delay between the geomagnetic activity and the MEE precipitation.
The initial correlation study, summarized in Figure 5, reveals a high coherence between the daily AE index with zero lag and >43 keV precipitating electron fluxes. Similarly, Figure 3 suggests a strong coherence with the daily AE index and the daily number of substorms. The magnetotail dipolarization during substorms will directly inject source and seed particles in this energy range, some of which will precipitate into the atmosphere. It is therefore a realistic physical link between the AE intensity and >43 keV fluxes, despite the fact that the >43 keV fluxes deposit their energy below 100 km and do not directly contribute to the intensity of the electrojets. The strong correlation between the AE index and >43 keV fluxes is in agreement with recent studies of the trapped radiation belt electrons. Based on an extensive database of 16 years of corrected MEE flux observations (40–400 keV) from the Research with Adaptive Particle Imaging Detector (RAPID)/Imaging Electron Spectrometer (IES) instrument on board the Cluster mission, Smirnov et al. (2019) reveal that the variability of the outer belt electrons (L-shell 4–6) exhibits a pattern very close to the AE index. Furthermore, Katsavrias et al. (2021) confirm, based on 9 years of electron measurements from GOES-13, 14 and 15, that the trapped electron fluxes at energies in the interval 10–100 keV are well correlated with the AE index consistent with substorm injected source particles.
In the case of the high energy tail of the MEE precipitation, Figure 5 suggests that only 22% of the >292 keV flux variability are described by the daily AE variability. Ødegaard et al. (2017) shows that these higher energy electrons typically peak 1–2 days after the onset of a geomagnetic storm. The progressive time delays of relativistic electrons has also been identified by e.g., Boynton et al. (2016) and Mourenas et al. (2019). The delay implies that it takes time to accelerate the injected seed electrons into several 100 s keV. It will also require a continuous acceleration mechanism. This could be provided during repeated substorm activity, as the source particles will fuel VLF waves and the injected seed particles can be energized as they drift across the substorm induced electric field on the nightside. This means that the precipitating >292 keV fluxes are a product of both the ongoing activity, as well as the substorm activity during the previous days. This potential link is made viable by the simple accumulation of the AE values in Figure 5B. However, the identification of substorm/non-substorm modes might be problematic using the daily resolved AE index, in particular for long active geomagnetic periods. Moreover, VLF acceleration and scattering are not limited to substorm periods.
Katsavrias et al. (2021) also find a reduced correlation between 100–350 keV trapped electron flux and the AE index compared to the 10–100 keV electrons. These higher energies display, however, a strong dependence on the solar wind speed. They suggest that it implies that the acceleration and loss of the seed energies are not purely substorm driven but rather depend on convection driven by the fast solar wind and/or ULF driven inward diffusion. Smirnov et al. (2019) demonstrate a high positive correlation between the 40–400 keV radiation belt electrons and the AE index and solar wind dynamic pressure. Furthermore, Stepanov et al. (2021) confirm the role of solar wind speed as one of the most important predictors for transporting electron fluxes from the plasmasheet to the radiation belt region. Similarly, Ødegaard et al. (2017) show how the >292 keV flux variability depends on the Akasufos’s coupling function. Boynton et al. (2016) developed forecast models for MEE and highly relativistic electrons using the coupling function proposed by (Boynton et al., 2011) and the Dst index. The latter confirms the solar wind dependence while simultaneously accounting for the direction of the Northward interplanetary field direction. Neither the solar wind dependence, nor the coupling function dependence does, however, exclude substorms and the associated VLF wave generation as the working mechanism. In fact, Miyoshi et al. (2013) find that High Speed Solar Wind Streams (HSSWS) alone is not sufficient to cause relativistic electron flux enhancement in the outer radiation belt, but strongly depend on IMF-Bz. They state that this would not be the case if radial transport via ULF waves is the primary mechanism. Miyoshi and Kataoka (2008) suggested that the IMF-Bz dependence could be attributed to substorm occurrence during HSSWS events where the electrons are accelerated via VLF waves. This is in line with the relativistic electron flux enhancements found during intervals of prolonged substorm activity operating on a timescale of the order of days (Bühler & Desorgher, 2002; Meredith et al., 2003).
The lifetimes applied in the MEEproxy are impacted by the lifespan of the MEE particles in the outer radiation belt. The lifespan depends on the energy, radial distance from Earth, and the level of geomagnetic activity. The lifetimes for 100 keV electrons at a radial distance of about four are approximately 3.6 days and 13 h for quiet and active geomagnetic conditions, respectively, and are increasing rapidly with energy to about 131 and 17 days for 1 MeV electrons (Orlova et al., 2016). The expected lifetime can, however, be rapidly reduced in the case of magnetopause shadowing where trapped particles over several radial distances are lost to the magnetopause. This is a consequence of a sudden dynamic pressure increase in the solar wind, alongside convection driven outward radial transport (Turner et al., 2012). Applying a fixed lifetime as suggested in the MEEproxy is therefore unrealistic. The optimized lifetime applied in the MEEproxy is thus only the empirical average based on the applied data. It does, however, demonstrate the potential of an AE based MEEproxy, where the precipitation fluxes are an accumulated effect of both the current and previous geomagnetic activity.
This study reveals the high predictive capabilities of the AE index for MEE precipitation, and how to account for the delayed response of the high energy tail (> 300 keV). Hence, it offers a potential improvement to the current MEE parameterization included in CMIP6 recommendation (Matthes et al., 2017). Nesse Tyssøy et al. (2019) compares the loss cone estimate to the CMIP recommendation and shows an overall underestimation of basic flux strength about one order of magnitude arises from utilizing 0° detector electron fluxes. As this is the same data used to develop the MEEproxy model it is likely that the same assessment will apply if compared to the CMIP recommendation. Furthermore, Nesse Tyssøy et al. (2019) showed that the CMIP recommendation generally captured the initial phase of the storm fluxes, but fell short in respect to reproducing elevated flux levels during the recovery phase of CIR-driven storms. As such, the energy dependent lifetimes applied in the MEEproxy, taking into account the accumulated geomagnetic activity, is likely to avoid this pitfall.
However, for AE to be used as a proxy for MEE precipitation in a more advanced MEE precipitation model, the seasonal bias needs further examination as it could be a source of unequal distribution between the two hemispheres. In addition, Figures 6, 8, 10 show a potential solar cycle bias of a general underestimation in the declining phase. To which extent this is due to the dynamical expansion of the auroral oval and the equatorward shift of the electrojets, where the AE-stations cannot reliably monitor their intensity, needs to be explored. The small number of magnetometer stations and their uneven spatial distribution implies that small perturbations (e.g., isolated substorms and pseudo-breakups) can be undetected and large deflections underestimated if they are constrained in longitude or are located at latitudes poleward or equatorward of the AE station network (Gjerloev et al., 2004). Similarly, the MEE precipitation region does not cover a fixed latitude band, and its dependence with geomagnetic activity is explored in a parallel study. Alternatively, the solar cycle bias might reflect the type of solar wind driver responsible for the geomagnetic disturbances as Corotating Interaction Region (CIR)/High Speed Solar Wind Streams (HSSWS) and Coronal Mass Ejection (CME) driven geomagnetic storms dominate different phases of the solar cycle. For example, the lifetime applied in the MEEproxy can vary in weak but long lasting CIR/HSSWS compared to a short but powerful CME event.
In summary, this study demonstrates that simple AE based MEE-proxies have the capability of explaining at 72–86% of the detected MEE precipitation variance on a daily scale. The model shows, however, caveats in respect to the solar cycle and extreme events that summon further investigations. Nevertheless, 90% of the modelled flux values deviate less than a factor of 2.5 from the observed NOAA/POES MEPED fluxes throughout a full solar cycle. By evaluating the different energy channels, > 43, >114, and >292 keV, independently, the model enables a realistic description of the time dependent energy spectrum. This finding will form the base of a new MEE model to be used for future studies of the energetic electron precipitation impact on the atmosphere.
Publicly available datasets were analyzed in this study. This data can be found here: https://www.ngdc.noaa.gov/stp/satellite/poes/dataaccess.htmlhttp://wdc.kugi.kyoto-u.ac.jp/wdc/Sec3.htmlhttps://supermag.jhuapl.edu/substorms/
HNT conceived idea of this paper, in charge of the analysis, and writing as lead author. NP contributed to the idea of this paper and editing of the manuscript. EMB is responsible for constructing the MLT dependent daily resolved electron flux and editing of the manuscript. CS-J contributed to editing of the manuscript. JAS contributed to editing of the manuscript.
The study is supported by the Norwegian Research Council (NRC) under contract 223252, 302040 and 287427. HNT further acknowledge the Young CAS (Centre for Advanced Studies) fellow program.
The authors declare that the research was conducted in the absence of any commercial or financial relationships that could be construed as a potential conflict of interest.
All claims expressed in this article are solely those of the authors and do not necessarily represent those of their affiliated organizations, or those of the publisher, the editors and the reviewers. Any product that may be evaluated in this article, or claim that may be made by its manufacturer, is not guaranteed or endorsed by the publisher.
The NOAA/POES data used in this study are available from the National Oceanic and Atmospheric Administration (https://www.ngdc.noaa.gov/stp/satellite/poes/dataaccess.html). The AE index used in this paper was provided by the WDC for Geomagnetism, Kyoto (http://wdc.kugi.kyoto-u.ac.jp/wdc/Sec3.html). We also acknowledge the substorm timing list identified by the Newell and Gjerloev technique (Newell and Gjerloev, 2011), the SMU and SML indices (Newell and Gjerloev, 2011); and the SuperMAG collaboration (Gjerloev, 2012) (https://supermag.jhuapl.edu/substorms/).
Ahn, B.-H., Kroehl, H. W., Kamide, Y., and Kihn, E. A. (2000). Seasonal and Solar Cycle Variations of the Auroral Electrojet Indices. J. Atmos. Solar-Terrestrial Phys. 62 (14), 1301–1310. doi:10.1016/s1364-6826(00)00073-0
Andersson, M. E., Verronen, P. T., Wang, S., Rodger, C. J., Clilverd, M. A., and Carson, B. R. (2012). Precipitating Radiation belt Electrons and Enhancements of Mesospheric Hydroxyl during 2004-2009. J. Geophys. Res. 117 (D9). doi:10.1029/2011JD017246
Beharrell, M. J., Honary, F., Rodger, C. J., and Clilverd, M. A. (2015). Substorm-induced Energetic Electron Precipitation: Morphology and Prediction. J. Geophys. Res. Space Phys. 120 (4), 2993–3008. doi:10.1002/2014ja020632
Borovsky, J. E., and Yakymenko, K. (2017). Substorm Occurrence Rates, Substorm Recurrence Times, and Solar Wind Structure. J. Geophys. Res. Space Phys. 122 (3), 2973–2998. doi:10.1002/2016ja023625
Boynton, R. J., Balikhin, M. A., Billings, S. A., Wei, H. L., and Ganushkina, N. (2011). Using the Narmax Ols-Err Algorithm to Obtain the Most Influential Coupling Functions that Affect the Evolution of the Magnetosphere. J. Geophys. Res. Space Phys. 116 (A5). doi:10.1029/2010ja015505
Boynton, R. J., Balikhin, M. A., Sibeck, D. G., Walker, S. N., Billings, S. A., and Ganushkina, N. (2016). Electron Flux Models for Different Energies at Geostationary Orbit. Space Weather 14 (10), 846–860. doi:10.1002/2016sw001506
Bühler, P., and Desorgher, L. (2002). Relativistic Electron Enhancements, Magnetic Storms, and Substorm Activity. J. Atmos. Solar-Terrestrial Phys. 64 (5), 593–599. doi:10.1016/s1364-6826(02)00017-2
Clilverd, M. A., Rodger, C. J., van de Kamp, M., and Verronen, P. T. (2020). Electron Precipitation from the Outer Radiation belt during the St. Patrick’s Day Storm 2015: Observations, Modeling, and Validation. J. Geophys. Res. Space Phys. 125 (2), e2019JA027725. doi:10.1029/2019ja027725
Dai, L., Wygant, J. R., Cattell, C. A., Thaller, S., Kersten, K., Breneman, A., et al. (2014). Evidence for Injection of Relativistic Electrons into the Earth's Outer Radiation belt via Intense Substorm Electric fields. Geophys. Res. Lett. 41 (4), 1133–1141. doi:10.1002/2014gl059228
Davis, T. N., and Sugiura, M. (1966). Auroral Electrojet Activity indexAEand its Universal Time Variations. J. Geophys. Res. 71 (3), 785–801. doi:10.1029/jz071i003p00785
Evans, D. S., and Greer, M. S. (2004). Polar Orbiting Environmental Satellite Space Environment Monitor - 2: Instrument Descriptions and Archive Data Documentation. Boulder, Colorado: NOAA Technical Memorandum, 93. version 1.4
Gjerloev, J. W., Hoffman, R. A., Friel, M. M., Frank, L. A., and Sigwarth, J. B. (2004). Substorm Behavior of the Auroral Electrojet Indices. Ann. Geophys. 22 (6), 2135–2149. doi:10.5194/angeo-22-2135-2004
Gjerloev, J. W. (2012). The Supermag Data Processing Technique. J. Geophys. Res. Space Phys. 117 (A9), 9213. doi:10.1029/2012ja017683
Jaynes, A. N., Baker, D. N., Singer, H. J., Rodriguez, J. V., Loto'aniu, T. M., Ali, A. F., et al. (2015). Source and Seed Populations for Relativistic Electrons: Their Roles in Radiation belt Changes. J. Geophys. Res. Space Phys. 120 (9), 7240–7254. doi:10.1002/2015ja021234
Katsavrias, C., Aminalragia–Giamini, S., Papadimitriou, C., Sandberg, I., and Jiggens, P. (2021). Daglis, I.,and Evans, HOn the Interplanetary Parameter Schemes Which Drive the Variability of the Source/seed Electron Population at Geo. Journal of Geophysical Research. Space Phys. 126 (6), e2020JA028939. doi:10.1029/2020ja028939
Kauristie, K., Morschhauser, A., Olsen, N., Finlay, C. C., McPherron, R. L., Gjerloev, J. W., et al. (2017). On the Usage of Geomagnetic Indices for Data Selection in Internal Field Modelling. Space Sci. Rev. 206, 61–90. doi:10.1007/s11214-016-0301-0
Kennel, C. F., and Petschek, H. E. (1966). Limit on Stably Trapped Particle Fluxes. J. Geophys. Res. (1896-1977) 71 (1), 1–28. doi:10.1029/jz071i001p00001
Li, L. Y., Cao, J. B., Zhou, G. C., and Li, X. (2009). Statistical Roles of Storms and Substorms in Changing the Entire Outer Zone Relativistic Electron Population. J. Geophys. Res. Space Phys. 114 (A12). doi:10.1029/2009ja014333
Maliniemi, V., Asikainen, T., and Mursula, K. (2016). Effect of Geomagnetic Activity on the Northern Annular Mode: Qbo Dependence and the holton-tan Relationship. J. Geophys. Res. Atmospheres 121 (17), 10043–10055. doi:10.1002/2015jd024460
Matthes, K., Funke, B., Andersson, M. E., Barnard, L., Beer, J., Charbonneau, P., et al. (2017). Solar Forcing for CMIP6 (v3.2). Geosci. Model. Dev. 10, 2247–2302. doi:10.5194/gmd-10-2247-2017
McPherron, R. L. (2015). “Earth's Magnetotail,” in Magnetotails in the Solar System (American Geophysical Union), 61–84. doi:10.1002/9781118842324.ch4
Meredith, N. P., Cain, M., Horne, R. B., Thorne, R. M., Summers, D., and Anderson, R. R. (2003). Evidence for Chorus-Driven Electron Acceleration to Relativistic Energies from a Survey of Geomagnetically Disturbed Periods. J. Geophys. Res. Space Phys. 108 (A6). doi:10.1029/2002ja009764
Mironova, I. A., Artamonov, A. A., Bazilevskaya, G. A., Rozanov, E. V., Kovaltsov, G. A., Makhmutov, V. S., et al. (2019). Ionization of the Polar Atmosphere by Energetic Electron Precipitation Retrieved from Balloon Measurements. Geophys. Res. Lett. 46 (2), 990–996. doi:10.1029/2018gl079421
Miyoshi, Y., and Kataoka, R. (2008). Flux Enhancement of the Outer Radiation belt Electrons after the Arrival of Stream Interaction Regions. J. Geophys. Res. Space Phys. 113 (A3). doi:10.1029/2007ja012506
Miyoshi, Y., Kataoka, R., Kasahara, Y., Kumamoto, A., Nagai, T., and Thomsen, M. F. (2013). High‐speed Solar Wind with Southward Interplanetary Magnetic Field Causes Relativistic Electron Flux Enhancement of the Outer Radiation belt via Enhanced Condition of Whistler Waves. Geophys. Res. Lett. 40 (17), 4520–4525. doi:10.1002/grl.50916
Mourenas, D., Artemyev, A. V., and Zhang, X. J. (2019). Impact of Significant Time‐Integrated Geomagnetic Activity on 2‐MeV Electron Flux. J. Geophys. Res. Space Phys. 124 (6), 4445–4461. doi:10.1029/2019ja026659
Nesse Tyssøy, H., Haderlein, A., Sandanger, M. I., and Stadsnes, J. (2019). Intercomparison of the POES/MEPED Loss Cone Electron Fluxes with the CMIP6 Parametrization. J. Geophys. Res. Space Phys. 124, 628–642. doi:10.1029/2018JA025745
Nesse Tyssøy, H., Sandanger, M. I., Ødegaard, L.-K. G., Stadsnes, J., Aasnes, A., and Zawedde, A. E. (2016). Energetic Electron Precipitation into the Middle Atmosphere—Constructing the Loss Cone Fluxes from Meped Poes. J. Geophys. Res. Space Phys. 121 (6), 5693–5707. doi:10.1029/2004JA010485
Newell, P. T., and Gjerloev, J. W. (2011). Evaluation of SuperMAG Auroral Electrojet Indices as Indicators of Substorms and Auroral Power. J. Geophys. Res. 116 (A15). doi:10.1029/2011JA016779
Ødegaard, L.-K. G., Tyssøy, H. N., Sandanger, M. I. J., Stadsnes, J., and Søraas, F. (2016). Space Weather Impact on the Degradation of Noaa Poes Meped Proton Detectors. J. Space Weather Space Clim. 6, A26. doi:10.1051/swsc/2016020
Ødegaard, L. K. G., Tyssøy, H. N., Søraas, F., Stadsnes, J., and Sandanger, M. I. (2017). Energetic Electron Precipitation in Weak to Moderate Corotating Interaction Region‐driven Storms. J. Geophys. Res. Space Phys. 122 (3), 2900–2921. doi:10.1002/2016ja023096
Orlova, K., Shprits, Y., and Spasojevic, M. (2016). New Global Loss Model of Energetic and Relativistic Electrons Based on Van allen Probes Measurements. J. Geophys. Res. Space Phys. 121 (2), 1308–1314. doi:10.1002/2015ja021878
Partamies, N., Tesema, F., Bland, E., Heino, E., Nesse Tyssøy, H., and Kallelid, E. (2021). Electron Precipitation Characteristics during Isolated, Compound, and Multi-Night Substorm Events. Ann. Geophys. 39 (1), 69–83. doi:10.5194/angeo-39-69-2021
Pettit, J. M., Randall, C. E., Peck, E. D., Marsh, D. R., Kamp, M., Fang, X., et al. (2019). Atmospheric Effects of >30‐keV Energetic Electron Precipitation in the Southern Hemisphere Winter during 2003. J. Geophys. Res. Space Phys. 124 (10), 8138–8153. doi:10.1029/2019ja026868
Rodger, C., Carson, B., Cummer, S., Gamble, R., Clilverd, M., Green, J., et al. (2010). Contrasting the Efficiency of Radiation belt Losses Caused by Ducted and Nonducted Whistler-Mode Waves from Ground-Based Transmitters. J. Geophys. Res. Space Phys. 115 (A12). doi:10.1029/2010ja015880
Rodger, C. J., Cresswell‐Moorcock, K., and Clilverd, M. A. (2016). Nature's Grand Experiment: Linkage between Magnetospheric Convection and the Radiation Belts. J. Geophys. Res. Space Phys. 121 (1), 171–189. doi:10.1002/2015ja021537
Sandanger, M. I., Ødegaard, L. K. G., Nesse Tyssøy, H., Stadsnes, J., Søraas, F., Oksavik, K., et al. (2015). In‐flight Calibration of NOAA POES Proton Detectors-Derivation of the MEPED Correction Factors. J. Geophys. Res. Space Phys. 120 (11), 9578–9593. doi:10.1002/2015ja021388
Sætre, C., Stadsnes, J., Nesse, H., Aksnes, A., Petrinec, S. M., Barth, C. A., et al. (2004). Energetic Electron Precipitation and the No Abundance in the Upper Atmosphere: A Direct Comparison during a Geomagnetic Storm. J. Geophys. Res. Space Phys. 109 (A9). doi:10.1029/2004JA010485
Seppälä, A., Clilverd, M. A., Beharrell, M. J., Rodger, C. J., Verronen, P. T., Andersson, M. E., et al. (2015). Substorm‐induced Energetic Electron Precipitation: Impact on Atmospheric Chemistry. Geophys. Res. Lett. 42 (19), 8172–8176. doi:10.1002/2015gl065523
Seppälä, A., Lu, H., Clilverd, M. A., and Rodger, C. J. (2013). Geomagnetic Activity Signatures in Wintertime Stratosphere Wind, Temperature, and Wave Response. J. Geophys. Res. Atmos. 118 (5), 2169–2183. doi:10.1002/jgrd.50236
Sinnhuber, M., Friederich, F., Bender, S., and Burrows, J. P. (2016). The Response of Mesospheric NO to Geomagnetic Forcing in 2002-2012 as Seen by SCIAMACHY. J. Geophys. Res. Space Phys. 121, 3603–3620. doi:10.1002/2015JA022284
Smirnov, A. G., Kronberg, E. A., Latallerie, F., Daly, P. W., Aseev, N., Shprits, Y. Y., et al. (2019). Electron Intensity Measurements by the Cluster/RAPID/IES Instrument in Earth's Radiation Belts and Ring Current. Space Weather 17 (4), 553–566. doi:10.1029/2018sw001989
Stepanov, N. A., Sergeev, V. A., Sormakov, D. A., Andreeva, V. A., Dubyagin, S. V., and Ganushkina, N. (2021). Superthermal Proton and Electron Fluxes in the Plasma Sheet Transition Region and Their Dependence on Solar Wind Parameters. Journal of Geophysical Research. Space Phys. 126 (4), e2020JA028580. doi:10.1029/2020ja028580
Tanskanen, E. (2009). A Comprehensive High-Throughput Analysis of Substorms Observed by Image Magnetometer Network: Years 1993–2003 Examined. J. Geophys. Res. Space Phys. 114 (A5). doi:10.1029/2008ja013682
Tanskanen, E., Pulkkinen, T. I., Koskinen, H. E. J., and Slavin, J. A. (2002). Substorm Energy Budget during Low and High Solar Activity: 1997 and 1999 Compared. J. Geophys. Res. Space Phys. 107 (A6). doi:10.1029/2001ja900153
Theodoridis, G. C., and Paolini, F. R. (1967). Pitch Angle Diffusion of Relativistic Outer belt Electrons. Ann. Geophys., 375–381.
Turner, D. L., Shprits, Y., Hartinger, M., and Angelopoulos, V. (2012). Explaining Sudden Losses of Outer Radiation belt Electrons during Geomagnetic Storms. Nat. Phys 8, 208–212. doi:10.1038/nphys2185
Turunen, E., Verronen, P. T., Seppälä, A., Rodger, C. J., Clilverd, M. A., and Tamminen, J. (2009). … Ulich, TImpact of Different Energies of Precipitating Particles on Nox Generation in the Middle and Upper Atmosphere during Geomagnetic Storms. J. Atmos. Solar-Terrestrial Phys. 71 (10), 1176–1189. doi:10.1016/j.jastp.2008.07.005
van de Kamp, M., Seppälä, A., Clilverd, M. A., Rodger, C. J., Verronen, P. T., and Whittaker, I. C. (2016). A Model Providing Long-Term Data Sets of Energetic Electron Precipitation during Geomagnetic Storms. J. Geophys. Res. Atmos. 121, 12520–12540. doi:10.1002/2015JD024212
Yando, K., Millan, R. M., Green, J. C., and Evans, D. S. (2011). A Monte Carlo Simulation of the Noaa Poes Medium Energy Proton and Electron Detector Instrument. Journal of Geophysical Research:. Space Phys. 116 (A10). doi:10.1029/2011ja016671
Keywords: energetic electron precipitation, medium energy electrons, outer radiation belt, auroral electrojet index, substorms
Citation: Tyssøy HN, Partamies N, Babu EM, Smith-Johnsen C and Salice JA (2021) The Predictive Capabilities of the Auroral Electrojet Index for Medium Energy Electron Precipitation. Front. Astron. Space Sci. 8:714146. doi: 10.3389/fspas.2021.714146
Received: 24 May 2021; Accepted: 15 September 2021;
Published: 04 October 2021.
Edited by:
Scott Alan Thaller, University of Colorado Boulder, United StatesReviewed by:
Victor Sergeev, Saint Petersburg State University, RussiaCopyright © 2021 Tyssøy, Partamies, Babu, Smith-Johnsen and Salice. This is an open-access article distributed under the terms of the Creative Commons Attribution License (CC BY). The use, distribution or reproduction in other forums is permitted, provided the original author(s) and the copyright owner(s) are credited and that the original publication in this journal is cited, in accordance with accepted academic practice. No use, distribution or reproduction is permitted which does not comply with these terms.
*Correspondence: H. Nesse Tyssøy, aGlsZGUubmVzc2VAdWliLm5v
Disclaimer: All claims expressed in this article are solely those of the authors and do not necessarily represent those of their affiliated organizations, or those of the publisher, the editors and the reviewers. Any product that may be evaluated in this article or claim that may be made by its manufacturer is not guaranteed or endorsed by the publisher.
Research integrity at Frontiers

Learn more about the work of our research integrity team to safeguard the quality of each article we publish.