 Neha Sachdeva1
 Laurent Poughon2
 Olivier Gerbi3
 Claude-Gilles Dussap2Christophe Lasseur4
 Baptiste Leroy1
 Ruddy Wattiez1*
- 1Department of Proteomic and Microbiology, Research Institute of Biosciences, University of Mons, Mons, Belgium
- 2Institut Pascal, CNRS, SIGMA Clermont, Université Clermont Auvergne, Aubière, France
- 3Sherpa Engineering, Nanterre, France
- 4European Space Agency, ESA/ESTEC, Noordwijk, Netherlands
Long-duration human space missions require considerable amounts of water, oxygen, and nutritious biomass. Additionally, the space vehicles must be well equipped to deal with metabolic human waste. It is therefore important to develop life-support systems which make these missions self-sufficient in terms of water, food, and oxygen production as well as waste management. One such solution is the employment of regenerative life-support systems that use biological and chemical/physical processes to recycle crew waste, revitalize air, and produce water and food. Photosynthetic cyanobacteria Limnospira could play a significant role in meeting these objectives. Limnospira can metabolize CO2 and nitrogen-rich human waste to produce oxygen and edible biomass. So far, life-support system studies have mainly focused on using chemical/physical methods to recycle water, degrade human waste, and recycle CO2 into oxygen. Nowadays, additional microbial processes are considered, such as nitrification of urea–ammonium–rich human waste and then using the nitrate for cyanobacterial cultivation and air vitalization. This cascade of multiple processes tends to increase the complexity of the life-support systems. The possibility of using non-nitrified urine for Limnospira cultivation can partially solve these issues. Our previous studies have shown that it is possible to cultivate Limnospira with urea and ammonium, the prominent nitrogen forms present in non-nitrified urine. In this study, we investigated the possibility of cultivating Limnospira with the different nitrogen forms present in non-nitrified urine and also evaluated their effect on the oxygen production capacity of Limnospira. For this 35-day-long study, we worked on a simplified version of the European Space Agency’s MELiSSA. During this ground demonstration study, we monitored the effect of urea and ammonium (vs. nitrate) on the oxygen production capacity of Limnospira. A deterministic control law, developed and validated on the basis of a stochastic light-transfer model, modulated (increase/decrease) the incident light on the photobioreactor (with Limnospira) to control oxygen levels in the closed loop. The CO2 from the mouse compartment was recycled as a carbon source for Limnospira. We observed that while the system could meet the desired oxygen levels of 20.3% under the nitrate and urea regime, it could only reach a maximum O2 level of 19.5% under the ammonium regime.
Introduction
Current space missions mainly rely on physical/chemical processes for water recycling and air revitalization. Food and other consumables are periodically resupplied from Earth. However, constraints associated with the payload, launch technologies, and distance would drastically restrict such resupplies for future space missions to distant planets like Mars. Depending on the orbital distance and the synodic period, a one-way trip to Mars can take around 300 days (Portee, 2001). An average person needs 15–20 kg of essential supplies per day in terms of O2, food, drinking water, and hygiene water (Farges et al., 2008; Anderson et al., 2018). This effectively means that around 90–120 ton of essential supplies would be needed for a crew of 6.0 people for a 1,000-day return mission to Mars. Lowering this payload will be an asset for the long-duration human space missions. Although certain chemical methods are currently used to recycle water and O2 on board space flights, food and other essential supplies have to be periodically resupplied from Earth. Furthermore, provisions must be made to safely deal with human metabolic waste, and efforts must be made to reduce the dependence on physical and chemical waste treatment processes. It is therefore important to look for practical alternatives to increase the self-sustainability of long-term human space missions in terms of food production, air revitalization, waste management, and water recycling.
Several international space agencies and research organizations have been investigating the possibility of cultivating photosynthetic species (microalgae, cyanobacteria, and plants) on board space flights for food production, air revitalization, waste management, and water recycling (Karel, 1982; MacElroy and Bredt, 1984; MacElroy et al., 1987; Mergaey et al., 1988; Gitelson et al., 1989; Lasseur et al., 1996; Kibe et al., 1997; Perchonok et al., 2001; Farges et al., 2008; Lasseur et al., 2010; Hader, 2019; Helisch et al., 2020; Zhang et al., 2020).
The erstwhile USSR (now Russia) was one of the pioneers that worked on microalgae-based regenerative life-support systems (LSSs) (Gitelson et al., 1989). Their LSS mainly had four compartments: one for algae (Chlorella sp.), one for the crew, and two for plants (wheat and vegetables). The first test on this system (1972) mainly focused on water and CO2 recycling and lasted for 180 days. For this study, food (for human consumption) was sourced externally, and no provision was made for metabolic waste treatment within the LSS.
The National Aeronautics and Space Administration (NASA), United States, started to work on their microalgae-based regenerative LSS under the project name Controlled Ecological Life Support System (CELSS) (MacElroy and Bredt, 1984; Averner, 1990). The CELSS was conceived with the aim of producing edible biomass from plants and microalgae (Chlorella sp.). The system also aimed to purify water, revitalize air, and recycle waste under closed-loop conditions (MacElroy et al., 1987). However, the CELSS project was soon discarded, and NASA decided to focus their life-support research on the plant compartment under the project name VEGGIE (NASA Techport, 2017; Massa et al., 2018; Monje et al., 2020). Nowadays, NASA is exploring the possibility of using their VEGGIE compartment for the cocultivation of plants and the microalgae C. reinhardtii. NASA researchers have recently been working on the development of bioprocesses and cultivation systems that can protect the microalgae from the inhibitory effects of microgravity and harmful radiations (Monje et al., 2020).Zhang et al. (2020) used molecular techniques to design tissue bag–based cultivation systems for the cultivation of UV–resistant mutants of the microalgae C. reinhardtii in the VEGGIE growth chamber.
The Japanese Aerospace Exploration Agency (JAXA) is also investigating the possibility of including photosynthetic microalgae (Chlamydomonas sp.) for waste recycling and production of food and O2 under the umbrella of their regenerative LSS project, the Closed Ecology Experiment Facility (CEEF) (Kibe et al., 1997; Kage et al., 2011; Kage et al., 2013).
The European Space Agency (ESA), through its MELiSSA (Micro Ecological Life Support System Alternative) project, is currently involved in the development of a self-sustainable regenerative LSS project. Structurally, MELiSSA is inspired by the function of a natural lake ecosystem. The five compartments of the MELiSSA loop (see Figure 1A, De Meur, 2017) mimic the various functions of the lake ecosystem. Briefly, the first compartment (CI), which is inhabited by consortia of thermophilic bacteria, degrades the complex human waste and inedible plant biomass to volatile fatty acids (VFAs), carbon dioxide (CO2), and ammonium (NH4+). These VFAs are then further oxidized to CO2 and NH4+ in the second compartment (CII) inhabited by the purple photosynthetic bacteria Rhodospirillum rubrum. The nitrifying bacteria in the third compartment (CIII) then oxidize NH4+ to nitrate (NO3−), which is then used as the nitrogen (N) source along with CO2 for cultivation of the cyanobacteria Limnospira indica (formerly Arthrospira sp. PCC 8005) and plants in the producer compartments CIVa and CIVb, respectively. The O2, water, and edible biomass produced in the producer compartments are consumed by the crew in the consumer compartment.
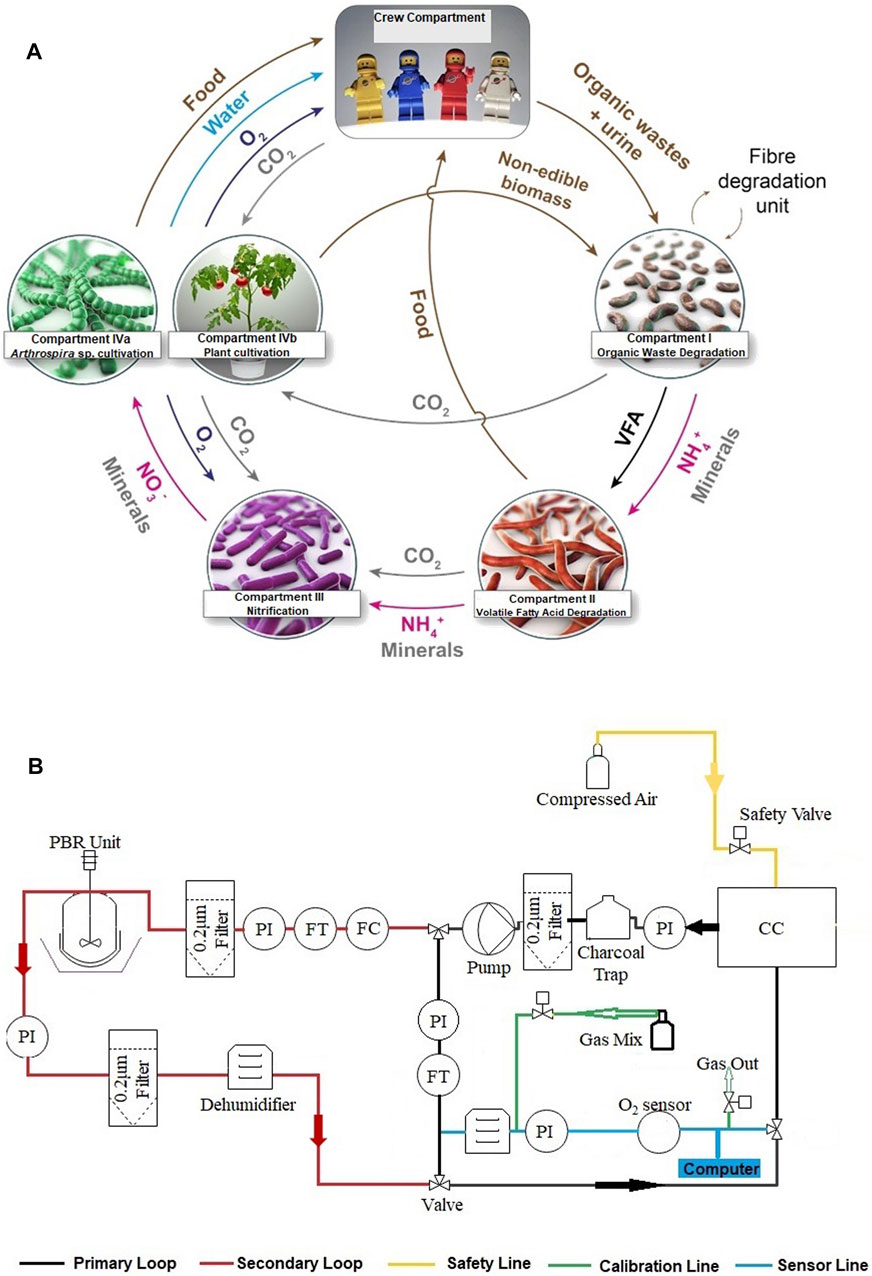
FIGURE 1. (A) Schematic of the Micro Ecological Life Support System Alternative (MELiSSA) loop. (B) Schematic of the breadboard layout used for the ground demonstration study. PBR unit, photobioreactor plus the lightening unit; PI, pressure monitor; FT, flow transmitter; FC, flow controller; CC, consumer compartment; O2, oxygen sensor.
MELiSSA scientists and engineers have conducted several studies in the past to investigate the efficiency and performance of the interconnectivity of two or more compartments under closed-loop conditions (Demey et al., 2000; Alemany et al., 2019). These terrestrial studies, also known as ground demonstration (GD) studies, were based on the premise that the nitrification compartment (CIII) will convert urea and NH4+ to NO3−, which will then be used for cyanobacterial cultivation in the producer compartment. However, the suboptimal operation of the nitrification compartment could result in incomplete nitrification. This, in turn, would result in the transfer of urea- and NH4+-rich waste streams into compartment CIVa. Therefore, it is necessary to evaluate the possibility of using partially nitrified or even non-nitrified urine (urea and NH4+ rich) for cyanobacterial cultivation and understand their effect on the biomass yield, biomass composition/quality (biochemistry), and O2 productivity.
Several studies have been conducted in the past to evaluate the effect of different N-sources (NH4+, NO3−, NO2−, and urea), their feeding mode (batch, fed batch, or continuous), and concentrations on the overall yield and quality/composition of Limnospira biomass (Sassano et al., 2004; Avila-Leon et al., 2012; Markou, 2015; Deschoenmaeker et al., 2017; Sachdeva et al., 2018a; Sachdeva et al., 2018b). These studies have shown that compared to NO3−, urea enhances the protein and pigment content in the Limnospira biomass (Sassano et al., 2004; Avila-Leon et al., 2012 and Sachdeva et al., 2018b). In contrast, NH4+ feeding has been reported to increase the lipid and exopolysaccharide content in the Limnospira biomass while decreasing biomass yield (Sassano et al., 2010; Markou et al., 2014; Deschoenmaeker et al., 2017; Sachdeva et al., 2018a; Sachdeva et al., 2018b). These previous studies have hence established the following: 1) it is possible to cultivate Limnospira with alternative N-sources and 2) changing the N-concentration, N–source type, and feeding mode could modify the biochemical composition and biomass yield of Limnospira.
However, none of these studies had evaluated the effect of the alternative N-sources on the O2 production and air revitalization potential of Limnospira. In order to fill this gap, we conducted the present GD study, wherein we evaluated the O2 production capacity and air revitalization characteristics of Limnospira under closed-loop conditions of the MELiSSA LSS. For this study, Limnospira was cultivated in a photobioreactor (PBR)/producer compartment, and the mouse, housed in a closed animal cage, was used as the consumer. The producer compartment and the consumer compartment were connected through a closed and airtight gas loop. The complete setup (breadboard) is described under Figure 1B.
The O2 produced in the producer compartment was used for air revitalization in the consumer compartment, and the CO2 from the consumer compartment was used as the carbon source for cyanobacterial cultivation in the producer compartment. A stochastic light-transfer–based model developed in our previous study (Sachdeva et al., 2018a) was used to define a deterministic control law which controlled the O2 levels in the producer compartment by modulating the incident light flux on the PBR. As part of study protocol (Figure 2), the N-sources in the cyanobacterial feeding medium were changed between NO3−, NH4+, and urea.
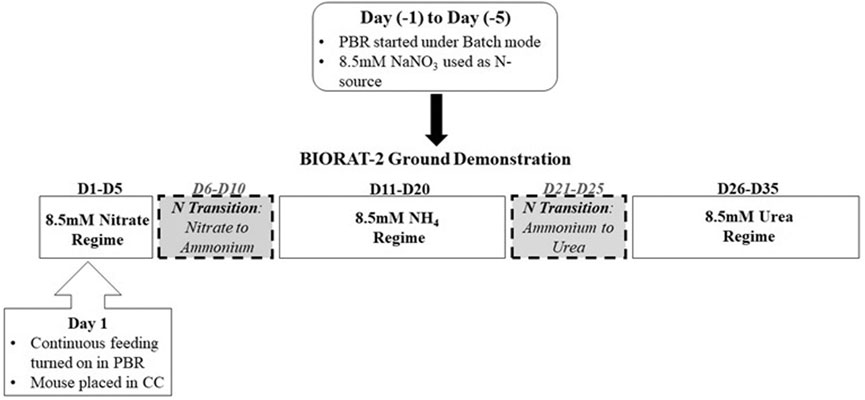
FIGURE 2. Schematic of the timelines and study protocol adopted for the ground demonstration study.
The preliminary data obtained through this 35-day-long GD study clearly demonstrated the following: 1) it is possible to couple the producer compartment and the consumer compartment under the closed-loop conditions for air revitalization and 2) it is possible to use different N-forms (present in untreated urine) for cyanobacterial cultivation and O2 production.
Materials and Methods
System Setup: Connections Between the Compartments and Data Monitoring
The basic layout of the GD breadboard is represented in Figure 1B. The producer compartment and the consumer compartment were connected via a closed gas loop. The EU directive 2010/63/EU mandates a minimum of 10 air exchanges per hour for an animal compartment. Accordingly, a minimum air flow rate of 55.0 L/h was required for this 11.5-L cage. On the other hand, the gas flow rate in the PBR had to be maintained below 3.0 L/h to avoid cell shearing and culture foaming. This PBR flow rate was decided as per the results of our preliminary tests (data not shown). To accommodate two separate gas flow rates, the gas loop was bifurcated into the primary and secondary loops.
The primary loop mainly consisted of the consumer compartment, pressure monitor (PI), flow transmitter (FT), and flow controller (FC). The gas flow rate in the primary loop was maintained at 55 L/h using an external pump. The presence of the activated charcoal trap and 0.2-micron filter prevented the transmission of microbes and ammonia from the consumer compartment to the gas loop (in the primary loop). The consumer compartment outlet was connected to a sensor line, which continuously monitored the O2 levels in molar percentage. This sensor line consisted of a dehumidifying bottle, a flow controller, and an O2 sensor. The O2 sensor (9212-5AD, Analox Sensor Technology, United States) used for this study was found to be sensitive to high gas flow rates. Therefore, the gas flow rate in the sensor line was controlled at 100 ml/min.
A calibration line was also provided along the sensor line to ensure periodic calibration of the O2 sensor without opening the gas loop. Two gas mixes were used: 1) 99.99% N2 (for zero) and 2) 21% O2, 1.0% CO2, and 78% N2 (similar to the atmospheric O2 composition). A safety line (safety valve) was also connected to the consumer compartment outlet. This safety valve ensured the opening of the closed gas loop in case the O2 levels in the consumer compartment increased or decreased beyond the safety range (17.5–24% O2). The other end of this safety line was connected to a compressed air cylinder that ensured air supply to the consumer compartment in the case of system failure.
The secondary loop consisted of the producer compartment (the PBR and lightening unit). The manual valves, flow transmitter, and low controller were provided throughout the secondary loop to control and monitor the gas flow. The control law (see below) modulated the incident light flux of this lightening system that is attached to the PBR. The outlet of the PBR was connected to a dehumidifying bottle, PI, and 0.2-micron filter.
Cyanobacterial Culture and Photobioreactor Setup
The stock culture of the Limnospira indica (previously Arthrospira sp. PCC 8005) strain was maintained under axenic conditions in Cogne-Modified Zarrouk Medium (Cogne et al., 2003) with 8.5 mM NaNO3 as the N-source (Sachdeva et al., 2018b). For the GD test, Limnospira indica was cultivated in a 2.0-L double-jacked cylindrical PBR (Biostat®, Sartorius AG, Germany). The PBR was radially illuminated using 14 cool-white light bulbs (4000 K, 12 V, Philips), and the culture was mixed at 150 rpm using a Rushton turbine. The PBR working volume, dilution rate, and incident light flux were selected on the basis of the respiratory requirements of the 21.4-gm mouse used as the consumer for this study (see the following section). The details of the criteria used to define these working parameters have been defined in the study by Demey et al. (2000) and will not be discussed here. This setup (the PBR culture vessel and lightening unit) was termed as the producer compartment. Limnospira indica was cultivated at a controlled temperature (36°C) and pH (8.5) in carbonate- and bicarbonate-free Zarrouk medium. CO2 from the consumer compartment served as the carbon source for Limnospira. pH was controlled using 0.5 N HCl and 1.0 N NaOH. Based on the study protocol (Figure 2), the N-source (8.5 mM each) in the feeding medium was changed between NaNO3, NH4Cl, and urea. A pH value of 8.5 was chosen to avoid loss of NH4+ as NH3 (Sachdeva et al., 2018a). Under the current cultivation conditions (pH, dilution rate, and biomass concentrations), CO2/carbon limitation was not foreseen. This simulation is based on the results of a previous MELiSSA LSS study (Demey et al., 2000) and hence is not discussed here.
Prior to the start of the GD study, the PBR was maintained under the batch mode (with 8.5 mM NaNO3) for five days [Day (−1) to Day (−5)]. Once the culture reached an optical density (at 750 nm) of 1.5 ± 0.2, the continuous feeding was started, and this day was termed as Day (D) 1 of the GD study. The dilution/feeding rate for the continuous feeding was fixed at 0.2 (volume) per day to maintain the culture OD at 1.5 ± 0.2. This dilution rate and reference OD were adopted on the basis of the results of our previous study (Sachdeva et al., 2018a), which was used to define the control law used for this GD study (see following sections). Based on this dilution rate, one residence time was defined at 5 days. The mouse was put in the consumer compartment on D1 of the GD study.
The nitrate regime was used as the control for this study, and accordingly, the PBR was maintained under the continuous feeding of 8.5 mM NaNO3 for five days (D1–D5). This period is termed as the NO3− regime.
The first transition to 8.5 mM NH4Cl was performed on D6. The first five days (D6–D10) of the NO3−-to-NH4+ transition were excluded from the NH4+ regime (Supplementary Figure 1) to avoid quantitative bias (see the discussion section for more details). Consequently, D11–D20 were designated under the NH4+ regime. Similarly, for the urea regime, the first five days of the NH4+-to-urea transition (D21–D25) were excluded from quantitative analysis, and D26–D35 were considered under the urea regime.
Test Animal and Consumer Compartment
An eight-week-old C57BL/6J male mouse was used as the consumer for this GD study. The research work (on the mouse) for this study was conducted in accordance with the ethical committee agreement LA 1500024 (Project Code: RI-10-01) dated August 28, 2018.
The mouse weighed 21.2 gm at the beginning of the study. The mouse was housed in a stainless steel cage (the consumer compartment), which had a total volume of 11.5 L. The design of the cage was compliant with the EU Directive 2010/63/EU.
Internally, the cage was separated into two parts by a perforated slide. While the mouse occupied the upper compartment, the lower compartment was layered with dried wooden shavings. The perforated slide between the upper and lower compartments enabled the mouse urine and feces to fall into the lower compartment (containing the wooden shavings), to facilitate moisture absorption and maintain proper sanitation in the upper compartment occupied by the mouse. This enabled a smooth, nonstop running of the GD study for 35 days without the need to open the cage for cleaning and sanitization. The exterior of the cage had an inlet and an outlet for gas exchange.
The food and water requirements of the mouse were calculated as per its weight before the start of the experiment. An eight-week-old C57BL/6J male mouse normally requires 8–10 ml water and 3.5–4.5 gm of food per day (Bachmanov et al., 2002). A mouse requires 3.3 gm O2/kg.h (vs. 5,144 gm O2/kg.h for an average human (Demey et al., 2000). Food and water were provided ad libitum. A 500-ml drinking water bottle was connected to the cage via a drinking nipple. Pre-weighed food pellets were provided through the food chute, located on the side of the cage. An automated light switch in the cage ensured that the mouse was exposed to a 12:12 h dark–light cycle. One cool fluorescent light bulb (3000 K, 36 V, GE) was used to illuminate the consumer compartment. This selection was made on the basis of animal study protocol directives. The CFL light bulb used in animal housing had no direct contact with or exposure to the PBR unit used for cyanobacterial cultivation.
Prior to the start of the GD study, the mouse was allowed to acclimatize to its new environment. For this acclimatization period, the mouse was housed in the cage for 8 h per day for a total period of 5.0 days. During this acclimatization period, we monitored the mouse for behavioral changes and response to the pump noise, temperature, new feeding and drinking mode, etc. No data were collected during this period.
The gender of the mouse was not foreseen to affect the study outcome. Only one mouse was used for this study, mainly as per the EU Directive 2010/63/EU and clauses of the ethical committee agreement used to conduct this animal study.
Control Law and Safety System
The control law used for this study was trained and validated in accordance with the updated light-transfer model (Photosim 2.0 model hereafter) reported by Sachdeva et al. (2018a). The Photosim 2.0 model and its prediction parameters had already been tested and validated in the context of the cultivation parameters used for this GD study and thus would not be discussed here.
The control law also ensured safety within the closed loop in case of system failure. It controlled the opening/closing of the safety valve in accordance with the defined safety parameters. The safety parameters were defined at < 17.5% and ˃ 24% for O2. In a scenario where the O2 levels in the loop were higher or lower than these safety limits, the control law automatically opened the safety valve attached to the consumer compartment and ensured the supply of compressed air to the animal compartment to avoid animal distress.
Data Collection and Analysis
The Arduino program recorded O2 in molar percentage (%O2) and incident light flux (W/m2) once every 5.0 s. For the graphical representation, each data point on the graph is reported as the average of 15 min. The paired t-test was used to calculate the p-value.
Results
Nitrate Regime
A total of 553 readings (for the light flux and O2 level) were recorded under the NO3− regime (D1–D5). Overall, the system applied an average light flux of 136 W/m2 to maintain the average O2 levels of 20.3% over the five days (D1–D5) of the NO3− regime (Figures 3, 4). Out of these 553 recorded readings, only 34 readings had O2 levels less than 20%. The minimum O2 level of 19.9% was observed for only 3 (recorded) readings during the five days of the NO3− regime, where the system was seen to reach the illumination limit (in terms of light flux) of 147.1 W/m2. The system reached the highest O2 level of 21.1% under the NO3− regime.
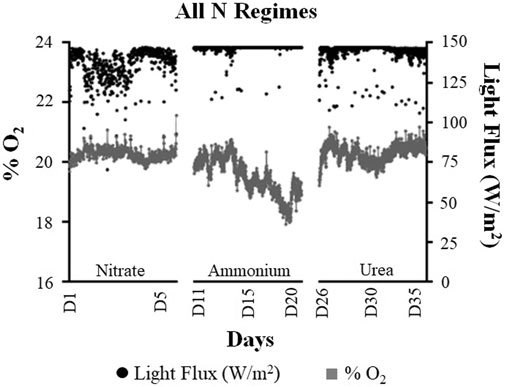
FIGURE 3. Comparison of the average oxygen (% O2) and light flux (W/m2) values quantified during the three nitrogen regimes of the ground demonstration study. For the graphical representation of data, the values have been reported as the 15-min average of each analyte.
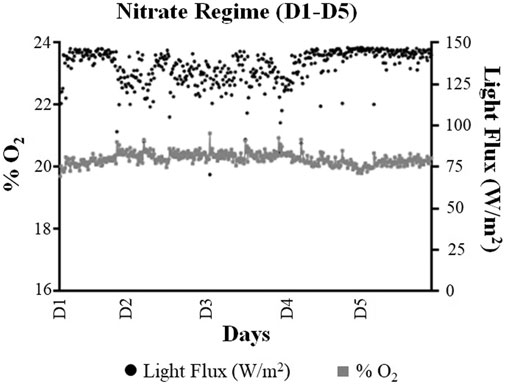
FIGURE 4. Comparison of the average oxygen (% O2) and light flux (W/m2) values quantified using the monitoring system during the nitrate regime (Day 1–Day 5). For the graphical representation of data, the values have been reported as the 15-min average of each analyte.
Ammonium Regime
The first transition to NH4+ was performed on D6 of the GD (Figure 2). Since the system was replacing residual NO3− with NH4+, the first five days (D6–D10) of the NO3−-to-NH4+ transition were not considered under the NH4+ regime. Consequently, D11–D20 were considered under the NH4+ regime (Figures 3, 5).
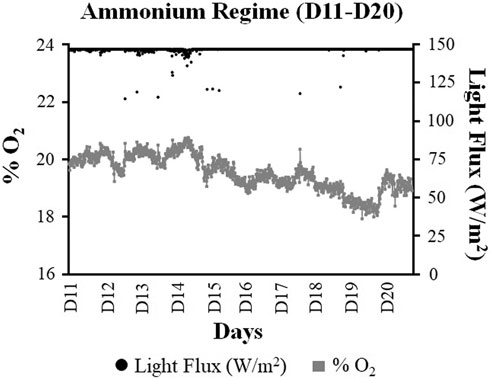
FIGURE 5. Comparison of the average oxygen (% O2) and light flux (W/m2) values quantified using the monitoring system during the ammonium regime of the ground demonstration (Day 11–Day 20). For the graphical representation of data, the values have been reported as the 15-min average of each analyte.
A total of 1,155 readings (for the light flux and O2 level) were recorded under the NH4+ regime. The system was found to work under the illumination limit (147.1 W/m2 light flux) on 82.9% of the recordings (958 out of 1,155 recordings) and could reach the O2 set point (20.3% or higher) for only 9% of these recorded values. Overall, the system maintained an average O2 level of 19.5% during the ten days of the NH4+ regime, under an average light flux of 146.6 W/m2. The highest and lowest O2 levels observed under the NH4+ regime were, respectively, 20.5% (a light flux of 114.7 W/m2) and 17.9% (a light flux 147.1 W/m2).
Interestingly, the O2 levels were found to decrease toward the latter half of the NH4+ regime (Figure 5). The O2 decreased significantly (p-value < 0.05) from an average of 20% (D11–D15) to 19% over the last five days (D16–D20) of the NH4+ regime.
Urea Regime
The transition to urea was performed on D21 of the GD. As was done for the NH4+ transition, the first five days (D21–D25) of the NH4+-to-urea transition were not considered for analytical purposes. Consequently, D26–D35 were considered under the urea regime.
A total of 1,190 readings were recorded under the urea regime. The system maintained an average O2 level of 20.3% over the 10 days of the urea regime and applied an average light flux of 146 W/m2 (Figures 3, 6). The system applied the highest possible light flux (147.1 W/m2) on 34.6% of the observed timepoints (412 out of 1,190). The highest and lowest reached O2 levels observed under the urea regime were 21.2% (light flux 106 W/m2) and 19.2% (light flux 123.21 W/m2), respectively.
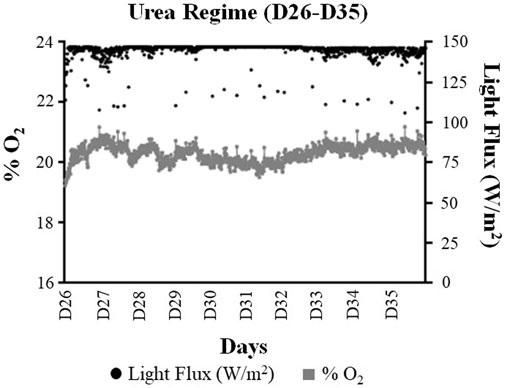
FIGURE 6. Comparison of the average oxygen (% O2) and light flux (W/m2) values obtained during the urea regime of the ground demonstration (Day 26–Day 33). For the graphical representation of data, the values have been reported as the 15-min average of each analyte.
In contrast to the NH4+ regime, where the O2 levels decreased toward the latter half of the NH4+ regime, the O2 levels in fact increased toward the end of the urea regime (Figures 3, 6). While the system reached the average O2 levels of 20% during the first five days (D26–D30) of the urea regime, this value increased to 20.4% (p-value < 0.05) toward the last five days (D31–D35) of the urea regime.
Impact on Mouse
At the end of the GD study, the mouse was taken out of the consumer compartment, and its health and activities were observed for one week. The mouse weighed 21.2 gm before the start of the study, and it weighed 21.4 gm at the end of the study. There were no visible signs of stress or injury on the body of the mouse, and it responded well to stimuli. In general, no behavioral changes were observed in the mouse after the GD test.
Discussions
The BIORAT-2 GD lasted for a total of 35 days (in the continuous feeding mode). During these 35 days, we evaluated the following: 1) the effect of alternative N-sources (NO3−, NH4+, and urea) on O2 levels in the gas loop, 2) the possibility of using CO2 (not monitored) from the consumer compartment as the C-source for Limnospira indica, and 3) the efficiency of the control law with regard to simulating O2 production in the producer compartment by modulating the incident light flux (reaching the PBR) in accordance with the changing of O2 requirements in the consumer compartment.
The control law used for this study was formulated on the basis of the Photosim 2.0 model described in our previous study (Sachdeva et al., 2018a). The Photosim 2.0 model is a light-transfer–based stochastic model that takes into account the stoichiometric characteristics of the cyanobacterial biomass, the cultivation parameters of the bioprocess, and the geometry of the PBR to predict the volumetric biomass and O2 productivities. The original Photosim model (Cornet and Dussap, 2009) was developed and validated for the Limnospira indica PCC 8005 strain (used for this study) cultivated at a pH value of 9.5 with 28 mM NO3− (as the N-source). Since the nutrient source, its concentration, and other cultivation parameters are known to impact the biochemical and stoichiometric content of the photosynthetic species (Sachdeva et al., 2016a; Sachdeva et al., 2016b), we updated the original Photosim model in the context of the revised cultivation parameters used for this GD study. Therefore, all the cultivation parameters (dilution rate, residence time, N–feeding concentration, etc.) used for this GD have also been adapted from our previous study, which was used to validate the Photosim 2.0.
The Photosim 2.0 model was only updated to be used for NO3− and NH4+ (as N-sources) feeding conditions. Accordingly, the control law used for this GD study was optimized for NO3− and NH4+ feeding conditions and not for urea. Regardless, we decided to include urea as one of the N-sources for this study, mainly because of two reasons. First, urea is one of the main components of non-nitrified (untreated) urine (Chang et al., 2013), and if untreated/partially treated urine is to be used as the N-source for cyanobacterial cultivation, it is important to test the effect of urea on the O2 production capacity of Limnospira indica. Second, our previous studies (Deschoenmaeker et al., 2017) have indicated that Limnospira sp. have better tolerance for urea (vs. NH4+), so it was important to compare the O2 production capacity of Limnospira indica under all three N-sources in the same experiment. Interestingly, the control law performed exceptionally well for the urea regime.
It is also important to note here that attaining the “gas steady state” was used for defining the steady-state criteria for this GD study. This was in contrast to most bioprocess studies, which normally focus on attaining the use of “liquid steady state.” The gas steady-state criteria were mainly based on the objective of this GD study, which aimed to evaluate the effect of alternative N-sources on the O2 production capacity of Limnospira indica. In order to attain the “liquid steady state,” the system must be maintained under continuous feeding of a particular N-source for a minimum of three residence times (15 days), which would have considerably increased the overall duration of the GD study. On the other hand, the constraints linked with maintenance of the mouse in the consumer compartment for longer than 40 days (cage hygiene and animal stress) and ethical guidelines for the animal experimentation did not permit us to conduct such long-duration experiments. Therefore, we focused on attaining the “gas steady state” (two residence times) for the purpose of this GD study.
Another important consideration for this GD study was the exclusion of the first five days of N-source transition (NO3− to NH4+ and NH4+ to urea) from quantitative analysis. This criterion was also defined on the basis of our previous study (Sachdeva et al., 2018a), wherein we observed that the Photosim 2.0 model worked best for the timepoints wherein the PBR was under a single N-source (with 80% fitting between experimental and simulated values). The prediction efficiency of the model was reduced (to 50% fitting between experimental and simulated values) when the PBR was undergoing a transition between two N-sources. In other words, the Photosim 2.0 model prediction was found to be less efficient when two N-sources were simultaneously present in the PBR. Based on these results, we decided to exclude the first five days of NO3−-to-NH4+ transition (D6–D10) and NH4+-to-urea transition (D21–D25) from our quantitative analysis (Supplementary Figure 1). The effect of the simultaneous presence of multiple N-sources on the volumetric productivity of the PBR is currently being studied by our group in order to be able to more accurately describe the effect of N-transition.
Overall, the system maintained the average O2 levels of 20.3% during the NO3− regime and applied an average light flux of 136W/m2 (Figure 3). Overall, the O2 levels were found to be quite stable under the NO3− regime compared to the NH4+ and urea regimes (Figure 3 and Supplementary Figure 1). We did observe some fluctuations in the individual O2 readings (after averaging). But these variations were due to the perturbation of the electrochemical O2 sensor (used for this study) due to the high gas flow rates in the sensor line. For more accurate measurements, highly accurate sensors like the ones that work on the principle of paramagnetic susceptibility of O2 should be used for future studies.
The system was constantly working under the maximum light flux of 147.1 W/m2 (possible with the light unit used for this GD study) for most parts of the NH4+ regime (83% of observed timepoints). The system reached average O2 levels of 19.5% under the NH4+ regime, by applying an average light flux of 146.6 W/m2 (Figure 3). Interestingly, the average O2 levels further decreased during the latter half of the NH4+ regime. The lower O2 levels observed under the NH4+ regime (vs. the NO3− regime) were in accordance with the results of our previous study (Sachdeva et al., 2018a), wherein we had reported a 21.5% decrease in O2 yields under the NH4+ regime (vs. the NO3− regime). A brief simulation summary comparing the RO2 (oxygen production rate, mMO2/L/hr) of Limnospira indica cultivated at different light fluxes (q0) under the NO3− and NH4+ regimes has been described under Supplementary Appendix 1. Supplementary Appendix 1 summarizes the RO2 for both the NO3− and NH4+ regimes as the function of light flux (q0; W/m2) and biomass concentration (g/L) (Supplementary Appendix 1). Finally, a comparison has been made between the (difference of) RO2 for the NO3− and NH4+ regimes at different biomass concentrations (g/L) at the applied light flux of 146 W/m2 (Supplementary Appendix 1). These simulation data also suggest that at the desired biomass concentration of 2.0 g/L (used for validation of the Photosim 2.0 model) and the applied light flux of 146 W/m2, 20% lower RO2 is expected under the NH4+ regime (vs. the NO3− regime).
Evidently, the system would have to produce 121% higher O2 under the NH4+ regime to compensate for the 21.5% lower O2 yields (vs. the NO3− regime). This theoretically means that a higher light flux of 155.8 W/m2 would be needed to reach the desired set point of 20.3% O2 under the NH4+ regime. This could only be achieved by increasing the photosynthetic efficiency in the producer compartment, since the nutrient concentration, feeding rate, and other cultivation parameters could not be altered (as per study protocol). Moreover, the rate of photosynthesis was not foreseen to be limited by CO2 levels under the present working conditions. This is mainly because under the cultivation parameters (biomass concentration, dilution rate, O2 yield, and light flux) used for this GD study, the product of the respiration quotient and the photosynthetic quotient was approximately 1.2 (see Demey et al., 2000 for details). This means that the rate of production of O2 is more than the rate of consumption of CO2. Hence, the lower O2 levels observed under the NH4+ regime could only be improved by increasing the incident light flux. However, due to the limitation of the hardware used in this GD, it was practically impossible to attain this level of light flux. For the future LSS studies (especially where NH4+ is used as the N-source), it would be important to evaluate the possibility of using higher light flux to enhance the photosynthetic efficiency (and hence the O2 production capacity) of Limnospira without subjecting the cells to photo-inhibition. Such an investigation becomes even more important in the context of LSS studies wherein the cyanobacterial biomass is intended to be used as a nutrition source for the crew. Since light stress is known to change the biochemical composition of the cyanobacterial biomass and reduce its nutrient content (Chentir et al., 2018), extensive research needs to be undertaken to derive the ideal working light intensities that can increase the O2 yield of Limnospira culture fed with NH4+ without subjecting it to photo-inhibition or compromising on the nutrient content of the biomass.
We also observed a considerable amount of biofilm deposition in the PBR and cyanobacterial cell bleaching (from bright green to pale green) under NH4+ feeding (data not shown), which increased toward the latter half of the NH4+ regime. The decreased O2 levels and increased biofilm deposition in the PBR clearly indicated that the cyanobacterial cells were under nutrient stress (Rossi and De Philippis, 2015), indicating that NH4+ would not be able to meet the metabolic needs of Limnospira. Based on these results, we can say that in order to avoid these inhibitions (in terms of lower O2 levels and nutrient stress), either the NH4+-only N-regimes would need to be limited to shorter durations or NH4+ would have to be combined with other N-sources to overcome this inhibition. Consequently, it would be interesting to analyze the effect of the mixture/combination of NH4+ with other N-sources on the metabolic characteristics and oxygen production capacity of Limnospira indica through future studies.
In contrast to the NH4+ regime, the system could effectively reach the desired (set point) O2 level of 20.3% under the urea regime (Figure 6). Although comparable (average) O2 levels were observed under the urea and NO3− regimes, the system had to apply under a higher light flux to reach these levels under the urea regime (average light flux 146 W/m2). But it is important to reiterate here that the control law and the Photosim 2.0 model had not been previously validated under urea feeding conditions. The light-transfer parameters used to validate the Photosim 2.0 model (and hence the control law) are influenced by the nutrient source, its effect on the stoichiometry of the cyanobacterial biomass, and the resulting light-transfer/absorption coefficients (Cornet et al., 1992; Cornet et al., 1995; Cornet and Dussap, 2009). Consequently, these prediction parameters are expected to change under urea feeding conditions.
Even though the system worked under light saturation for both the NH4+ and urea regimes, it could maintain an O2 level of 20.3% under the urea regime. This indicated that urea is a better N-source (vs. NH4+) for supporting the photosynthetic needs of Limnospira indica. Moreover, contrary to the NH4+ regime, where the O2 levels decreased during the last five days of NH4+ feeding, the O2 levels slightly increased during the latter half of the urea regime (Figure 3). The higher O2 levels under the urea regime could be attributed to its stoichiometry. Urea metabolism produces 2-NH4+ and CO2. The influx of additional CO2 (from urea metabolism) might have supported photosynthesis (and hence O2 production). Higher N and carbon availability under the urea regime could be the reason for the revival of cells (from nutrient stress). This was also evident from the decreased biofilm deposition in the PBR once the urea feeding was started. The biofilm formation and cell bleaching observed during the NH4+ regime started to decrease with urea feeding and disappeared by the second half of the urea regime (data not shown). These physical indicators further showed that urea is a better N-source than NH4+ (both stoichiometrically and bioenergetically) for meeting the metabolic needs of Limnospira indica (Sassano et al., 2004).
Conclusion and Future Perspectives
This GD study broadened our knowledge and understanding about the possibility of using different N-sources present in non-nitrified urine for cyanobacterial cultivation and air revitalization. In our previous batch and continuous feeding studies, we have already evaluated the effect of the different N-sources and their varying concentrations on the yield and biochemical content (carbohydrates, lipids, proteins, phycobiliproteins, and chlorophyll) of the Limnospira biomass (Deschoenmaeker et al., 2017; Sachdeva et al., 2018a; Sachdeva et al., 2018b). Since NH4+ and urea are the main N-sources present in non-nitrified urine (Chang et al., 2013), it was important to test the effect of these N-sources on the O2 production capacity of Limnospira indica compared to NO3− (the main component of nitrified urine).
In summary, we found that the system could easily maintain the ambient O2 levels of 20.3% under the NO3− and urea regimes, indicating that Limnospira indica PCC 8005 adapted better to urea than to ammonium under comparable cultivation conditions.
However, it would be necessary to validate the Photosim model for urea feeding conditions. This could also help to improve the control law for urea feeding conditions. This understanding would be even more important when the tests/experiments would be conducted in the actual setup of the MELiSSA LSS. For the present study, we used a modified version of the MELiSSA loop, wherein we had a closed loop for the “gas phase” of the system, but the system was open (not fully closed) on the liquid side, and thus, CO2 accumulation was not anticipated. However, under the actual MELiSSA loop setup, attaining O2/CO2 equilibria would be even more complex due to the involvement of several other compartments (see Figure 1A). In such a scenario, we will have to focus on attaining carbon balance and not just CO2 balance.
Furthermore, it would be important to investigate the effect of a mix of N-sources on cyanobacterial cultivation and air revitalization, mainly for future LSS studies, wherein fluctuating streams of partially treated urine are planned to be used as the N-source for cyanobacterial cultivation.
More importantly, it would also be interesting to investigate the cumulative effect of different N-sources, high urine salinity, different organic compounds (metabolites, hormones, amino acids, etc.), and other personal hygiene products present in human urine on the overall metabolism, stoichiometry, and O2 production capacity of Limnospira indica. These experiments become even more important for regenerative LSS studies, mainly because an influx of external carbon sources from organic compounds (present in urine) will not only change the cultivation mode from photoautotrophic to mixotrophic but would also have an effect on the biochemical/nutrient content of the biomass. In this regard, we are conducting further studies to evaluate the effect of the simultaneous presence of different N-sources, organic compounds, and high urine salinity mixtures of different N-sources on the biomass and oxygen productivities of Limnospira indica. The biochemical data obtained from these ongoing studies will be used to optimize the prediction parameters of the Photosim model, which will then be used to perform future GD studies.
In conclusion, this GD study provided preliminary indications toward the possibility of using NH4+- and urea-rich medium and CO2 from the consumer compartment for Limnospira indica cultivation and air revitalization. The cumulative conclusions from our previous, present, and upcoming studies would not only aid in designing more efficient and robust regenerative life-support systems for future space missions but would also help in gaining a better understanding of the design of economically viable microalgae-based wastewater remediation systems and photosynthetic biorefineries for terrestrial purposes.
Data Availability Statement
The raw data supporting the conclusion of this article will be made available by the authors, without undue reservation.
Ethics Statement
The animal study was reviewed and approved by the ethical committee agreement LA 1500024 (Project Code: RI-10-01) dated 28th August, 2018.
Author Contributions
NS conducted all the experiments and collected the data. NS and LP worked on the Photosim 2.0 model. BL and OG worked on the control law. CD, CL, BL, and RW supervised the study. NS wrote the manuscript. All authors contributed equally to data analysis, interpretation, and manuscript review.
Funding
This research work was financially supported by the European Space Agency under the BIORAT-2 activity of the MELiSSA project and MELiSSA (www.melissafoundation.org).
Conflict of Interest
The authors declare that the research was conducted in the absence of any commercial or financial relationships that could be construed as a potential conflict of interest.
Publisher’s Note
All claims expressed in this article are solely those of the authors and do not necessarily represent those of their affiliated organizations, or those of the publisher, the editors and the reviewers. Any product that may be evaluated in this article, or claim that may be made by its manufacturer, is not guaranteed or endorsed by the publisher.
Supplementary Material
The Supplementary Material for this article can be found online at: https://www.frontiersin.org/articles/10.3389/fspas.2021.700270/full#supplementary-material
References
Alemany, D., Peiro, E., Arnau, C., Garcia, D., Poughon, L., Cornet, J. F., et al. (2019). Continuous Controlled Long-Term Operation and Modeling of a Closed Loop Connecting an Air-Lift Photobioreactor and an Animal Compartment for the Development of a Life Support System. Biochem. Eng. J. 151, 107323. doi:10.1016/j.bej.2019.107323
Anderson, M. S., Ewert, M. K., and Keener, J. F. (2018). Life Support Baseline Values and Assumptions Document. NASA/TP-2015-218570/REV1. Retrieved on 9th June, 2021 from https://ntrs.nasa.gov/api/citations/20180001338/downloads/20180001338.pdf.
Averner, M. M. (1990). The NASA CELSS Program. Biological Life Support Technologies: Commercial Opportunities. Washington D.C., USA.: NASA Headquarters. NASA 19910004535, pp. 45-46, November, 1990,.
Avila-Leon, I., Chuei Matsudo, M., Sato, S., de Carvalho, J. C., Sato, S., and Carvalho, J. C. M. (2012). Arthrospira Platensis Biomass with High Protein Content Cultivated in Continuous Process Using Urea as Nitrogen Source. J. Appl. Microbiol. 112, 1086–1094. doi:10.1111/j.1365-2672.2012.05303.x
Bachmanov, A. A., Reed, D. R., Beauchamp, G. K., Tordoff, M. G., Beauchamp, G. K., and Tordoff, M. G. (2002). Food Intake, Water Intake, and Drinking Spout Side Preference of 28 Mouse Strains. Behav. Genet. 32, 435–443. doi:10.1023/A:1020884312053
Chang, Y., Wu, Z., Bian, L., Feng, D., and Leung, D. Y. C. (2013). Cultivation of Spirulina Platensis for Biomass Production and Nutrient Removal from Synthetic Human Urine. Appl. Energ. 102, 427–431.
Chentir, I., Doumandji, A., Ammar, J., Zili, F., Jridi, M., and Markou, G. (2018). Induced Change in Arthrospira Sp. (Spirulina) Intracellular and Extracellular Metabolites Using Multifactor Stress Combination Approach. J. Appl. Phycol. 30, 1563–1574.
Cogne, G., Lehmann, B., Dussap, C. G., Gros, J. B., Dussap, C. G., and Gros, J. B. (2003). Uptake of Macrominerals and Trace Elements by the Cyanobacterium Spirulina Platensis (Arthrospira Platensis PCC 8005) under Photoautotrophic Conditions: Culture Medium Optimization. Biotechnol. Bioeng. 81, 588–593. doi:10.1002/bit.10504
Cornet, J. F., Dussap, C. G., Dubertret, G., Dussap, C. G., and Dubertret, G. (1992). A Structured Model for Simulation of Cultures of the Cyanobacterium Spirulina Platensis in Photobioreactors: I. Coupling between Light Transfer and Growth Kinetics. Biotechnol. Bioeng. 40, 817–825. doi:10.1002/bit.260400709
Cornet, J. F., and Dussap, C. G. (2009 Mar-Apr). A Simple and Reliable Formula for Assessment of Maximum Volumetric Productivities in Photobioreactors. Biotechnol. Prog. 25, 424–435. doi:10.1002/btpr.138
Cornet, J. F., Dussap, C. G., Gros, J. B., Binois, C., and Lasseur, C. (1995). A Simplified Monodimensional Approach for Modeling Coupling between Radiant Light Transfer and Growth Kinetics in Photobioreactors. Chem. Eng. Sci. 50, 1489–1500. doi:10.1016/0009-2509(95)00022-W
De Meur, Q. (2017). “Rhodospirillum Rubrum S1H,” in Unravelling the Volatile Fatty Acids Assimilation in the MELiSSA Loop (Belgium: University of Mons). Ph.D Thesis.
Demey, D., Hermans, V., Cornet, J. F., Leclercq, J. J., Lasseur, C., and Delahaye, A. (2000). BIORAT: Preliminary Evaluation of Biological Life Support in Space Environment Developments, in 30th International Conference on Environmental Systems (SAE paper 2384), Toulouse, France, doi:10.4271/2000-01-2384
Deschoenmaeker, F., Bayon-Vicente, G., Sachdeva, N., Depraetere, O., Cabrera Pino, J. C., Leroy, B., et al. (2017). Impact of Different Nitrogen Sources on the Growth of Arthrospira Sp. PCC 8005 under Batch and Continuous Cultivation - A Biochemical, Transcriptomic and Proteomic Profile. Bioresour. Technol. 237, 78–88. doi:10.1016/j.biortech.2017.03.145
Farges, B., Poughon, L., Creuly, C., Cornet, J. F., Dussap, C. G., Lasseur, C., et al. (2008). Dynamic Aspects and Controllability of the MELiSSA Project: a Bioregenerative System to Provide Life Support in Space. Appl. Biochem. Biotechnol. 151, 686–699. doi:10.1007/s12010-008-8292-2
Gitelson, I. I., Terskov, I. A., Kovrov, B. G., Lisovskii, G. M., Okladnikov YuN, B. G., Sid'ko FYa, G. M., et al. (1989). Long-term Experiments on Man's Stay in Biological Life-Support System. Adv. Space Res. 9, 65–71. doi:10.1016/0273-1177(89)90030-6
Hader, D. P. (2019). On the Way to Mars-Flagellated Algae in Bioregenerative Life Support Systems under Microgravity Conditions. Front. Plant Sci. 10, 1621. doi:10.3389/fpls.2019.01621
Helisch, H., Keppler, J., Detrell, G., Belz, S., Ewald, R., Fasoulas, S., et al. (2020). High Density Long-Term Cultivation of Chlorella Vulgaris SAG 211-12 in a Novel Microgravity-Capable Membrane Raceway Photobioreactor for Future Bioregenerative Life Support in SPACE. Life Sci. Space Res. (Amst) 24, 91–107. doi:10.1016/j.lssr.2019.08.001
Kage, A., Asato, E., Chiba, Y., Wada, Y., Katsu-Kimura, Y., Kubota, A., et al. (2011). Gravity-dependent Changes in Bioconvection of Tetrahymena and Chlamydomonas during Parabolic Flight: Increases in Wave Number Induced by Pre- and post-parabola Hypergravity. Zoolog. Sci. 28, 206–214. doi:10.2108/zsj.28.206
Kage, A., Hosoya, C., Baba, S. A., Mogami, Y., Baba, S. A., and Mogami, S. (2013). Drastic Reorganization of the Bioconvection Pattern of Chlamydomonas: Quantitative Analysis of the Pattern Transition Response. J. Exp. Biol. 216, 4557–4566. doi:10.1242/jeb.092791
Karel, M. (1982). Evaluation of Engineering Foods for Controlled Ecological Life Support Systems (CELSS). Washington, D.C.: Hardcopy Version at National Academies Press. NASA-CR-166359. 166p.
Kibe, S., Suzuki, K., Ashida, A., Otsubo, K., Nitta, K., Otsubo, K., et al. (1997). Controlled Ecological Life Support System-Related Activities in Japan. Life Support. Biosph. Sci. 4, 117–125.
Lasseur, C., Brunet, J., de Weever, H., Dixon, M., Dussap, C. G., Godia, F., et al. (2010). The European Project of Closed Life Support System. Gravit. Space Biol 23, 3–12.
Lasseur, Ch., Verstraete, W., Gros, J. B., Dubertret, G., Rogalla, F., Dubertret, G., et al. (1996). MELISSA: A Potential experiment for a Precursor mission to the Moon. Adv. Space Res. 18, 111–117. doi:10.1016/0273-1177(96)00097-x
MacElroy, R. D., and Bredt, J. (1984). Current Concepts and Future Directions of CELSS. Adv. Space Res. 4, 221–229. doi:10.1016/0273-1177(84)90566-0
MacElroy, R. D., Tremor, J., Smernoff, D. T., Knott, W., Prince, R. P., Knott, W., et al. (1987). A Review of Recent Activities in the NASA CELSS Program. Adv. Space Res. 7, 53–57. doi:10.1016/0273-1177(87)90032-9
Markou, G. (2015). Fed-batch Cultivation of Arthrospira and Chlorella in Ammonia-Rich Wastewater: Optimization of Nutrient Removal and Biomass Production. Bioresour. Technol. 193, 35–41.
Markou, G., Vandamme, D., Muylaert, K., Vandamme, D., and Muylaert, K. (2014). Ammonia Inhibition on Arthrospira Platensis in Relation to the Initial Biomass Density and pH. Bioresour. Technol. 166, 259–265. doi:10.1016/j.biortech.2014.05.040
Massa, G., Zhang, Y., and Dufour, N. (2018). Veggie at the Forefront of NASA Food Production. 1st AgroSpace-MELiSSA workshop. Rome, Italy: Headquarter of the Italian Research Council. 16 May, 2018, Keynote Address.
Mergaey, M., Verstraete, W., Dubertret, G., Leforttran, M., Chipaux, C., and Binot, R. (1988). MELiSSA-a Microorganism Based Model for CELSS Development. Proceedings 3rd Symposium on Space Thermal Control and Life Support Systems, Noordwijk. The Netherlands. ESA SP-288, pp 65-69.
Monje, O., Richards, J. T., Carver, J. A., Dimapilis, D. I., Levine, H. G., Dufour, N. F., et al. (2020). Hardware Validation of the Advanced Plant Habitat on ISS: Canopy Photosynthesis in Reduced Gravity. Front. Plant Sci. 11, 673.
NASA Techport (2017). Vegetable Production System (Veggie) Project. (Retrieved on March 19th, 2021). from https://techport.nasa.gov/view/10498.
Perchonok, M., Vittadini, E., Peterson, L. J., Swango, B. E., Toerne, M. E., and Russo, D. M. (2001). Bioregenerative Life Support Systems Test Complex (Bio-Plex) Food Processing System: A Dual System. Orlando, USA: ICES Conference. 9th-12th July, 2001. NASA 20030007918.
Portee, D. S. F. (2001). “Humans to Mars: Fifty Years of Mission Planning, 1950-2000,” in NASA Monographs in Aerospace History Series Washington, DC, USA: NASA, 21. SP-2001-4521.
Rossi, F., and De Philippis, R. (2015). Role of Cyanobacterial Exopolysaccharides in Phototrophic Biofilms and in Complex Microbial Mats. Life (Basel) 5, 1218–1238. doi:10.3390/life5021218
Sachdeva, N., Giambarresi, G., Poughon, L., Cabrera, J. C., Leroy, B., Lasseur, C., et al. (2018a). Assessment of Transient Effects of Alternative Nitrogen Sources in Continuous Cultures of Arthrospira Sp. Using Proteomic, Modeling and Biochemical Tools. Bioresour. Technol. 267, 492–501. doi:10.1016/j.biortech.2018.07.062
Sachdeva, N., Gupta, R. P., Mathur, A. S., Tuli, D. K., Mathur, A. S., and Tuli, D. K. (2016a). Enhanced Lipid Production in Thermo-Tolerant Mutants of Chlorella Pyrenoidosa NCIM 2738. Bioresour. Technol. 221, 576–587. doi:10.1016/j.biortech.2016.09.049
Sachdeva, N., Kumar, G. D., Gupta, R. P., Mathur, A. S., Manikandan, B., Basu, B., et al. (2016b). Kinetic Modeling of Growth and Lipid Body Induction in Chlorella Pyrenoidosa under Heterotrophic Conditions. Bioresour. Technol. 218, 934–943. doi:10.1016/j.biortech.2016.07.063
Sachdeva, N., Mascolo, C., Wattiez, R., Leroy, B., Wattiez, R., and Leroy, B. (2018b). Embedding Photosynthetic Biorefineries with Circular Economies: Exploring the Waste Recycling Potential of Arthrospira Sp. To Produce High Quality By-Products. Bioresour. Technol. 268, 237–246. doi:10.1016/j.biortech.2018.07.101
Sassano, C. E. N., Carvalho, J. C., Gioielli, L. A., Sato, S., Torre, P., Converti, A., et al. (2004). Kinetics and Bioenergetics of Spirulina Platensis Cultivation by Fed-Batch Addition of Urea as Nitrogen Source. Appl. Biochem. Biotechnol. 112, 143–150. doi:10.1385/abab:112:3:143
Sassano, C. E. N., Gioielli, L. A., Ferreira, L. S., Rodrigues, M. S., Sato, S., Converti, A., et al. (2010). Evaluation of the Composition of Continuously-Cultivated Arthrospira (Spirulina) Platensis Using Ammonium Chloride as Nitrogen Source. Biomass Bioenergy 34, 1732–1738.
Keywords: regenerative life-support system, crewed space exploration, Limnospira indica, oxygen production, nitrogen and carbon waste recycle, MELiSSA loop
Citation: Sachdeva N, Poughon L, Gerbi O, Dussap C-G, Lasseur C, Leroy B and Wattiez R (2021) Ground Demonstration of the Use of Limnospira indica for Air Revitalization in a Bioregenerative Life-Support System Setup: Effect of Non-Nitrified Urine–Derived Nitrogen Sources. Front. Astron. Space Sci. 8:700270. doi: 10.3389/fspas.2021.700270
Received: 25 April 2021; Accepted: 29 June 2021;
Published: 09 August 2021.
Edited by:
Cyprien Verseux, University of Bremen, GermanyReviewed by:
Gisela Detrell, University of Stuttgart, GermanyKirsi Lehto, University of Turku, Finland
Copyright © 2021 Sachdeva, Poughon, Gerbi, Dussap, Lasseur, Leroy and Wattiez. This is an open-access article distributed under the terms of the Creative Commons Attribution License (CC BY). The use, distribution or reproduction in other forums is permitted, provided the original author(s) and the copyright owner(s) are credited and that the original publication in this journal is cited, in accordance with accepted academic practice. No use, distribution or reproduction is permitted which does not comply with these terms.
*Correspondence: Ruddy Wattiez, UnVkZHkuV2F0dGllekB1bW9ucy5hYy5iZQ==