 E. K. J. Kilpua
 S. W. Good
 M. Ala-Lahti
 A. Osmane
 D. Fontaine
 L. Hadid
 M. Janvier3
 E. Yordanova
- 1Department of Physics, University of Helsinki, Helsinki, Finland
- 2LPP, CNRS, Ecole Polytechnique, Sorbonne Université, Université Paris Saclay, Observatoire de Paris, Institut Polytechnique de Paris, PSL Research University, Palaiseau, France
- 3Université Paris-Saclay, CNRS, Institut D'astrophysique Spatiale, Orsay, Finland
- 4Swedish Institute of Space Physics, Uppsala, Sweden
We report a statistical analysis of magnetic field fluctuations in 79 coronal mass ejection- (CME-) driven sheath regions that were observed in the near-Earth solar wind. Wind high-resolution magnetic field data were used to investigate 2 h regions adjacent to the shock and ejecta leading edge (Near-Shock and Near-LE regions, respectively), and the results were compared with a 2 h region upstream of the shock. The inertial-range spectral indices in the sheaths are found to be mostly steeper than the Kolmogorov −5/3 index and steeper than in the solar wind ahead. We did not find indications of an
1 Introduction
Coronal mass ejections (CMEs; Webb and Howard, 2012) are huge expulsions of plasma and field from the Sun that propagate at supersonic speeds into the heliosphere. When a CME is sufficiently faster than the preceding solar wind, a fast-forward shock develops ahead of it. Plasma and field are compressed at the shock and accumulate ahead of the leading edge of the CME ejecta to form a sheath region (e.g., Kilpua et al., 2017a). CME sheaths are large-scale heliospheric structures that are of wide interest in both fundamental plasma physics and space weather contexts. Sheaths comprise layers of inhomogeneous plasma and field (Kaymaz and Siscoe, 2006; Siscoe et al., 2007) and thus exhibit highly variable structure with various embedded plasma waves, discontinuities, and reconnection exhausts (e.g., Kataoka et al., 2005; Ala-Lahti et al., 2018, 2019). On average, sheaths have considerably higher solar wind density, dynamic pressure, Alfvén Mach number, and power in magnetic field fluctuations than the CME ejecta (e.g., Guo et al., 2010; Kilpua et al., 2013; Myllys et al., 2016; Kilpua et al., 2019). This compressed and turbulent state has been invoked to explain why sheaths couple so efficiently with the Earth’s magnetosphere and drive intense space weather disturbances (e.g., Tsurutani et al., 1988; Huttunen and Koskinen, 2004; Myllys et al., 2016; Kilpua et al., 2017b). Enhanced turbulence in the solar wind can particularly intensify viscous interaction at the magnetopause and drive stronger geomagnetic activity (e.g., Borovsky and Funsten, 2003; Jankovičová et al., 2008; Osmane et al., 2015). CME sheaths differ from planetary magnetosheaths in various ways (e.g., Siscoe et al., 2007); unlike planetary magnetosheaths, they share properties of both “expansion” and “propagation” sheaths and are formed gradually over several days, as the CME propagates in interplanetary space. The lateral deflection of solar wind plasma around the CME is relatively reduced and, as a consequence, plasma and field pile up at the CME nose rather than flow around it. CME shocks are also generally weaker than planetary bow shocks. Despite their importance, CME-driven sheaths are still relatively little studied. In particular, their formation and small-scale structure are currently poorly understood, and there is no solid understanding of turbulence and intermittency in sheath regions.
We briefly summarize below recent works that have investigated magnetic field fluctuations in CME sheaths in more detail. Moissard et al. (2019) studied fluctuation power, anisotropy, and compressibility in 42 CME sheaths using ACE 1 s magnetic field data. The authors found that, at fluctuation timescales ranging between 20 s and 7.5 min, sheaths have on average higher fluctuation power, lower anisotropy, and higher compressibility than in the solar wind ahead or the CME flux rope behind. Good et al. (2020a) performed a case study of a CME-driven sheath detected by MESSENGER at ∼0.5 AU and then by STEREO-B at 1.08 AU while the spacecraft were almost radially aligned. The CME shock was quasi-parallel at MESSENGER and quasi-perpendicular at STEREO-B; the sheath behind the quasi-parallel shock closer to the Sun showed greater differences to the local upstream wind than the sheath at ∼ 1 AU behind the quasi-perpendicular shock. For instance, the sheath at MESSENGER exhibited relatively more large-angle fluctuations and higher compressibility than the upstream solar wind. The inertial-range spectral slope steepened in the sheath plasma between MESSENGER and STEREO-B. Kilpua et al. (2020) conducted a detailed analysis of three sheath regions observed by the Wind spacecraft at Lagrangian point L1. In contrast to the studies described above, which investigated sheath intervals globally, Kilpua et al. (2020) studied three separate regions within the sheath: a region close to the shock, in the middle of the sheath, and close to the ejecta leading edge, each 1 h in duration. All three sheaths had enhanced fluctuations, intermittency, and compressibility when compared to the solar wind ahead, with differences being most pronounced close to the shock. The approach of studying separate sheath subregions was motivated by the fact that plasma and field properties often vary considerably within a given sheath and that different physical mechanisms causing field fluctuations are in action close to the shock and near the ejecta leading edge. Close to the shock, field fluctuations are associated with shock compression and alignment of preceding fluctuations (e.g., Neugebauer et al., 1993; Kataoka et al., 2005). In addition, shock heating produces temperature anisotropy that provides free energy for generation of mirror mode and Alfvén ion cyclotron waves (e.g., Ala-Lahti et al., 2018, 2019). Near the ejecta leading edge, in turn, draping of the magnetic field about the ejecta can lead to large-amplitude out-of-ecliptic field variations (Gosling and McComas, 1987; McComas et al., 1988).
It is also an interesting question as to how fluctuation properties in CME sheaths relate to the driver properties and upstream conditions. For example, Moissard et al. (2019) found that the sheaths of fast CMEs encountering turbulent solar wind and with high Mach number shocks have on average the highest levels of turbulence and lowest anisotropy in their fluctuations. For quasi-parallel shocks and high upstream beta, turbulent energy and anisotropy were both lower. In Kilpua et al. (2020), the greatest differences between the sheath and solar wind ahead were found for the event associated with a strong and fast quasi-parallel shock, but we also note that a slow sheath behind a weak and quasi-perpendicular shock had enhanced level of fluctuations. This is in contrast with Good et al. (2020a), who found very little differences for a slow sheath behind quasi-perpendicular shock near 1 AU. This could be because Kilpua et al. (2020), as described above, investigated three separate regions. Another interesting finding in Kilpua et al. (2020) was that the region adjacent to the ejecta leading edge resembled relatively closely the solar wind ahead, in particular, the slower sheaths investigated.
The spectrum of solar wind turbulence has been extensively investigated. In the inertial range, slow solar wind shows larger variability and usually steeper slopes than fast solar wind. Spectral slopes are often generally close to the Kolmogorov index
Within planetary magnetosheaths, MHD spectral indices close to −1 have been reported throughout the inertial range at locations close to the bow shock, with the index steepening toward the more commonly observed Kolmogorov index deeper in the magnetosheath (Hadid et al., 2015; Huang et al., 2017, 2020). The authors suggest that this may arise from the bow shock “resetting” the turbulence and generating randomly distributed fluctuations at the MHD scale. Spectral indices in the kinetic range were shallower than −2.8, close to the bow shock, but then steepened toward the magnetopause, approaching the −2.8 value more typically seen in the upstream solar wind.
Spectral slopes of magnetic field and density fluctuations upstream and downstream of interplanetary shocks have also been investigated in detail in some recent studies, with the emphasis of these studies placed on the role of the shock in modifying fluctuation properties. For example, Pitňa et al. (2016) and Riazantseva et al. (2017) analyzed high-resolution plasma data by the Spektr-R spacecraft and showed that the MHD-range slopes of density fluctuations were approximately conserved across the shock transition, while the study by Borovsky (2020) reported that the MHD-range slopes for magnetic field and velocity fluctuations are steeper in the downstream than upstream. Pitňa et al. (2017) also investigated the decay of MHD-scale turbulent energy behind interplanetary shocks, finding that this decay does not begin immediately after the shock but when the contribution of kinetic processes becomes negligible.
In this study, we perform a statistical analysis of fluctuation properties in CME-driven sheath regions. We use high time-resolution observations from the Wind spacecraft located in the near-Earth solar wind. The key science questions we pose are the following: What are distributions of spectral slopes (kinetic and MHD) in sheaths and how do they depend on the properties of the sheath, shock, and solar wind ahead? What are the distributions of compressibility, intermittency, and normalized magnetic field fluctuations in sheaths? How do these compare to the equivalent parameters and distributions in the solar wind and in planetary magnetosheaths? Similar to Kilpua et al. (2020), we investigate separate regions in the sheath. This present study focuses on the regions close to the shock and CME leading edge.
The paper is organized as follows: In Section 2, we describe the data and methods used, and in Section 3, the results are presented. Section 4 summarizes and discusses the results.
2 Spacecraft Data and Methods
High-resolution magnetic field data from the Magnetic Fields Investigation (MFI; Lepping et al., 1995) instrument of the Wind spacecraft (Ogilvie and Desch, 1997) have been used in this study. The data were obtained from the NASA Goddard Space Flight Center Coordinated Data Analysis Web1 (CDAWeb). The time resolution of the data varies from 0.046 s to 1.84 s. For the majority of events, resolution was 0.092 s and all data were interpolated to this cadence.
The solar wind plasma measurements were obtained from the Solar Wind Experiment (SWE; Ogilvie et al., 1995) instrument on-board Wind. These data were available at 90 s resolution.
Shock parameters were taken from the Heliospheric Shock database, developed and maintained at the University of Helsinki (http://ipshocks.fi/; Kilpua et al., 2015).
2.1 Methods
Sheath events listed by Kilpua et al. (2019) for the years 1997–2018 with some additional events listed by Regnault et al. (2020) have been analyzed in this study. OMNI data were used to identify sheaths in the list given by Kilpua et al. (2019); a few sheaths with Wind data gaps were excluded, leaving a total of 79 sheaths analyzed in the present study (Supplementary Table S1). The duration of the sheaths in study varied from ∼5 to ∼20 h, with the mean duration of 10.1 h.
An example of a sheath region in the near-Earth solar wind is shown in Figure 1. Wind 1 min magnetic field data and 90 s plasma data are shown. The red vertical line indicates the shock, and the blue vertical line indicates the ejecta leading edge (LE). We study two subregions (orange-shaded) within the sheath separately: 1) the Near-Shock region, extending 2 h from the shock into the sheath but excluding the 5 min closest to the shock, and 2) the Near-LE region, covering 2 h closest to the ejecta but excluding the 5 min closest to the leading edge. The fixed 2 h intervals were selected for this study (instead of fractional time) to capture the regions with distinct physical processes likely occurring closest to the shock and the CME-leading edge and providing the same statistical conditions. The leading edge times were adjusted to exclude boundary layers (BLs) that are regularly observed between the sheath and ejecta (Wei et al., 2003a). These BLs form due to interaction between the CME ejecta and the preceding solar wind and exhibit magnetic structure distinct to that in the sheath or ejecta (e.g., Wei et al., 2003a, Wei et al., 2003b; Zhou et al., 2019). The properties in these subregions are compared to conditions in the solar wind ahead (SW-Ahead). This region was selected to extend 2 h into the upstream wind, ending 1 h before the shock. The 1 h before the shock was excluded to avoid foreshock regions that are typically observed for ∼30 min upstream for CME-driven shocks (Kajdič et al., 2012). At the shock, the field magnitude and plasma parameters jump simultaneously. Compared to the preceding solar wind and trailing ejecta, the sheath has compressed plasma (i.e., high temperature and density) and large-amplitude changes in the magnetic field direction and the plasma and field parameters have high variability. The ejecta leading edge is marked by clear decreases in plasma density and temperature and a clear drop in magnetic field variability.
We define magnetic field fluctuations as
where τ is the timescale of the fluctuation (or timelag between two sample points) and the amplitude of the fluctuation is
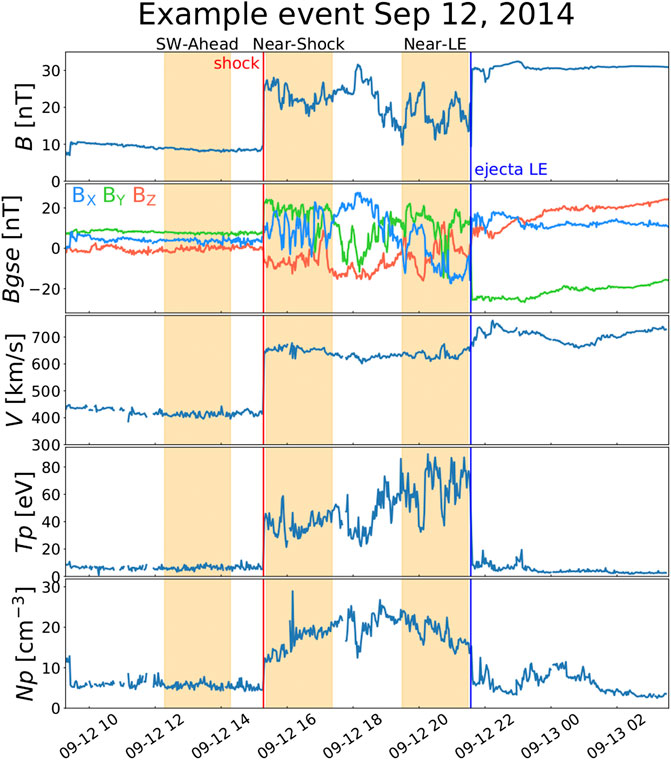
FIGURE 1. Example of a CME-driven sheath region in the near-Earth solar wind as observed by the Wind spacecraft on September 12, 2014. The panels show from top to bottom the following: (A) magnetic field magnitude; (B) magnetic field components in GSE coordinates; (C) solar wind speed; (D) solar wind temperature; and (E) solar wind density. The red vertical line indicates the shock time and the blue vertical line indicates the ejecta leading edge (LE) time. The orange-shaded regions show the solar wind ahead (SW-Ahead), Near-Shock region, and Near-LE region, each 2 h in duration.
The spectral break between the inertial and kinetic ranges is expected to occur close to the ion cyclotron frequency. In the top panels of Figure 2, distributions of ion cyclotron times (
and
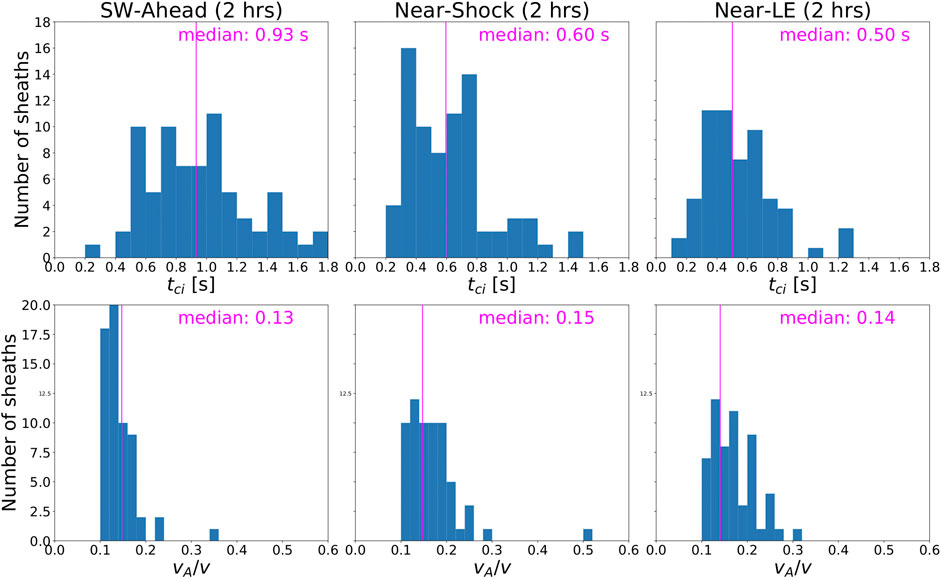
FIGURE 2. Distribution of ion cyclotron times (
We investigate magnetic field fluctuations in the spacecraft frame rather than the solar wind (plasma) frame. The validity of the transformation from spacecraft frequency to wavenumber thus needs some justification. In this context, the Taylor hypothesis states that, when the timescales of magnetic field fluctuations are sufficiently less than the timescale of the rapidly flowing solar wind, the path taken by the observing spacecraft through the solar can be considered as an instantaneous spatial cut (Taylor, 1938; Matthaeus and Goldstein, 1982). The validity of this assumption can be assessed with the
3 Results
3.1 Spectral Indices
The distributions of
Figure 3 shows the histograms of spectral indices in the Near-Shock and Near-LE regions for three different timelag ranges (6–47, 24–188, and 94–754 s) in the inertial range, each containing four values. The pink vertical lines indicate the median values of the distributions. The Kolmogorov (5/3) and Kraichnan (3/2) spectral slopes are indicated by cyan and green vertical lines, respectively.
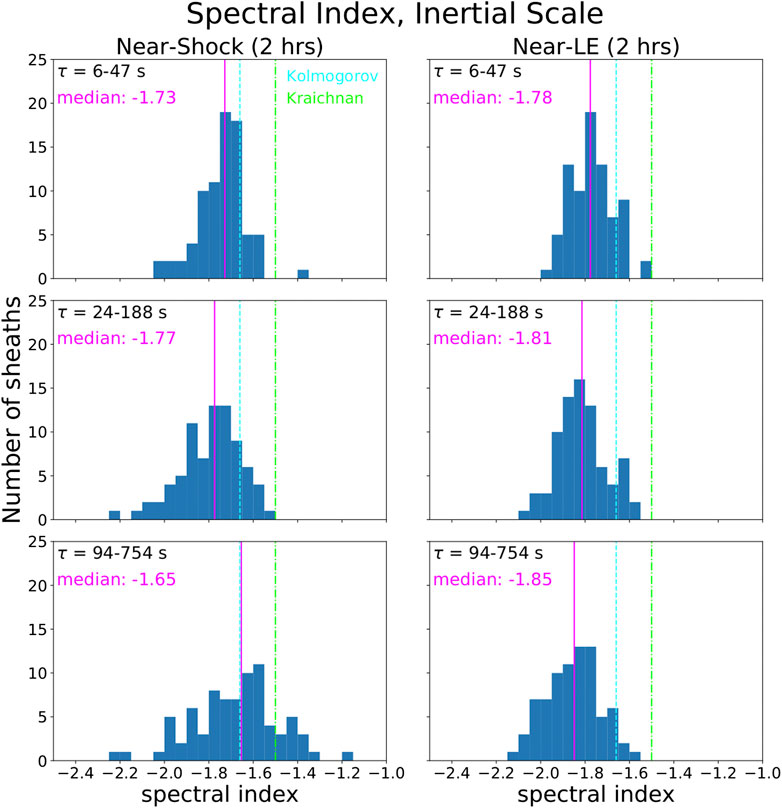
FIGURE 3. Histograms of inertial-range spectral slopes in the Near-Shock sheath subregions (left panels) and Near-LE subregions (right panels), with bin widths of 0.05. Spectral indices were calculated for three different timelag ranges, each containing four values. The dashed cyan vertical line indicates the Kolmogorov index, and the dash-dotted green vertical line indicates the Kraichnan index. The pink vertical lines indicate the distribution medians.
The histograms show that spectral indices mostly vary within the interval ∼ [−2.0, −1.6] for the inertial range. The spread in indices increases as the timelag range moves to larger timescales. At the largest timescales for the Near-Shock region, the distributions extend to shallower values, reaching ∼−1.3. Otherwise, practically all measured slopes are steeper than the Kraichnan index and the bulk of the distributions are also at values steeper than the Kolmogorov index. There is thus no evidence of −1 slopes in the investigated timelag ranges. The comparison of the left and right panels shows that there are no drastic differences between the slopes in the Near-Shock and Near-LE regions. However, the slopes are slightly shallower in the Near-Shock region than in the Near-LE region with the median values closer to the Kolmogorov index (and matching the Kolmogorov index for the largest timescale range).
It should be noted that the 2 h intervals used here to calculate the spectral indices include field fluctuations that may have evolved over considerably different times between different events and within the 2 h intervals themselves. This effect can be explored by estimating the time since the plasma was shocked, given by Borovsky (2020) as
The top panels of Figure 4 show the scatter plot of the inertial-range spectral slopes and
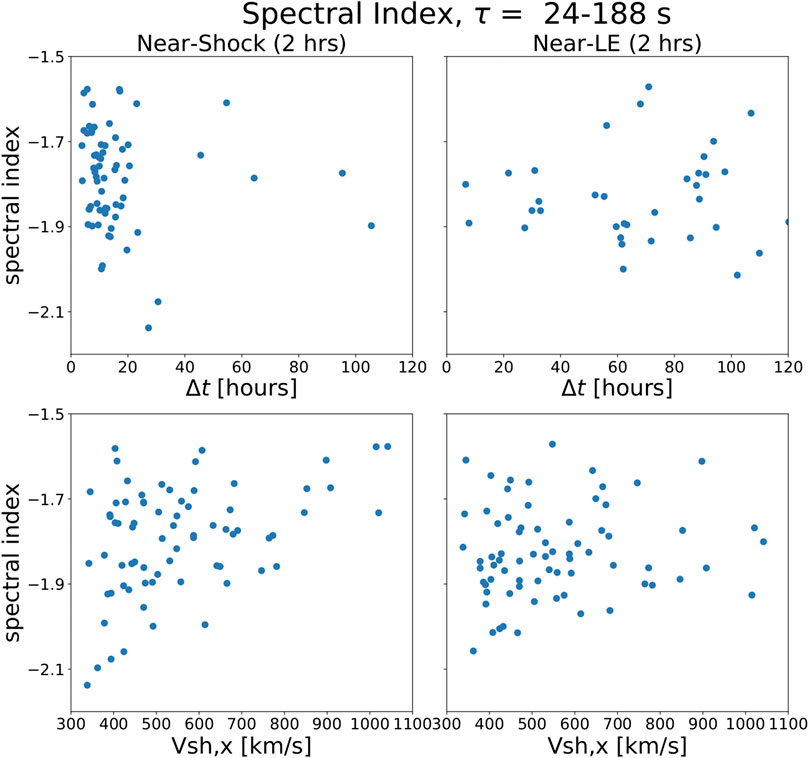
FIGURE 4. Scatter plot of inertial-range spectral slopes calculated for the timescale 24–188 s vs. (top panels) the time since the plasma was processed (
The distribution of kinetic-range spectral indices is shown in Figure 5. Indices were calculated for the three smallest time lags and for one timelag range only. The blue lines in the figure indicate the −2.8 slope found in several previous solar wind studies (see Introduction), and the pink lines give the distribution medians. The kinetic-range indices vary within the interval ∼ [−2.6, −2.0] with median values at −2.40 and −2.32 for the Near-Shock and Near-LE regions, respectively. The figure shows that the measured spectral indices are all shallower than −2.8. We note that the values could have been affected by ion cyclotron timescales being close to or even smaller than the upper limit of the analyzed time range for some cases, the use of only three points in the calculation, and the potentially larger relative contribution of magnetometer noise to these smaller amplitude fluctuations.
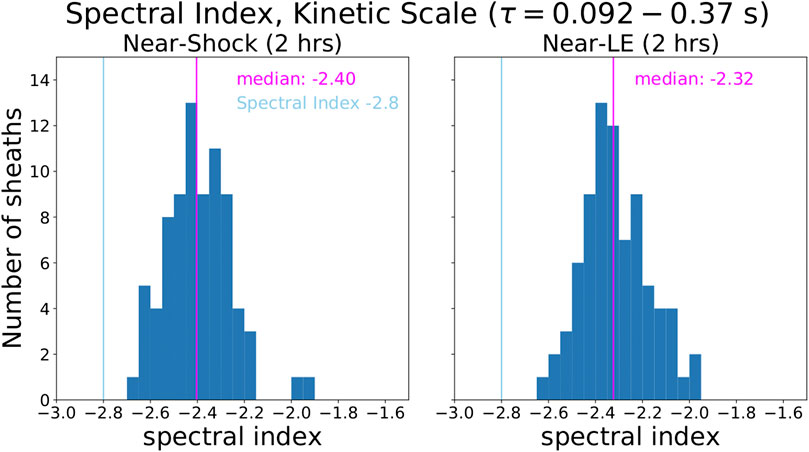
FIGURE 5. Histograms of kinetic-range spectral slopes in the Near-Shock subregions (left panel) and Near-LE sheath subregions (right panel). The blue line indicates the −2.8 slope identified in previous solar wind studies. The pink lines indicate the median values of the distributions.
Figure 6 shows scatter plots of the inertial-range spectral index in the sheath vs. various parameters that characterize the preceding solar wind, the sheath, and the CME driver. The top two rows show plots for the Near-Shock region and the bottom two rows show plots for the Near-LE region. Solar wind parameters include the mean upstream speed (
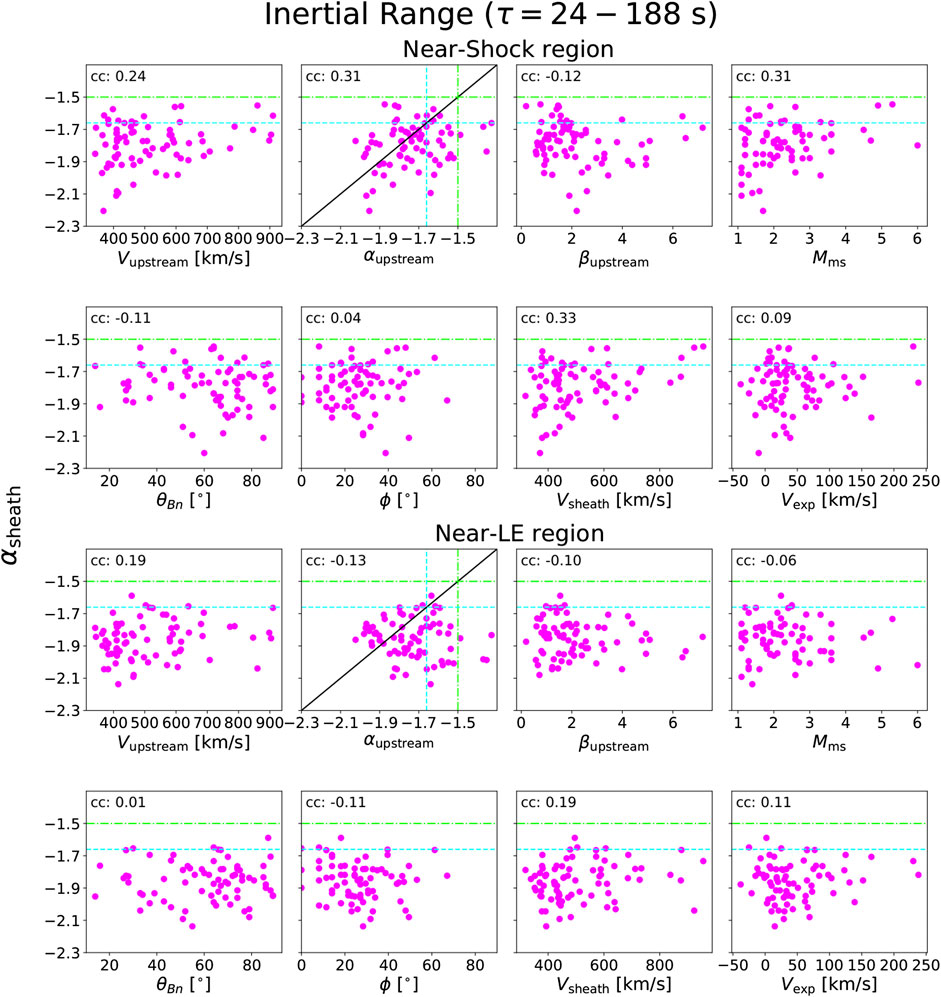
FIGURE 6. Scatter plots of sheath inertial-range spectral indices in the Near-Shock region (top two rows) and Near-LE region (bottom two rows) vs. a range of plasma parameters. The parameters include the upstream wind speed (
First, it is clear from Figure 6 that there are no strong (
The spectral indices in sheaths behind the strongest shocks tend to be shallower and have a smaller spread, particularly so for the Near-Shock region, while weaker shocks are associated with a wide range of spectral indices. The majority of interplanetary shocks at 1 AU are quasi-perpendicular (e.g., Kilpua et al., 2015), and this was also the case for the events analyzed here. Figure 6 shows that they are associated with a large range of spectral indices. For the Near-Shock region in particular, quasi-parallel shocks are in turn associated with a narrower range of spectral indices, ∼[−1.9, −1.5]. The angles between the radial direction and shock normal (ϕ) are generally small, indicating that the majority of the events included in this study were sheaths ahead of CMEs that were crossed relatively close to the apex. There is no notable correlation between ϕ and the spectral indices. The cyan dashed and green dash-dotted lines indicate the Kolmogorov (−1.67) and Kraichnan (−1.50) spectral indices, respectively.
3.2 Partial Variance of Increments
The partial variance of increments (PVI) method (e.g., Greco et al., 2008) allows intermittent structures in time series data to be identified. The time series of the PVI parameter is defined as
where the field increment
Figure 7 shows the probability distribution functions (PDFs) for all 79 sheaths at four τ values, one in the kinetic range (0.18 s) and three in the inertial range (12, 94, and 754 s). At each τ value, PDFs for the SW-Ahead, Near-Shock region, and Near-LE region are shown separately.
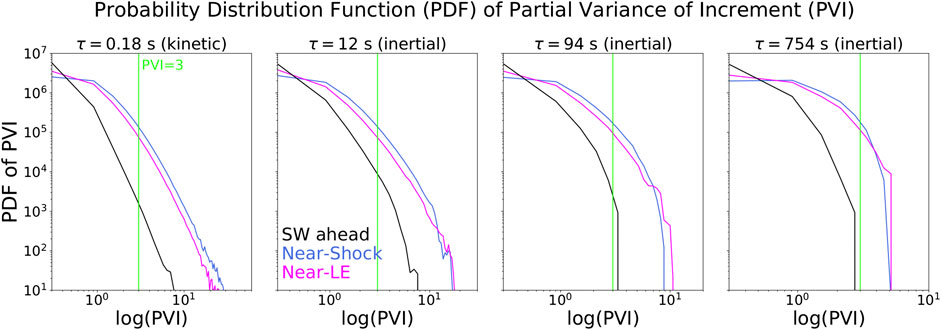
FIGURE 7. PDFs of PVI for four different time lags. PDFs for the SW-Ahead (black), Near-Shock (blue) region, and Near-LE (magenta) region are shown. The green vertical lines indicate the
For all timelags considered, the sheath subregions clearly have higher probability for large PVI values than the solar wind ahead, suggesting that they contain more intermittent structures. The Near-Shock region has generally slightly higher probability for large PVI values than the Near-LE region, except at the very end of the high PVI tail.
We note that PDFs in Figure 7 include the values for all sheaths, meaning that the high PVI tails (particularly at the very largest values) could come from a few events only. To explore this possibility, we show in Table 1 the number of the three regions for which three strong PVI thresholds (
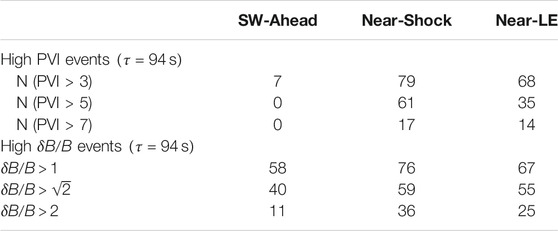
TABLE 1. The occurrence of high PVI values.
3.3 Fluctuation Amplitudes
Normalized fluctuation amplitudes are defined as
The histograms of mean normalized fluctuation amplitudes,
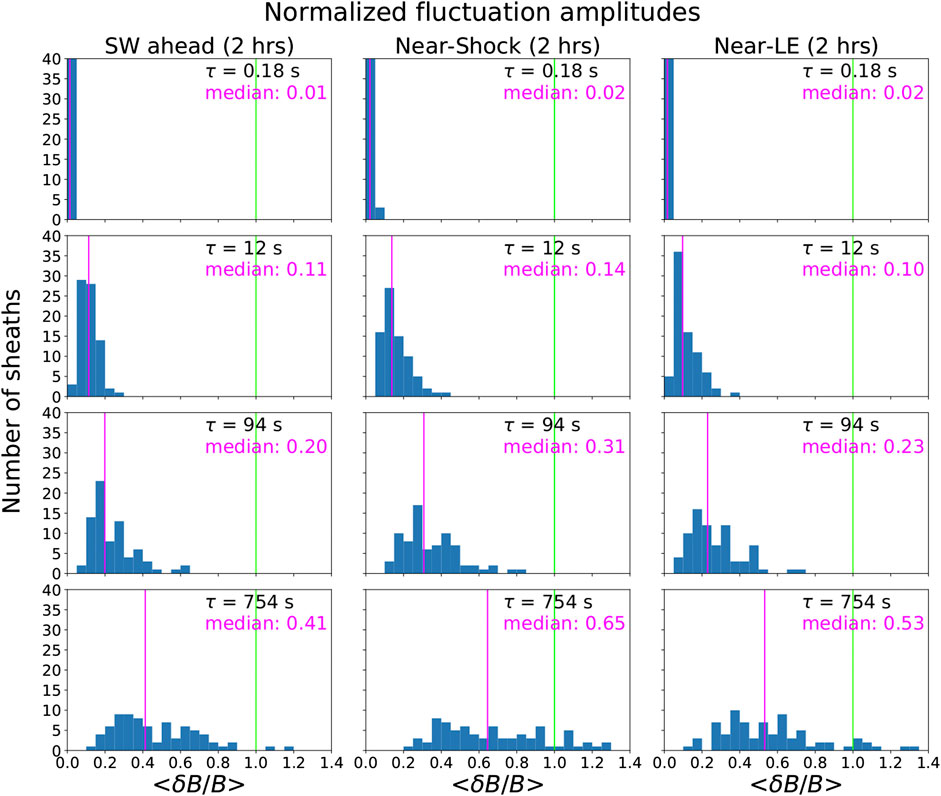
FIGURE 8. Histograms of mean normalized fluctuation amplitudes (
There are some large
The top panels of Figure 9 show
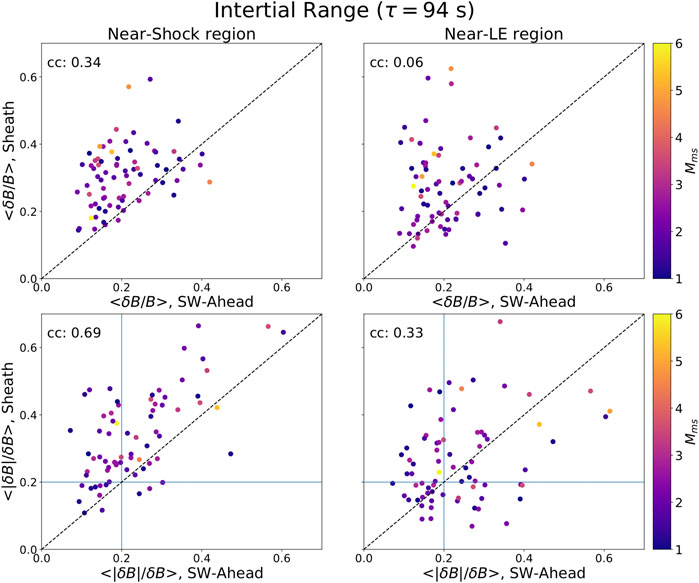
FIGURE 9. Scatter plots of (top) mean normalized fluctuation amplitudes (
The majority of Near-LE regions also have higher
3.4 Compressibility
The previous section indicated that sheaths embed at least some compressible fluctuations. The level of magnetic compressibility can be approximated with
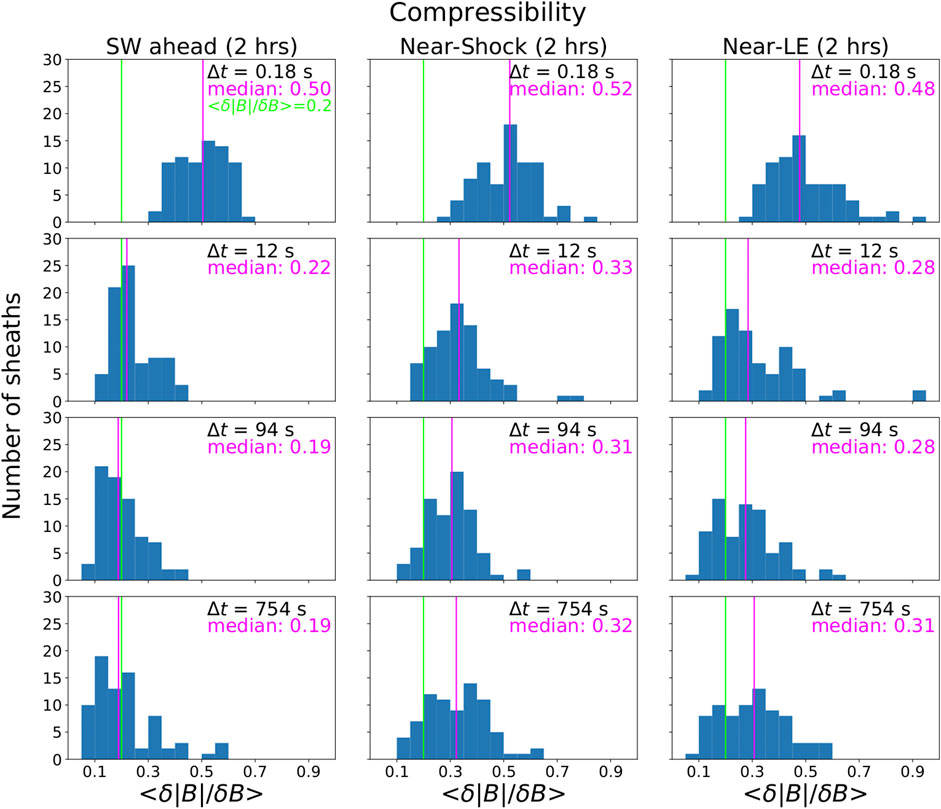
FIGURE 10. Histograms of mean magnetic compressibility (
Figure 10 shows that the level of magnetic compressibility is larger in the kinetic range than in the inertial range (all
The bottom panels of Figure 9 show
Finally, in Figure 11, we explore the magnetic field rotation and compressibility in more detail (see, e.g., Chen et al. 2015). The top panels show the rotation angle α, defined over timescale t and at time t, as follows:
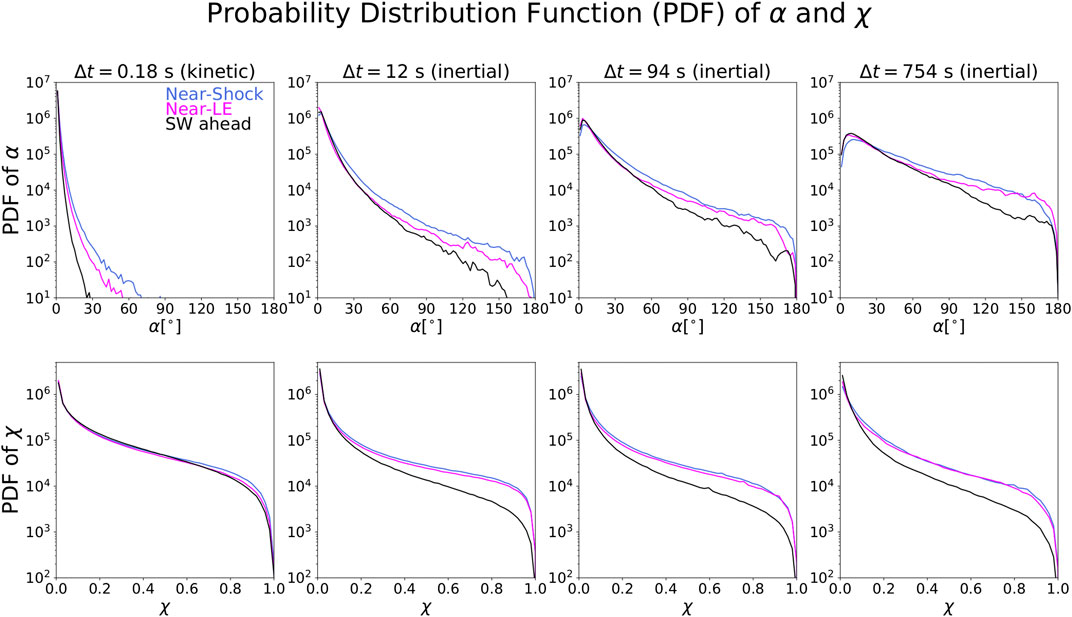
FIGURE 11. Probability distribution function (PDF) of (top) rotation angle α and (bottom) parameter χ for SW-Ahead, Near-Shock region, and Near-LE region. The results are shown for four timelags.
The maximum rotation possible is
Here,
Figure 11 shows that both a and
4 Summary and Discussion
We have performed a statistical investigation of the fluctuation properties in CME-driven sheath regions. In total, 79 sheaths observed in the near-Earth solar wind by the Wind spacecraft between 1997 and 2018 were included in this study. Three different regions were studied, each 2 h in duration: 1) solar wind ahead (SW-Ahead), 2) Near-Shock, and 3) Near-LE. Near-Shock and Near-LE regions are within the sheath, the former adjacent to the shock and the latter adjacent to the ejecta leading edge.
The key findings can be summarized as follows:
•Sheaths had on average steeper inertial-range spectral indices than the Kolmogorov and Kraichnan indices. However, the range of indices was relatively large (∼[−2.2, −1.3]) and was larger for slow sheaths and sheaths preceded by slow solar wind.
•Pearson correlations between the inertial-range spectral indices in the sheath and selected shock, sheath, ejecta, and upstream parameters were mostly very weak or negligible. Some weak correlations were found only for the Near-Shock region; fast sheaths behind strong shocks (high
•On average, sheaths had larger normalized magnetic field fluctuation amplitudes,
•A weak correlation in
•Sheaths had higher magnetic compressibility,
•A strong positive correlation was found for the compressibility between the upstream wind and Near-Shock region, while for the Near-LE region, the correlation was weak.
•Sheaths have clearly larger intermittency than the solar wind ahead. This result is particularly clear in the PVI analysis showing that sheaths have regular strong PVI values (>3), consistent with findings of Zhou et al. (2019). Steeper spectral indices than Kolmogorov’s (and steeper than in the upstream wind) and the presence of fluctuations exhibiting large magnetic field rotation and compressibility (larger
The results of this study confirm many findings of the case studies by Kilpua et al. (2020) and Good et al. (2020a). Sheaths have on average enhanced normalized fluctuation amplitudes, compressibility, and intermittency, and their spectral slopes in the majority of cases are steeper than Kolmogorov’s. Borovsky (2020) performed an extensive statistical analysis of magnetic field and velocity fluctuations upstream and downstream of 109 interplanetary shocks and also found enhanced normalized fluctuation amplitudes downstream, as well as low correlation coefficients between the downstream and upstream values. Note that, however, their work uses partly different approaches as well as that SIR and CME-driven shocks are combined with categorization that is based on the type of the solar wind the shock propagates into. Increased compressibility in the sheaths when compared to ambient wind was also reported in a statistical study by Moissard et al. (2019) (performed over the whole sheath and fluctuations ranging between 20 s and 7.5 min). We note that the compressibility values we obtained here are generally higher than those found in the downstream of interplanetary shocks by Šafránková et al. (2019). The authors also showed that compressibility of fluctuations (defined as the ratio of PSDs of perpendicular to parallel magnetic field fluctuations) increased with increasing plasma beta. The relatively large compressibility values obtained in our study could also be explained by most sheaths, being high-beta structures. The increased intermittency in density fluctuations in terms of substantial deviations from the Gaussian distribution functions from upstream to downstream of interplanetary shocks was also reported by Riazantseva et al. (2017). In agreement, Kilpua et al. (2020) reported stronger deviations from Gaussian distributions for magnetic field fluctuations for three ICME sheaths.
The observed smaller spread in the inertial-range spectral indices and shallower slopes, closer to Kolmogorov’s, for fast sheaths (
As discussed in the Introduction section, in planetary magnetosheaths,
In the kinetic range, spectral slopes varied in the range of [−2.7, −2.0] and were thus shallower than the nominal value reported in solar wind (∼−2.8). Shallower than nominal kinetic-range slopes could be attributed to continuing energy cascade (e.g., Sahraoui et al., 2009; see also discussion in the study by Kilpua et al., 2020). The spread in the kinetic-range spectral indices in turn was smaller than in the inertial-range indices, contrary to, e.g., a study by Smith et al. (2006) in solar wind in general. As mentioned in Section 3.1, the results could be affected by the Wind data capturing only the upper part of kinetic range, the use of only three points in the calculation of the kinetic-range slopes, and the magnetometer noise level. In addition, the shape of the spectrum can change as a function of the distance from the shock due to exponential decay of the spectrum, as shown for density fluctuations, e.g., in the study by Pitňa et al. (2017).
Although the lack of MHD-scale spectrum suggest that CME-driven shocks are not resetting the turbulence at a similar extent than planetary bow shocks, fluctuation properties in sheaths were observed to be distinctly different from the upstream. This was particularly the case for the Near-Shock region. The increased compressibility and normalized fluctuation amplitudes indicate that new (at least partly) compressible fluctuations are developed in the sheath. This is supported by the general lack of correlation between the spectral indices in the sheath and preceding solar wind found in this work and consistent with the results of case studies by Good et al. (2020a) and Kilpua et al. (2020). These results are also consistent with Borovsky (2020) who reported no correlation between the upstream and downstream values of spectral indices. The present statistical study also confirms the finding of Kilpua et al. (2020) that the Near-LE region is more similar to upstream conditions regarding its mean fluctuation properties. The particularly weak/negligible correlations between the sheath and shock/upstream conditions for the Near-LE region suggests that fluctuation properties have further evolved deeper in the sheath and/or are affected by processes at the ejecta leading edge. The field line draping generates field fluctuations and could provide some free energy for the generation of plasma waves (e.g., Ala-Lahti et al., 2019), and its importance should increase with the speed and expansion speed of the ejecta (e.g., Gosling and McComas, 1987; McComas et al., 1988). No clear trend was found with either of these with the spectral slopes in the Near-LE region, but a more detailed comparison of turbulent properties close to the ejecta leading edge and driver characteristics would be needed. The correlation between the shock/upstream parameters and spectral slopes in the Near-Shock region was also weak at best. We note that for some parameters investigated, low correlations can be affected by their values clustering to a relatively limited range. For example, the strong
As summarized above, sheaths were found to have a higher intermittency than solar wind ahead according to several used proxies. It is an interesting question as to what extent the increased intermittency in CME sheath is related to intermittency of turbulent cascade, or is it rather the consequence of the frequent presence of coherent small-scale magnetic structures in the sheath, such as currents sheets, reconnection exhausts, and flux tube boundaries. These coherent magnetic structures could be “relics from the Sun” (e.g., Owens et al., 2011) or formed actively by the processes at the CME shock and leading edge as the CME propagates through the solar wind. Their presence would be detected as high PVI structures and steepen the spectral slopes. This could also shed light on another interesting question why CME sheaths as high magnetic field structures do not exhibit shallower Kraichnan–Iroshinikov spectral slopes (−1.5). Li et al. (2012) suggested that the initially Kraichnan–Iroshinikov-type spectra in the solar wind could steepen due to the presence of current sheets (see also Borovsky, 2010). Another possibility is that turbulent cascade is anisotropic giving the ∼ −5/3 slope in perpendicular direction as suggested by Goldreich and Sridhar (1995). In sheath regions perpendicular to turbulence dominates (e.g., Moissard et al., 2019; Good et al., 2020b) as is typical in general in the solar wind.
It is also an interesting question as to how much fluctuation properties in CME-driven sheaths differ from downstream regions behind SIR-driven shocks. Both are compressive large-scale structures in the solar wind but have different generation mechanisms and differences in their shock properties. Only a relatively small fraction (∼26%) of SIRs has fully developed leading shocks at the Earth’s orbit (e.g., Jian et al., 2006). SIR-driven shocks are also typically weaker and slower than the shocks associated with CMEs and have on average higher upstream plasma beta (e.g., Kilpua et al., 2015). The higher plasma beta can affect generation of plasma waves and, therefore, fluctuation properties.
This statistical study shows that CME-driven sheath regions have their own distinct magnetic field fluctuation properties that are partly distinct from planetary magnetosheaths. Except for compressibility, correlation between downstream values is only weak or negligible. In addition, spectral indices in sheaths did not show clear trends with the shock properties. For example, this is quite different for the case of the terrestrial magnetosheath downstream with a quasi-parallel and a quasi-perpendicular bow shock geometry, where there is clear difference between the turbulence spectral indices, fluctuation levels, compressibility, and occurrence of current sheets (Yordanova et al., 2020). This emphasizes the need for more detailed investigation on how solar wind turbulent properties evolve in the transition through the shock into the sheath, e.g., by finding cases where the spacecraft are probing simultaneously the solar wind upstream, the shock, and the sheath. In addition, multispacecraft encounters within the single sheath would allow better probing on how spectral indices and fluctuation properties change with the distance from the apex of the CME and better comparison with planetary magnetosheath. Higher-resolution magnetic field data would also allow probing more extensively the kinetic range in CME-driven sheath regions. Now, we covered only the upper end of the kinetic range that likely affects the results. Solar Orbiter (Müller et al., 2013) and Parker Solar Probe (Fox et al., 2016) can also shed new insight into CME sheaths (e.g., Good et al., 2020b) and allow investigation on how fluctuation properties in CME sheaths evolve in the inner heliosphere.
Data Availability Statement
Wind data are publicly available at NASA’s Coordinated Data Analysis Web (CDAWeb) database (https://cdaweb.sci.gsfc.nasa.gov/index.html/).
Author Contributions
EK did the main data analysis and compiled the figures. EK and SG planned majority of the research and approaches to be used in the study. All authors (EK, SG, MA-L, AO, DF, MJ, LH, and EY) contributed to the methods and physical interpretations and to the writing of the paper.
Funding
This manuscript has received funding from the SolMAG project (ERC-COG 724391) funded by the European Research Council (ERC) in the framework of the Horizon 2020 Research and Innovation Programme, and the Academy of Finland project SMASH 1310445. The results presented in here have been achieved under the framework of the Finnish Centre of Excellence in Research of Sustainable Space (Academy of Finland grant number 1312390), which we gratefully acknowledge. EY's research is supported by the Swedish Contingencies Agency, gran 2016-2102.
Conflict of Interest
The authors declare that the research was conducted in the absence of any commercial or financial relationships that could be construed as a potential conflict of interest.
Acknowledgments
We acknowledge A. Szabo for the Wind/MFI data and K. Ogilvie for the Wind/SWE data.
Supplementary Material
The Supplementary Material for this article can be found online at: https://www.frontiersin.org/articles/10.3389/fspas.2020.610278/full#supplementary-material.
Footnotes
References
Ala-Lahti, M., Kilpua, E. K. J., Souček, J., Pulkkinen, T. I., and Dimmock, A. P. (2019). Alfvén ion cyclotron waves in sheath regions driven by interplanetary coronal mass ejections. J. Geophys. Res. Space. 124, 3893–3909. doi:10.1029/2019JA026579
Ala-Lahti, M. M., Kilpua, E. K. J., Dimmock, A. P., Osmane, A., Pulkkinen, T., and Souček, J. (2018). Statistical analysis of mirror mode waves in sheath regions driven by interplanetary coronal mass ejection. Ann. Geophys. 36, 793–808. doi:10.5194/angeo-36-793-2018
Alexandrova, O., Chen, C. H. K., Sorriso-Valvo, L., Horbury, T. S., and Bale, S. D. (2013). Solar wind turbulence and the role of ion instabilities. Space Sci. Rev. 178, 101–139. doi:10.1007/s11214-013-0004-8
Borovsky, J. E. (2020). A statistical analysis of the fluctuations in the upstream and downstream plasmas of 109 strong-compression interplanetary shocks at 1 AU. J. Geophys. Res. C Oceans Atmos. 125, e27518. doi:10.1029/2019JA027518
Borovsky, J. E. (2010). Contribution of strong discontinuities to the power spectrum of the solar wind. Phys. Rev. Lett. 105, 111102. doi:10.1103/PhysRevLett.105.111102 |
Borovsky, J. E., and Funsten, H. O. (2003). Role of solar wind turbulence in the coupling of the solar wind to the Earth’s magnetosphere. J. Geophys. Res. C Oceans Atmos. 108, 1246. doi:10.1029/2002JA009601
Borovsky, J. E. (2012). The velocity and magnetic field fluctuations of the solar wind at 1 AU: statistical analysis of Fourier spectra and correlations with plasma properties. J. Geophys. Res. Space. 117, A05104. doi:10.1029/2011JA017499
Bruno, R. (2019). Intermittency in solar wind turbulence from fluid to kinetic scales. Earth Space Sci. 6, 656–672. doi:10.1029/2018EA000535
Bruno, R., Telloni, D., DeIure, D., and Pietropaolo, E. (2017). Solar wind magnetic field background spectrum from fluid to kinetic scales. Mon. Not. Roy. Astron. Soc. 472, 1052–1059. doi:10.1093/mnras/stx2008
Chen, C. H. K., Bale, S. D., Bonnell, J. W., Borovikov, D., Bowen, T. A., Burgess, D., et al. (2020). The evolution and role of solar wind turbulence in the inner heliosphere. LABEL:@jnlApJS. 246, 53. doi:10.3847/1538-4365/ab60a3
Chen, C. H. K., Bale, S. D., Salem, C. S., and Maruca, B. A. (2013). Residual energy spectrum of solar wind turbulence. LABEL:@jnlApJ. 770, 125. doi:10.1088/0004-637X/770/2/125
Chen, C. H. K., Matteini, L., Burgess, D., and Horbury, T. S. (2015). Magnetic field rotations in the solar wind at kinetic scales. Mon. Not. Roy. Astron. Soc. 453, L64–L68. doi:10.1093/mnrasl/slv107
Fox, N. J., Velli, M. C., Bale, S. D., Decker, R., Driesman, A., Howard, R. A., et al. (2016). The solar Probe plus mission: humanity’s first visit to our star. Space Sci. Rev. 204, 7–48. doi:10.1007/s11214-015-0211-6
Goldreich, P., and Sridhar, S. (1995). Toward a theory of interstellar turbulence. II. Strong alfvenic turbulence. LABEL. 438, 763. doi:10.1086/175121
Good, S. W., Ala-Lahti, M., Palmerio, E., Kilpua, E. K. J., and Osmane, A. (2020a). Radial evolution of magnetic field fluctuations in an interplanetary coronal mass ejection sheath. Astrophys. J. 893, 110. doi:10.3847/1538-4357/ab7fa2
Good, S. W., Kilpua, E. K. J., Ala-Lahti, M., Osmane, A., Bale, S. D., and Zhao, L. L. (2020b). Cross helicity of the 2018 november magnetic cloud observed by the parker solar Probe. LABEL. 900, L32. doi:10.3847/2041-8213/abb021
Gosling, J. T., and McComas, D. J. (1987). Field line draping about fast coronal mass ejecta - a source of strong out-of-the-ecliptic interplanetary magnetic fields. Geophys. Res. Lett. 14, 355–358. doi:10.1029/GL014i004p00355
Greco, A., Chuychai, P., Matthaeus, W. H., Servidio, S., and Dmitruk, P. (2008). Intermittent MHD structures and classical discontinuities. Geophys. Res. Lett. 35, L19111. doi:10.1029/2008GL035454
Guo, J., Feng, X., Zhang, J., Zuo, P., and Xiang, C. (2010). Statistical properties and geoefficiency of interplanetary coronal mass ejections and their sheaths during intense geomagnetic storms. J. Geophys. Res. C Oceans Atmos. 115, A09107. doi:10.1029/2009JA015140
Hadid, L. Z., Sahraoui, F., Kiyani, K. H., Retinò, A., Modolo, R., Canu, P., et al. (2015). Nature of the MHD and kinetic scale turbulence in the magnetosheath of saturn: cassini observations. LABEL. 813, L29. doi:10.1088/2041-8205/813/2/L29
Howes, G. G., Klein, K. G., and TenBarge, J. M. (2014). Validity of the taylor hypothesis for linear kinetic waves in the weakly collisional solar wind. Astrophys. J. 789, 106. doi:10.1088/0004-637X/789/2/106
Huang, S. Y., Hadid, L. Z., Sahraoui, F., Yuan, Z. G., and Deng, X. H. (2017). On the existence of the Kolmogorov inertial range in the terrestrial magnetosheath turbulence. Astrophys. J. Lett. 836, L10. doi:10.3847/2041-8213/836/1/L10
Huang, S. Y., Wang, Q. Y., Sahraoui, F., Yuan, Z. G., Liu, Y. J., Deng, X. H., et al. (2020). Analysis of turbulence properties in the mercury plasma environment using MESSENGER observations. LABEL. 891, 159. doi:10.3847/1538-4357/ab7349
Huttunen, K., and Koskinen, H. (2004). Importance of post-shock streams and sheath region as drivers of intense magnetospheric storms and high-latitude activity. Ann. Geophys. 22, 1729–1738. doi:10.5194/angeo-22-1729-2004
Jankovičová, D., Vörös, Z., and Imkanin, J. Å. (2008). The effect of upstream turbulence and its anisotropy on the efficiency of solar wind magnetosphere coupling. Nonlinear Process Geophys. 15, 523–529. doi:10.5194/npg-15-523-2008
Janvier, M., Dasso, S., Démoulin, P., Masías-Meza, J. J., and Lugaz, N. (2015). Comparing generic models for interplanetary shocks and magnetic clouds axis configurations at 1 AU. J. Geophys. Res. C Oceans Atmos. 120, 3328–3349. doi:10.1002/2014JA020836
Jian, L., Russell, C. T., Luhmann, J. G., and Skoug, R. M. (2006). Properties of stream interactions at one AU during 1995 2004. LABEL:@jnlSol. Phys. 239, 337–392. doi:10.1007/s11207-006-0132-3
Kajdič, P., Blanco-Cano, X., Aguilar-Rodriguez, E., Russell, C. T., Jian, L. K., and Luhmann, J. G. (2012). Waves upstream and downstream of interplanetary shocks driven by coronal mass ejections. J. Geophys. Res. C Oceans Atmos. 117, A06103. doi:10.1029/2011JA017381
Kataoka, R., Watari, S., Shimada, N., Shimazu, H., and Marubashi, K. (2005). Downstream structures of interplanetary fast shocks associated with coronal mass ejections. Geophys. Res. Lett. 32, L12103. doi:10.1029/2005GL022777
Kaymaz, Z., and Siscoe, G. (2006). Field-line draping around ICMES. Sol. Phys. 239, 437–448. doi:10.1007/s11207-006-0308-x
Kilpua, E., Koskinen, H. E. J., and Pulkkinen, T. I. (2017a). Coronal mass ejections and their sheath regions in interplanetary space. Living Rev. Sol. Phys. 14, 5. doi:10.1007/s41116-017-0009-6 |
Kilpua, E. K. J., Balogh, A., von Steiger, R., and Liu, Y. D. (2017b). Geoeffective properties of solar transients and stream interaction regions. Space Sci. Rev. 212, 1271–1314. doi:10.1007/s11214-017-0411-3
Kilpua, E. K. J., Fontaine, D., Good, S. W., Ala-Lahti, M., A., O., , Palmerio, E., et al. (2020). Magnetic field fluctuation properties of coronal mass ejection-driven sheath regions in the near-Earth solar wind. Ann. Geophys. 28, 999–1017. doi:10.5194/angeo-38-999-2020
Kilpua, E. K. J., Fontaine, D., Moissard, C., Ala-Lahti, M., Palmerio, E., Yordanova, E., et al. (2019). Solar wind properties and geospace impact of coronal mass ejection-driven sheath regions: variation and driver dependence. Space Weather. 17, 1257–1280. doi:10.1029/2019SW002217
Kilpua, E. K. J., Hietala, H., Koskinen, H. E. J., Fontaine, D., and Turc, L. (2013). Magnetic field and dynamic pressure ULF fluctuations in coronal-mass-ejection-driven sheath regions. Ann. Geophys. 31, 1559–1567. doi:10.5194/angeo-31-1559-2013
Kilpua, E. K. J., Lumme, E., Andreeova, K., Isavnin, A., and Koskinen, H. E. J. (2015). Properties and drivers of fast interplanetary shocks near the orbit of the Earth (1995-2013). J. Geophys. Res. C Oceans Atmos. 120, 4112–4125. doi:10.1002/2015JA021138
Lepping, R. P., Acũna, M. H., Burlaga, L. F., Farrell, W. M., Slavin, J. A., Schatten, K. H., et al. (1995). The wind magnetic field investigation. Space Sci. Rev. 71, 207–229. doi:10.1007/BF00751330
Li, G., Qin, G., Hu, Q., and Miao, B. (2012). Effect of current sheets on the power spectrum of the solar wind magnetic field using a cell model. Adv. Space Res. 49, 1327–1332. doi:10.1016/j.asr.2012.02.008
Müller, D., Marsden, R. G., StCyr, O. C., and Gilbert, H. R. (2013). Solar orbiter. Exploring the sun-heliosphere connection. Sol. Phys. 285, 25–70. doi:10.1007/s11207-012-0085-7
Matteini, L., Stansby, D., Horbury, T. S., and Chen, C. H. K. (2018). On the 1/f spectrum in the solar wind and its connection with magnetic compressibility. Astrophys. J. Lett. 869, L32. doi:10.3847/2041-8213/aaf573
Matthaeus, W. H., and Goldstein, M. L. (1982). Measurement of the rugged invariants of magnetohydrodynamic turbulence in the solar wind. J. Geophys. Res.-Space. 87, 6011–6028. doi:10.1029/JA087iA08p06011
McComas, D. J., Gosling, J. T., Winterhalter, D., and Smith, E. J. (1988). Interplanetary magnetic field draping about fast coronal mass ejecta in the outer heliosphere. J. Geophys. Res. Space. 93, 2519–2526. doi:10.1029/JA093iA04p02519
Moissard, C., Fontaine, D., and Savoini, P. (2019). A study of fluctuations in magnetic cloud-driven sheaths. J. Geophys. Res. Space. 124, 8208–8226. doi:10.1029/2019JA026952
Myllys, M., Kilpua, E. K. J., Lavraud, B., and Pulkkinen, T. I. (2016). Solar wind-magnetosphere coupling efficiency during ejecta and sheath-driven geomagnetic storms. J. Geophys. Res. C Oceans Atmos. 121, 4378–4396. doi:10.1002/2016JA022407
Neugebauer, M., Clay, D. R., and Gosling, J. T. (1993). The origins of planar magnetic structures in the solar wind. J. Geophys. Res. Space. 98, 9383–9390. doi:10.1029/93JA00216
Ogilvie, K. W., Chornay, D. J., Fritzenreiter, R. J., Hunsaker, F., Keller, J., Lobell, J., et al. (1995). SWE, A comprehensive plasma instrument for the wind spacecraft. Space Sci. Rev. 71, 55–77. doi:10.1007/BF00751326
Ogilvie, K. W., and Desch, M. D. (1997). The wind spacecraft and its early scientific results. Adv. Space Res. 20, 559–568. doi:10.1016/S0273-1177(97)00439-0
Osmane, A., Dimmock, A. P., and Pulkkinen, T. I. (2015). Universal properties of mirror mode turbulence in the Earth’s magnetosheath. Geophys. Res. Lett. 42, 3085–3092. doi:10.1002/2015GL063771
Owens, M. J., Wicks, R. T., and Horbury, T. S. (2011). Magnetic discontinuities in the near-earth solar wind: evidence of in-transit turbulence or remnants of coronal structure? LABEL:@jnlSol. Phys. 269, 411–420. doi:10.1007/s11207-010-9695-0
Pitňa, A., Šafránková, J., Němeček, Z., and Franci, L. (2017). Decay of solar wind turbulence behind interplanetary shocks. Astrophys. J. 844, 51. doi:10.3847/1538-4357/aa7bef
Pitňa, A., Šafránková, J., Němeček, Z., Goncharov, O., Němec, F., Přech, L., et al. (2016). Density fluctuations upstream and downstream of interplanetary shocks. LABEL:@jnlApJ. 819, 41. doi:10.3847/0004-637X/819/1/41
Regnault, F., Janvier, M., Démoulin, P., Auchère, F., Strugarek, A., Dasso, S., et al. (2020). 20 years of ACE data: how superposed epoch analyses eeveal generic features in interplanetary CME profiles. J. Geophys. Res. 125, e28150. doi:10.1029/2020JA028150
Riazantseva, M. O., Budaev, V. P., Rakhmanova, L. S., Borodkova, N. L., Zastenker, G. N., Yermolaev, Y. I., et al. (2017). Intermittency of the solar wind density near the interplanetary shock. Geomagn. Aeron. 57, 645–654. doi:10.1134/S001679321706010X
Šafránková, J., Němeček, Z., Němec, F., Verscharen, D., Chen, C. H. K., Ďurovcová, T., et al. (2019). Scale-dependent polarization of solar wind velocity fluctuations at the inertial and kinetic scales. LABEL:@jnlApJ. 870, 40. doi:10.3847/1538-4357/aaf239
Sahraoui, F., Goldstein, M. L., Belmont, G., Canu, P., and Rezeau, L. (2010). Three dimensional anisotropic κ spectra of turbulence at subproton scales in the solar wind. Phys. Rev. Lett. 105, 131101. doi:10.1103/PhysRevLett.105.131101 |
Sahraoui, F., Goldstein, M. L., Robert, P., and Khotyaintsev, Y. V. (2009). Evidence of a cascade and dissipation of solar-wind turbulence at the electron gyroscale. Phys. Rev. Lett. 102, 231102. doi:10.1103/PhysRevLett.102.231102 |
Savani, N. P., Vourlidas, A., Szabo, A., Mays, M. L., Richardson, I. G., Thompson, B. J., et al. (2015). Predicting the magnetic vectors within coronal mass ejections arriving at Earth: 1. Initial architecture. Space Weather. 13, 374–385. doi:10.1002/2015SW001171
Schwartz, S. J. (2000). SSI Scientific Report SR-001. “Shock and discontinuity normals, Mach numbers, and related parameters,” in Analysis Methods for Multispacecraft Data. Editors G. Paschmann, and P.W. Daly (London, United Kingdom: Internation Space Science Institute), 472.
Siscoe, G., MacNeice, P. J., and Odstrcil, D. (2007). East-west asymmetry in coronal mass ejection geoeffectiveness. Space Wea. 5, S04002. doi:10.1029/2006SW000286
Smith, C. W., Hamilton, K., Vasquez, B. J., and Leamon, R. J. (2006). Dependence of the dissipation range spectrum of interplanetary magnetic fluctuationson the rate of energy cascade. Astrophys. J. Lett. 645, L85–L88. doi:10.1086/506151
Taylor, G. I. (1938). Production and dissipation of vorticity in a turbulent fluid. Proc. Roy. Soc. Lond. A. 164, 15–23. doi:10.1098/rspa.1938.0002
Tsurutani, B. T., Gonzalez, W. D., Tang, F., Akasofu, S. I., and Smith, E. J. (1988). Origin of interplanetary southward magnetic fields responsible for major magnetic storms near solar maximum (1978-1979). J. Geophys. Res. Space. 93, 8519–8531. doi:10.1029/JA093iA08p08519
Verscharen, D., Klein, K. G., and Maruca, B. A. (2019). The multi-scale nature of the solar wind. Living Rev. Sol. Phys. 16, 5. doi:10.1007/s41116-019-0021-0 |
Webb, D. F., and Howard, T. A. (2012). Coronal mass ejections: observations. Living Rev. Sol. Phys. 9, 3. doi:10.12942/lrsp-2012-3
Wei, F., Liu, R., Fan, Q., and Feng, X. (2003a). Identification of the magnetic cloud boundary layers. J. Geophys. Res. C Oceans Atmos. 108, 1263. doi:10.1029/2002JA009511
Wei, F., Liu, R., Feng, X., Zhong, D., and Yang, F. (2003b). Magnetic structures inside boundary layers of magnetic clouds. Geophys. Res. Lett. 30, 2283. doi:10.1029/2003GL018116
Yordanova, E., Vörös, Z., Raptis, S., and Karlsson, T. (2020). Current sheet statistics in the magnetosheath. Front. Astron. Space Sci. 7, 2. doi:10.3389/fspas.2020.00002
Keywords: solar wind, turbulence, magnetic field, coronal mass ejections, interplanetary shock
Citation: Kilpua EKJ, Good SW, Ala-Lahti M, Osmane A, Fontaine D, Hadid L, Janvier M and Yordanova E (2021) Statistical Analysis of Magnetic Field Fluctuations in Coronal Mass Ejection-Driven Sheath Regions. Front. Astron. Space Sci. 7:610278. doi: 10.3389/fspas.2020.610278
Received: 25 September 2020; Accepted: 03 December 2020;
Published: 04 February 2021.
Edited by:
Marian Lazar, Ruhr-Universität Bochum, GermanyReviewed by:
Jana Safrankova, Charles University, CzechiaXochitl Blanco-Cano, National Autonomous University of Mexico, Mexico
Copyright © 2021 Kilpua, Good, Ala-Lahti, Osmane, Fontaine, Hadid, Janvier and Yordanova. This is an open-access article distributed under the terms of the Creative Commons Attribution License (CC BY). The use, distribution or reproduction in other forums is permitted, provided the original author(s) and the copyright owner(s) are credited and that the original publication in this journal is cited, in accordance with accepted academic practice. No use, distribution or reproduction is permitted which does not comply with these terms.
*Correspondence: Emilia Kilpua, ZW1pbGlhLmtpbHB1YUBoZWxzaW5raS5maQ==