- International Arctic Research Center, University of Alaska Fairbanks, Fairbanks, AK, United States
This paper describes a short story of how I learned in early days in space physics (1960–1970) that there are the direct and feed-back relationships between geomagnetic storms and auroral/magnetospheric substorms. In those days, both geomagnetic storms and auroral substorms were almost independent subjects. It is now understood that auroral substorms are directly related to the development of the ring current and thus of the main phase of geomagnetic storms. Further, we have begun to recognize that the growth of the ring current (caused by auroral/magnetospheric substorms) will change the internal structure of the magnetosphere, which in turn will change and could modify at least the intensity of auroral substorms. Thus, there are interesting feed-back processes between them. It is expected that this feed-back relationship between geomagnetic storms and auroral/magnetospheric substorms will become one of the major issues in magnetospheric physics in the future. In fact, an effort to understand this relationship will deepen our understanding of both geomagnetic storms and auroral/magnetospheric substorms. The progress in understanding the relationship between auroral substorms and geomagnetic storms is an example, in which it takes a long time to advance even one step. It is hoped that this paper will serve to learn the background in the development of space physics in the early days.
Introduction: History
It had been well known from early days that intense geomagnetic storms are associated with great auroral displays. However, both subjects were treated as almost independently in those days. Thus, it is interesting to look back how a study of the relationship between geomagnetic storms and auroral substorms has developed. I describe this story on basis of my own experience.
I started to study geomagnetic storms first as a graduate student under Sydney Chapman, in particular the relationship between the solar wind and the development of the main phase of geomagnetic storms; Figure 1. Then, I began to study auroral displays and established the present concept of auroral substorms (Akasofu, 1964). It was during the course of a study of auroral substorms, I learned that auroral substorms are directly responsible for the cause of the main phase of geomagnetic storms by the fact that auroral substorms inject protons into the ring current belt (Deforest and McIlwain, 1971).
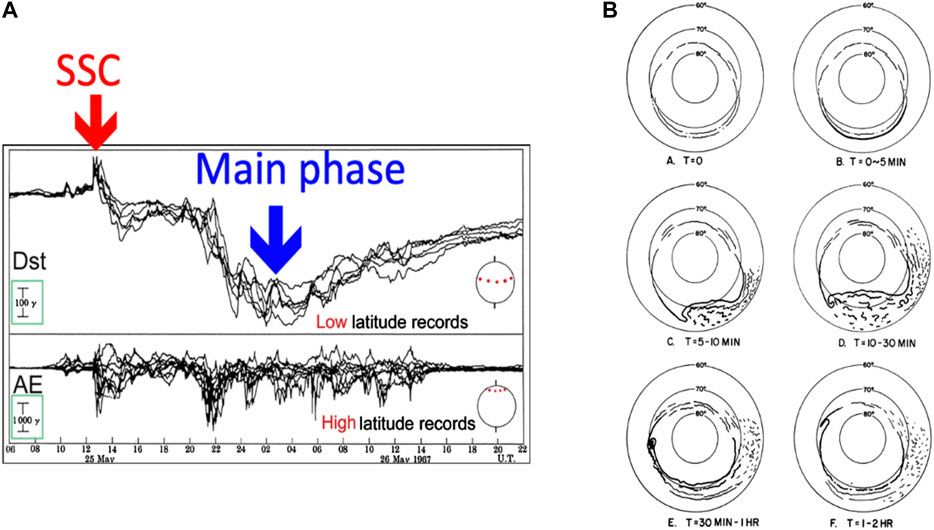
FIGURE 1. (A) An example of geomagnetic storms, indicating the storm sudden commencement (ssc) and the main phase decrease (a large decrease of the H component). (B) A schematic illustration showing the development of an auroral substorm.
Since then, there have been many important developments in understanding the formation of the ring current. One of them was the discovery that ionospheric oxygen atoms (ionized) are the main particles of the ring current during major geomagnetic storms (Shelley and Johnson, 1972). The other was that it became possible to “see” those oxygen atoms in the ring current belt, (cf. Fok, 2003).
Early Indications to Suggest the Relationship
Earliest Indication
In 1963, I found the first and a concrete observation to suggest that both auroral activities and the main phase of geomagnetic storms occur almost exactly at the same time as (Figure 2).
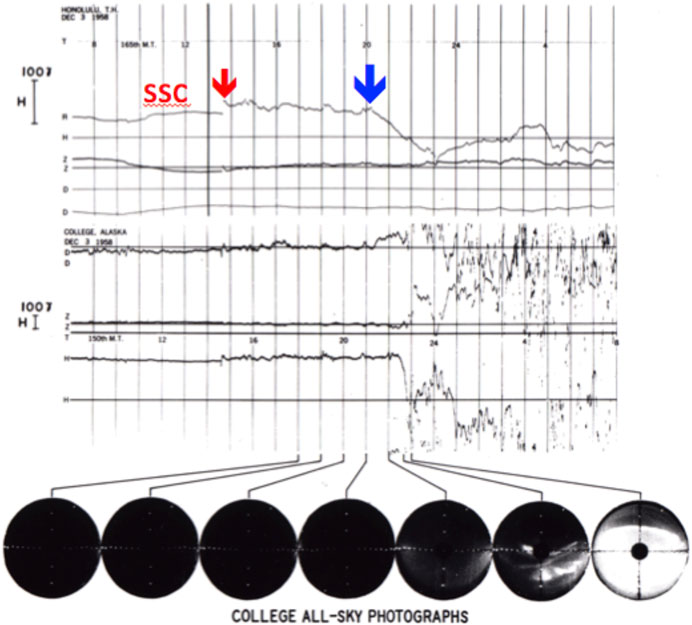
FIGURE 2. An example of the simultaneous occurrence of the main phase (Honolulu magnetogram), polar magnetic disturbances [Fairbanks (College)] and auroral activities [all-sky images at Fairbanks (College)]. It shows not only the long delay of the occurrence of the main phase after the ssc, but also the simultaneous occurrence of intense auroral and magnetic disturbances.
However, since the emphasis in Figure 2 was the fact that the simultaneous occurrence took about 6 h after the ssc- a sudden increase of the H-component of about 20 nT (the signal of the arrival of an enhanced solar wind), the serious question at that time was why it took so long before the onset of the main phase and auroral activities, in spite of the fact that a strong solar wind was blowing such a long time. I suggested the arrival of some “unknown” factor for the occurrence of both other than an intense the solar wind; the presence of the unknown factor became very controversial.
This simultaneous event after long delay after the storm sudden commencement- and the arrival of the “unknown” factor was reported by Chapman in the First Solar Wind Conference in Pasadena in 1966. After Chapman’s presentation, Dungey (1966) suggested that the “unknown” factor may be the IMF Bz. His suggestion was confirmed by Fairfield and Cahill, 1966).
During the period of searching for the unknown factor in the solar wind, it was found that ssc of similar intensities (similar solar wind intensities) can cause a large difference of the intensity of the main phase, suggesting also the presence of the unknown factor in causing the main phase and auroral activity; the figure was used in a paper by Akasofu and Chapman (1963a); Figure 3.
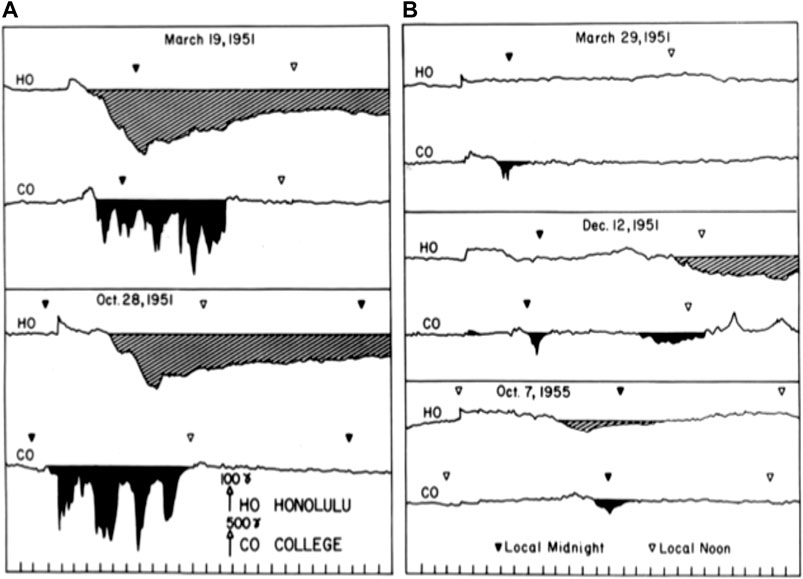
FIGURE 3. A comparison of the intensity of intense (A) and weak (B) main phases with a similar intensity of the ssc (indicating similar intensities of the solar wind). It showed also that an intense main phase (Ho, Honolulu) is accompanied by intense polar magnetic disturbances (CO, College), and weak main phases are hardly accompanied by polar magnetic disturbances (Akasofu and Chapman, 1963b).
Figure 3 suggested clearly that intense magnetic substorms (simultaneous auroral substorms/polar magnetic disturbances substorms) occur during intense the main phase. On the other hand, when the main phase is weak, the intensity of substorms is weak, suggesting the presence of the unknown factor.
However, the realization of the relationship between substorms and the main phase came much later. In fact, when a study of auroral substorms began in 1964, it had not been realized that auroral substorms are physically and directly related to the main phase the main phase/ring current, although I was studying both together.
Akasofu and Chapman (1963b) recognized for the first time the relationship between magnetic substorms and the main phase in terms of the DP (AE) and DR (Dst) indices. Figure 4A was perhaps the first figure which was intended to show both the AE and Dst indices together, although some people refused to put the two indices together by saying it was confusing. (Figure 4B was made much later).
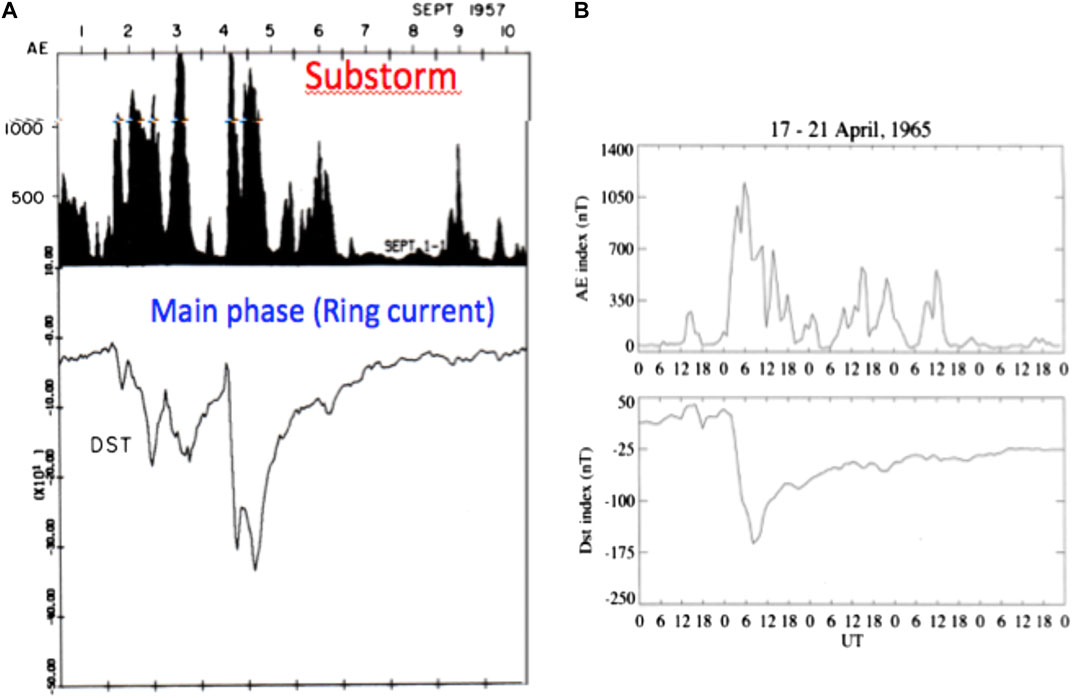
FIGURE 4. (A) The first figure which combines both the AE and Dst indices together. (B) Another example made much later.
Examining a number of events similar to Figures 3, 4, it was recognized that the main phase of geomagnetic storms occurs during the period when intense substorms occur frequently. However, I myself did not realize at that time that auroral substorms cause directly the ring current.
It took a few more steps to recognize the close relationship between them. The first one was the asymmetric development of the main phase and its relationship with the auroral electrojet. [It may be noted that it was the days when it was necessary to make the AE index by ourself by collecting magnetograms from arctic stations (even digitizing them), and also similarly collecting low latitude magnetograms for the Dst index, so that the time was consumed much in preparing necessary data sets, not fully recognizing the significance of data sets].
Asymmetric Development of the Main Phase
During the course of a study of the main phase, it was found that the main phase tends to develop asymmetrically (Akasofu and Chapman, 1964). Figure 5 shows an example, in which the main phase decrease is largest in the evening sector (the African sector in this case), compared with the midday sector (the Asian sector). Figure 6A shows graphically the intensity of the main phase decrease during two major storms.
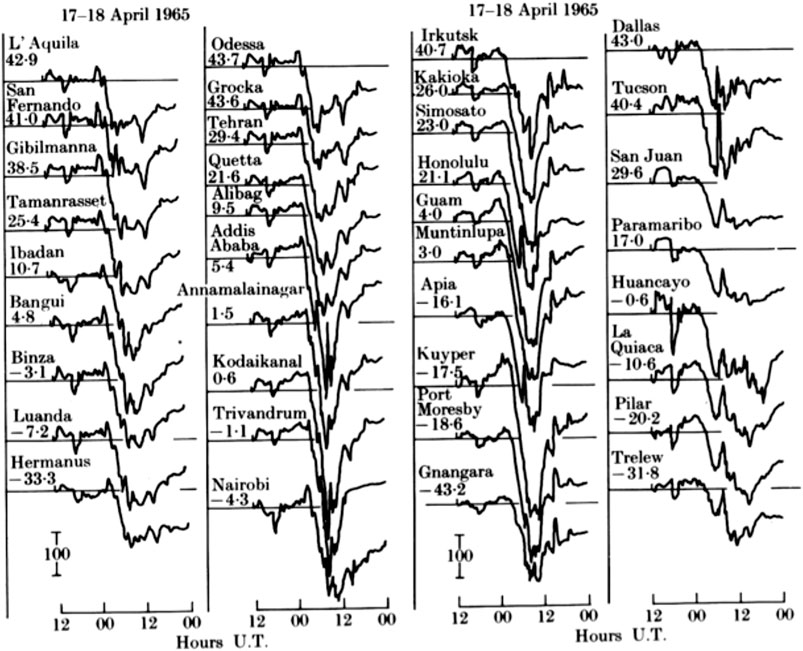
FIGURE 5. A collection of magnetograms from low latitude stations; from the left African, the Middle East Asian and American sectors. In this case, the Asian stations had the largest main phase decrease, because they were located in the evening sector.
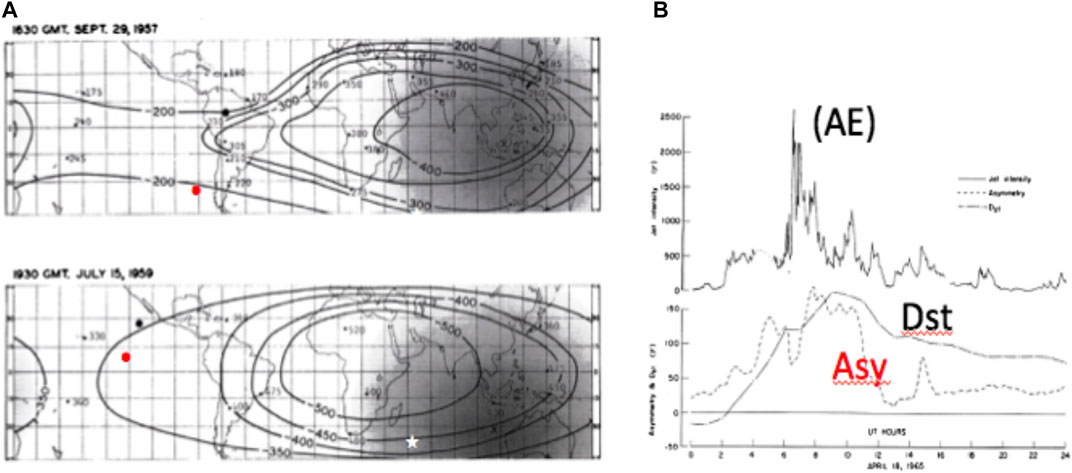
FIGURE 6. (A) Two examples of the asymmetric development of the main phase. The subsolar point is shown by a red dot (B) The relationship between the Dst, the asymmetry index (Asy) and the jet intensity (similar to the AE index before the AE index became available) (Akasofu and Chapman, 1964).
Further, it was found that the asymmetry is prominent only during the developing epoch of the main phase, during which substorm activity is intense, as Figure 6B shows (the asymmetry of the main phase Asy is the difference between the largest and smallest intensities in the main phase decrease).
Since protons were thought to be the main constituent of the ring current at that time, it was speculated that auroral substorms could produce energetic protons and inject them from the night side. The (electro) jet index was used before the AE index was introduced.
Further, since protons are known to drift westward, namely toward the evening sector, it was thought that these observations seem to suggest that protons are responsible for the ring current; it was thought that the asymmetry fades away as the protons spread around the earth completing the ring current (Asy index in Figure 6B).
Relation Between Dst and Substorm Onset
Looking back, one of the earliest findings of the relationship between substorms and the main phase was that the relationship between the latitude of the initial brightening of an arc (substorm onset) and the magnitude of the Dst index (Akasofu and Chapman, 1963c); Figure 7A.
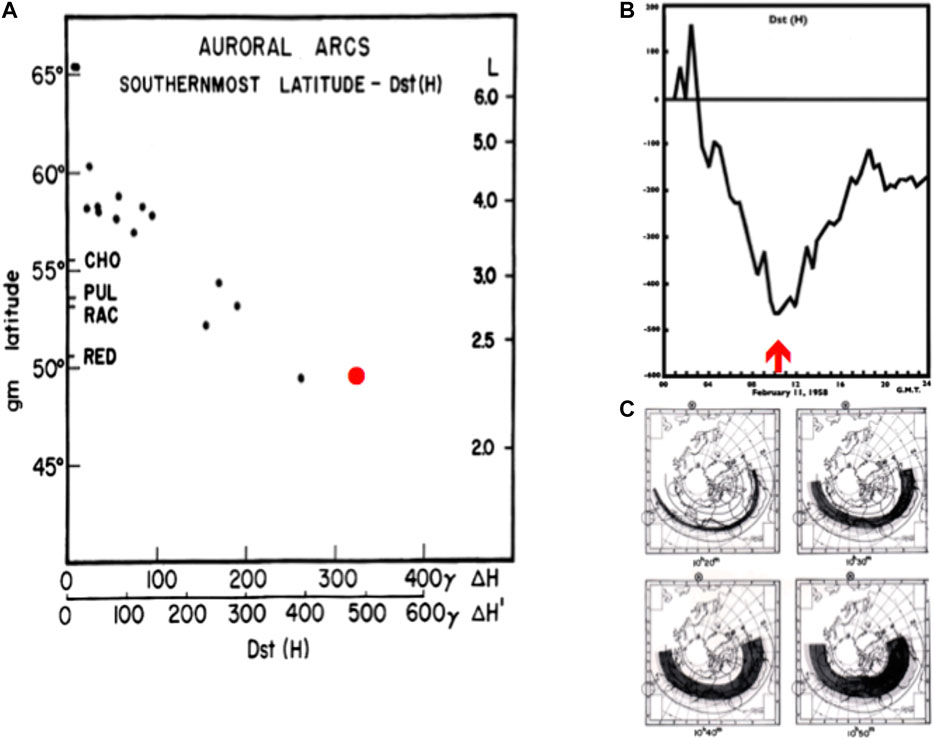
FIGURE 7. (A) The relationship between the location of the initially brightening of an arc (substorm onset) and the Dst index during geomagnetic storms (Akasofu and Chapman, 1963c). The red dot case occurred during an intense geomagnetic storm of February 11,1958. (B) The Dst index during the February 11, 1958. The red arrow shows the onset of an intense substorm shown in (C).
The location of the initial brightening (substorm onset) for medium intensity substorms is about 63°–65° on the average. However, during intense main phases, it can be lower than 50°, corresponding to less than L = 2.5; it is unlikely that the onset location (a sudden brightening of an arc) on the equatorial plane of the magnetosphere can be as close as, 2.5 Re, but it could be 4 Re during great storms (Dst = 500 nT); the earth’s dipolar field is expected to be modified considerably by the ring current during a large main phase.
Looking back, the above results were indeed one of the earliest and crucial indications which demonstrate the cause-effect and feedback relationship of auroral substorms and the main phase decrease. However, we were not aware of this significance at that time.
It may be worthwhile to list two important questions here for considering the feed-back relationship between the ring current and auroral substorms.
(1) The first question is why the auroral oval can expand so greatly during a large main phase. It is unlikely that the so-called “the flux transfer to the night side” can explain such a very large auroral oval even with a large IMF Bz (say, 25 nT).
(2) It is quite likely that the development of the ring current is related to the enlargement of the auroral oval caused by the distortion of the internal structure of the magnetosphere by the ring current; the ring current produces a negative H field inside it, so that it could expand the oval. In turn, the distorted magnetospheric field could allow the occurrence of more intense auroral substorms, because the field intensity is stronger toward the earth, enabling to accumulate more the energy compared with the distance at 6 Re, as a result of the feedback process.
Injection of Protons From the Plasma Sheet
The first and crucial observation to indicate that substorms are directly related or cause the main phase was made by Deforest and McIlwain (1971), who showed that each substorm injects protons into the ring current from the tailward side (Figure 8). This observation was critical in confirming that auroral substorms are the direct cause of the main phase. In Figure 8, it can be seen that most energetic protons are injected simultaneously with a sharp increase of electrons (substorm onset). The injection was thought to be caused by an enhanced convection. De Michelis et al. (2011) confirmed the substorm-geomagnetic relationship on the basis of an information theory. Runge et al. (2018) concluded that the IMF Bz component is essential for both substorms and geomagnetic storms, but do not consider any direct relationship between them. However, the satellite results mentioned in the above shows clearly the direct relationship.
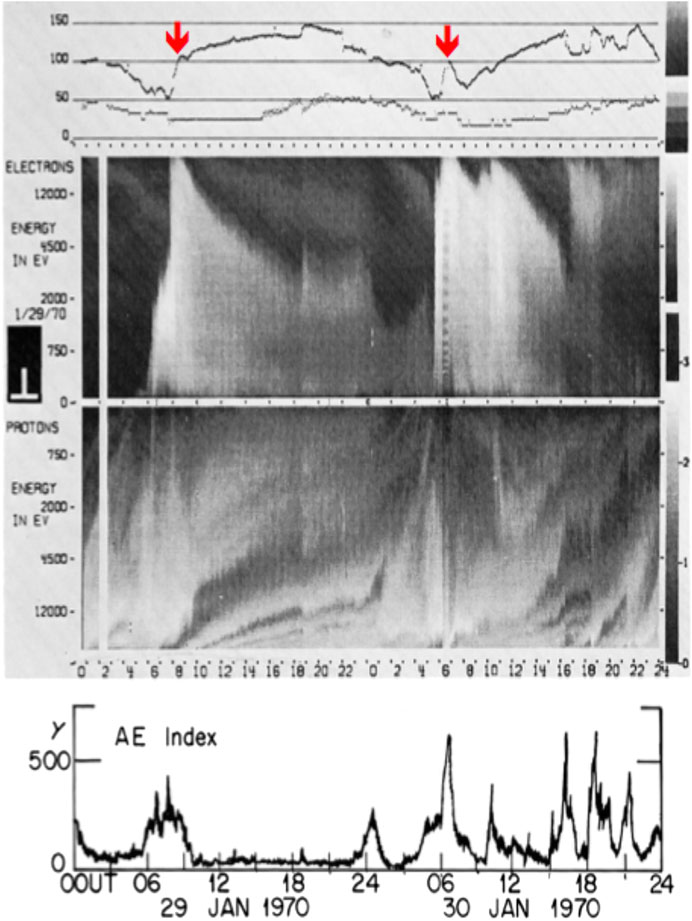
FIGURE 8. The satellite observation (at 6Re) of the injection of electron (upper part) and protons (lower part) to the ring current belt (Deforest and McIlwain, 1971); the most energetic protons are injected first and then lower ones.
Ring Current and Substorm Current System
Thus, it was realized then that it is necessary to study the cause of auroral substorms in order to understand the formation of the main phase. Thus, the cause of auroral substorms has become one of the main subjects in magnetospheric physics and still is.
More specifically, in understanding the relationship between the ring current and auroral substorms, it was realized at that time that it was necessary to study the relationship between the ring current and the current system of auroral substorms; Figure 9A shows the distribution of the current in the ring current and the magnetic fields produced by the ring current. Figure 9B shows the simultaneous observations of the aurora by a satellite and the ionospheric electric current obtained by a ground-based magnetometer network.
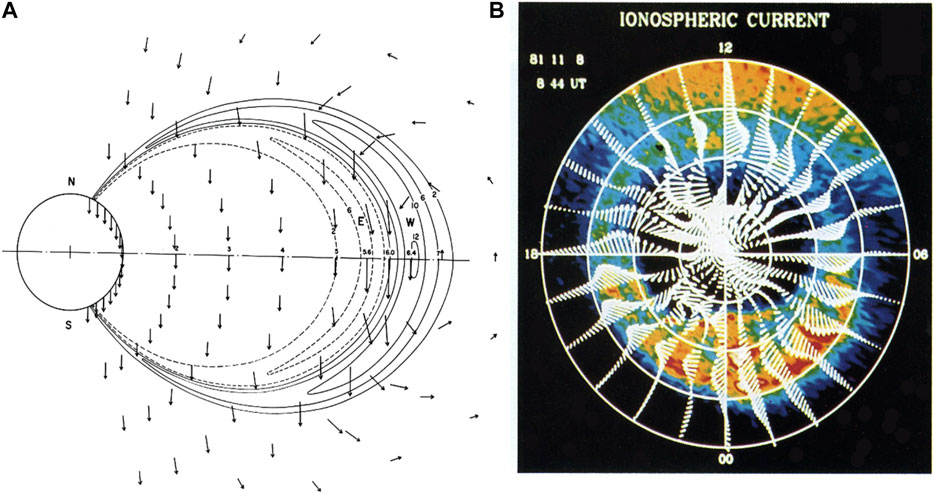
FIGURE 9. (A) The distribution of the ring current and the magnetic field produced by the current; note that the current flows westward half of the belt, and eastward in the inner half Akasofu et al., 1961). (B) The simultaneous observation of the ionospheric current (based on ground-based data) and the distribution of auroras (satellite observation); Craven et al. (1884).
The substorm current system has two components, the directly driven (DD) current them unloading (UL) current, as schematically shown in Figure 10; (cf. Akasofu, 2017).
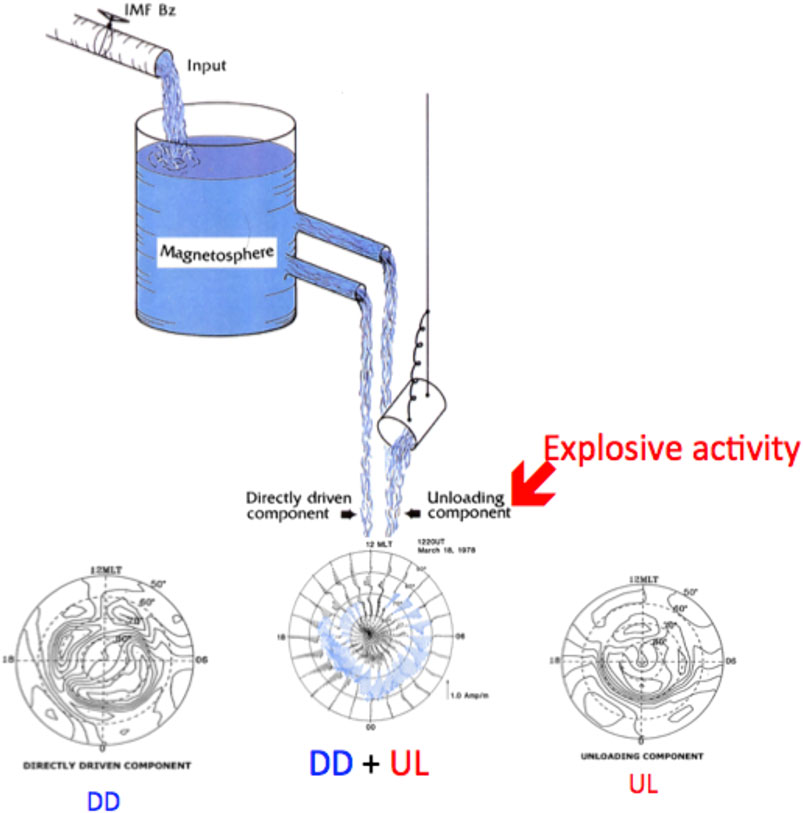
FIGURE 10. The tank-tippy pitcher model of the role of the magnetosphere. What we can observe by a ground-based magnetometer network is (DD + UL). The figure shows also both the DD and UL components.
However, the observed current by ground-based magnetometers is (DD + UL), it was necessary to separate the DD and UL components in order to examine how each component contributes to the formation of the ring current. This separation was accomplished by Sun et al. (2000).
Directly Driven Current
It was found that the DD current is found to be a two-cell current in the polar ionosphere (Figures 10, 11B), which is the ionospheric manifestation of plasma convection and also which is driven the electric field across the magnetosphere (directed from the morning side to the evening side); Axford and Hines (1961); Figure 11A. Actually, it is an improved version of Chapman’s SD current (Figure 11D) and is greatly distorted by the anisotropic conductivity of the ionosphere.
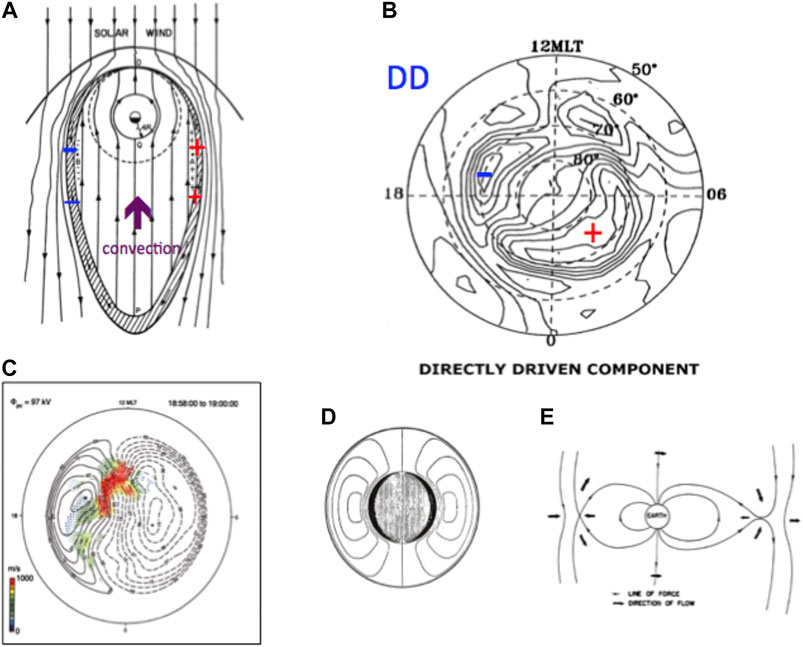
FIGURE 11. (A) The convection pattern of plasmas in the equatorial plane, suggested by Axford and Hines (1961) on the basis of Chapman’s SD current. (B) The ionospheric convection pattern (the same as the DD current, the current line is the same as the convection line) based on the analysis of the six meridian chains of station. (C) An example of the superDarn observation of the ionospheric convection (Bristow and Jensen, 2007). (D) Chapman’s SD current. (E) Dungey of convection model based on the SD current (Dungey, 1961).
The DD current pattern is confirmed by the superDarn observation (Bristow and Jensen, 2007), which observes the convection pattern of plasma in the ionosphere; compare Figures 11B,C. It may be noted that in his 1961 paper, Dungey attempted to explain the SD current by a convective motion of magnetic field lines (Figure 11E).
The Unloading Current System
The UL current system in the ionosphere is a single cell current and is called the auroral electrojet, as shown in Figure 12B. The UL current is the ionospheric part of the current system proposed by Bostrom (1964), which is shown in Figure 12A.
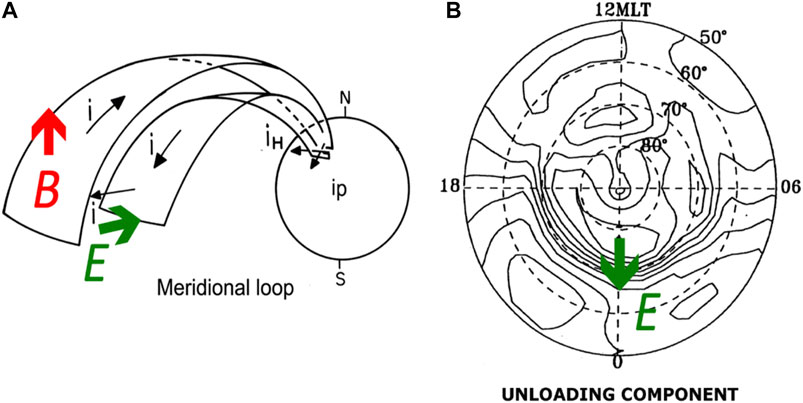
FIGURE 12. (A) Bostrom’s 3-D current system for the expansion phase (Bostrom, 1964); it is driven by an earthward electric field E. (B) The UL current in the ionosphere deduced on the basis he the six meridian chains of magnetometers. The current is driven by a southward electric field, which is transferred from E in (A). (Sun et al., 2000).
This current system can be driven by an earthward electric field on the equatorial plane; in the circuit; the condition of J • E < 0 is present only on the equatorial plane, so that the electric field driving the current system must be there. The cause of this electric field is one of the most crucial fact in determining the expansion process (Akasofu, 2017). The major phenomena associated with the expansion phase can be caused by this UL 3-D current system (Figure 12A).
Relationship Between Directly Driven/Unloading Currents and the Power
In Figure 13, we examine the relationship between the power and the DD/UL currents as a function of time (Akasofu, 2017).
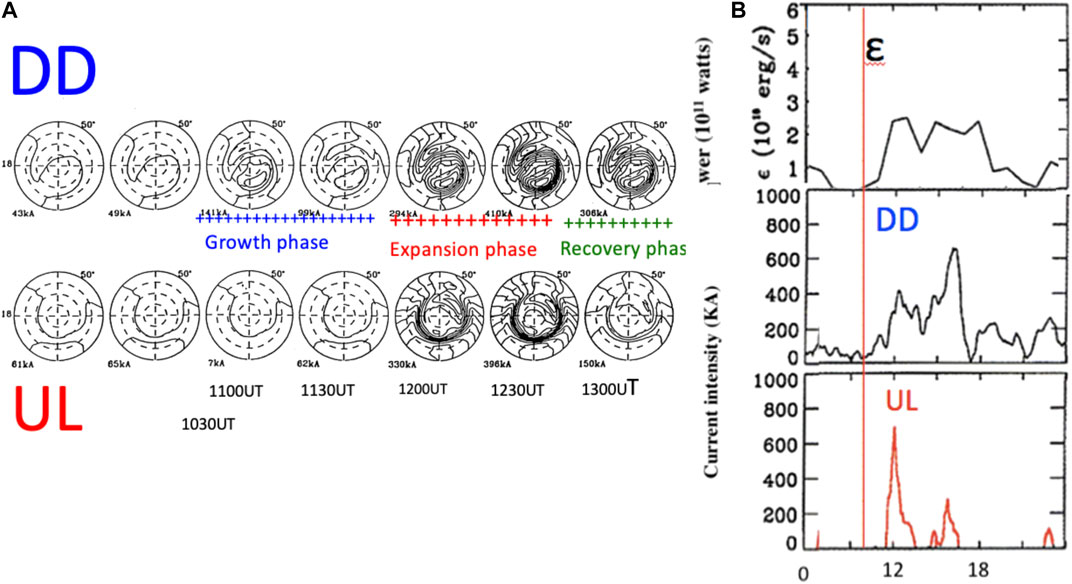
FIGURE 13. (A) The development of the current pattern for both the DD and the UL currents during the growth, expansion and recovery phases. (B) The variations of the DD and UL currents with the power.
It can be seen in Figure 13A that the growth of the DD current is weak and slow at the beginning, indicating that the Joule dissipation is weak, in spite of the fact that the power is high, so that the power must be accumulated in the magnetosphere. This period is called the growth phase. Then, the UL current developed impulsively without any specific relation to the power; Figure 13B.
The results can be summarized:
(1) The DD current follows fairly well the power P (= ε/8π).
(2) The DD current grows more slowly than the power at the beginning.
T(3) he onset of the UL current begins after a significant delay of about one hour behind the DD current. This delay period is called the growth phase.
(4) The above facts indicate that the power is not dissipated much during the growth phase, and thus must be accumulated in the inductive circuit of the magnetosphere.
(5) Unlike the DD current, the UL current occurs impulsively (unrelated to time variations of the power P).
(6) The main UL current occurs only during an early epoch of substorms (despite the fact that the power is maintained high even after the end of the expansion phase).
(7) The DD current is enhanced during and after the expansion phase and lasts until the power becomes less than 1011 w.
Contribution of the Directly Driven and Unloading Current to the Ring Current
In order to examine a quantitative relationship between the main phase/ring current and substorms, the relationship between Dst and the DD and UL currents is examined (Figure 14); Sun and Akasofu (2000).
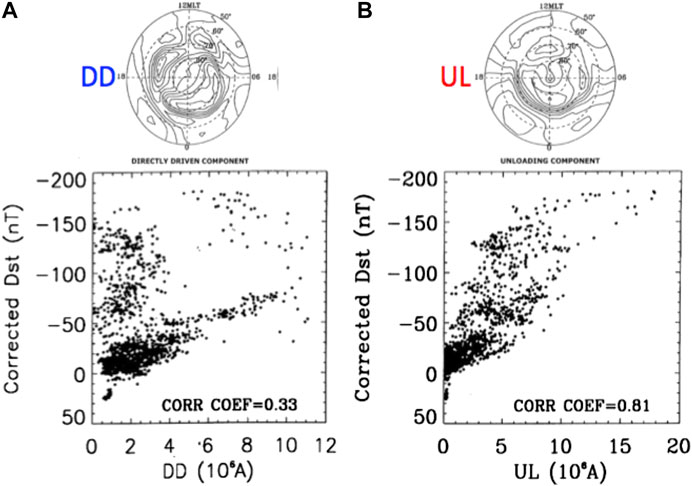
FIGURE 14. (A) The relationship between the DD component and Dst. (B) The relationship between the UL component and Dst. (Sun and Akasofu, 2000).
It is reasonable to expect from the earlier sections that there would be a clear relationship between the UL intensity and Dst (Figure 14B), since the injection occurs at the time of the expansion phase.
Unexpectedly, there is also a clear relationship between the DD component and Dst (Figure 14A). Since the DD component is related to the convection of plasma in the magnetosphere, this relationship suggests that the convection may also be partly responsible for advancing the ring current toward the earth during the main phase (Advance of the Ring Current Toward the Earth During Geomagnetic Storms).
Thus, the DD (Figure 11A) electric fields are responsible for the formation of the ring current.
Advance of the Ring Current Toward the Earth During Geomagnetic Storms
In understanding the relationship between the ring current and substorms, it is important to know that the ring current belt advances toward the earth during an early epoch of the main phase and retreats during a later epoch (Frank, 1971); Figure 15A. This and other observations (see Substorms During a Prolonged High Power for example) suggest that the location of the ring current changes from 10 Re for weakest substorms (AE-100 nT) to 4 Re for the most intense substorms (AE- 2000 nT); Akasofu (2017).
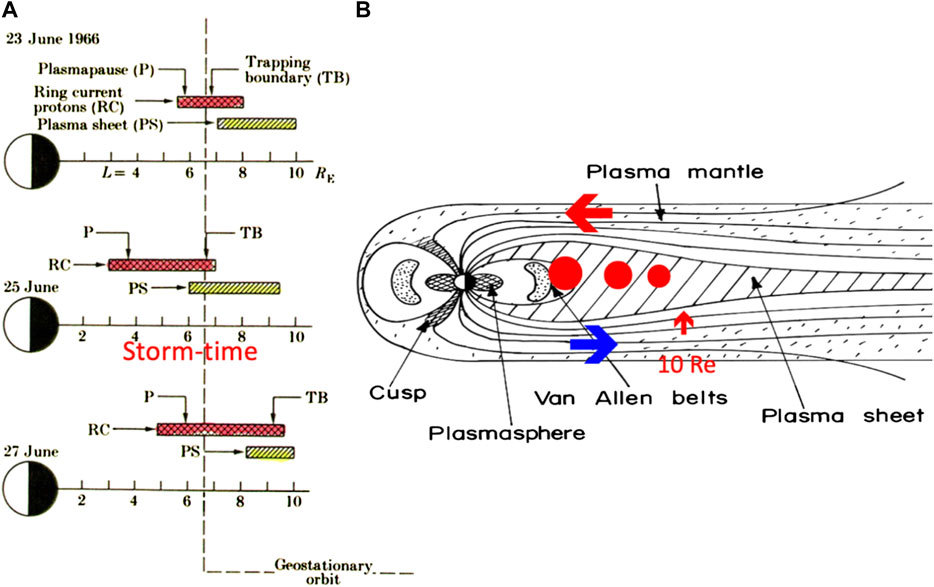
FIGURE 15. (A) The advance and recede of the ring current belt during a geomagnetic storm (Frank, 1971). (B) Schematic illustration of the advance (red arrow) and retreat (blue arrow) of the ring current belt during geomagnetic storms.
Substorms During a Prolonged High Power
It is interesting to know about auroral activities when the dynamo power of the solar wind-magnetosphere interaction is continuously very high for more than 10 h (Akasofu, 2017). It is found that substorms occur intermittently, rather than continuous auroral activities. Such geomagnetic storms are called “see-saw” storms; Figure 16A. It seems that in such cases, the accumulation of power could exceed the dissipation rate, so that the tippy bucket repeats the unloading. On the other hand, when a high power is slowly decreasing, the intensity of intermittent substorms decreases (Figure 16B), perhaps indicating that the location of the energy accumulation is receding from the earth when the ring current is also receding as Figure 15 shows.
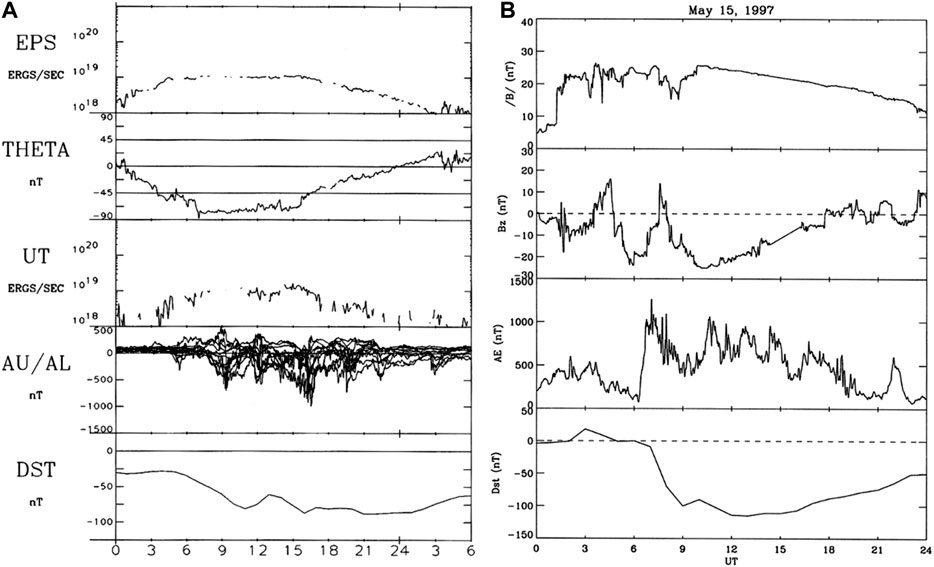
FIGURE 16. Geomagnetic storms and substorms when the power of the dynamo is continuously high. (A) A high power was kept continuously for more than 10 hours. (B) High power is a smoothly decreasing case.
The studies shown Advance of the Ring Current Toward the Earth During Geomagnetic Storms and Substorms During a Prolonged High Power suggest that a study of geomagnetic storms advances in understanding auroral substorms.
The Recovery Phase
During the earliest days of a study of geomagnetic storms, it was found also that the decay of the main phase tends to be fast at the beginning of the recovery phase, but slows down toward the end, and that it cannot be explained by a single exponential function. Akasofu et al. (1963) suggested that the ring current consists of two parts, DR = DR1 + DR2; Figure 17. Now, as we see in the next section. it is known that both oxygen ions and protons contribute to the main phase, so that it is expected that this problem could be solved by assuming an appropriate distribution of the terrestrial hydrogen and the lifetime of protons and oxygen ions.
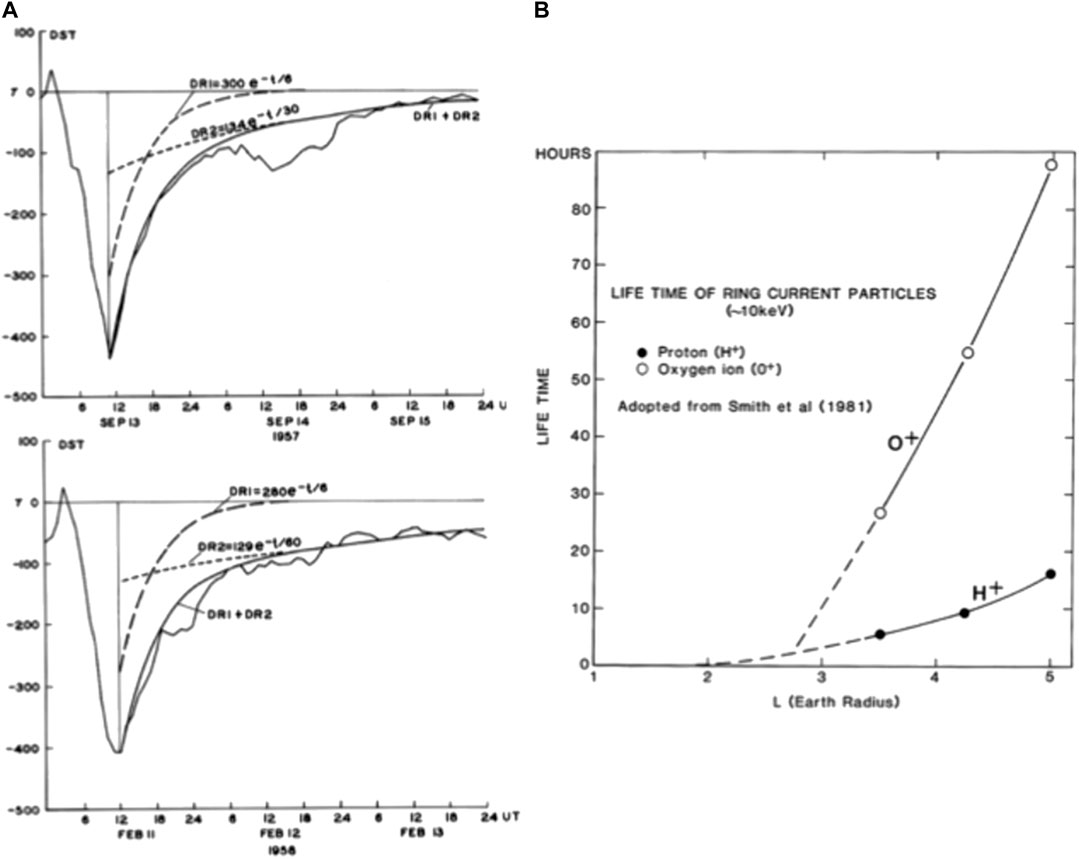
FIGURE 17. (A) It was proposed that the ring current consists of two belts, DR1 and DR2 with two different decay rates; Akasofu et al. (1963). (B) An attempt to explain the recovery phase by considering protons and oxygen ions, assuming the life time of protons and oxygen ions. storm.
Discovery of Oxygen Atoms in the Ring Current
The discovery of ionospheric oxygen ions in the ring current was one of the greatest discoveries in the studies of geomagnetic storms (Shelley and Johnson, 1972; Daglis, 1997). These oxygen ions are injected from the ionosphere to the magnetotail and are injected back to the ring current belt. It was recognized then that ionospheric particles are more responsible than solar wind protons during an intense main phase. The formation of the ring current belt by oxygen ions was confirmed later by imaging the ring current belt by observing the charge exchange process of oxygen ions and neutral hydrogen atoms (cf. Fok, 2003); Figure 18.
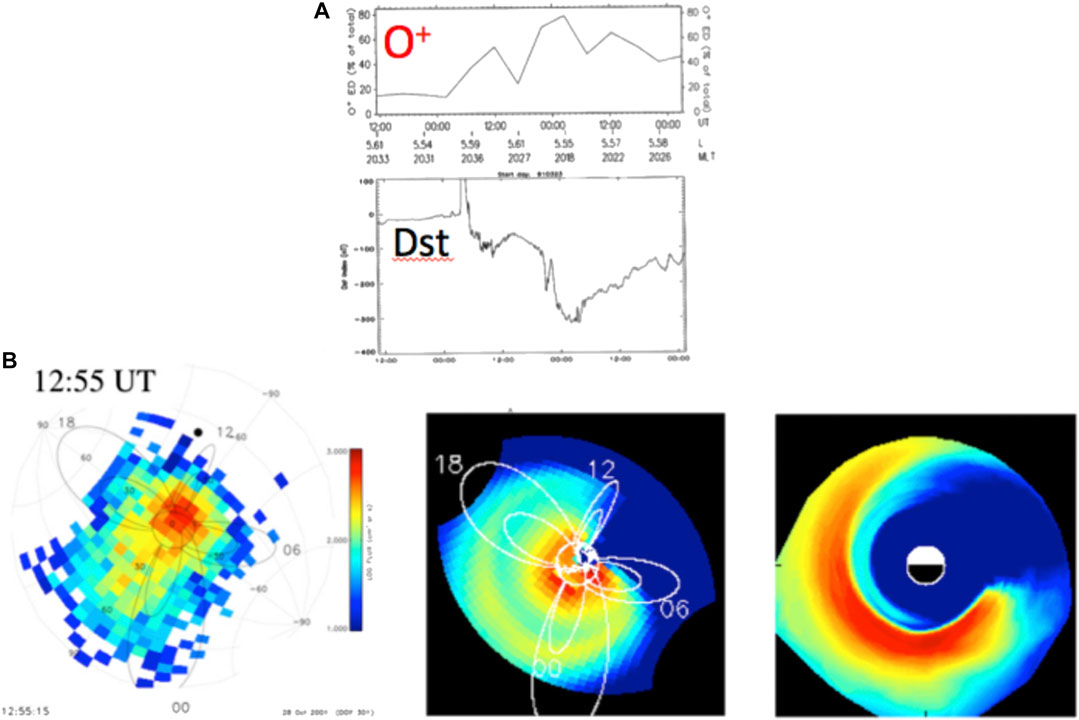
FIGURE 18. (A) The relationship between the intensity of oxygen ions and the Dst index (Daglis, 1997). (B) Imaging the ring current and a simulation study. From the left, an actual image, its relation to the earth’s dipole field and a simulation study of the movement of oxygen ions (Fok, 2003).
This discovery made the fundamental change of the concept of the main phase and the ring current. It was a revolution on the concept of geomagnetic storms. Terrestrial particles, more than solar wind protons, contribute to intense geomagnetic storms. Until 1972, it had long been thought that solar wind protons were solely responsible for the ring current. However, this finding indicated that terrestrial oxygen ions from the ionosphere are more responsible for intense ring currents; ionized oxygen atoms are accelerated to high energies (more than 100 KeV).
One Caution
One caution here: In studying the relationship between substorms and the main phase, it is expected that both the AE and Dst indices will extensively be used. However, it was found that there is a serious defect in the AE index for this very purpose.
In studying the geomagnetic storm of September 29, 1978, it was found that the AE index decreased temporarily during the middle of the main phase (Figure 19). Examining records from other stations, it was found that the auroral electrojet moved equatorward with the expanding auroral oval, namely below the latitude of the AE stations (as the auroral oval expanded), so that the AE index could not monitor the electrojet during major storms (major main phase or intense ring current). The lesson here is that the AE, Dst or other indices are just indices, not physical quantities (although they use nT as the unit). Thus, we must be cautious in using them or examine the location of the auroral electrojet during geomagnetic storms.
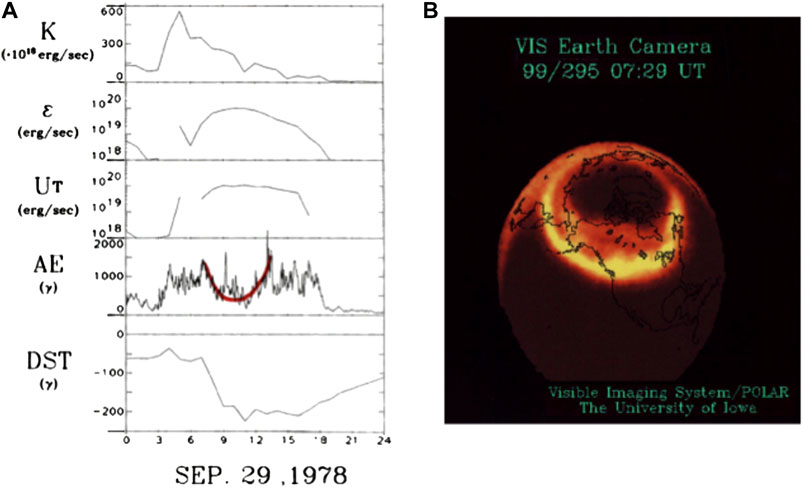
FIGURE 19. (A) It shows from the top, the kinetic energy flux of the solar wind, the power, the total energy dissipation (Ut) and the AE and Dst induces. Note that during the middle of the main phase, the AE index decreased. (B) An example of the expanded auroral oval during intense geomagnetic storms; note that (A) and (B) are not the same event.
Conclusion
There are several recent papers which are related the present subject; Fox et al., 1999; Ganushkina et al., 2005; Liu and Rostoker, 1995; Sandhu et al., 2018).
It is emphasized that a study of both auroral/magnetospheric substorms and geomagnetic storms together will enhance understanding both, since they are so closely related. In fact, an auroral/magnetospheric substorm can be considered as a mini-geomagnetic storm. (Chapman, 1935; Chapman and Bartels, 1940; Akasofu et al., 1965; Frank, 1970; Fok et al., 2006).
Author Contributions
The author confirms being the sole contributor of this work and has approved it for publication.
Conflict of Interest
The author declares that the research was conducted in the absence of any commercial or financial relationships that could be construed as a potential conflict of interest.
Acknowledgments
We owe many pioneers, senior researchers and colleagues in bringing space physics this far. I myself owe many colleagues in arriving at this far. I would like to thank specially A. T. Y. Lui who has worked closely with me from the earliest days in space physics and who invited me to joint this special issue.
References
Akasofu, S.-I. (1964). The development of the auroral substorm. Planet. Space Sci. 12, 273–282. doi:10.1016/0032-0633(64)90151-5
Akasofu, S.-I. (2017). Auroral substorms: search for processe, causing the expansion phase in terms of the electric current approach. Space Sci. Rev. 212, 341–381. doi:10.1007/s11214-017-0363-7
Akasofu, S.-I., and Chapman, S. (1963a). The development of the main phase of magnetic storms. J. Geophys. Res. 68, 125–129. doi:10.1029/jz068i001p00125
Akasofu, S.- I., and Chapman, S. (1963b). Magnetic storms: the simultaneous development of the main phase (DR) and polar magnetic substorms (DP). J. Geophys. Res. 68, 3155–3158. doi:10.1029/jz068i010p03155
Akasofu, S.–I., and Chapman, S. (1963c). The lower limit of latitude (U.S. sector) of northern quiet auroral arcs and its relation to Dst (H). J. Atmospheric.Terr. Phys. 25, 9–10. doi:10.1016/0021-9169(63)90011-4
Akasofu, S.-I., and Chapman, S. (1964). On the asymmetric development of magnetic storm fields in low and middle latitudes. Planet. Space Sci. 12, 607–626. doi:10.1016/0032-0633(64)90008-x
Akasofu, S.–I., Cain, J. C., and Chapman, S. (1961). The magnetic field of a model radiation belt, numerically computed. J. Geophys. Res. 66, 4013–4026. doi:10.1029/jz066i012p04013
Akasofu, S.–I., Chapman, S., and Venkatesan, D. (1963). The Main phase of great magnetic storms. J. Geophys. Res. 68, 3345–3350. doi:10.1029/jz068i011p03345
Akasofu, S.-I., Chapman, S., and Meng, C.-I. (1965). The polar electrojet. J. Atmos. Terr. Phys. 27, 1301–1305. doi:10.1016/0021-9169(65)90087-5
Axford, W. I., and Hines, C. O. (1961). A unifining theory of high-latitude geophysical phenomena and geomagnetic storms. Can. J. Phys. 39, 1433–1464. doi:10.1139/p61-172
Bostrom, R. (1964). A model of the auroral electrojet. J. Geophys. Res. 69, 4983–4999. doi:10.1029/jz069i023p04983
Bristow, W. A., and Jensen, P. (2007). A superposed epoch study of superDarn convection observations during substorms. J. Geophys. Res. 69, 112. doi:10. 1029/2006JA012049
Chapman, S. (1935). The electric current-system of geomagnetic storms. Terr. Magn. 40, 340–379. doi:10.1029/te040i004p00349
Craven, J. D., Kamide, Y., Frank, L. A., Akasofu, S.-I., and Sugiura, M. (1884). “Distribution of aurora and ionospheric currents observed simultaneously on a global scale,” in Magnetospheric currents, AGU monograph (Washingon, DC: AGU), Vol. 28, 137–146.
De Michelis, P., Consolini, G., Materassi, M., and Tozzi, R. (2011). An information theory approach tot he storm-substorm relationship. J. Geophys. Res. 116, A08225. doi:10.1029/2011ja016535
Deforest, S. E., and McIlwain, C. E. (1971). Plasma clouds in the magnetosphere. J. Geophys. Res. 76, 3587–3611. doi:10.1029/ja076i016p03587
Dungey, J. W. (1961). Interplanetary magnetic field and the auroral zones. Phys. Rev. Lett. 6 (20), 47–48. doi:10.1103/physrevlett.6.47
Dungey, J. W. (1966). “Solar-wind interaction with the magnetosphere.Particle aspects,” in The Solar wind. Editors R. J. Mackin, and M. Neugebauer (Pasadena, CA: Jet Propulsion Laboratory), 243–255.
Fairfield, D. H., and Cahill, L. J. (1966). Transition region magnetic field and polar magnetic disturbances. J. Geophys. Res. 71 (1), 155–169. doi:10.1029/jz071i001p00155
Fok, M.-C., Moore, T. E., and Delcourt, D. C. (1999). Modeling of inner plasma sheet and ring current during substorms. J. Geophys. Res. 104, 14557. doi:10.1029/1999ja900014
Fok, M.-C., Moore, T. E., Brandt, P. C., Delcourt, D. C., Slinker, S. P., and Fedder, J. A. (2006). Impulsive enhancement of oxygen ions during substorms. J. Geophys. Res. 111, A10222. doi:10.1029/2006ja011839
Frank, L. A. (1970). Direct observation of asymmetric increase of exstraterresstrial “ring current” proton intensities in the outer radiation zone. J. Geophys. Res. 75, 1263–1268. doi:10.1029/ja075i007p01263
Frank, L. A. (1971). Relationship of the plasma sheet, the ring current, trapping boundary, and plasmapause near the magnetic equator and local midnight. J. Geophys. Res. 76, 2265–2275. doi:10.1029/ja076i010p02265
Ganushkina, N. Y., Pulkkinen, T. I., and Fritz, T. (2005). Role of substorm-associated impulsive electric fields in the ring current development during storms. Ann. Geophys. 23, 579. doi:10.5194/angeo-23-579-2005
Liu, W. W., and Rostoker, G. (1995). Energetic ring current particles generated by recurring substorm cycles. J. Geophys. Res. 100, 21897. doi:10.1029/95ja01934
Runge, J., Balasis, G., Daglis, I. A., Papadimitriou, C., and Donner, R. (2018). Common solar wind drivers behind magnetic storm-magnetospheric substorm dependency. Sci. Rep. 8, 16987. doi:10.1038/s41598-018-35250-5
Shelley, E. G., and Johnson, R. G. (1972). Satellite observations of energetic heavy ions during geomagnetic storm. J. Geophys. Res. 77, 6104–6110. doi:10.1029/ja077i031p06104
Sun, W., and Akasofu, S.-I. (2000). On the formation of the storm-time ring current belt. J. Geophys. Res. 105, 5411–5418. doi:10.1029/1999ja000339
Keywords: auroral substorm, paradigm, geomagnetic, storms, reconnection
Citation: Akasofu S-I (2020) Relationship Between Geomagnetic Storms and Auroral/Magnetospheric Substorms: Early Studies. Front. Astron. Space Sci. 7:604755. doi: 10.3389/fspas.2020.604755
Received: 10 September 2020; Accepted: 16 November 2020;
Published: 09 December 2020.
Edited by:
George Livadiotis, Southwest Research Institute (SwRI), United StatesReviewed by:
Joseph Eric Borovsky, Space Science Institute, United StatesGiuseppe Consolini, Institute for Space Astrophysics and Planetology (INAF), Italy
Copyright © 2020 Akasofu. This is an open-access article distributed under the terms of the Creative Commons Attribution License (CC BY). The use, distribution or reproduction in other forums is permitted, provided the original author(s) and the copyright owner(s) are credited and that the original publication in this journal is cited, in accordance with accepted academic practice. No use, distribution or reproduction is permitted which does not comply with these terms.
*Correspondence: Syun-Ichi Akasofu, c2FrYXNvZnVAYWxhc2thLmVkdQ==
 Syun-Ichi Akasofu