 Bernardo M. O. Fraga
 Ulisses Barres de Almeida1
 Sargis Gasparyan
- 1COHEP - Centro Brasileiro de Pesquisas Físicas, Rio de Janeiro, Brazil
- 2ICRANet-Armenia, Yerevan, Armenia
- 3Agenzia Spaziale Italiana, Rome, Italy
The most detailed temporal studies of the emission from blazars are usually done by trying to obtain a dense, simultaneous coverage of the source over a large multi-wavelength observational campaign. Although it is well know that correlations between multi-band emission present sizeable temporal lags in their correlated variability, such properties are usually neglected in the majority of observational studies, which model the evolution of source parameters over time by either building time-averaged SEDs (when data is scarce) or considering strictly simultaneous snapshots of the source along the spectrum. By making use of the resources and large database made available through the ASI Science Data Center (ASDC), we present a novel approach to the modeling of blazar emission whereby the multi-epoch SEDs for Mkn 421 are modeled considering the temporal lags between bands (both in short and long-timescales), as obtained by a detailed cross-correlation analysis, spanning data from radio to Very High Energy (VHE) gamma-rays from 2008 to 2014. In addition to that, long-term optical polarization data are used to aid and complement our physical interpretation of the state and evolution of the source.
1. Introduction
Blazars are a class of Active Galactic Nuclei where the jet is pointed at a very small angle relative to the line of sight (see e.g., Urry and Padovani, 1995). Their emission is non-thermal across most of (or the entire) electromagnetic spectrum, from radio to γ-rays, sometimes reaching into the TeV domain. Furthermore, since the jet is pointing at a small angle with respect to the line of sight, the emission of blazars is affected by relativistic beaming, which could increase the observed luminosity by a large factor.
The Spectral Energy Distribution (SED) of these objects shows two bumps, one located in the infrared to the soft X-ray band, the other in the hard X-rays to γ-rays. According to the standard picture (see e.g., Abdo et al., 2010; Giommi et al., 2012), the first peak is due to the synchrotron emission of relativistic electrons moving in a magnetic field, while the second peak is due to the inverse-Compton (IC) scattering of the synchrotron photons by the same relativistic electron population that produced them (the Synchrotron self-Compton model, SSC). In some cases the seed photons undergoing IC scattering come from regions outside the nucleus, like the accretion disk or the broad line region (EC, external Compton).
Since blazars emit all over the spectrum, the most efficient way to study their emission is through multiwavelength data; furthermore, since blazars often present short- and long-scale variability, simultaneous observations are desired. In order to attain these goals, multifrequency observation campaigns have been done for some blazars usually following a very bright flaring period, for example 3C454.3 (Vercellone et al., 2009), PKS2155-304 (Aharonian et al., 2009), and Mkn421 (Donnarumma et al., 2009).
Mkn 421 was the first extragalactic TeV object detected (Punch et al., 1992) and remains one of the brightest and most studied γ-ray blazars to date. It has been intensely monitored by several instruments in different frequencies and for a long period; thus, the amount of data available is quite large and with overlapping periods on several wavelengths. This makes Mkn421 a good source for a comprehensive study of the multi-band correlations and consequently the time evolution of the emission.
2. Data
We obtained long term multiwavelength light curves for Mkn421 for a period of 6 years, from 2008 to 2014. The only continuous observations were done by the OVRO observatory (at 15 GHz), the Steward observatory (Smith et al., 2009) (V band) and the Fermi satellite. X-ray and UV data are also available from Swift but with long gaps (of approximately 6 months) due to the source proximity to the sun.
We obtained the radio light curve from the ASDC SED tool1, while the optical data was taken directly from the observatory and checked for galaxy contamination. The Fermi light curve for the period was calculated using an adaptive binning method, where the size of the bins is flexible and chosen to produce constant flux uncertainties, so that they are narrower at higher states (Sahakyan and Gasparyan, 2017). In this way rapid changes of flux can be found. In Figure 1 we show the three long term light curves; it is interesting to note that both in the γ-ray and the radio light curve the source appears to undergo a change of state sometime before MJD 56000 (beginning of 2012). While before there were only small flares, after 2012 it underwent a series of intense ones and the continuum emission increased. Due to this change of behavior, we consider both periods separately (before and after 2012) in calculating the cross-correlation functions.
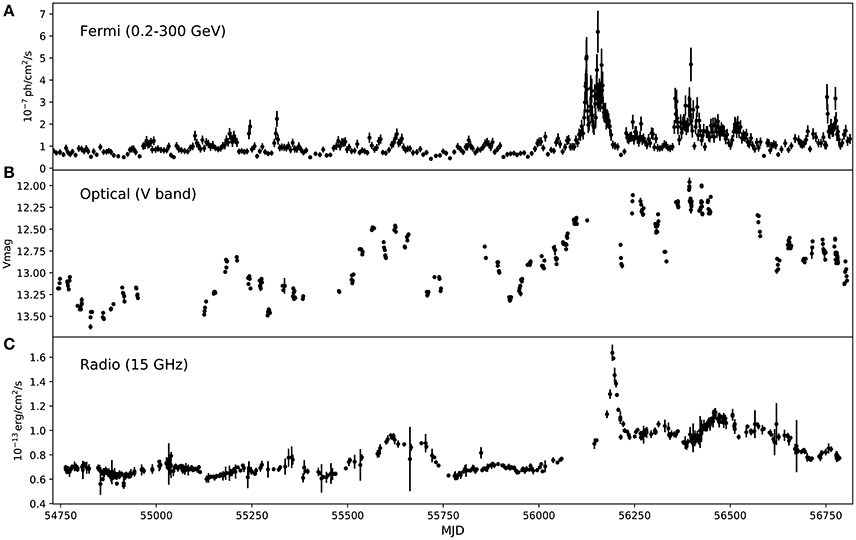
Figure 1. γ-rays, (A), optical (B), and radio (C) light curves for Mkn421 from 2008 to 2014.
3. Time Lags
Since AGN light curves are very often unevenly sampled, we used the Z-transformed discrete correlation function (ZDCF, Alexander, 1997) to calculate the cross-correlation functions. Simulations show that the use of Fischer's Z transform improve the performance in sparse light curves over the traditionally used discrete correlation function (DCF, Edelson and Krolik, 1988).
We calculated the cross-correlation functions between all three lightcurves shown in Figure 1, before and after 2012. By using a maximum likelihood analysis (Alexander, 2013), we could find the maximum of the correlation function and the fiducial interval. For the period from 2008 to 2012, the only indication of a correlation is between optical and radio:
while for the period after 2012
where a negative lag means that the lower energy band comes after the higher energy one. All these lags are consistent with each other and the γ - optical lag is consistent with a zero day lag. In Figure 2 we show all the cross-correlation functions.
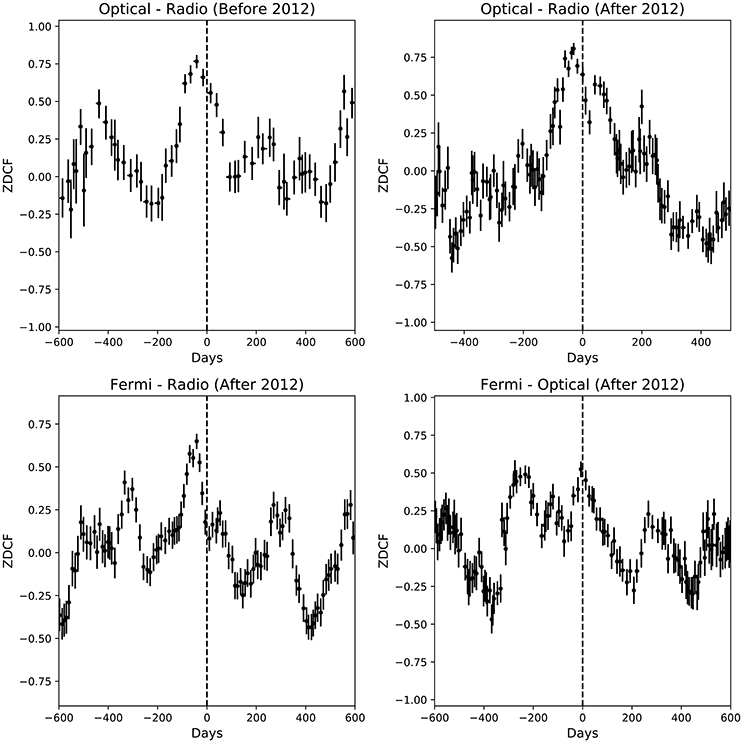
Figure 2. The significant correlation functions between all light curves. (Top left) Optical-Radio before 2012; (Top right) Optical-Radio after 2012; (Bottom left) Fermi-Radio after 2012; (Bottom right) Fermi-optical after 2012. A negative lag indicates that the lower energy band comes after.
With the exception of the Fermi–Optical correlation, all others present a clear and sharp maximum. The lag between Fermi and Radio is especially evident considering the very large flare present in both curves and their behavior afterwards. Given the absence of any other flares of this magnitude in the Radio light curve, it is unlikely that the two are unrelated; a more profound analysis is needed to confirm this.
4. SED Fitting
With the lags between different energy bands calculated, we proceeded to build the SEDs for each period. We shifted the Fermi and optical light curves by the values indicated above (considering a zero day lag between them). In addition to the data we had, we added also x-ray and UV data from Swift XRT and UVOT, respectively, taken from the ASDC website. The coverage from Swift is not continuous however; during the period our data covers, there are six windows of observation from Swift, which we divided in two each (for a total of 12) to constrain the variability and make the fitting procedure easier.
We used a single-zone SSC model with the distribution of the electrons given by a power law with an exponential cut-off:
where Ecut is the cutoff energy, N0 the normalization and me the electron mass
The fit was done numerically using a Markov Chain Monte Carlo (MCMC) code, deriving the best-fit and uncertainty distributions of the parameters through a sampling of their likelihood functions (Sahakyan and Gasparyan, 2017). In Figure 3 we can see the evolution of the parameters for each period compared to the Radio light curve (already shifted by the lags found in the previous section). It is interesting to notice that the strong increase of N0 and the magnetic field correlates with the presence of a small flare.
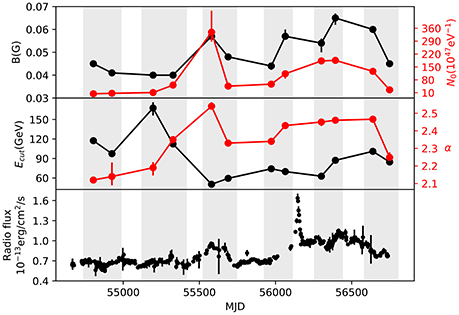
Figure 3. The evolution of the parameters of the SED, with the periods chosen in gray, with the radio lightcurve (shifted by the lags found in section 3) on the bottom for comparison.
5. Polarization Measurements
From 2008 to 2012, a large polarization campaign was undertaken using the Liverpool Telescope and data from the Tuorla blazar monitoring program (Jermak et al., 2016). We present the data for MKN421 in Figure 4, with data from the end of 2011 to the middle of 2012.
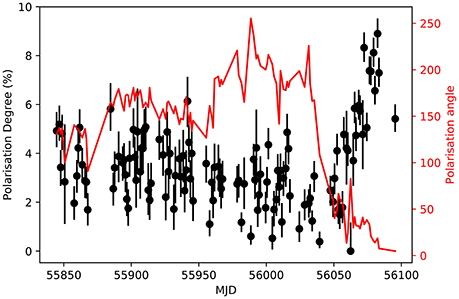
Figure 4. Polarization angle and degree. The rotation of the angle can be seen around MJD 56040, right before the rise in the degree.
It can be seen that in the beginning of 2012, the degree of polarization increases strongly (reaching an all-time maximum), while the polarization angle rotates by 180°; this change of behavior is just before the intense flare in γ-rays in 2012 (see Figure 1). Unfortunately, due to visibility, there isn't any optical data during the flare. However, this could be an indication that changes in the polarization are related to flaring activity.
6. Discussion
Mkn421 is one of the brightest and most observed blazars to date. We collected long term data for the source in several energies in order to study the time evolution of the emission. From the long term light curves, we detected a change of state in γ-rays in the beginning of 2012, from a more quiescent state to a series of intense flares and an overall increase in the continuum emission. This prompted us to consider both periods separately when calculating the multi-bands correlation.
We calculated the cross-correlation function for each period between the three different long term light curves: overall, the radio lags behind the higher energy bands, while optical and γ-rays are simultaneous. We performed a fit of the SED for each period, already considering the time lags calculated before, using a single-zone SSC model.
We also obtained optical polarimetric data from the end of 2011 to the beginning of 2012. Mkn421 shows an all-time maximum of the polarization degree, and a flip of the polarization angle of 180°; this comes just before the intense flare in γ-rays.
Since we have also X-ray and UV data (with a 6 month gap in the coverage) we can start to calculate the short scale time lags including both. Observation campaigns including VHE instruments such as VERITAS and MAGIC have also been carried out, and we will include these in our analysis. This will help us understand both the long and short term effects of the variability and disentangle the different emission zones. From this initial results, we obtained some hints of correlation on a long time period between radio, γ-rays and optical. As expected, radio lags behind both others in the two periods considered. Besides that, there is some evidence that big rotations in the polarization angle could be related with flares in high energies.
Author Contributions
BF made all the cross correlation and light curve analysis, and was the main writer of the work. UBdA obtained the polarization data and helped analyzing the results. PG helped with the gathering of the data through the SSDC web service and with the conclusions. NS gave performed the adaptive binning procedure to obtain the Fermi light curves and with the SED fitting. SG was also responsible for the SED fitting and results.
Funding
This research has made use of data from the OVRO 40-m monitoring program (Richards et al., 2011) which is supported in part by NASA grants NNX08AW31G, NNX11A043G, and NNX14AQ89G and NSF grants AST-0808050 and AST-1109911.
UBdA acknowledges the receipt of FAPERJ Jovem Cientista Fellowship 226465. This project was partly funded by CNPq Projeto Universal 426753/2016-0.
Conflict of Interest Statement
The authors declare that the research was conducted in the absence of any commercial or financial relationships that could be construed as a potential conflict of interest.
Acknowledgments
NS and SG acknowledges the support of the RA MES State Committee of Science, in the frames of the research project No 15T-1C375.
Footnotes
References
Abdo, A. A., Ackermann, M., Agudo, I., Ajello, M., Aller, H. D., Aller, M. F., et al. (2010). The spectral energy distribution of fermi bright blazars. Astrophys. J. 716, 30–70. doi: 10.1088/0004-637X/716/1/30
Aharonian, F., Akhperjanian, A. G., Anton, G., Barres de Almeida, U., Bazer-Bachi, A. R., Becherini, Y., et al. (2009). Simultaneous observations of PKS 2155-304 with HESS, Fermi, RXTE, and atom: spectral energy distributions and variability in a low state. Astrophys. J. Lett. 696, L150–L155. doi: 10.1088/0004-637X/696/2/L150
Alexander, T. (1997). Astronomical Time Series, volume 218 of Astrophysics and Space Science Library, eds D. Maoz, A. Sternberg, and E. M. Leibowitz (Dordrecht: Springer), 163.
Alexander, T. (2013). Improved AGN light curve analysis with the z-transformed discrete correlation function. arXiv:1302.1508.
Donnarumma, I., Vittorini, V., Vercellone, S., del Monte, E., Feroci, M., D'Ammando, F., et al. (2009). The june 2008 Flare of Markarian 421 from optical to TeV energies. Astrophys. J. Lett. 691, L13–L19. doi: 10.1088/0004-637X/691/1/L13
Edelson, R. A., and Krolik, J. H. (1988). The discrete correlation function - a new method for analyzing unevenly sampled variability data. Astrophys. J. 333, 646–659. doi: 10.1086/166773
Giommi, P., Padovani, P., Polenta, G., Turriziani, S., D'Elia, V., and Piranomonte, S. (2012). A simplified view of blazars: clearing the fog around long-standing selection effects. Month. Notices R. Astron. Soc. 420, 2899–2911. doi: 10.1111/j.1365-2966.2011.20044.x
Jermak, H., Steele, I. A., Lindfors, E., Hovatta, T., Nilsson, K., Lamb, G. P., et al. (2016). The RINGO2 and DIPOL optical polarization catalogue of blazars. Month. Notices R. Astron. Soc. 462, 4267–4299. doi: 10.1093/mnras/stw1770
Punch, M., Akerlof, C. W., Cawley, M. F., Chantell, M., Fegan, D. J., Fennell, S., et al. (1992). Detection of TeV photons from the active galaxy Markarian 421. Nature 358:477. doi: 10.1038/358477a0
Richards, J. L., Max-Moerbeck, W., Pavlidou, V., King, O. G., Pearson, T. J., Readhead, A. C. S., et al. (2011). Blazars in the Fermi era: the OVRO 40 m telescope monitoring program. Astrophys. J. Suppl. 194:29. doi: 10.1088/0067-0049/194/2/29
Sahakyan, N., and Gasparyan, S. (2017). High energy gamma-ray emission from PKS 1441+25. Month. Notices R. Astron. Soc. 470, 2861–2869. doi: 10.1093/mnras/stx1402
Smith, P. S., Montiel, E., Rightley, S., Turner, J., Schmidt, G. D., and Jannuzi, B. T. (2009). “Coordinated fermi/optical monitoring of blazars and the great 2009 september gamma-ray flare of 3C 454.3” in 2009 Fermi Symposium, eConf Proceedings C091122. arXiv:0912.3621
Urry, C. M., and Padovani, P. (1995). Unified schemes for radio-loud active galactic nuclei. Publ. Astron. Soc. Pacific 107:803. doi: 10.1086/133630
Keywords: blazars, MKN421, multiwavelength, time-evolution, SED modeling
Citation: Fraga BMO, Barres de Almeida U, Gasparyan S, Giommi P and Sahakyan N (2018) Time-Evolving SED of MKN421: A Multi-Band View and Polarimetric Signatures. Front. Astron. Space Sci. 5:1. doi: 10.3389/fspas.2018.00001
Received: 29 September 2017; Accepted: 08 January 2018;
Published: 24 January 2018.
Edited by:
Mauro D'Onofrio, Università degli Studi di Padova, ItalyReviewed by:
Giovanna Maria Stirpe, Osservatorio Astronomico di Bologna (INAF), ItalyDaniela Bettoni, Osservatorio Astronomico di Padova (INAF), Italy
Copyright © 2018 Fraga, Barres de Almeida, Gasparyan, Giommi and Sahakyan. This is an open-access article distributed under the terms of the Creative Commons Attribution License (CC BY). The use, distribution or reproduction in other forums is permitted, provided the original author(s) or licensor are credited and that the original publication in this journal is cited, in accordance with accepted academic practice. No use, distribution or reproduction is permitted which does not comply with these terms.
*Correspondence: Bernardo M. O. Fraga, bernardo@cbpf.br