 Timothy S. Frey1*
 Denis A. Shah2
 Laura E. Lindsey3
 Christine Sprunger4,5,6
 Horacio D. Lopez-Nicora7
 M. Soledad Benitez Ponce1
- 1Department of Plant Pathology, College of Food, Agricultural, and Environmental Sciences, The Ohio State University, Wooster, OH, United States
- 2Department of Plant Pathology, Kansas State University, Manhattan, KS, United States
- 3Department of Horticulture and Crop Science, College of Food, Agricultural, and Environmental Sciences, The Ohio State University, Columbus, OH, United States
- 4Department of Plant, Soil, and Microbial Sciences, Michigan State University, East Lansing, MI, United States
- 5W.K. Kellogg Biological Station, Michigan State University, Hickory Corners, MI, United States
- 6Plant Resilience Institute, Michigan State University, East Lansing, MI, United States
- 7Department of Plant Pathology, College of Food, Agricultural, and Environmental Sciences, The Ohio State University, Columbus, OH, United States
Crop rotations in the Midwest U.S. have become less diversified over the last twenty years while at the same time cover crop acreage has increased. The impact of these changes on soil health and soil microbial communities is not entirely understood. In rotational plots at two sites in Ohio, we investigated the impact of a corn-soy-wheat crop rotation and a rye cover crop on soil carbon, nitrogen, soil organic matter, and their relationships with soybean yield. Rhizosphere fungal, arbuscular mycorrhizal fungal, and bacterial communities were also assessed, as well as soil health and yield parameters. Microbial communities were measured using long and short-read amplicon sequencing on the PacBio and Illumina platforms. Small changes in soil health parameters were observed, including increased soil protein in the cover crop treatment at one of the sites. We also observed increasing yields in the diversified rotations and cover crops at one site. Soil bacterial and fungal communities showed differences driven by site, and AM fungi showed differences by rotation in one site-year combination. Network analysis revealed several fungal network modules correlated with increases in POXC and bacterial network modules correlated with soil protein and respiration. This research uniquely addresses the interactions between cover crops and diversified rotations and their impact on soil health in no-till production in Ohio.
Introduction
Cover crops are one of the most ancient crop management practices. They are mentioned in Chinese writing as far back as the 5th century BC (1). The Roman agricultural writer Columella advised 1st-century farmers that “Where no kind of manure is to be had, I think the cultivation of lupines will be found the readiest and best substitute. If they are sown about the middle of September in a poor soil and then plowed in, they will answer as well as the best manure.” (2). Cover crops are distinguished from cash crops and forage crops in that they are grown for benefits that do not include the sale (cash crop) or direct use (forage crop) of the crop (3). Historically, cover crops have been grown to address many agronomic needs, including reduction of soil erosion (4), prevention of nutrient leaching (5), nitrogen runoff control (6), increasing beneficial insects (7) and microorganisms (8), and assisting in integrated pest management (9). Cover crop adoption in the United States is still low, only on 4% of total cropland in 2022, but has increased from 6.1 million ha to 7.2 million ha from 2017 to 2022 (10, 11). In Ohio, adoption increased from 290,160 to 303,956 ha from 2017 to 2022, and the surrounding states (Indiana, Michigan, Pennsylvania, and Kentucky) recorded increases of 7 to 17% (10). Adoption rates vary but have increased in most cash crops, including soybean, which saw an increase in adoption from 4.9% in 2015 to 7% in 2018 (3).
In contrast to cover cropping, crop rotation is common throughout the United States, including Ohio. In Ohio, economic and policy considerations have driven growers towards a corn-soybean (CS) rotation (12–14). The CS rotation is replacing more diverse rotations, which might include wheat or hay (14, 15). Rotations with more crop diversity lead to positive improvements in soil health (16), greater soil carbon (17), increased microbial biomass and diversity (18), and improved soil water content (19). Our previous research contrasting a corn-soybean-wheat (CSW) rotation with a CS rotation in long-term plots indicated small but positive changes in total nitrogen, soil organic matter (SOM), total carbon (20), bacterial (21), and fungal communities (22).
In the fall of 2020, rye (Secale cereale) cover crop treatments were added to this long-term experiment to test if they could supplement the positive effects of a CSW rotation. Rye is one of the most frequently adopted cover crops in the eastern United States due to its superior cold tolerance and rapid growth in fall and winter after the typical cash crops (corn and soybean) have been planted (3, 10). This advantage of rye - fall planting and growth through the winter- allows flexibility, integrating well with Ohio’s most common cash crop rotation of corn and soybean. Additionally, rye is one of the more economical cover crops, with seed costs averaging US$40.20 per ha (3). Rye cover crops help reduce weed biomass (23), reduce nitrate loading and leaching from drainage (24), help with soil moisture retention (25), and improved soil organic carbon in long-term experiments (26). Previous research specifically focused on the benefits of rye cover crops in Ohio reported little consistent benefit to soil fertility in continuous corn or soybean (27). Hanrahan et al. (28) reported that cover crops, including rye, reduced nitrogen losses but did not affect phosphorous loss in different rotational schemes in Ohio. To increase soybean yield with rye adoption, early cover crop planting and late cover crop termination were found to be important (29). Mukherjee and Lal (30) showed the benefits of other cover crop species, including pea (Pisum sativum) and turnip (Brassica rapa), showing increased soybean yields in a no-till system.
In the current study, we investigated some important indicators of soil health, including soil protein, soil respiration, SOM, permanganate oxidizable carbon (POXC) and microbial communities, including fungal, arbuscular mycorrhizal (AM) fungal and bacterial communities. Soil protein can indicate available organic nitrogen (31) and nitrogen management (32). Soil respiration, which is an indicator of the outflux of carbon from soil (33), is responsive to climate (34) and management changes (35). SOM consists of plant and animal residues at various stages of decomposition (36). It is an important soil health indicator as a carbon and nitrogen source (37), and for mineral nutrient cycling (38), water retention (39), and soil structure (40). POXC is a soil chemical fraction that reacts to permanganate and may indicate plant-mediated soil processes (41); it is sensitive to recent management changes. Cultural practices such as crop rotation and cover crops influence soil microbial communities as deep as 60 cm (42). These communities are critical for soil health, including nutrient cycling (43), phosphorous leaching (44), SOM formation, transformation, and decomposition (45), decreasing pathogen pressure (46), and contributing to other soil properties (47). Microbial community changes observed with cover cropping included shifts toward symbiotrophs and a decrease in saprotrophs (48), increases in the fungi:bacteria ratio, AM fungal colonization, and spore density (49).
More data is needed to help researchers and farmers interpret the relationship between microbial community changes, other soil health indicators, and soil functioning (50, 51). Microbial communities are important as a potential predictor of soil health because they respond quickly to changes to the soil brought about by human interventions (52, 53) and microbial analysis is becoming cheaper and more accessible (50). This study contributes by analyzing the relationships between microbial communities and soil health indicators with rotations and cover crops and their impact on yield.
In the current study, we investigated the impact of adding rye to CS and CSW rotations-including the impact of a first year rye cover crop implementation - on soil health, soil microbial communities, and soybean productivity. We hypothesized that (Supplementary Figure S1): 1. A rye cover crop will not have an impact on soybean yield in CS or CSW rotation (29, 54). 2. The addition of a rye cover crop will improve soil health characteristics, including carbon, as measured from soil respiration and POXC (55, 56), nitrogen in the form of soil protein (57), and SOM (58), regardless of the rotation. 3. Adding a rye cover crop will shift microbial communities in a CSW rotation (59). 4. Changes in microbial communities will be associated with changes in soil health metrics (42, 60). Understanding how cover crops influence a variety of soil health indicators could inform future management decisions of Ohio growers, especially regarding rotation length and cover crop adoption.
Materials and methods
Rotation and cover crop plots
Rotation plots were established at two sites in Ohio in 2013. The first was in northwestern Ohio at the Northwest Agricultural Research Station (NWARS) in Custar, OH (41°21’30.07” N, 83°76’36.55” W); the second was in western Ohio at the Western Agricultural Research Station (WARS) in South Charleston, OH (39°86’04.82” N, 83°67’72.81” W) (Supplementary Figure S2). The treatments were a rotation of corn and soybean (CS) and a rotation of corn, soybean, and winter wheat (CSW) (20). Plots were arranged in a randomized complete block design with four replicates per treatment, with every crop in the rotation represented in at least one plot each year. Plots were managed using no-till practices. The rye cover crop treatment was implemented in the fall of 2020 as a split-plot design. Within each rotation plot, one of the subplots was managed with a rye (r) cover crop between corn harvest and soybean planting (CrSW and CrS), and the other subplot left fallow as with the previously established rotations (CSW and CS, Supplementary Figures S3, S4). Farm managers selected commercially available high-yielding soybean cultivars, which varied by year (Supplementary Table S1). Depending on weather and soil conditions, soybeans and corn were planted between April and June and harvested in October or November. Farm managers collected yield and crop moisture data at the end of the growing season and applied herbicides and fertilization as needed, following commercial production practices throughout all trials (61). Herbicides were used to terminate cover crops as well as prior to planting. Fungicides and insecticides were applied as seed treatment to soybean, but no foliar fungicide was applied during the experiment. Corn and soybean cultivars, planting dates, and herbicide applications are summarized in Supplementary Table S1.
Soil sampling
Rhizosphere samples were collected at NWARS and WARS in 2021 and 2022 from soybean seedlings following the first rye cycle in each plot. In each subplot, eight samples were collected when the soybean was between V1 and V3 growth stages (62). Plants were dug up to a depth of 10-15 cm using a small shovel, with minimal disturbance to the roots. The shovels were cleaned with 70% ethanol and wiped with a towel until thoroughly cleaned between each subplot. Bulk soil was gently separated from the roots. The remaining rhizosphere soil was collected and homogenized using soil sieves (size 0.2 cm) to form one composite sample per subplot. These samples were placed in Ziploc plastic bags and transported on ice to the laboratory. The soil was placed in a -20°C freezer in the laboratory until freeze-drying. Samples for microbial community analysis were lyophilized for 24 hours or until completely dry. Lyophilized samples were stored at -80°C until DNA extraction.
Environmental conditions
Air temperature, soil temperature, precipitation, and soil properties were acquired from the Ohio State University CFAES weather station data. Stations are located at the same sites as the plots; the data is publicly accessible at https://weather.cfaes.osu.edu/. Specifically, cover crop growing season temperature included the dates between the sowing and the termination of the cover crop. The average temperature during the soybean growing season was taken for the days between sowing and harvest. Total precipitation, average relative humidity, and growing degree days were estimated for the entire soybean growing season. Soil temperature was measured at 5 cm and 10 cm depths and averaged over the growing season. Sand, silt, and clay percentages were collected at the 10 cm depth from the same sites and reported in an earlier dataset (63).
Soil health measurements
The following measurements were taken from soil samples to assess soil health: permanganate oxidizable carbon (POXC), soil protein, SOM, and soil respiration. These analyses were conducted in the Sprunger Lab, Benitez Ponce Lab, or the Service Testing and Research (STAR) Lab at The Ohio State University. Before analysis, soil samples from each sub-plot were homogenized, air-dried, and ground to pass through a 2 mm sieve. The POXC fraction was determined using methods described by Culman (64). Briefly, 2.5g of each sample was reacted with 2 ml of KMnO4 and 18 ml of H2O for two min and then allowed to settle for 10 min. Afterward, 0.5 ml of the supernatant of this solution was diluted in 49.5 ml of H2O and read on a spectrophotometer at 550 nm. The mass of POXC was calculated by comparing it to a standard curve using the equation in Culman (64). Soil protein was calculated using the protocol for autoclaved-citrate extractable soil after Hurisso et al. (31). Eight ml of 0.02M sodium citrate (pH 7.0) was added to each tube containing 1 g of soil and mixed well. The tubes were then autoclaved for 30 min. After autoclaving, tubes were cooled and centrifuged for 15 minutes at 3100 g. Protein measurements were then taken using a Bradford assay (Pierce Bradford Protein Assay Kit, ThermoFisher, Waltham, MA) and read on a spectrophotometer at 590nm. Protein concentration was calculated by comparing it to a standard curve. Percent SOM was calculated using the loss on ignition method (65). Each sample was dried at 105 °C. The samples were weighed, heated to 360 °C for two hours, and then weighed again after the temperature dropped below 150 °C. SOM was estimated from the weight loss-on-ignition using regression analysis. Soil respiration was calculated from air-dried soil using the Cornell method described in Moebius-Clune et al. (66). Briefly, 20 g of air-dried, sieved soil was placed into a mason jar with a trap assembly, and the beaker was filled with the trapping solution (9 ml of 0.5M KOH). Then, 7 ml of ddH2O was pipetted into the jar and wicked into the soil. The jar was incubated for four days, at the end of which the conductivity of the trap solution was measured. We used data collected by Huo et al. (20) and Frey et al. (22) to look at yield and soil health dynamics over the rotation treatment and after the incorporation of the cover crop treatment.
DNA extraction
DNA was extracted from homogenized rhizosphere soil samples taken from each subplot. DNA was extracted using a TaKaRa 159 NucleoSpin®96 Soil kit (#740787), following the manufacturer’s instructions. Two-hundred and fifty mg of the homogenized and lyophilized soil sample from each subplot was loaded into each of the provided bead tubes and agitated using an MP Biomedicals FastPrep-24 5G sample preparation system. For the extraction, both optional buffers, SL1 and Enhancer SX, were used to increase efficiency. A DNA extraction with a buffer and no soil was included as a negative control for the extraction kit. Before library preparation, DNA concentration was assessed by gel electrophoresis, with band intensities compared using the average of two ThermoScientific GeneRuler 1Kb ladders using ImageJ (67). This was compared to nanodrop measurement. After extraction, DNA was stored at -20 °C until amplicon sequencing library preparation.
Amplicon library preparation and sequencing
DNA libraries for fungal community analysis through amplicon sequencing were prepared using a 2-step PCR process. First, sequences for the target gene of interest were amplified. This was done using two different primer sets ITS1F (5’ CTT-GGT-CAT-TTA-GAG-GAA-GTAA-3’, 68) and ITS4 (5’-TCC-TCC-GCT-TAT-TGA-TAT-GC-3’, 69) for general fungi and AML1 (5′-ATC AAC TTT CGA TGG TAG GAT AGA-3′) and AML2 (5′-GAA CCC AAA CAC TTT GGT TTC C-3′) for AM fungi (70) tailed with universal sequences (5’ blocked, F -/5AmMC6/GCA-GTC-GAA-CAT-GTA-GCT-GAC-TCA-GGT-CAC-primer-3’, R–5’/5AmMC6/TGG-ATC-ACT-TGT-GCA-AGC-ATC-ACA-TCG-TAG-primer-3’) necessary for the addition of the barcode primers in the next step. PCR conditions recommended by PacBio were followed with annealing temperatures at 61 °C for ITS1F/4 and AML1/2 (71). The product from these reactions was then used to attach PACBIO barcode primers (PacBio Barcoded Universal F/R Primers Plate-96v2) using a PCR with conditions as recommended by the manufacturer with 20 cycles and 64 °C annealing temperature. KAPA HiFi HotStart polymerase (Roche, Basel, Switzerland) and filtered pipette tips were used for all reactions. Samples were then pooled into two pools per year (96 samples in each pool) using the best practices for equimolar pooling as recommended by PacBio. Libraries were then concentrated and cleaned using an AMPure (Beckman Coulter, Brea, CA, USA) magnetic bead cleanup. Cleaned fungi and AM fungi libraries were then submitted to the University of Louisville for PacBio sequencing (PacBio, Menlo Park, CA, U.S.A). The remaining library preparation, including the attachment of SMRTbell adaptors, was carried out at the University of Louisville Sequencing Technology Center. Bacterial communities were sequenced at the Molecular Cellular Imaging Center (MCIC) at Ohio State University (College of Food, Agriculture and Environmental Sciences, Wooster Campus). The initial amplification was done using the 515F (5’-GTG CCA GCM GCC GCG GTA A-3’, 72) and 806R (5’-GGA CTA CHV GGG TWT CTA AT-3’, 73) primers which target the V3-V4 region of the 16s rDNA. A second double-indexing PCR was then conducted. Samples were then pooled into a single sequencing library in equimolar concentrations. Bacteria DNA was sequenced using an Illumina MiSeq (Illumina, San Diego, CA. U.S.A.) and a 2x300 kit at the MCIC. The Commercial ZymoBIOMICS Microbial Community DNA (D6300; Zymo Research Irvine, CA) and the Mycobiome Genomic DNA Mix (ATCC MSA-1010tm) were included as positive controls. A water sample was included as a DNA extraction control for bacterial and fungal libraries. Fastq sequences are available at the NCBI SRA, Bioproject PRJNA1190478.
Bioinformatics
Primers and adapters were removed from demultiplexed fastq files using cutadapt (74) in the Unix shell environment at the Ohio Supercomputing Center (OSC, The Ohio State University, Columbus, OH, U.S.A). The dada2 package (Ver. 1.26, 75) in R (76) was used for error rate calculation, primer trimming, chimera detection and removal, Amplicon Sequencing Variant (ASV) calling, and taxonomic assignment. R packages are available via Bioconductor (www.bioconductor.org) or the Comprehensive R Archive Network (CRAN, cran.r-project.org), unless otherwise noted. Decontam (Ver. 1.12, 77), was used for contamination removal. The UNITE database (Ver. 29.11.2022) was used for taxonomic assignment in fungi (78), and the Maarjam database was used for taxonomic assignment of AM fungi (79). Illumina bacterial reads were processed using the nf-core/ampliseq pipeline version 2.5.0 (80, 81), using the default settings. This pipeline runs adapter removal, primer trimming, read quality filtering, pair-end merging, dereplication, and chimera removal. ASV inference and taxonomic assignments were conducted using dada2 (75) within nf-core/ampliseq, and the SILVA database (Ver. 138.1) was used for taxonomic assignment (82). Singletons were removed from all datasets.
Soil health analysis
Differences in soil health measurements were analyzed by site-year using the split-plot ANOVA function ‘sp. plot’ in the agricolae package (Ver. 1.3-7, 83). Multi-year trends in yield, SOM, and POXC, starting from 2018, were evaluated for changes after the addition of the cover crop treatments (Figure 1).
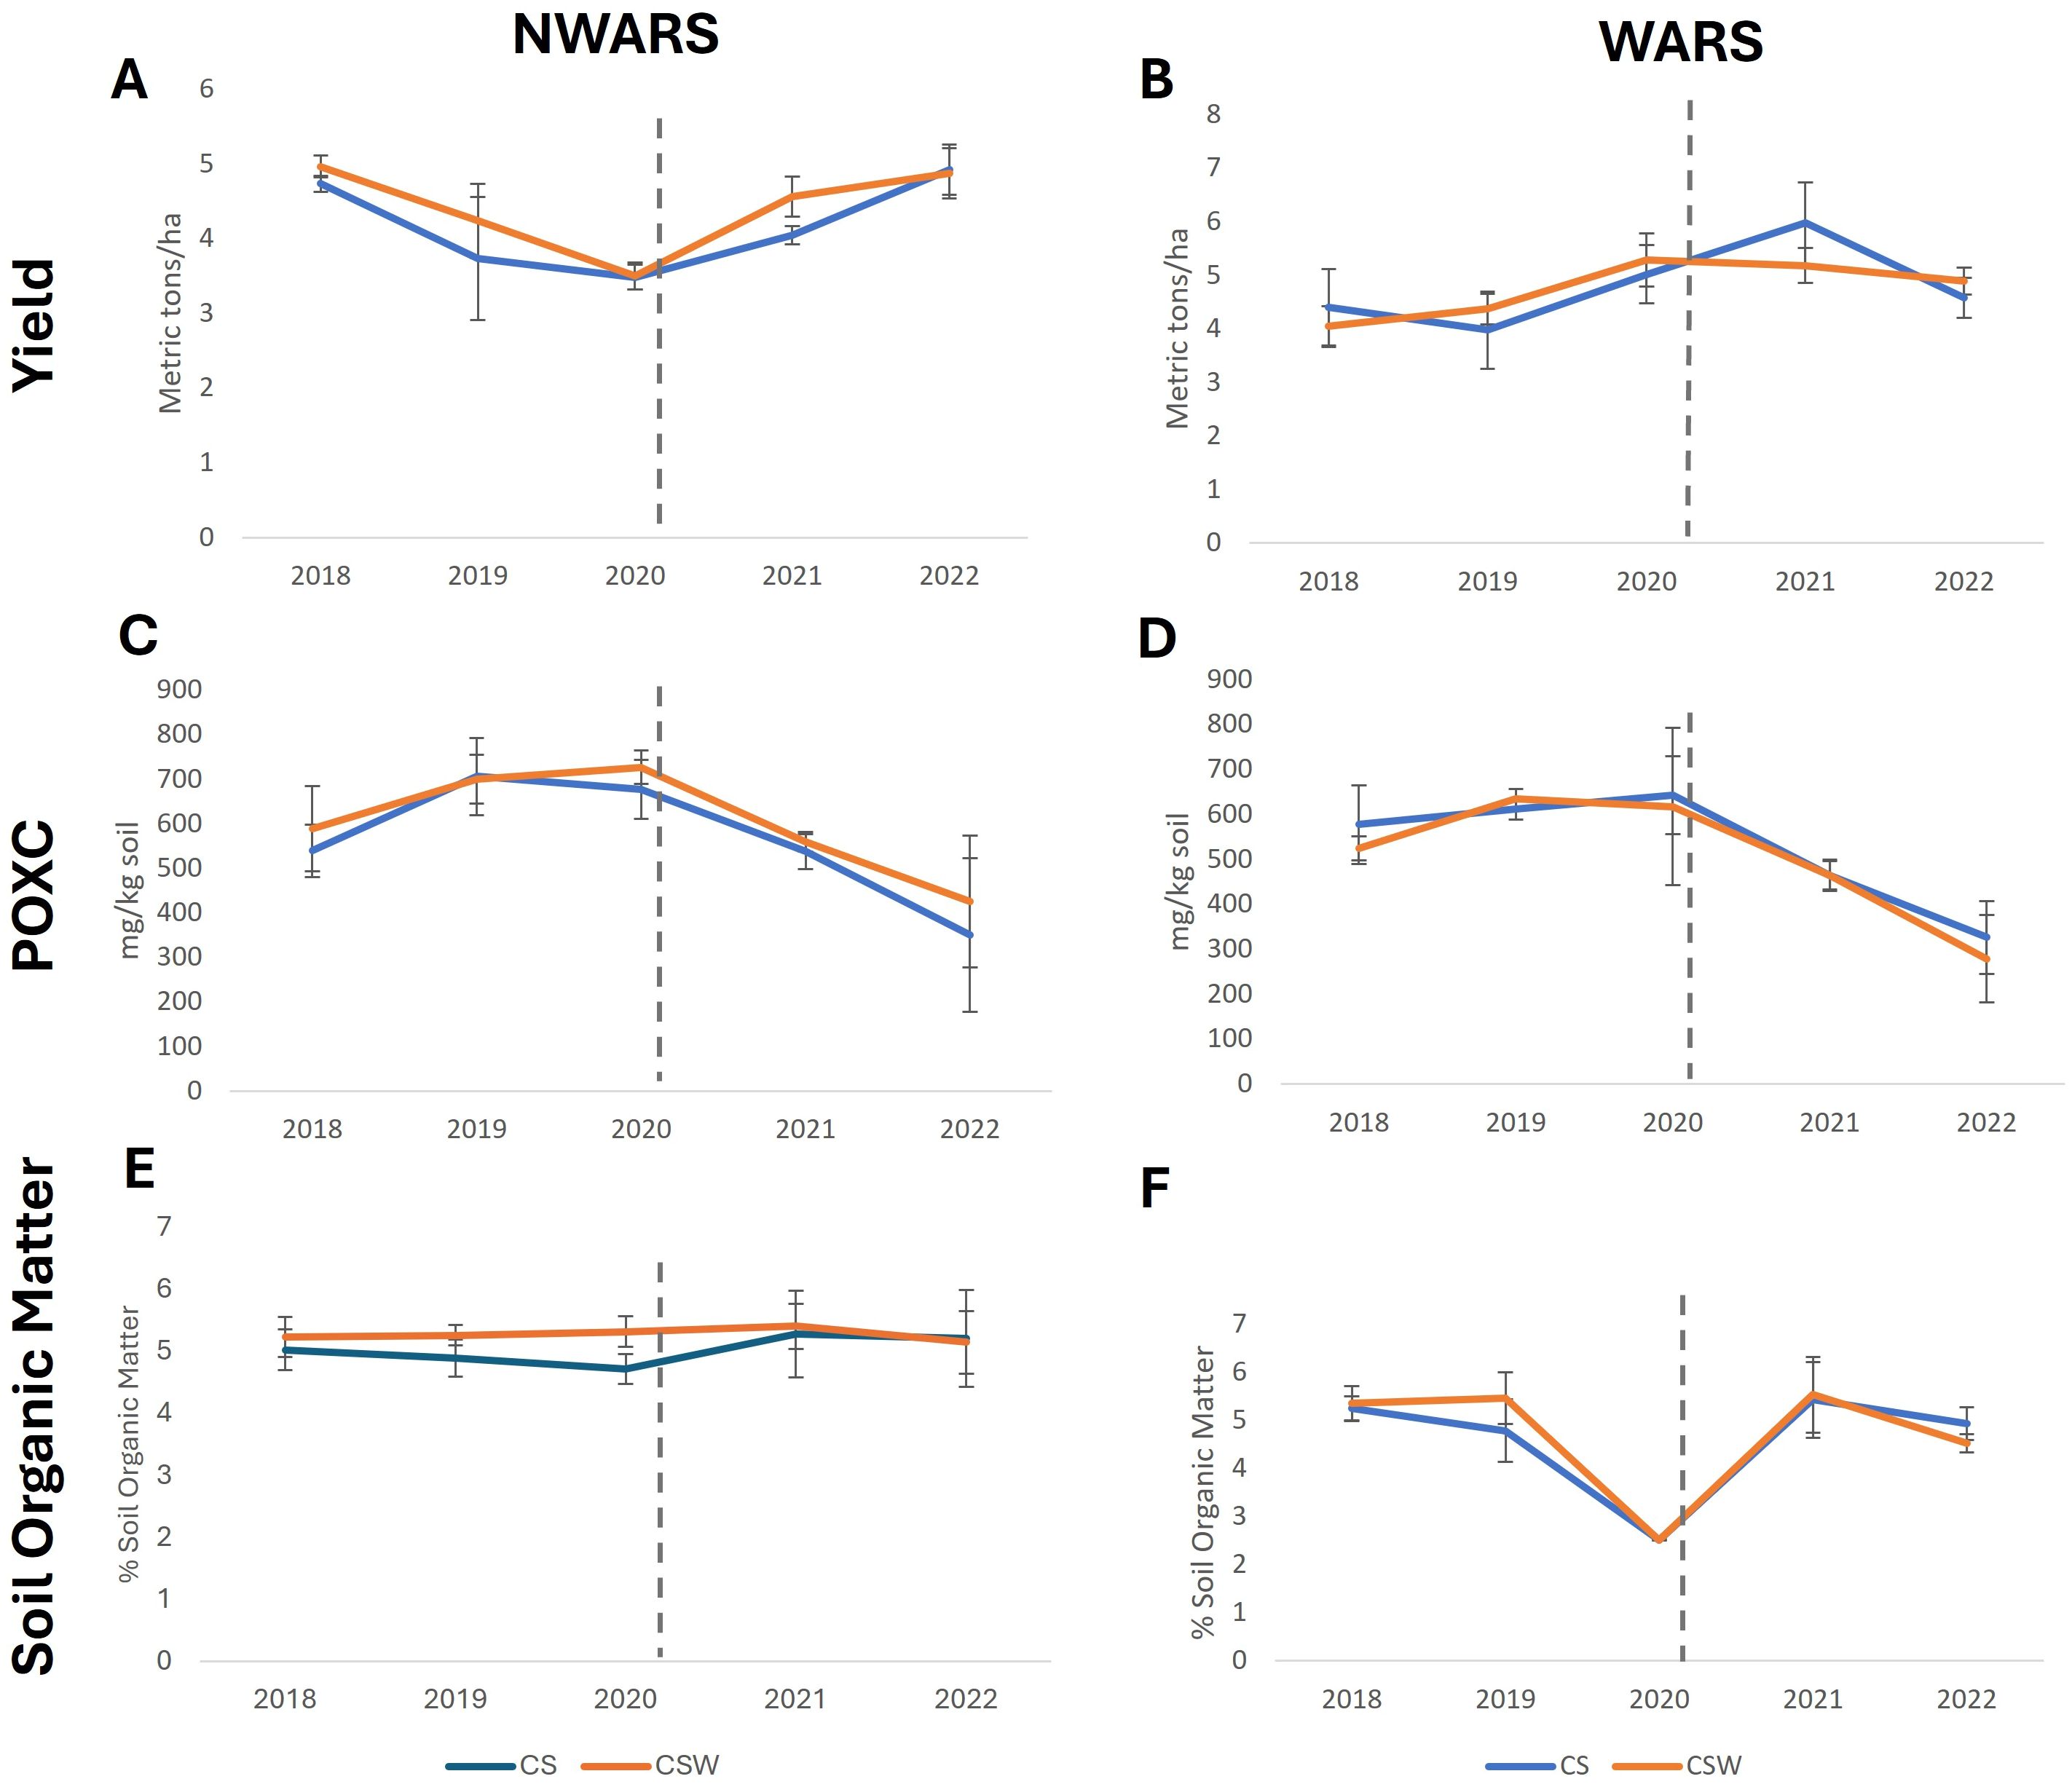
Figure 1. Soybean yield and soil health measurements over a five-year period in long-term rotation plots at two sites. (A, B) yield, (C, D) POXC. (E, F) soil organic matter. Trends in measurements are plotted before (2018-19) the addition of the cover crop treatment and after (2021-22), dashed vertical line indicates the timing of the addition of the cover crop treatment. Error bars represent +/- one standard deviation. NWARS (Northwestern Agricultural Research Station), WARS (Western Agricultural Research Station). CS= corn-soybean Rotation (blue lines), CSW= corn-soybean-wheat Rotation (orange lines).
Microbial community analysis
Fungal, AM fungal, and bacterial diversity were investigated using alpha diversity measures; specifically, observed richness and Shannon index (84), using the estimate_richness function in the phyloseq package (Ver. 1.22.3, 85). Differences in bacterial, fungal, and AM fungal communities were analyzed using a PERMANOVA multivariate analysis using the adonis2 function with 999 permutations and the distance metrics from the Bray-Curtis dissimilarity in the vegan package (Ver. 2.6-8, 86). Non-metric multidimensional (NMDS) plots were generated using the Bray-Curtis distance (87) in the vegan package.
Pairwise differential abundance was determined using the DESeq2 package (Ver. 1.40.2, 88); here, we compared the CS rotation to the CSW rotation and the rye cover crop to the no cover crop controls. Differences were deemed significant if they met the following cutoffs: (i) a log2 fold threshold of 1.5 and (ii) a p value threshold of 0.01, limiting the differential taxa to those that differed by +/- 150% with a 1% false discovery rate.
Co-occurrence networks were created using the NetCoMI package (Ver. 1.1.0, 89) which is available at https://github.com/stefpeschel/NetCoMi. To reduce noise, the 250 ASVs with the highest abundance were selected for analysis. The cluster_fast_greedy method and the Sparcc correlation estimator (89) were used for network construction. Associations were calculated using the Pearson correlation approach with a threshold of 0.4, including the default normalization and zero handing options. Networks were constructed using the netConstruct function and compared between rotation and cover crop for both years of the study. For correlation analysis, subsets of reads were selected to reduce noise; these included combining reads for indicator species for each organism type, differential abundant species for each organism type, and network modules generated in NetCoMI. A supplemental file (Network Module ASV table.csv) contains the information on which ASVs make up individual modules. Correlation analysis used the corrplot package (Ver. 0.95, 90) and base R stats functions. Figures were generated using BioRender, ggplot2 (Ver. 3.5.1, 91), ggpubr (Ver. 0.6.0, 92), and vegan.
The core bacterial, fungal, and AM fungal group members for the various treatments were determined using the R package microbiome (Ver. 1.23.1, 93). ASVs were filtered into genera, and the total abundancies and frequencies of the samples were ranked. Only genera present in the 95th percentiles of total relative abundance and frequency were considered as core taxa, as described by Cantoran et al. (94). The relative abundance of ASVs was calculated as the count of each ASV divided by the average number of ASVs within each sample. Bacterial and fungal core genera identity and relative abundances by sample were visualized using bubble plots in ggplot2. The core analysis was run by site-year; one combination (WARS – 2021) did not have enough samples after filtering to complete the analysis.
A set of highly abundant, potentially biologically relevant genera (i.e., known to contain pathogenic or beneficial species) representing a range of frequencies of occurrence were selected for linear mixed model and Bayesian analysis. For fungi these included common soil fungi, potential pathogens or beneficial organisms, Fusarium (95), Trichoderma (96), Mortierella (97), Fusicolla (98), Neoascochyta (99), and Arthobotrys (100). As well as a set of fungi that were highly abundant in the analysis, including Saitozyma, Tetracladium, Solicoccozyma, Penicillium, Clonostachys, Alternaria, Ustilago, and Exophiala. Bacteria genera selected for these analyses included biologically relevant genera in soils or agriculture, based on the literature, Pseudomonas (101), Bacillus (102), Bradyrhizobium (103), Paenibacillus (104), Streptomyces (105), Deinococcus (106). As well as genera that were highly abundant in our samples including Granulicella, Luteolibacter, Nitrospira, Rhodanobacter, Gemmatimonas, Acidibacter, and Acidothermus. AM fungal genera selected included the only genera represented across both years of the dataset, these are biologically relevant as well: Archeaospora, Claroideoglomus, Diversispora, Glomus, and Paraglomus (107). These sets of genera were also used for variance partitioning using the VariancePartition R package (Ver, 1.36.2, 108) to ascertain genera whose variance may be best explained by the soil health factors. This package uses linear mixed models for partitioning the variation in a feature (in our case, fungal and bacterial species counts) based on measured covariates (108). The covariates included fixed categorical variables (year, location, rotation, and cover crop treatment) and random variables (yield, soil protein, soil respiration, POXC, and SOM).
For the Bayesian analysis, genera counts were first fit using a Dirichlet-multinomial distribution with and without correction for zero inflation using the R packages MicroBVS (109), and ZIDM (110). These packages are available at https://github.com/mkoslovsky/MicroBVS and https://github.com/mkoslovsky/ZIDM, respectively. As the distribution fitting indicated zero inflation was a feature of the data, a Bayesian zero-inflated Dirichlet-multinomial (ZIDM) model was then used to analyze the multivariate compositional counts (assuming excess zeros in the counts). The ZIDM model simultaneously estimates both individual- and population-level genera abundances and covariates associated with microbial abundances and zero-inflation by incorporating a sparsity-inducing spike-and-slab prior (110). All parameter and hyperparameter priors were kept at their defaults. Models were run until convergences were reached, usually between 40,000 and 50,000 iterations. The inclusion of genera-covariate associations in the model was determined using a marginal posterior probability of inclusion (MPPI) of 0.5 for bacteria and 0.45 for fungi. Results were visualized using ggplot2 pheatmap (Ver. 1.0.12, 111), and matsbyname (Ver. 0.6.10, 112).
The code for all analyses in this study is available on GitHub at https://github.com/calconey/freyetal2025.
Results
Impacts of diversified rotations and cover crops on soil health parameters
Soybean yield, POXC, soil protein, percent SOM, and soil respiration were measured to ascertain the impact of diversified rotations and cover crops on soybean productivity and soil health. In 2021 and 2022, split-plot ANOVAs indicated no statistically significant impacts on soybean yield (Table 1). There was a trend of increases in yield at 3 out of 4 site-year combinations for the CSW rotation, but none reached statistical significance. The trends for plots with the cover crop treatment were split (and non-significant), with half trending to higher yields without the cover crop and the other half trending higher with the rye cover crop. Rotational treatments did not impact POXC. POXC was significantly higher without the cover crop in one site-year combination (2022-NWARS, p = 0.001). POXC was generally higher in the no cover crop control at NWARS and trended higher in the rye treatment at WARS. At both sites, all POXC levels were significantly lower in 2021 than in 2022. Soil protein (g_ACE protein/kg soil) levels were similar across rotation and cover crop treatments at NWARS. At WARS, soil protein was significantly higher in the rye cover crop in 2022 and trended higher after the rye cover crop in 2021 (p = 0.03). Percent SOM was significantly increased at NWARS in the no cover crop treatment in 2021 (p = 0.03) and the CS treatment at WARS in 2022 (p = 0.04). Soil respiration was not significantly impacted in site-year combinations but increased significantly at both sites in 2022 over 2021 by about 20-30 µg CO2-C g-1 day-1 each year.
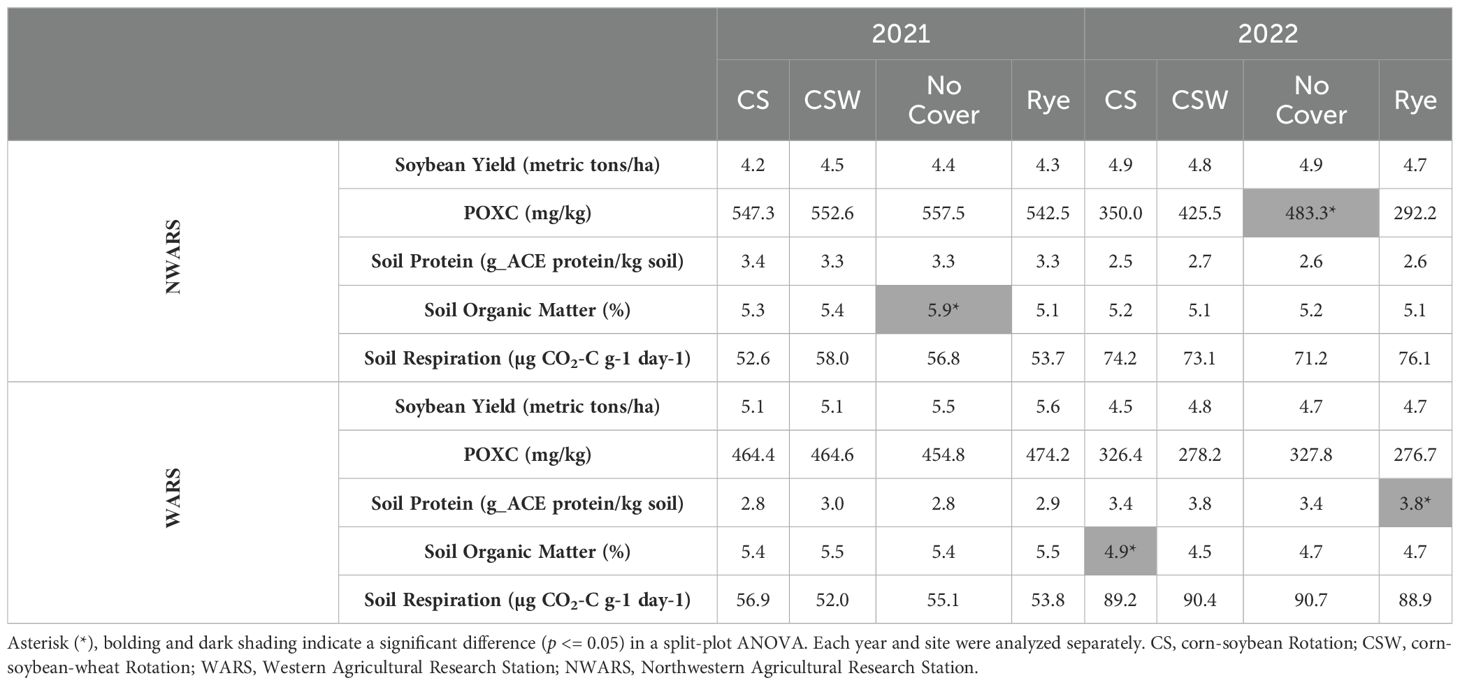
Table 1. Soybean yield and soil health impacts under rotation and cover crop treatments.
Trends in yield, soil health, and environmental conditions
Soybean yields were steady, on average 4.1 metric tons at NWARS and 4.6 metric tons at WARS, over the five years measured. At NWARS, soybean yields were higher in the CSW rotation compared to the CS rotation in all years but 2022. At NWARS, soybean yields were more variable with respect to rotations, with the CS rotation having higher yields in 2018 and 2021 and the CSW rotation having higher yields in 2019, 2020, and 2022. Within both sites, soybean yields from 2022 were similar to 2018.
POXC measurements decreased over time at both sites, particularly after adding the cover crop treatments at the end of the 2020 growing season. At NWARS, POXC peaked in 2020 at 726.96 mg/kg of soil in the CSW rotation but declined by 207% to 350 mg/kg soil in the CS rotation in 2022. At WARS, POXC followed similar numbers, peaked in 2020 in the CS rotation at 617.1 mg/kg soil and declined by 221% to 278 mg/kg soil by 2022 after adding the cover crop treatments in 2020. SOM remained steady at NWARS, starting at around 5% in 2018 and ending at 5.2% in 2022. SOM changes were similar at WARS, except in 2020, when it dropped to 2.5%, rebounding to 5.5% in 2021, a deviation best explained by a measurement error. At both sites, SOM numbers were similar in 2022 to the time of the first measurements in 2018.
Environmental conditions from 2018 to 2022 are presented in Supplementary Figure S4. Annual mean temperature at WARS ranged from 10 to 12 °C and 11.1 to 12 °C at NWARS. Total annual precipitation at WARS ranged from 72.6 to 113.5 cm. At NWARS, total precipitation ranged from 69.9 to 118.7 cm. Average daily relative humidity ranged from 77.1 to 80.5% at WARS and 77.9 to 82.0 at NWARS. Mean 5 cm soil temperature ranged from 11.1 to 12.6 °C at NWARS and 13.0 to 14.3 °C at WARS.
Sequencing and bioinformatics summary
For the 2021 fungal sequencing, 136,720 long reads (median of 4,615 per sample) were assembled into 1,237 ASVs with an average read length of 608bp. For the 2022 fungal sequencing, 292,377 long reads (a median of 7,897.5 per sample) were assembled into 2,638 ASVs with an average read length of 610bp. For the 2021 AM fungal sequencing, 320,272 long reads (median of 7,442 reads per sample) were assembled into 377 ASVs with an average read length of 798bp. For the 2022 AM fungal sequencing, 322,967 long reads (a median of 7,911 reads per sample) were assembled into 2,163 ASVs with an average read length of 795bp. For the 2021 bacterial sequencing, 1,869,800 reads (median of 54,881 reads per sample) were assembled into 7625 ASVs with an average read length of 253bp. For the 2022 bacterial sequencing, 2,094,082 reads (a median of 60,051 bacterial reads per sample) were assembled into 8,088 ASVs with an average read length of 253bp.
Soil microbial communities – alpha and beta diversity
Location, diversified rotations, and cover crops did not impact soil fungal communities in 2021. In 2022, changes in soil fungal communities were driven by location (Table 2); statistically significant differences between the two sites were detected in observed diversity (p = 0.005) or Shannon diversity index (p = 0.01) for fungal populations, but not between rotation or cover crop treatments. (Supplementary Figure S5). According to PERMANOVA the location by rotation interaction was a driver of fungal communities in 2021, the year the first cover crop intervention was made. However, that pattern was not repeated in 2022 (Table 2). Beta diversity patterns were consistent with the PERMANOVA analysis, which showed that location was a primary driver of community structure (Supplementary Figures S8, S9).
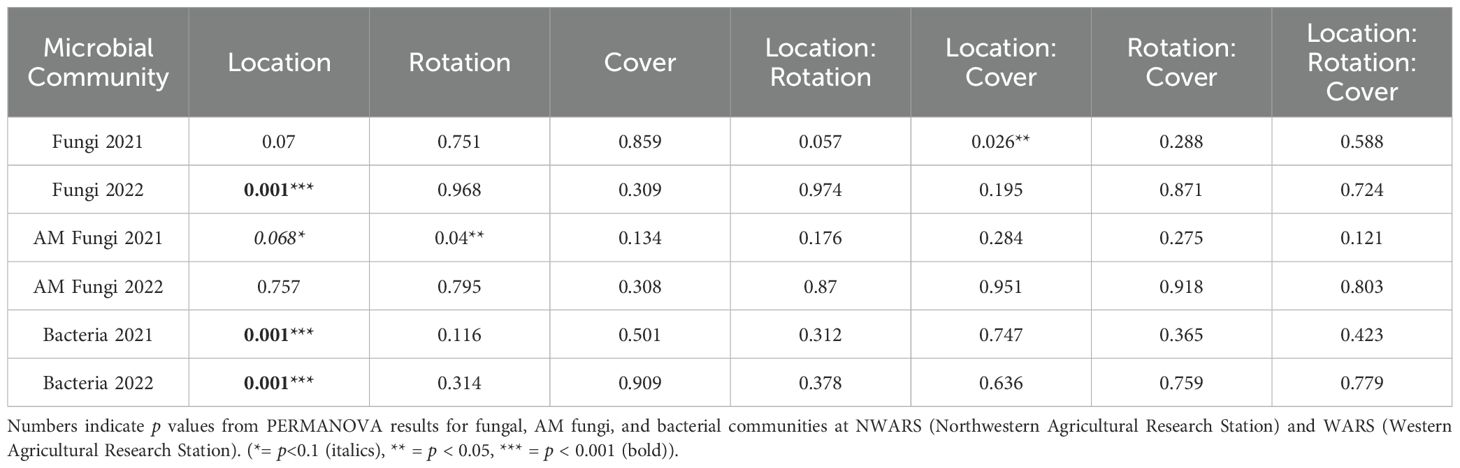
Table 2. Permutational Multivariate Analysis of Variance (PERMANOVA) for fungal, arbuscular mycorrhizal (AM) fungal, and bacterial community composition.
Rotation was a driver of arbuscular mycorrhizal fungal community structure, in 2021 (Table 2), but not in 2022 (Table 2). There was no difference in AM fungi alpha diversity metrics in location or rotation treatments in 2021 or 2022 (Supplementary Figure S6). The 2021 cover crop treatment drove a significant increase in the Shannon diversity of AM fungi (Supplementary Figure S6E, p = 0.03) which was not maintained in 2022. Beta diversity analysis did not detect an effect of cover crops (Supplementary Figures S8C, D) on AM fungal communities.
Location strongly impacted bacterial communities in both years (Table 2, p = 0.001; Supplementary Figures S8, S9). In 2021, observed diversity and Shannon index were not significantly different between rotation and cover crop treatments (Supplementary Figure S7). In 2022, the observed alpha diversity (p = 0.01) and Shannon diversity index (p = 0.007) were significantly higher at the WARS site (Supplementary Figure S7B). There were no differences in any alpha diversity metrics for rotation or cover crop treatments in 2022.
Differential abundance analysis
In 2021, differential abundance analysis using DEseq2 for fungal communities revealed that 24 ASVs were significantly more abundant in the CS rotation, while 7 ASVs were more abundant in the CSW rotation (Figure 2A, p <= 0.01). In the cover crop treatments, 6 ASVs (including Fusarium) were significantly more abundant in the no cover crop controls (Figure 2C, p <= 0.01). In comparison, 23 ASVs were significantly more abundant under the rye cover crop. In 2022, 18 ASVs were more abundant in the CS rotation, (Figure 2B, p <= 0.01), while 25 ASVs were significantly more abundant in the CSW rotation. In the cover crop treatments, 15 ASVs were more abundant in the no cover crop controls, (Figure 2D, p <= 0.01), and 8 ASVs were more abundant under the rye cover crop.
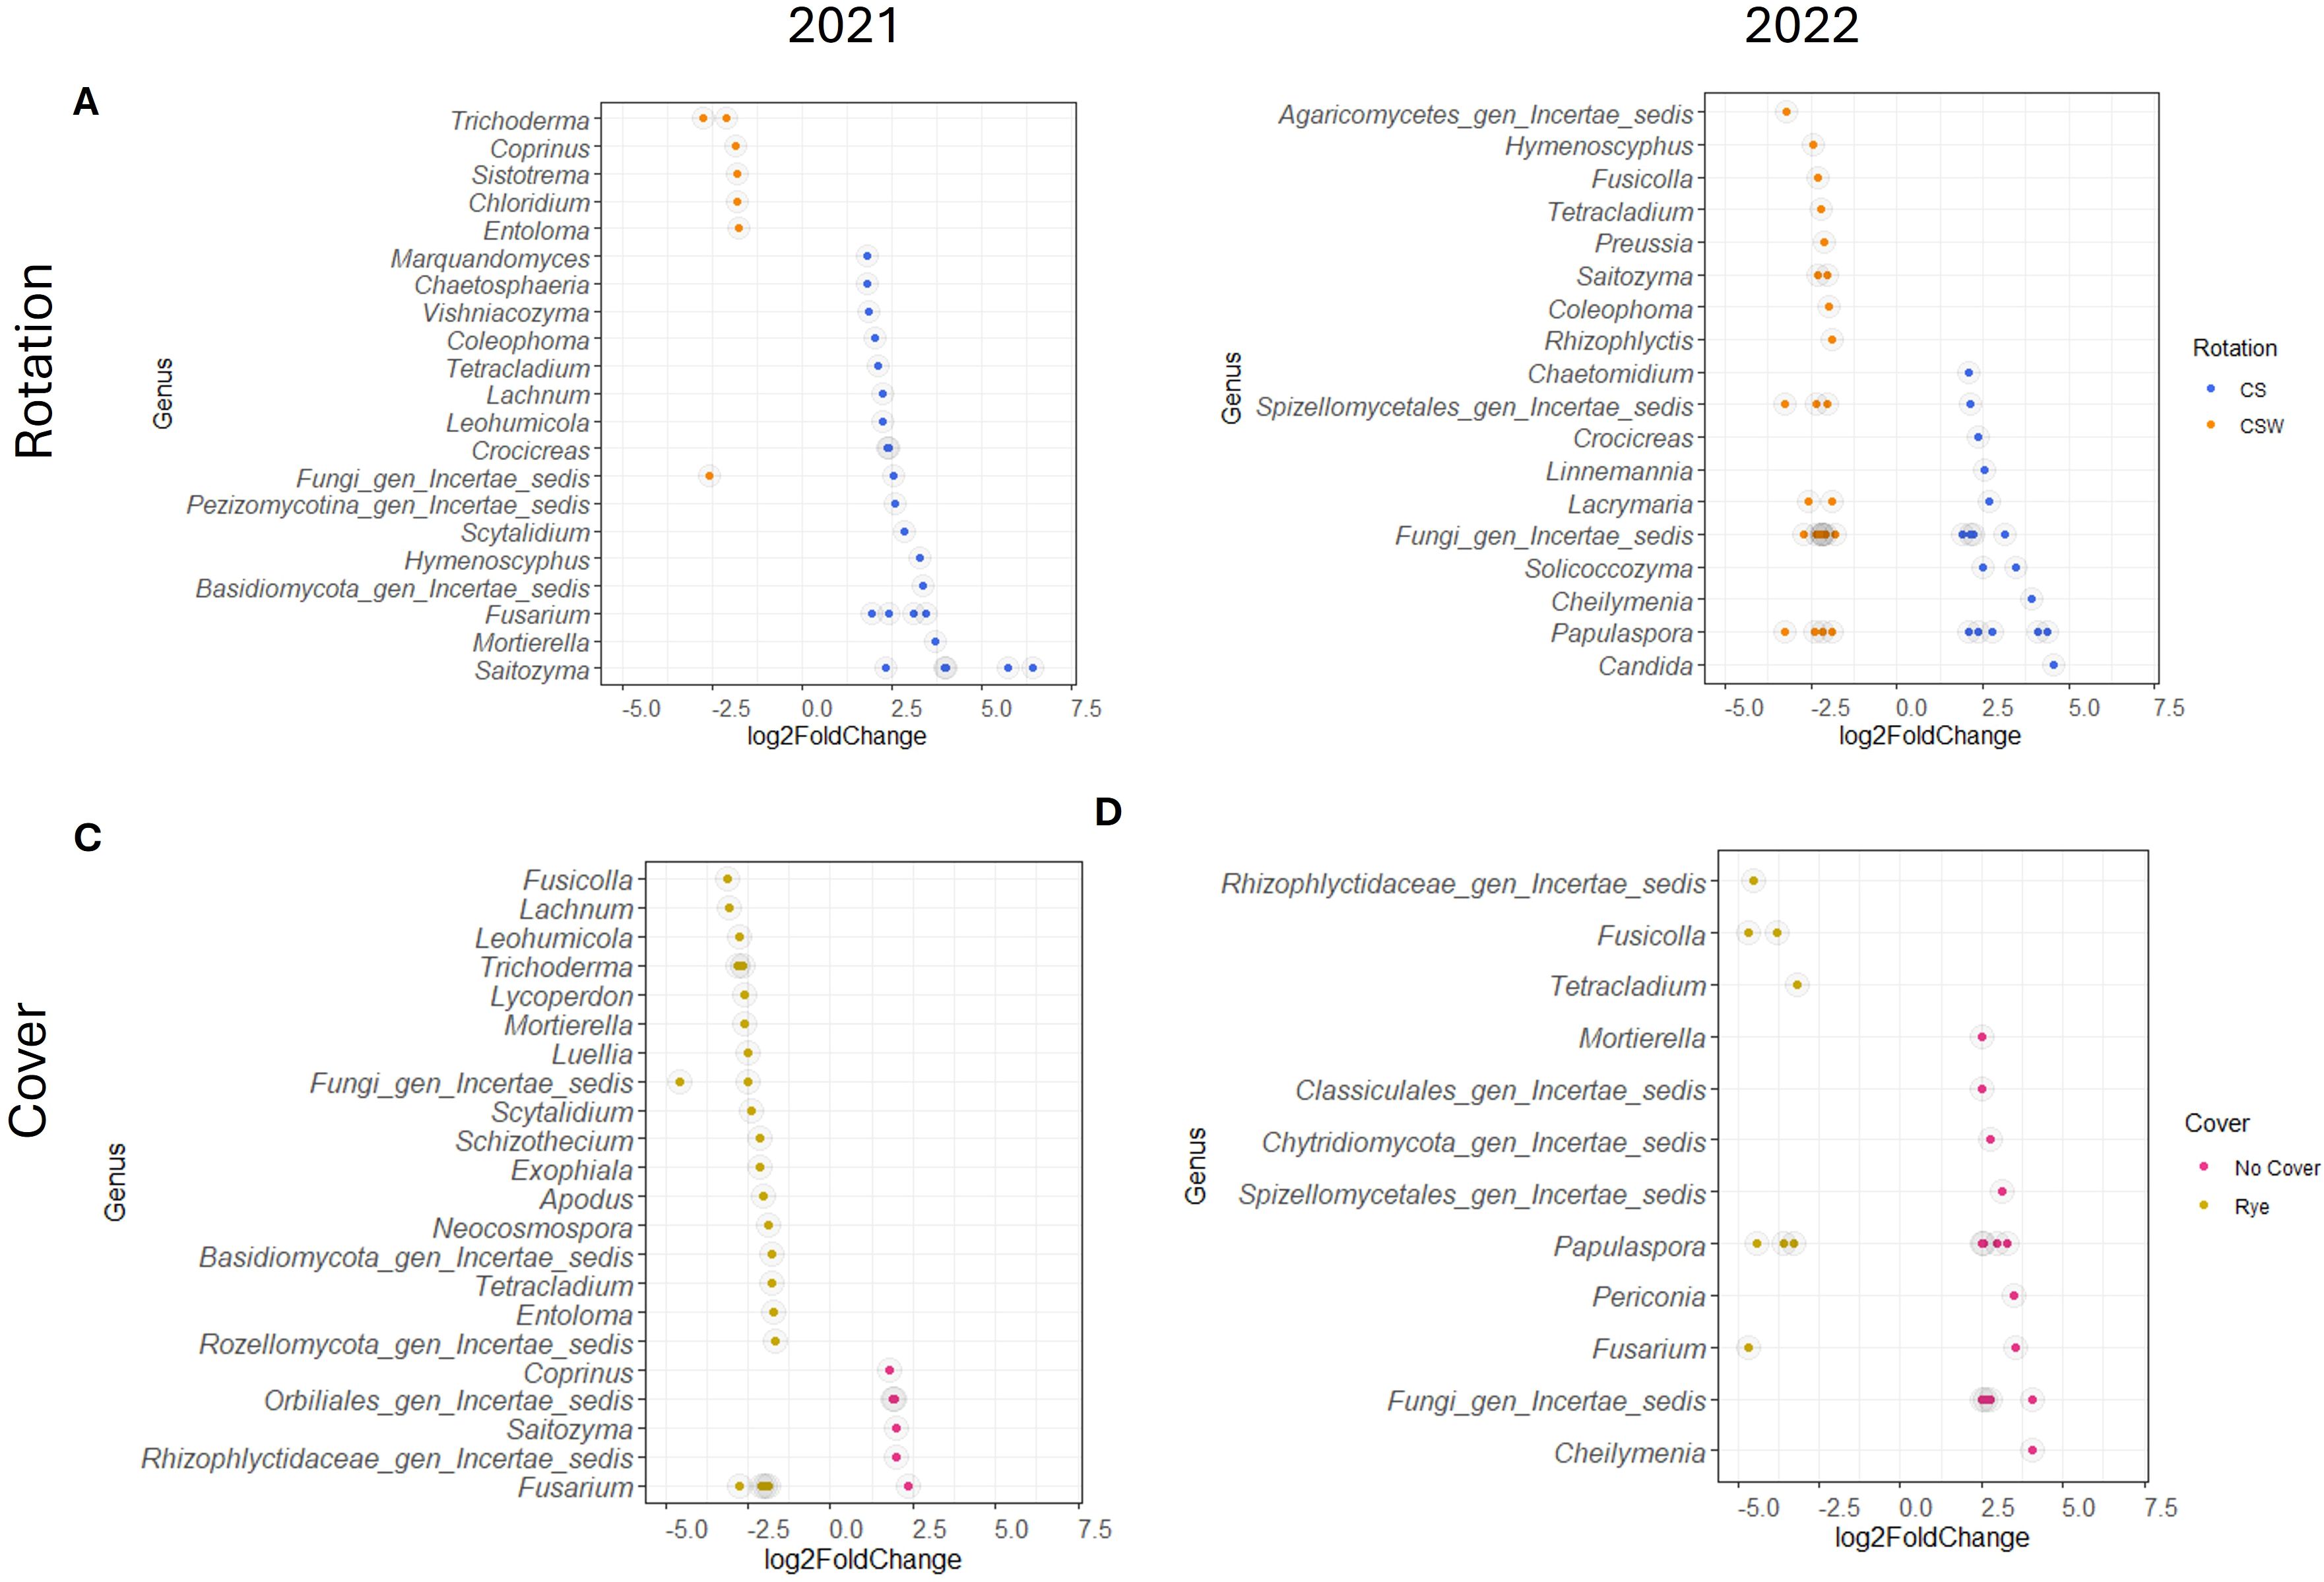
Figure 2. Fungal amplicon sequence variants (ASVs) that are differentially abundant, as indicated by log2fold change of at least 1.5, in rotation and cover crop treatments in 2021 and 2022. (A, B) Differentially abundant genera in rotation treatments, Blue = ASVs differentially abundant in the corn-soybean (CS) rotation, Orange = ASVs differentially abundant in the corn-soybean-wheat (CSW) Rotation. (C, D) Differentially abundant genera in the cover crop treatments, Pink = ASVs differentially abundant in the no cover control, Gold = ASVs differentially abundant in the rye cover crop.
In 2021, differential abundance analysis for AM fungal communities revealed 7 ASVs more abundant in the CS rotation and 7 ASVs more abundant in the CSW rotation (Figure 3A, p <= 0.01). Comparing the cover crop treatments, 10 ASVs were more abundant in the no cover crop control, and 14 ASVs were more abundant under the rye cover crop treatment (Figure 3C, p <= 0.01). In 2022, 7 ASVs were more abundant in the CS rotation, and 8 ASVs were more abundant in the CSW rotation (Figure 3B, p <= 0.01). In the cover crop treatments, 18 AM fungi fungal ASVs were more abundant in the no cover crop control (Figure 3D, p <= 0.01), while 19 ASVs were more abundant in the rye cover crop treatment.
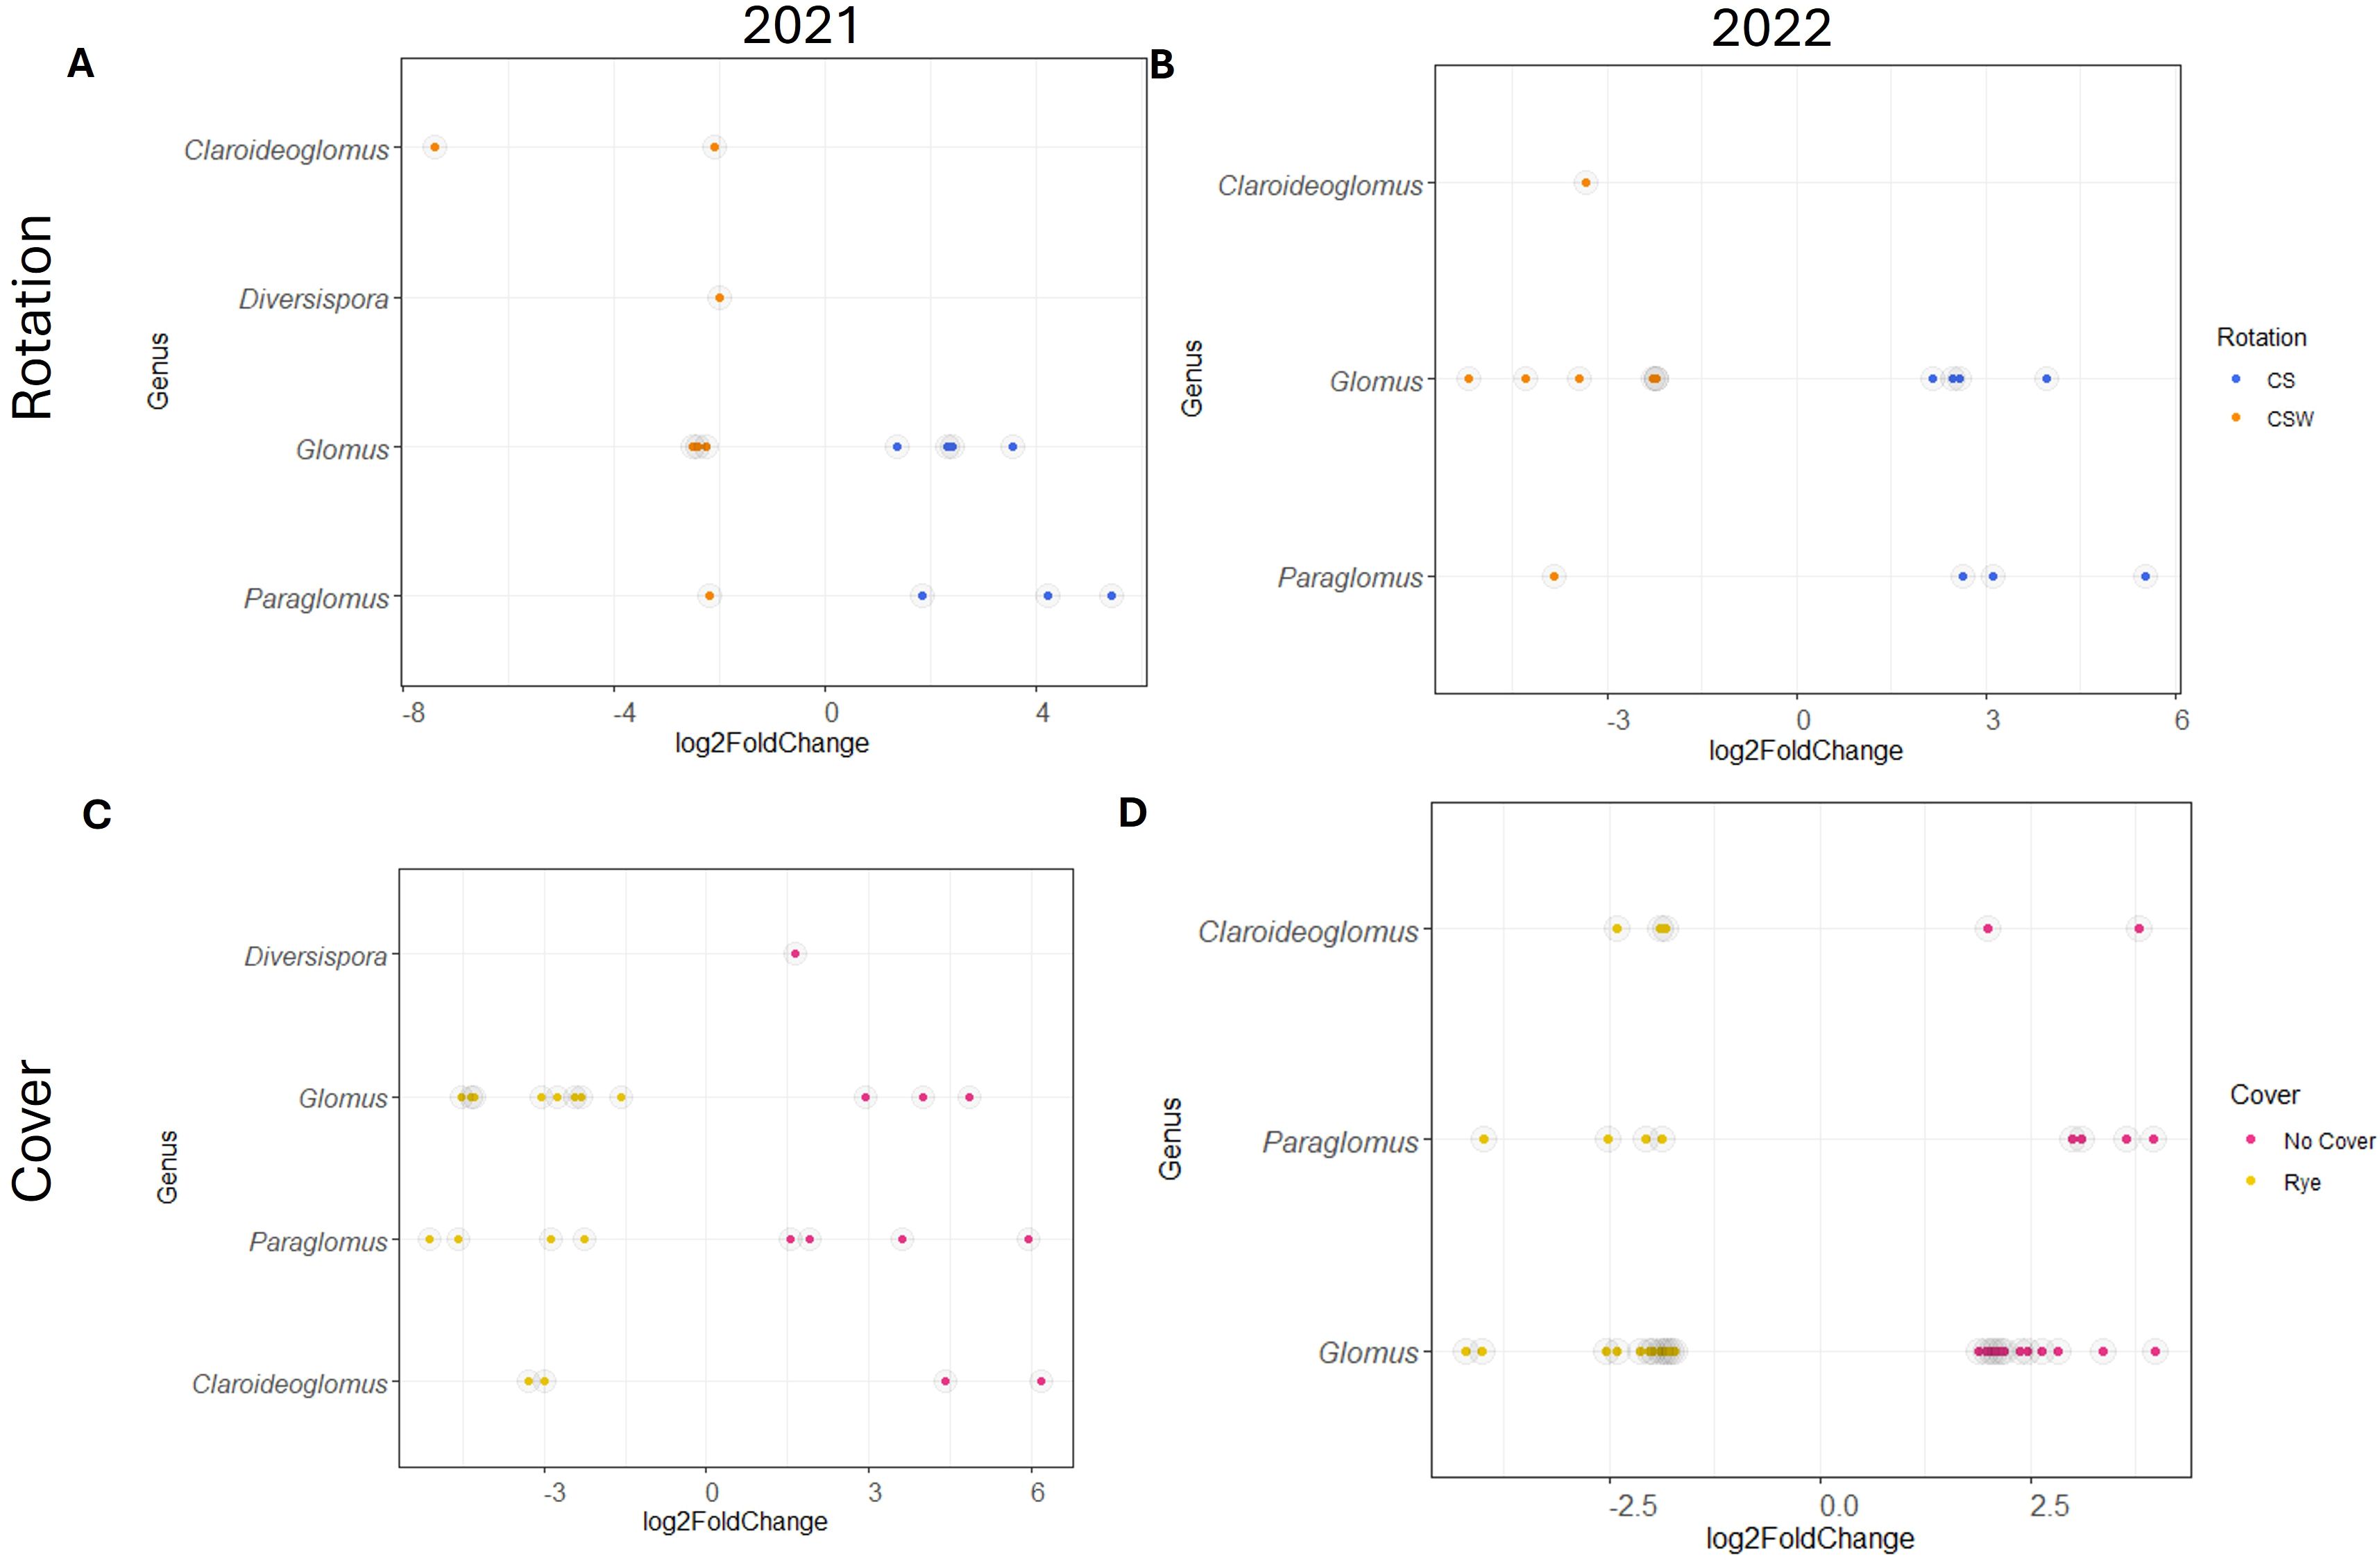
Figure 3. Arbuscular mycorrhizal fungal amplicon sequencing variants (ASVs) that are differentially abundant, as indicated by log2fold change of at least 1.5, in rotation and cover crop treatments in 2021 and 2022. (A, B) Differentially abundant genera in rotation treatments, Blue = ASVs differentially abundant in the corn-soybean (CS) rotation, Orange = ASVs differentially abundant in the corn-soybean-wheat (CSW) Rotation. (C, D) Differentially abundant genera in the cover crop treatments, Pink = ASVs differentially abundant in the no cover control, Gold = ASVs differentially abundant in the rye cover crop.
For bacterial communities, differential abundance analysis in 2021 revealed one ASV that was significantly more abundant in the CS rotation and one ASV that was more abundant in the CSW rotation (Supplementary Figure S10A, p <= 0.01). In the cover crop treatment, only two differentially abundant ASVs were identified, both of which were more abundant in the no cover crop control (Supplementary Figure S10C). In 2022, one bacterial ASVs was differentially abundant in the CS rotation and one ASV was differentially abundant in the CSW rotation (Supplementary Figure S10B, p <= 0.01). No differentially abundant ASVs were identified in the cover crop treatments in 2022.
Network analysis and module correlations
Association networks between fungal, AM fungal, and bacterial ASVs recovered from CS and CSW rotations (Figure 4) and cover crop treatments (Figure 5) were estimated for each year of study. Network metrics (Supplementary Tables S2–S4) varied for rotation and cover crop treatments, especially between years and the type of organism sampled. Fungal and AM fungal communities had more modules in 2021 than in 2022, containing several smaller groups of interconnected ASVs, probably due to differences in sequencing runs (Supplementary Table S2). Bacteria communities generally had fewer network modules than fungi or AM fungi. Fungal communities had higher modularity values than AM fungi and bacteria, indicating a higher possibility of community connectedness. AM fungi communities had high variation in modularity and edge density compared to fungi and bacteria, with values that were consistently in the same range. Bacterial communities generally had the highest edge density, although some groups of AM fungi also had high edge density. More closely associated modules tended to contain groups associated with WARS or NWARS, such as the two large groupings in bacterial communities (Figure 4).
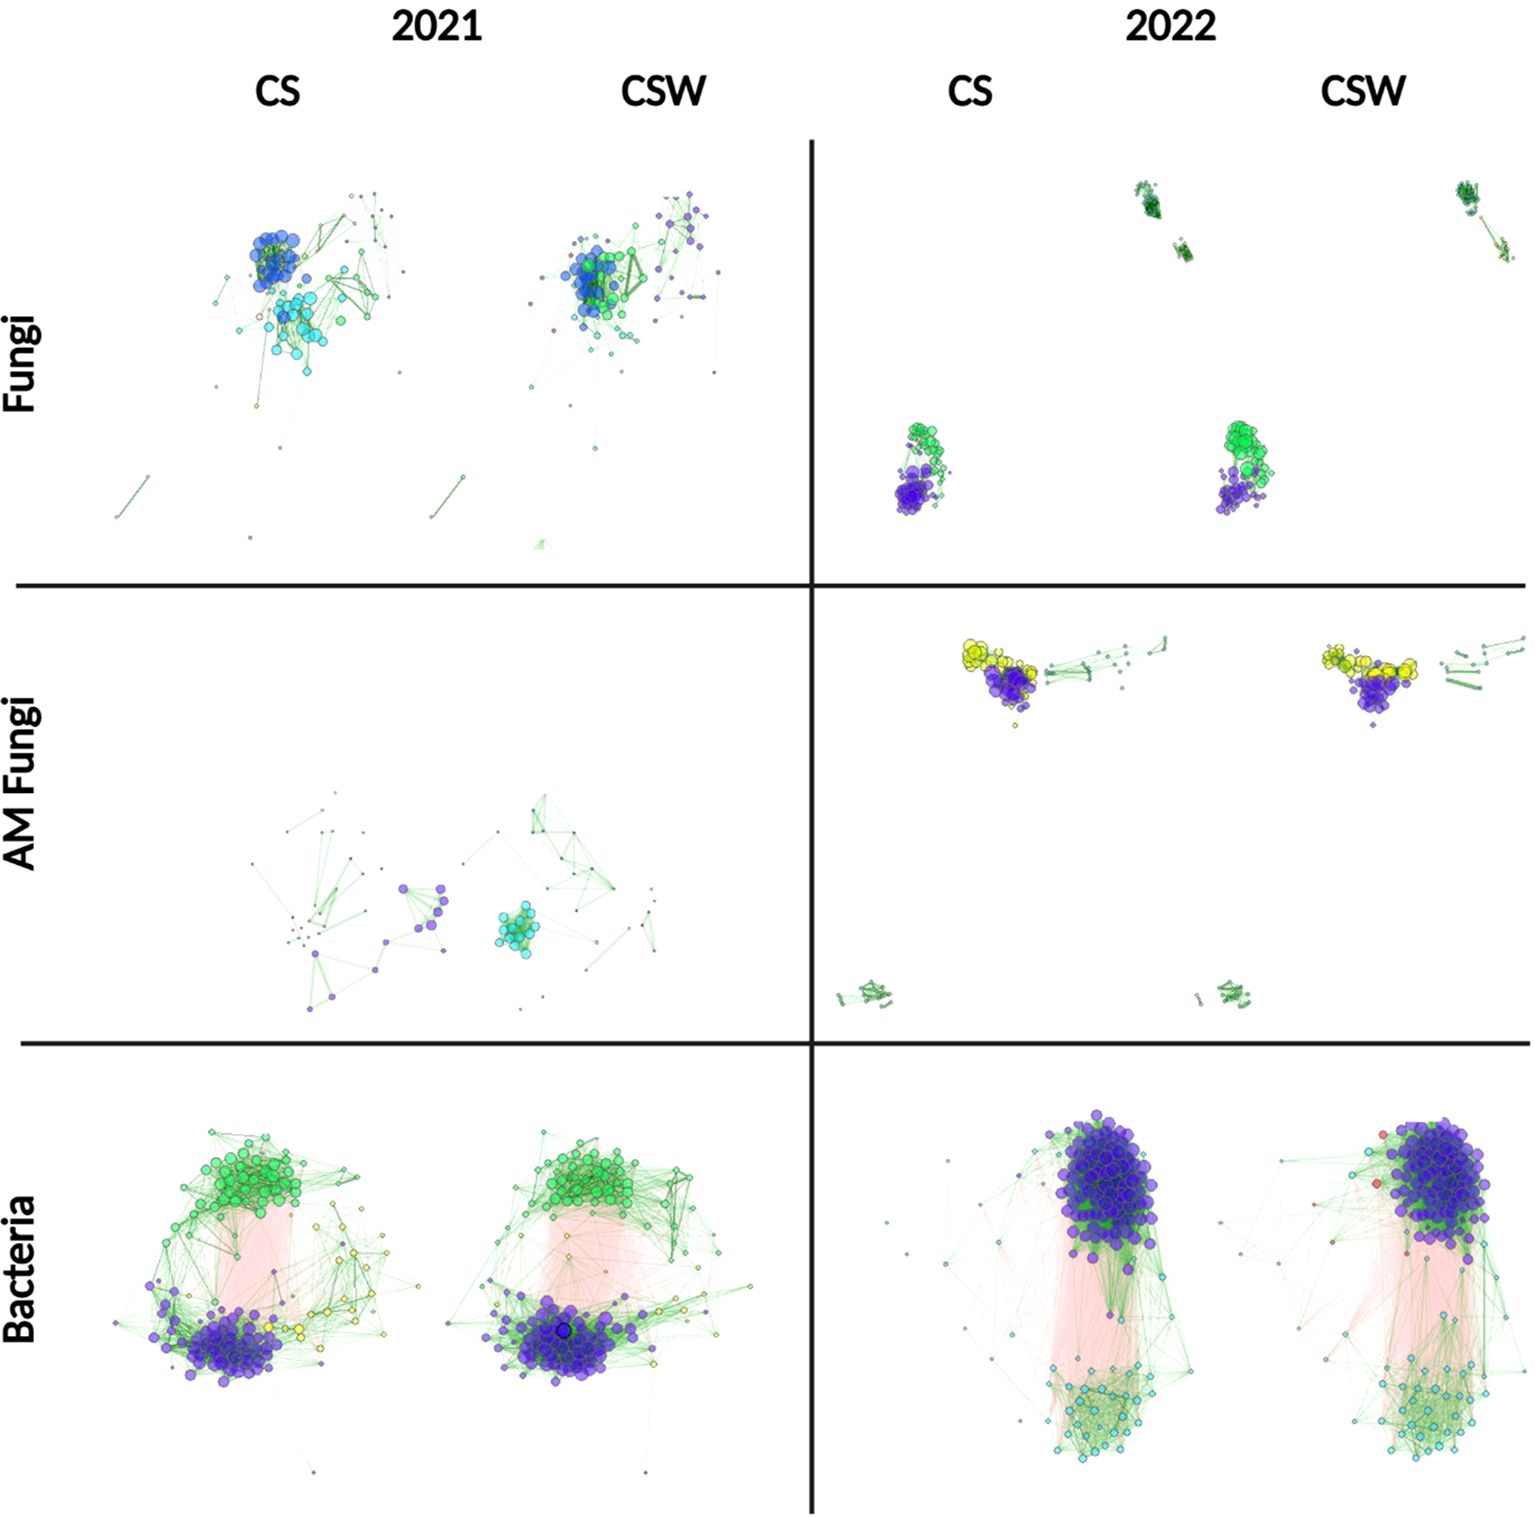
Figure 4. Association network analysis by crop rotation showing bacterial, fungal, and arbuscular mycorrhizal (AM) fungal community structures. Nodes correspond to individual ASVs. Lines depict associations. Green edges (lines) = positive association, red edges (lines) = negative association. Clusters of nodes of a single color correspond to modules of positively associated ASVs. CS, corn-soybean rotation; CSW, corn-soybean-wheat rotation.
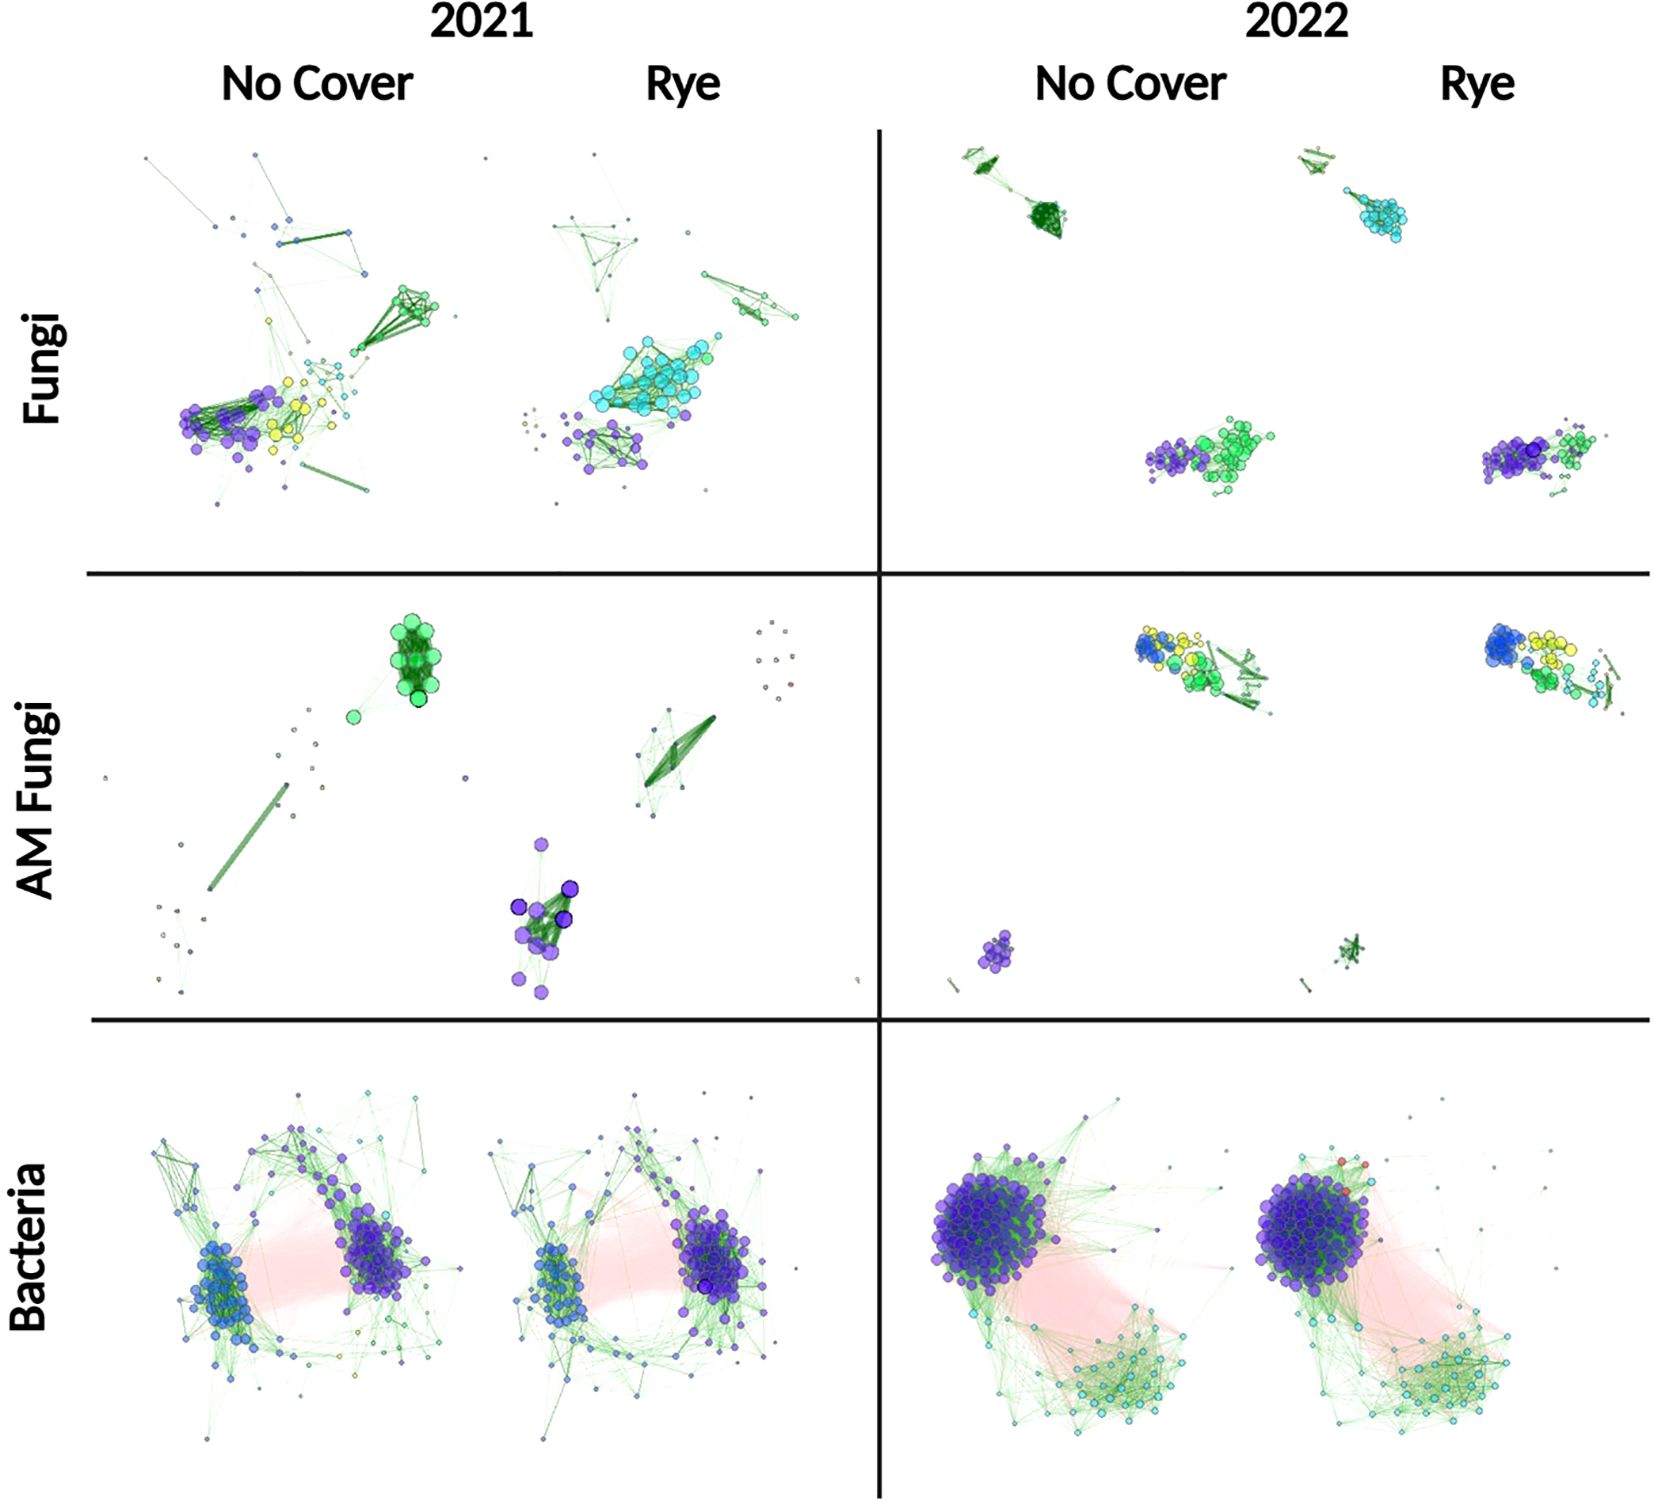
Figure 5. Association network analysis by cover crop showing bacterial, fungal, and arbuscular mycorrhizal (AM) fungal community structure. Nodes correspond to individual ASVs. Lines correspond to associations. Green edges (lines) = positive association, red edges (lines) = negative association. Clusters of nodes of a single color correspond to modules of positively associated ASVs.
To determine if any trends could be detected using groups of associated organisms, ASVs from individual fungal, AM fungal, and bacterial network modules were averaged, and a correlation analysis was conducted with yield and soil health parameters (Supplementary Figures S11, S12). Three fungal modules and one bacterial module in 2021 suggested a positive correlation with POXC (Supplementary Figure S11B) (Figures 6A–D). These three modules contain similar taxa, including Ustilago, Humicola, and Exophiala. In fungal communities, in 2022, there was a trend of stronger negative associations with soil protein in modules containing Lacrymaria, Mortierella, and Ustilago ASVs. Bacterial communities in 2021 had some large modules that showed a positive trend: four modules with yield, four with POXC, and six with soil protein (Supplementary Figure S11E). In 2022, the predominant pattern for bacterial modules was that eleven out of sixteen modules were positively associated with soil protein and nine out of sixteen modules were positively associated with respiration. In contrast, most of the bacterial modules from 2022 were weakly and negatively associated with yield, POXC, and SOM. ASVs identified as Sphingomonas, Bacillus, Gaiella, and Acidothermus were some of the more abundant bacteria in these modules. Some of the strongest positive (Supplementary Figures S13A, B) and negative (Supplementary Figures S13C, D) associations were extracted to illustrate these trends.
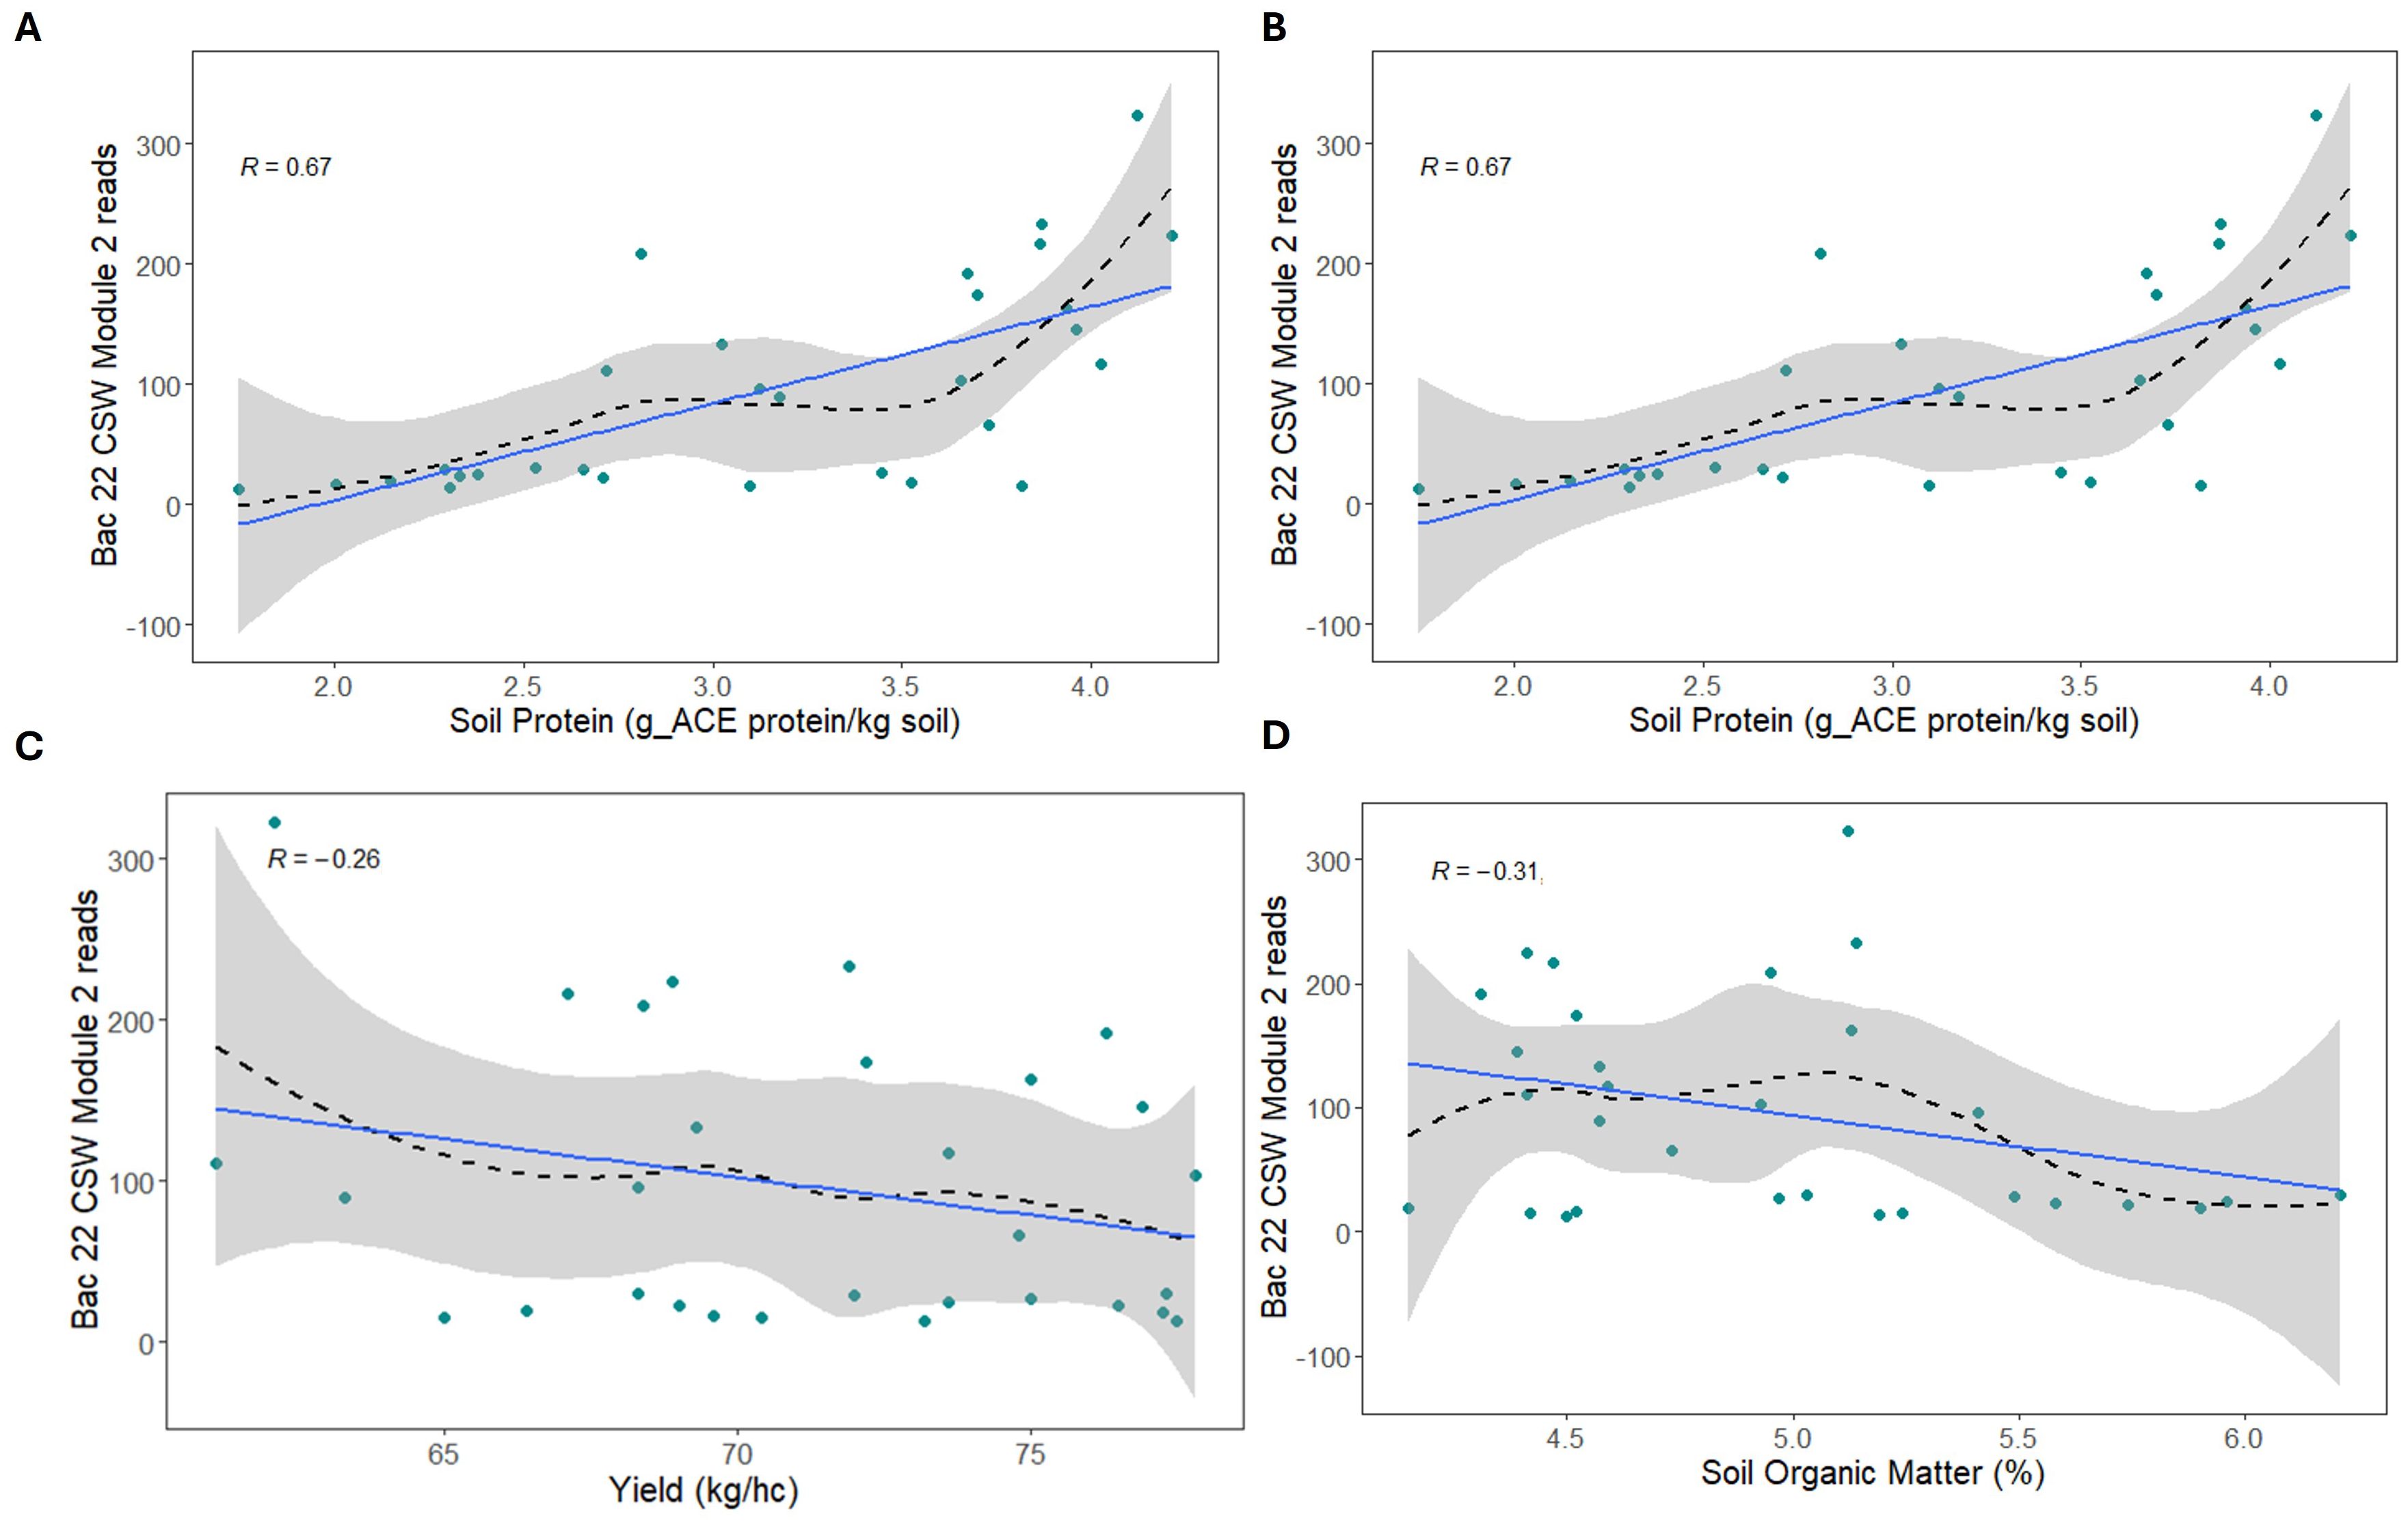
Figure 6. Fungal (A, B, D) and bacterial (C) reads from amplicon sequencing variants (ASVs), which comprise associated network modules plotted against permanganate oxidizable carbon (POXC) levels in the soil. Points represent average reads in each sample; a dashed black line shows the smoothed trend, the gray shaded area is a 95% percent confidence interval for the trend curve, and the blue line shows a linear regression. The linear correlation coefficient (R) is shown in the upper left of each panel.
Core taxa
Nine fungal taxa were identified as core taxa in the rotation and cover crop treatments in 2021, and ten were identified as core taxa in 2022. From this Ustilago, Mortierella, and Fusarium were most abundant in the rotational and cover crop treatments in 2021 (Supplementary Figure S14). and Papulaspora, Lacrymaria, and one unidentified fungal ASV in 2022. In both years there were no significant differences in the largest groups of core fungal taxa between rotational or cover crop treatments at either site. Because of some dropout samples, we could not conduct this analysis on AM Fungi.
Twenty-five bacterial genera were identified as core taxa for rotation treatments and cover crop treatments in 2021, and twenty-six were identified in 2022. Core bacterial taxa in the rotational and cover crop treatments in 2021 included Gemmatimonas, Sphingomonas, and Bryobacter at NWARS in 2021 and Candidatus Uedobacter, Gemmatimonas, and Sphingomonas at WARS in 2021. Core bacterial taxa in the rotational and cover crops treatments in 2022 included Gemmatimonas, Candidatus Uedobacter, and Sphingomonas at NWARS and Gemmatimonas, Bacillus, and Acidothermus at WARS. In both years there were no significant differences in the largest groups of core bacterial taxa between rotational or cover crop treatments at either site.
Variance partitioning
For the selected subset of fungal genera, year was the most significant contributor to the variance (19%) in taxa counts (Supplementary Figure S15A). Of the soil health characteristics, soil respiration was the most significant contributor to the variance of the selected fungi. Mortierella and Fusicolla had significant variation explained by soil respiration differences (Figure 7A). Tetracladium had a larger variance explained by soil protein. For AM fungal genera (Figure 7B), year was the most significant contributor to the variance (9%) (Supplementary Figure S15B). Significant contributions to Paraglomus variance were explained by soil respiration and POXC. For the bacterial genera in the variance partitioning analysis, year was the largest contributor to variance (43%, Supplementary Figure S15C). Location explained the largest percentage of variance for some genera, including Bacillus and Paenibacillus (Figure 7C). Yield contributed 12% of variation to both Pseudomonas and Bacillus. Soil respiration contributed 21% of the variation to Nitrospira. Other measured covariates accounted for only small portions of the variation for each genus we measured. Overall, the variation contributed by our covariates was lower for AM fungi than for the fungi or bacteria. Soil respiration contributed to variation within all the microbial groups, whereas soil organic matter only for variation within fungi.
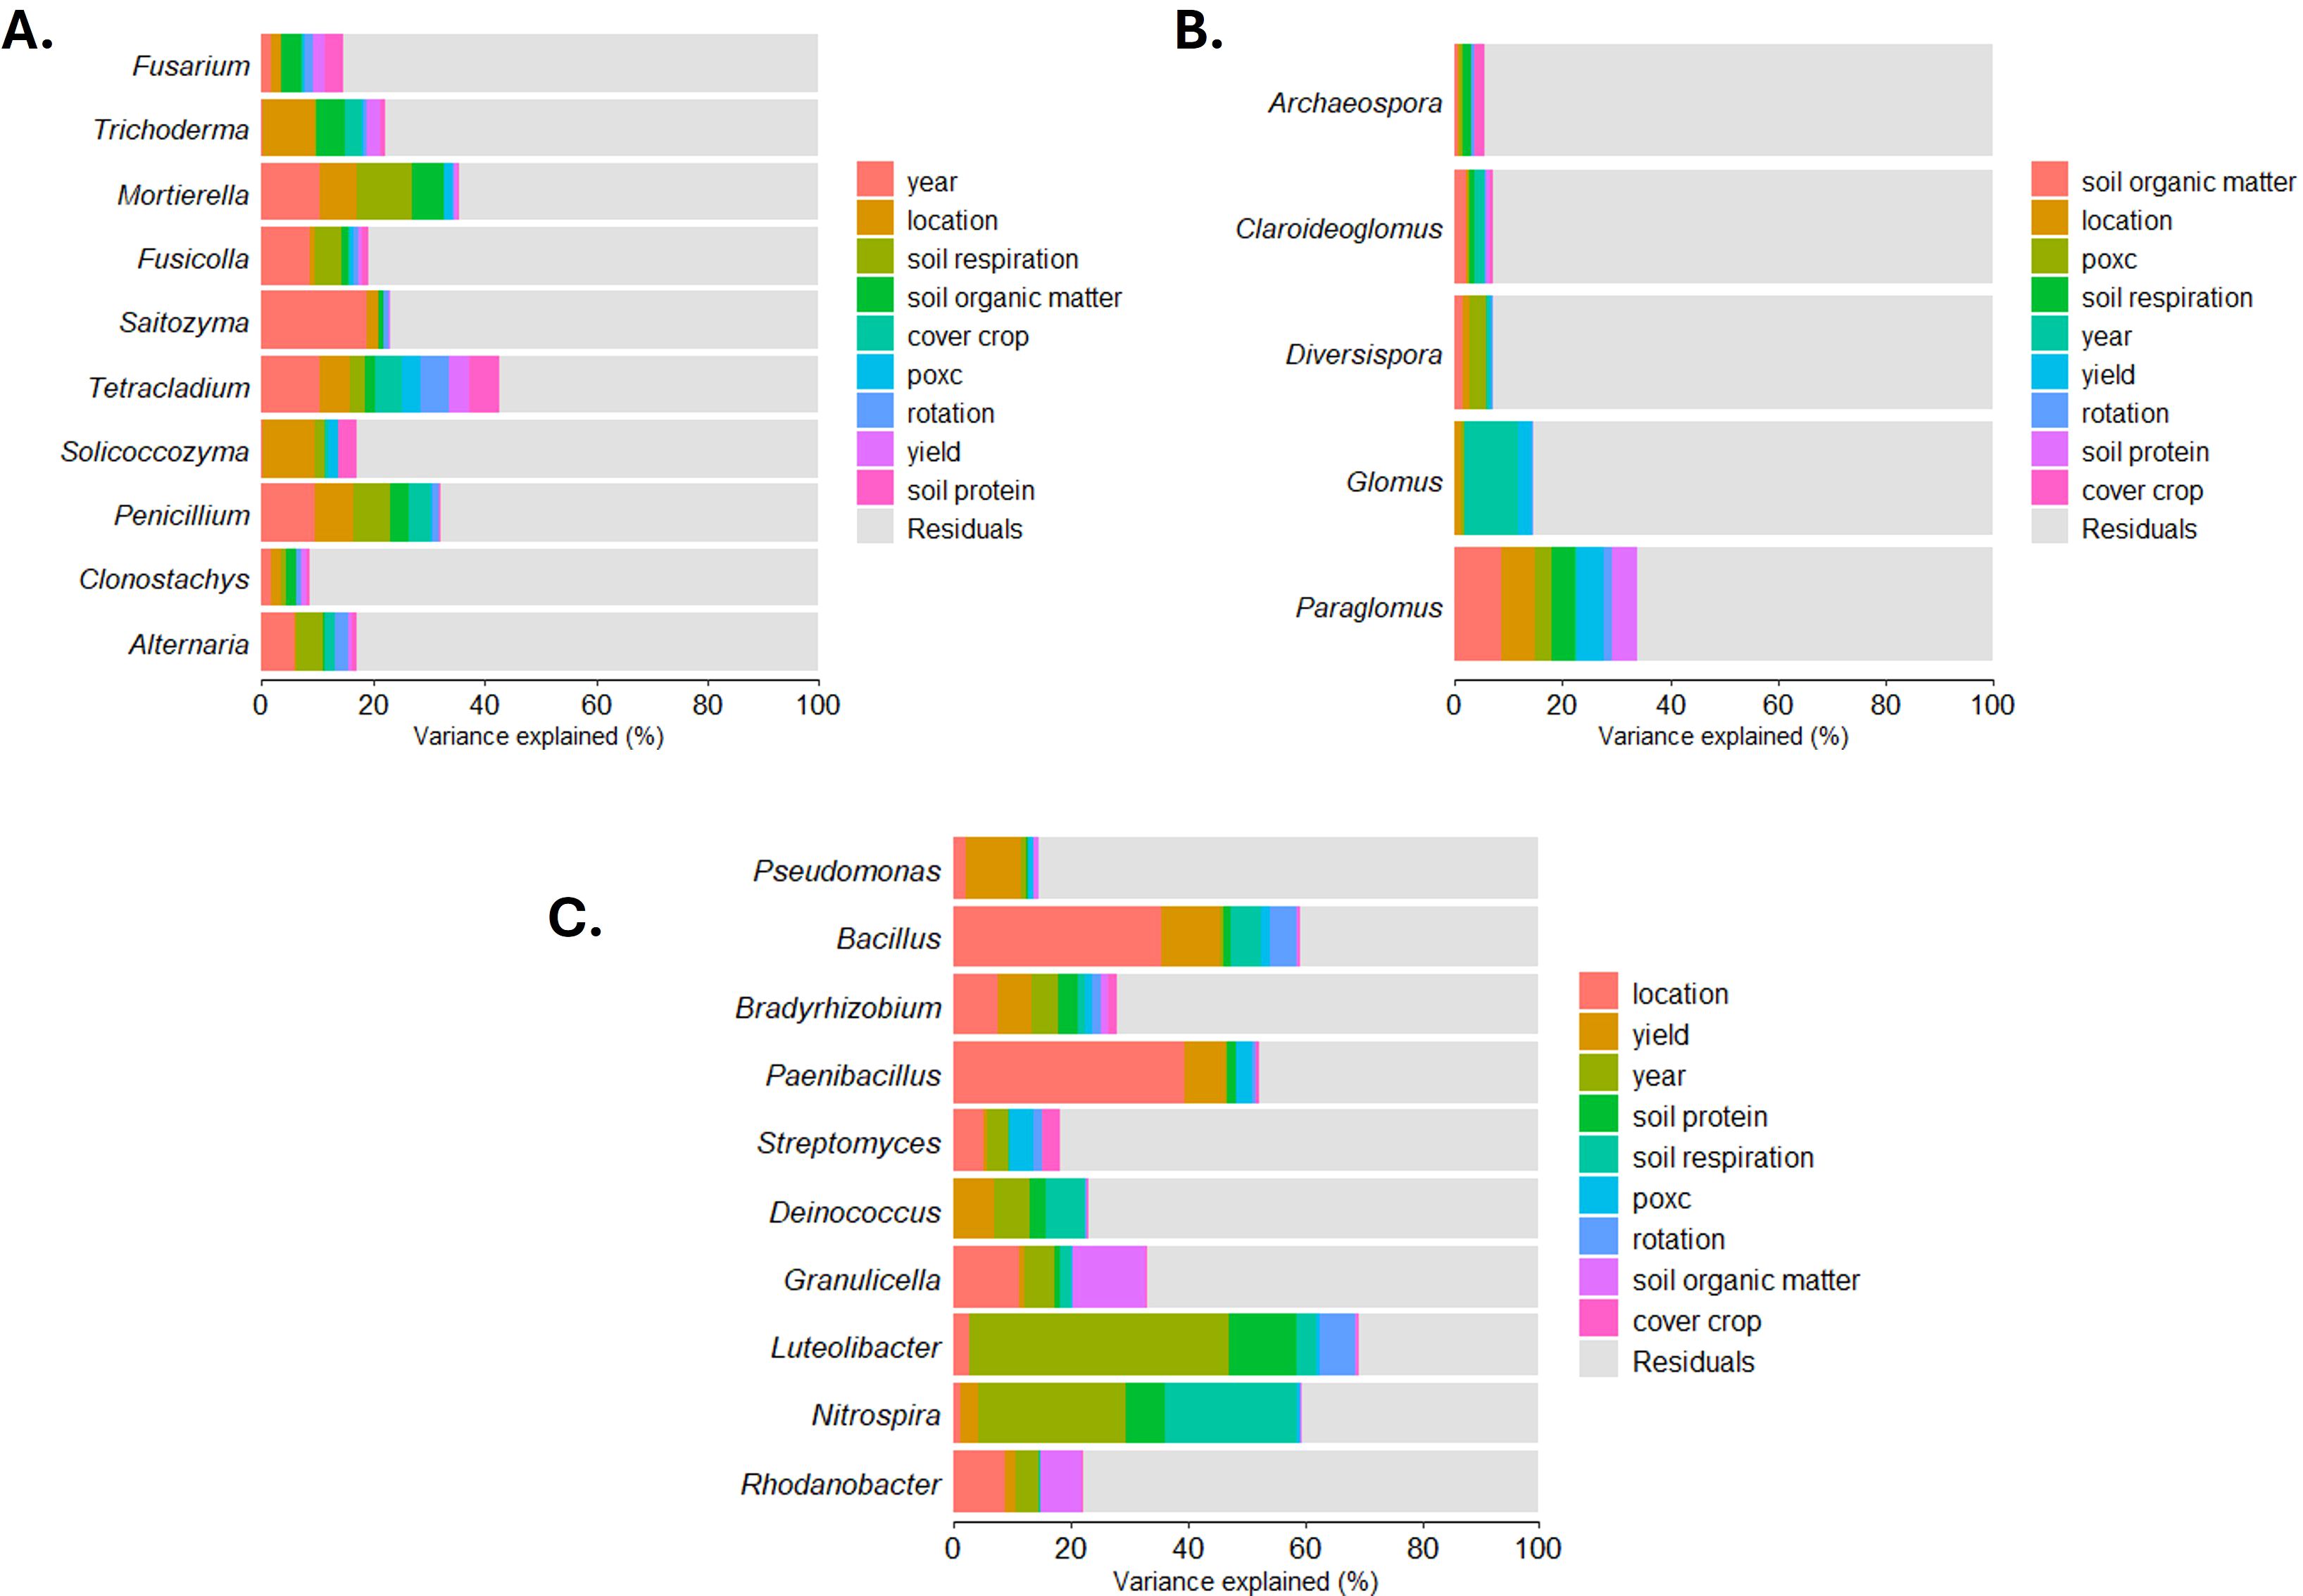
Figure 7. Sources of variation in amplicon sequencing variant (ASV) counts for selected fungal (A), arbuscular mycorrhizal fungal (B), and bacterial (C) genera. CS, corn-soybean rotation; CSW, corn-soybean-wheat rotation; WARS, Western Agricultural Research Station; NWARS, Northwestern Agricultural Research Station.
Bayesian analysis
A zero-inflated Dirichlet-multinomial linear regression model correcting with Bayesian variable selection (110), identified subsets of fungal, AM fungal, and bacterial genera associated with the measured environmental and soil covariates. Model convergence and covariate inclusion using a marginal posterior probability of inclusion (MPPI) are shown in Supplementary Figures S16 and S17. The following associations were identified for fungal genera at a cutoff of 0.5 MPPI (Figure 8A): Fusarium was positively associated with clay soils; Saitozyma was positively associated with higher air temperatures; and Tetracladium was associated with higher soil temperatures. AM fungal genera Claroideoglomus and Paraglomus were associated with higher air temperatures, and Glomus was associated with 2022 (Figure 8B). Several associations were identified for bacterial genera at a cutoff of 0.45 MPPI (Figure 8C). Acidothermus was positively associated with the no cover crop control and the rye cover crop treatment, location, and weakly positively associated with soil protein. Bacillus was positively associated with soil sand content and 2022 and negatively associated with air temperature and rain. Gemmatimonas were positively associated with clay content and 2021 and negatively associated with sand content, WARS, and air temperature. Luteobacter was positively associated with air temperature.
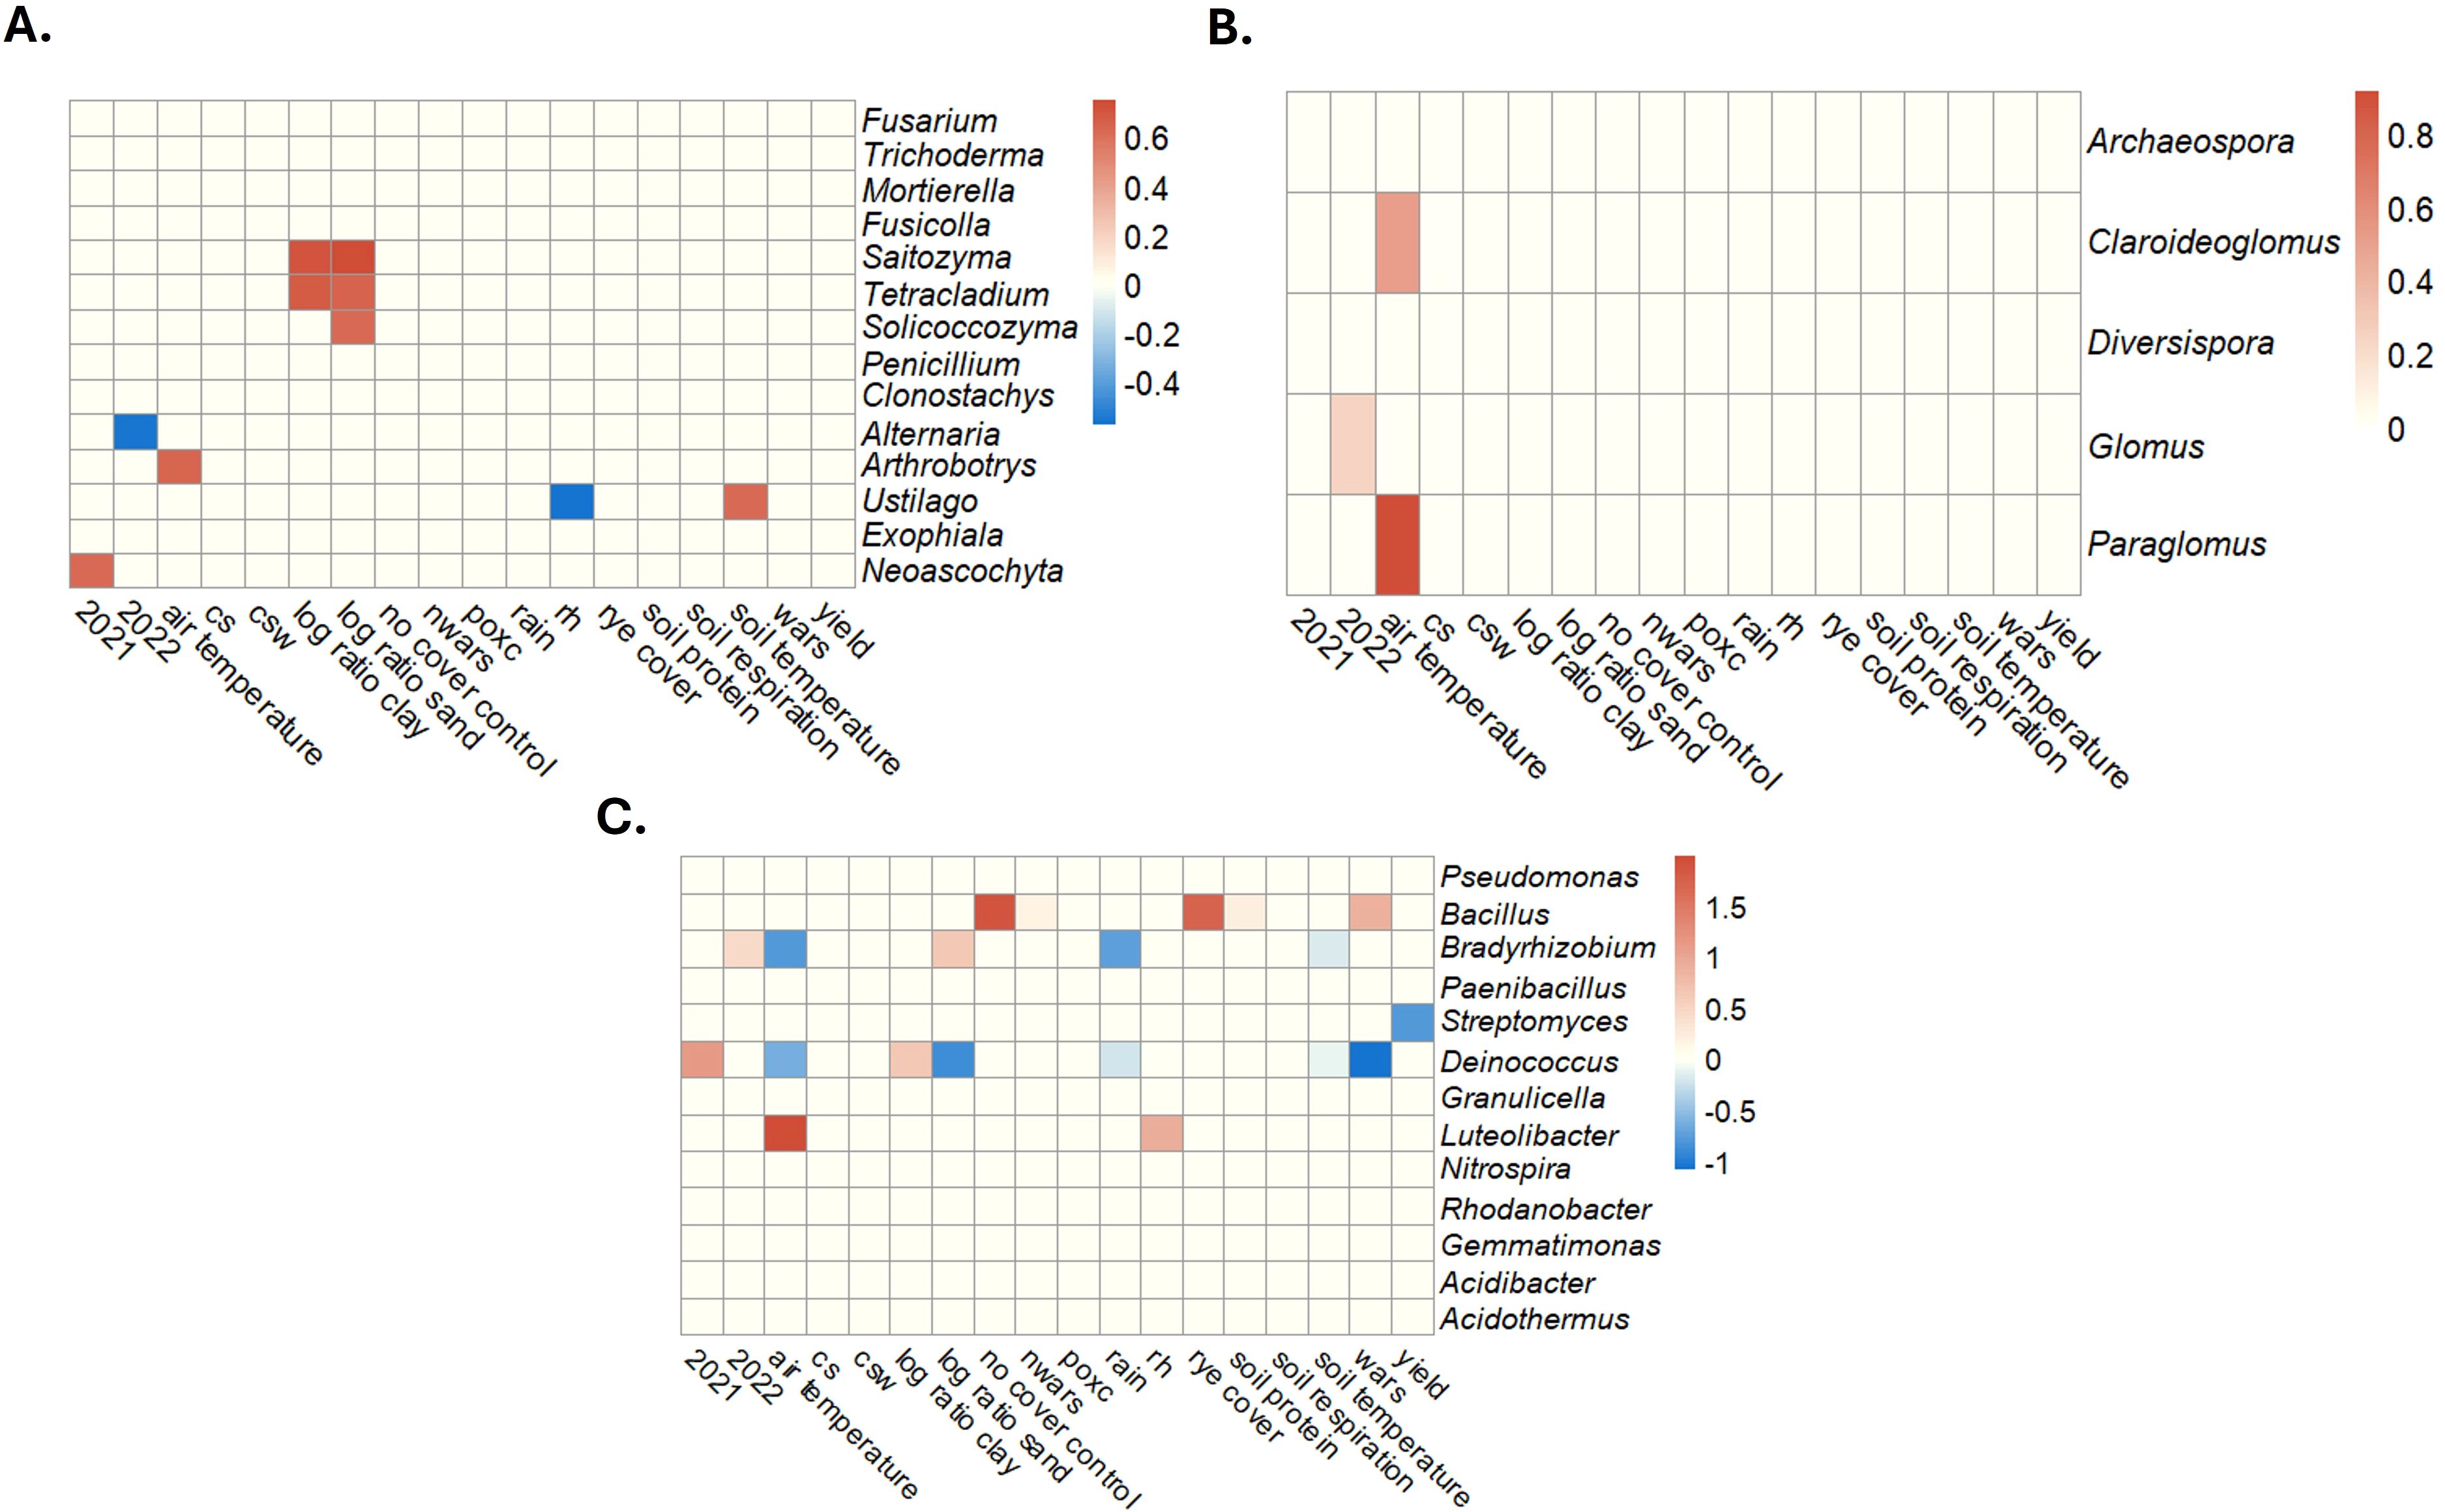
Figure 8. Soil physical and health parameters identified as being associated with relative taxa abundances using a Bayesian zero-inflated Dirichlet-multinomial regression model with variable selection for fungi (A), arbuscular mycorrhizal fungi (B), and bacteria (C). The scale represents the magnitude of the effect a 1-unit increase in the standardized variable would have on relative taxa abundances. As values approach darker red, there is more of a positive effect (increased taxon abundance), and as values approach darker blue, there is more of a negative response (decreased taxon abundance). CS, corn-soybean rotation; CSW, corn-soybean-wheat rotation; WARS, Western Agricultural Research Station; NWARS, Northwestern Agricultural Research Station.
Discussion
The current paper builds upon previous studies of a long-term experiment on crop rotation by expanding the rotation’s diversity due to adding a rye cover crop before soybean (20–22). There were no significant changes in soybean yield in the two years after adding the cover crop. Soybean yield was stable between 2018-2022. This yield stability is consistent with our hypothesis that adding a rye cover crop to a CSW rotation before soybean will not decrease soybean productivity. Previous studies have reported mixed effects of the impact of rye cover crops on soybean crops. Overmyer et al. (29) found that a rye/oat cover crop positively affected soybean yield in Ohio when combined with late cover crop termination. Early sowing of soybeans after rye termination significantly negatively affected soybean yield, while later planting dates did not impact yield (113). Other studies have shown no impact (25) or a negative effect (58, 114) on soybean yield. Rye cover crops may not impact overall soybean productivity but do have other positive benefits that may warrant their addition to rotations, including helping to deal with excess nitrogen (115), nitrogen runoff (116, retention of soil moisture (25), and weed suppression (117). Another possibility is that any positive changes that may be achieved with the cover crop may not have had time to establish after one cycle, and any impact on yield may lag beyond that even further (118). Many studies showing the positive benefits of cover crops looked at the situation in the timeframe of a decade after the implementation of the cover crop, while our study has undergone just one cycle (25).
The current study did not detect any further improvements in soil health indicators since the 2019 measurements; any subsequent effects of the rotations were not detected with the measured parameters, with SOM significantly decreasing at WARS in 2022. Some changes were observed with the addition of the cover crop treatment, including a significant decrease in POXC at NWARS in 2022, an increase in soil protein at WARS in 2022, and a decrease in SOM at NWARS in 2021. POXC and SOM were measured at each site over the five years the plots have been monitored. There was a consistent trend of decline in POXC levels after the addition of the cover crops. POXC measurements declined by over 200% at both sites between 2020 and 2022 and although declines were seen in treatments with and without cover crops, the decline in the cover crops was higher. This contrasts with our hypothesis that adding the cover crop would positively affect soil health qualities, including POXC, soil protein, soil respiration, and SOM. The CSW rotation had previously been observed to increase SOM at one of our sites (20), and this has also been observed in other studies utilizing a rye cover crop in a shorter rotation (119). It also contrasts with other studies that have reported increased (120) or no impact of cover crop on POXC (121). The impacts on POXC were unlikely due to changes in weather, as temperature and precipitation trends at both sites have been stable throughout the last five years and are within the climate norms for the region. There may be changes in how carbon is partitioned after adding the cover crops, with carbon cycling out of the POXC fraction and into another (122). Five-year trends in SOM have been relatively consistent at the studied sites, starting at around 5% at both sites in 2018 and still around 5% in 2022. Tyler (58) reported increased SOM by adding cover crops. We did not observe any changes with rotation or cover crops in the present study. Previous studies looking at diversified rotations (123) and cover crops (56) have reported increases in soil carbon. However, we did not observe any consistent changes in soil respiration in these plots. Positive changes in soil health metrics due to cover crops may take more years to stabilize or may be buffered by the soil at our locations (124). We may not have seen these changes after the initial year of cover crop introduction due to the buffering effects of soil, the large influence of the cash crop, or our application of no-till. Alternatively it is possible that these are not the right indicators for detecting the impact of the cover crop. Other indicators for soil health that have been proposed for measuring impacts of management changes, including cover cropping, include soil organic carbon (125), bulk density, soil structure (55), and microbial biomass carbon (126).
Location was the dominant driver of any differences observed in our microbial communities. Although there were changes in the abundance of individual bacterial, fungal, and AM fungal ASVs observed using DESeq2 analysis, few of these patterns were consistent year-over-year. Fusarium ASVs were more abundant in the CS rotation in 2021, although this pattern was not repeated in 2022. We had previously identified Fusarium as an indicator species of the CS rotation in 2018 and 2019 (22) along with other potential plant pathogens (Neoascochyta and Aphanomyces). However, these differences could be due to differences in the indicator species and DeSeq analysis. In the first year of the rye treatment, rye did not influence overall Fusarium reads. However, several individual Fusarium ASVs were higher in either the no cover crop control or the rye treatment; perhaps the impact on Fusarium will only be observed after several years of the cover crop treatment. Differences in individual AM fungal genera were challenging to parse, as many ASVs are identified to the same genus, and most of these genera have ASVs that are differentially abundant in both rotation and cover crop treatments. The resolution of our analysis may not be sufficient to track these changes, or a more detailed analysis of individual ASVs may be required to identify oligotypes that could be grouped together. A few ASVs were differentially abundant, including multiple Clairoideoglomus ASVs in the CS and CSW rotation in 2021 and 2022, a single Diversispora ASV in the CSW rotation, and the no cover crop control in 2021. AM fungi are important to promote in soil as they are known to assist crop species in resisting environmental stress. This has been shown in Clairoideoglomus (127) and other species (128). They are also known to help plants acquire phosphorous; this has been shown in Diversispora (129) and other species (130). Bacterial communities contained very few differentially abundant species, indicating little impact of the rotation or cover crop treatment on bacterial communities. Although there was some variation in core taxa by site, there was minimal variation in core taxa over rotational or cover crop treatments. Overall, the microbial community results are consistent with our hypothesis that adding the cover crop would impact fungal, AM fungal, and bacterial communities. Microbiome variation is often driven by regional differences in climate and soil (131). Cover crops have been reported to influence soil fungal communities (132), AM fungal communities (133), and soil bacterial communities (134).
Location and year were consistently the highest contributors to the variance of different genera of fungi and bacteria. Soil respiration explained 20% of variance in Nitrospira sp. bacteria. Nitrospira is involved in nitrogen transformation in soil (135) and so plays a role in N availability in soil, which can, in turn, affect respiration (136). Rotation was a source of variance in Bacillus and Luteolibacter. Management choices that increase these species should be considered as both are potential plant symbionts (137), and Bacillus are notably well characterized for their plant growth promotion (138) and disease suppression activity (139). In fungi, soil respiration contributed about 5% of the variation to Mortierella and Penicillium. Mortierella and Penicillium are common soil fungi involved in ecosystem services (140) and plant growth promotion (141). Cover crops were a small but significant (4%) contributor to variance in Tetracladium. Tetracladium are most well known as root endophytes and are known to assist with phosphate solubilization (142). Bayesian association analysis also identified possible covariates that are important for these genera. These results are consistent with our hypothesis that changes in microbial communities would be associated with soil health changes we observed. Microbial communities are associated with changes in many soil health indicators (60).
We combined and averaged ASVs from modules identified by network analysis for an alternative attempt understanding whether groups of associated fungi or bacteria impact soybean yield or soil health properties While many of these modules showed slight or insignificant correlations with yield and soil health parameters, some showed potential trends. Several modules from the 2021 fungal network analysis showed a consistent positive trend with increasing POXC. These modules were dominated by a few ASVs, particularly an ASV identified as Ustilago. Ustilago is a common plant pathogen that is the causal organism of smut disease on aerial portions of maize. There is evidence that Ustilago can also infect the roots of some plants (143), and at least its teliospores are soil-borne. Although Ustilago is known to manipulate plant carbon metabolism in above-ground portions of the plant (144), there is no known connection to soil carbon. In 2022, another consistent trend was an increase in almost all bacterial network modules as soil protein and respiration increased. Bacteria contribute to carbon and nitrogen dynamics in soil (145).
Any changes or lack thereof in soil health and microbial communities must be discussed in the context that the current study looked at the first year after implementing the cover crop plots. It may take up to 10 years before significant changes are observed after implementing a change in agricultural practices (25, 146). The diversified rotation reached 10 years in the field in 2024, while the cover crop will have completed two repetitions only in each plot at the time of publication. The decision to include no-till as a part of this rotation and cover crop scheme likely contributed to the lack of impact the treatments had on yield, as no-till is known to widely impact yield and soil health (147). Another pitfall in this experiment is related to the differences in the structure of microbial networks generated across the years. Although the library preperation and sequencing were done by the same facility, and using the same primers, coverage from each experiment was different. This likely contributes to some variation between years in our experiments.
In conclusion, the initial impact on soil health and soil microbial communities of a rye cover crop interjected into an established no-till rotation was minimal. Location, encompassing site-specific weather and soil qualities, seems to be a more critical factor in determining microbial communities (148). Any potential benefits of adding a cover crop to a CSW rotation may not be observed soon after the initial intervention. Thus, multiple years of implementing cover cropping may be needed before observing any benefits in soil health. This will have to be considered when calculating the economic cost of such a change in management strategy. However, there are other benefits that we did not measure here, such as improvements in N runoff and weed suppression, which may increase the economic viability of cover crops in CSW production.
Data availability statement
The datasets presented in this study can be found in online repositories. The names of the repository/repositories and accession number(s) can be found below: https://www.ncbi.nlm.nih.gov/, PRJNA1190478.
Author contributions
TF: Data curation, Formal analysis, Investigation, Methodology, Software, Visualization, Writing – original draft, Writing – review & editing, Conceptualization. DS: Formal analysis, Methodology, Software, Visualization, Writing – original draft, Writing – review & editing, Conceptualization. LL: Conceptualization, Project administration, Writing – review & editing, Methodology, Investigation. CS: Conceptualization, Investigation, Methodology, Resources, Writing – review & editing. HL-N: Formal analysis, Writing – review & editing. MB: Conceptualization, Funding acquisition, Investigation, Methodology, Project administration, Resources, Supervision, Writing – original draft, Writing – review & editing.
Funding
The author(s) declare that financial support was received for the research, authorship, and/or publication of this article. The Ohio Soybean Council (22-R-25 and 21-R-02), USDA NIFA Hatch grants OHO01456 and OHO01569.
Acknowledgments
The team would like to thank Matt Davis and Joe Davlin for farm management. We want to thank Leslie Taylor, Branden Ritter, Melanie Medina Lopez, Fiama Guevara, Gustavo Garay, and Ananiah Cohen for their help with sample collection and processing. We want to thank Leslie Taylor for processing and measurement of soil protein, soil respiration and SOM. We want to thank Meredith Mann for the measurement of POXC. We would also like to thank Jelmer Poelstra, Melanie Medina Lopez, and Fiama Guevara for helping with data analysis decisions and programming troubleshooting in Unix shell and R. We would like to thank Melissa Smith and Elizabeth Hudson at the University of Louisville for sequencing and library prep troubleshooting for the long read fungal samples. We thank Wirat Pipatpongpinyo at the OSU MCIC for helping with bacterial sequencing and library prep. We want to thank Melanie Medina Lopez, Gustavo Garay, Ananiah Cohen, and Nina Ward for their helpful comments on the presentation of the figures. Finally, we thank Sunny Park at the OSU Service Testing and Research Lab for conducting soil analyses.
Conflict of interest
The authors declare that the research was conducted in the absence of any commercial or financial relationships that could be construed as a potential conflict of interest.
Generative AI statement
The author(s) declare that no Generative AI was used in the creation of this manuscript.
Publisher’s note
All claims expressed in this article are solely those of the authors and do not necessarily represent those of their affiliated organizations, or those of the publisher, the editors and the reviewers. Any product that may be evaluated in this article, or claim that may be made by its manufacturer, is not guaranteed or endorsed by the publisher.
Supplementary material
The Supplementary Material for this article can be found online at: https://www.frontiersin.org/articles/10.3389/fsoil.2025.1535734/full#supplementary-material
References
1. Pieters AJ. Green manuring: principles and practice. New York: J. Wiley & sons, Incorporated (1927).
2. Magdoff F, Van Es HM. Cover crops. In: Building Soils for Better Crops. SARE, College Park, MD (2021). p. 137–55.
3. Wallander S, Smith D, Bowman M, Claassen R. Cover crop trends, programs, and practices in the United States. In: Economic Information Bulletin, EIB-222. Department of Agriculture, Economic Research Service, Washington, DC (2021). doi: 10.22004/ag.econ.309562
4. Chen L, Rejesus RM, Aglasan S, Hagen SC, Salas W. The impact of cover crops on soil erosion in the US Midwest. J Environ Manage. (2022) 324:116168. doi: 10.1016/j.jenvman.2022.116168
5. Plaza-Bonilla D, Nolot J-M, Raffaillac D, Justes E. Cover crops mitigate nitrate leaching in cropping systems including grain legumes: field evidence and model simulations. Agricult. Ecosyst Environ. (2015) 212:1–12. doi: 10.1016/j.agee.2015.06.014
6. Yu Y, Loiskandl W, Kaul H-P, Himmelbauer M, Wei W, Chen L, et al. Estimation of runoff mitigation by morphologically different cover crop root systems. J Hydrol. (2016) 538:667–76. doi: 10.1016/j.jhydrol.2016.04.060
7. Danne A, Thomson LJ, Sharley DJ, Penfold CM, Hoffmann AA. Effects of native grass cover crops on beneficial and pest invertebrates in Australian vineyards. Environ Entomol. (2010) 39:970–8. doi: 10.1603/EN09144
8. Hallama M, Pekrun C, Pilz S, Jarosch KA, Frąc M, Uksa M, et al. Interactions between cover crops and soil microorganisms increase phosphorus availability in conservation agriculture. Plant Soil. (2021) 463:307–28. doi: 10.1007/s11104-021-04897-x
9. Bowers C, Toews M, Liu Y, Schmidt JM. Cover crops improve early season natural enemy recruitment and pest management in cotton production. Biol Control. (2020) 141:104149. doi: 10.1016/j.biocontrol.2019.104149
10. USDA NASS. Quick stats (2021). USDA. Available online at: https://data.nal.usda.gov/dataset/nass-quick-stats (Accessed October 1, 2024).
11. Zhou Q, Guan K, Jiang C, Huang Y, Peng B, Chen Z, et al. Recent rapid increase of cover crop adoption across the U.S. Midwest detected by fusing multi-source satellite data. Geophys. Res Lett. (2022) 49:e2022GL100249. doi: 10.1029/2022GL100249
12. Shrestha RK, Richer E, Clevenger WB, Davis M, Lindsey LE. Effect of mono-, relay-, and double-crop systems on yield and profitability. Agron J. (2021) 113:1747–57. doi: 10.1002/agj2.20598
13. Socolar Y, Goldstein BR, Valpine P, Bowles TM. Biophysical and policy factors predict simplified crop rotations in the US Midwest. Environ Res Lett. (2021) 16:054045. doi: 10.1088/1748-9326/abf9ca
14. Weisberger DA, McDaniel MD, Arbuckle JG, Liebman M. Farmer perspectives on benefits of and barriers to extended crop rotations in Iowa, USA. Agric Environ Lett. (2021) 6:e20049. doi: 10.1002/ael2.20049
15. Aguilar J, Gramig GG, Hendrickson JR, Archer DW, Forcella F, Liebig MA. Crop species diversity changes in the United States: 1978–2012. PloS One. (2015) 10:e0136580. doi: 10.1371/journal.pone.0136580
16. Congreves KA, Hayes A, Verhallen EA, Van Eerd LL. Long-term impact of tillage and crop rotation on soil health at four temperate agroecosystems. Soil Tillage Res. (2015) 152:17–28. doi: 10.1016/j.still.2015.03.012
17. McDaniel MD, Tiemann LK, Grandy AS. Does agricultural crop diversity enhance soil microbial biomass and organic matter dynamics? A meta-analysis Ecol Appl. (2014) 24:560–70. doi: 10.1890/13-0616.1
18. Venter ZS, Jacobs K, Hawkins H-J. The impact of crop rotation on soil microbial diversity: A meta-analysis. Pedobiologia. (2016) 59:215–23. doi: 10.1016/j.pedobi.2016.04.001
19. Basche A, DeLonge M. The impact of continuous living cover on soil hydrologic properties: A meta-analysis. Soil Sci Soc Amer. J. (2017) 81:1179–90. doi: 10.2136/sssaj2017.03.0077
20. Huo D, Frey T, Lindsey LE, Benitez M. Yield and soil responses to adding wheat to a corn–soybean rotation. Crop Forage Turfgrass Mgmt. (2022) 8:e20143. doi: 10.1002/cft2.20143
21. Huo D, Malacrinò A, Lindsey LE, Benitez M-S. Subtle responses of soil bacterial communities to corn-soybean-wheat rotation. Phytobiomes J. (2023) 7:392–400. doi: 10.1094/PBIOMES-05-22-0032-R
22. Frey TS, Huo D, Lopez MM, Ritter B, Lindsey LE, Ponce MSB. Fungal communities associated with corn in a diverse long-term crop rotation in Ohio. PhytoFrontiers™ PHYTOFR-07-23-0091-R. (2024) 4(2):183–95. doi: 10.1094/PHYTOFR-07-23-0091-R
23. Mischler RA, Curran WS, Duiker SW, Hyde JA. Use of a rolled-rye cover crop for weed suppression in no-till soybeans. Weed Technol. (2010) 24:253–61. doi: 10.1614/WT-D-09-00004.1
24. Waring ER, Lagzdins A, Pederson C, Helmers MJ. Influence of no-till and a winter rye cover crop on nitrate losses from tile-drained row-crop agriculture in Iowa. J Environ Qual. (2020) 49:292–303. doi: 10.1002/jeq2.20056
25. Basche AD, Archontoulis SV, Kaspar TC, Jaynes DB, Parkin TB, Miguez FE. Simulating long-term impacts of cover crops and climate change on crop production and environmental outcomes in the Midwestern United States. Agricult. Ecosyst Environ. (2016) 218:95–106. doi: 10.1016/j.agee.2015.11.011
26. Lewis KL, Burke JA, Keeling WS, McCallister DM, DeLaune PB, Keeling JW. Soil benefits and yield limitations of cover crop use in Texas High Plains cotton. Agron J. (2018) 110:1616–23. doi: 10.2134/agronj2018.02.0092
27. Eckert DJ. Chemical attributes of soils subjected to no-till cropping with rye cover crops. Soil Sci Soc America J. (1991) 55:405. doi: 10.2136/sssaj1991.03615995005500020019x
28. Hanrahan BR, King KW, Duncan EW, Shedekar VS. Cover crops differentially influenced nitrogen and phosphorus loss in tile drainage and surface runoff from agricultural fields in Ohio, USA. J Environ Manage. (2021) 293:112910. doi: 10.1016/j.jenvman.2021.112910
29. Overmyer K, Looker W, Dorrance AE, Tilmon KJ, Lindsey LE. Influence of rye/oat cover crop in a two-year soybean production system. Agron J. (2023) 115:303–13. doi: 10.1002/agj2.21244
30. Mukherjee A, Lal R. Short-term effects of cover cropping on the quality of a Typic Argiaquolls in Central Ohio. Catena. (2015) 131:125–9. doi: 10.1016/j.catena.2015.02.025
31. Hurisso TT, Moebius-Clune DJ, Culman SW, Moebius-Clune BN, Thies JE, Van Es HM. Soil protein as a rapid soil health indicator of potentially available organic nitrogen. Agric Env Lett. (2018) 3:180006. doi: 10.2134/ael2018.02.0006
32. Naasko K, Martin T, Mammana C, Murray J, Mann M, Sprunger C. Soil protein: A key indicator of soil health and nitrogen management. Soil Sci Soc Amer. J. (2024) 88:89–108. doi: 10.1002/saj2.20600
33. Gatica-Saavedra P, Aburto F, Rojas P, Echeverría C. Soil health indicators for monitoring forest ecological restoration: a critical review. Restor Ecol. (2023) 31:e13836. doi: 10.1111/rec.13836
34. Hawkes CV, Waring BG, Rocca JD, Kivlin SN. Historical climate controls soil respiration responses to current soil moisture. Proc Natl Acad Sci USA. (2017) 114:6322–7. doi: 10.1073/pnas.1620811114
35. Benbi DK, Toor AS, Brar K, Dhall C. Soil respiration in relation to cropping sequence, nutrient management and environmental variables. Arch Agron Soil Sci. (2020) 66:1873–87. doi: 10.1080/03650340.2019.1701188
37. Nichols KA, Wright SF. Carbon and nitrogen in operationally defined soil organic matter pools. Biol Fertil. Soils. (2006) 43:215–20. doi: 10.1007/s00374-006-0097-2
38. Celi L, Said-Pullicino D, Bol R, Lang F, Luster J. Interconnecting soil organic matter with nitrogen and phosphorous cycling. In: Multi-Scale Biogeochemical Processes in Soil Ecosystems. Hoboken, NJ, USA: Wiley (2022). p. 51–77. doi: 10.1002/9781119480419.ch3
39. Lal R. Soil organic matter and water retention. Agron J. (2020) 112:3265–77. doi: 10.1002/agj2.20282
40. Abiven S, Menasseri S, Chenu C. The effects of organic inputs over time on soil aggregate stability–A literature analysis. Soil Biol Biochem. (2009) 41:1–12. doi: 10.1016/j.soilbio.2008.09.015
41. Christy I, Moore A, Myrold D, Kleber M. A mechanistic inquiry into the applicability of permanganate oxidizable carbon as a soil health indicator. Soil Sci Soc America J. (2023) 87:1083–95. doi: 10.1002/saj2.20569
42. Schmidt R, Gravuer K, Bossange AV, Mitchell J, Scow K. Long-term use of cover crops and no-till shift soil microbial community life strategies in agricultural soil. PloS One. (2018) 13:e0192953. doi: 10.1371/journal.pone.0192953
43. Jiao S, Peng Z, Qi J, Gao J, Wei G. Linking bacterial-fungal relationships to microbial diversity and soil nutrient cycling. mSystems. (2021) 6:e01052–e01020. doi: 10.1128/msystems.01052-20
44. Verbruggen E, Kiers ET, Bakelaar PN, Röling WF, van der Heijden MG. Provision of contrasting ecosystem services by soil communities from different agricultural fields. Plant Soil. (2012) 350:43–55. doi: 10.1007/s11104-011-0828-5
45. Bhattacharyya SS, Ros GH, Furtak K, Iqbal HM, Parra-Saldívar R. Soil carbon sequestration–An interplay between soil microbial community and soil organic matter dynamics. Sci Total Environ. (2022) 815:152928. doi: 10.1016/j.scitotenv.2022.152928
46. Latz E, Eisenhauer N, Rall BC, Allan E, Roscher C, Scheu S, et al. Plant diversity improves protection against soil-borne pathogens by fostering antagonistic bacterial communities. J Ecol. (2012) 100:597–604. doi: 10.1111/j.1365-2745.2011.01940.x
47. Philippot L, Chenu C, Kappler A, Rillig MC, Fierer N. The interplay between microbial communities and soil properties. Nat Rev Microbiol. (2024) 22:226–39. doi: 10.1038/s41579-023-00980-5
48. Schmidt R, Mitchell J, Scow K. Cover cropping and no-till increase diversity and symbiotroph: saprotroph ratios of soil fungal communities. Soil Biol Biochem. (2019) 129:99–109. doi: 10.1016/j.soilbio.2018.11.010
49. Muhammad I, Wang J, Sainju UM, Zhang S, Zhao F, Khan A. Cover cropping enhances soil microbial biomass and affects microbial community structure: A meta-analysis. Geoderma. (2021) 381:114696. doi: 10.1016/j.geoderma.2020.114696
50. Fierer N, Wood SA, Bueno de Mesquita CP. How microbes can, and cannot, be used to assess soil health. Soil Biol Biochem. (2021) 153:108111. doi: 10.1016/j.soilbio.2020.108111
51. Sprunger CD, Martin TK. Chapter Three - An integrated approach to assessing soil biological health. In: Advances in Agronomy. Academic Press, Amsterdam, Netherlands (2023). p. 131–68. doi: 10.1016/bs.agron.2023.06.003
52. Fierer N, Lauber CL, Ramirez KS, Zaneveld J, Bradford MA, Knight R. Comparative metagenomic, phylogenetic and physiological analyses of soil microbial communities across nitrogen gradients. ISME J. (2012) 6:1007–17. doi: 10.1038/ismej.2011.159
53. Figuerola ELM, Guerrero LD, Türkowsky D, Wall LG, Erijman L. Crop monoculture rather than agriculture reduces the spatial turnover of soil bacterial communities at a regional scale. Environ Microbiol. (2015) 17:678–88. doi: 10.1111/1462-2920.12497
54. Wagner-Riddle C, Gillespie TJ, Swanton CJ. Rye cover crop management impact on soil water content, soil temperature and soybean growth. Can J Plant Sci. (1994) 74:485–95. doi: 10.4141/cjps94-089
55. Koudahe K, Allen SC, Djaman K. Critical review of the impact of cover crops on soil properties. Int Soil Water Conserv Res. (2022) 10:343–54. doi: 10.1016/j.iswcr.2022.03.003
56. Romdhane S, Spor A, Busset H, Falchetto L, Martin J, Bizouard F, et al. Cover crop management practices rather than composition of cover crop mixtures affect bacterial communities in no-till agroecosystems. Front Microbiol. (2019) 10:1618. doi: 10.3389/fmicb.2019.01618
57. Pantoja JL, Woli KP, Sawyer JE, Barker DW. Winter rye cover crop biomass production, degradation, and nitrogen recycling. Agron J. (2016) 108:841–53. doi: 10.2134/agronj2015.0336
58. Tyler HL. Single-versus double-species cover crop effects on soil health and yield in Mississippi soybean fields. Agronomy. (2021) 11:2334. doi: 10.3390/agronomy11112334
59. Thapa VR, Ghimire R, Acosta-Martínez V, Marsalis MA, Schipanski ME. Cover crop biomass and species composition affect soil microbial community structure and enzyme activities in semiarid cropping systems. Appl Soil Ecol. (2021) 157:103735. doi: 10.1016/j.apsoil.2020.103735
60. Rousk J, Frey SD. Revisiting the hypothesis that fungal-to-bacterial dominance characterizes turnover of soil organic matter and nutrients. Ecol Monogr. (2015) 85:457–72. doi: 10.1890/14-1796.1
61. Barker DJ, Culman S, Dorrance AE, Fulton J, Haden R, Lentz E, et al. The Ohio Agronomy Guide. 15th ed. Columbus, OH: Ohio State University Extension (2017). Bulletin no.472.
62. Fehr WR, Caviness CE, Burmood DT, Pennington JS. Stage of development descriptions for soybeans, Glycine max (L.) merrill 1. Crop Sci. (1971) 11:929–31. doi: 10.2135/cropsci1971.0011183X001100060051x
63. Dick WA, McCoy EL, Edwards WM, Lal R. Continuous application of no-tillage to Ohio soils. Agron J. (1991) 83:65–73. doi: 10.2134/agronj1991.00021962008300010017x
64. Culman SW. Protocol - Procedure for the Determination of Permanganate Oxidizable Carbon (2017). Available online at: https://lter.kbs.msu.edu/protocols/133 (Accessed January 19, 2024).
65. Combs M, Nathan MV. Soil organic matter. In: Recommended chemical soil test procedures for the North Central Region. University of Missouri, Columbia, MO (1998). p. 53–8.
66. Moebius-Clune BN, Moebius-Clune DJ, Gugino BK, Idowu OJ, Schindelbeck RR, Ristow AJ, et al. Comprehensive Assessment of Soil Health - The Cornell Framework. Ithaca, NY: Cornell University Press (2016).
67. Abramoff M, Magalhães P, Ram SJ. Image processing with imageJ. Biophotonics Int. (2003) 11:36–42.
68. Gardes M, Bruns TD. ITS primers with enhanced specificity for basidiomycetes - application to the identification of mycorrhizae and rusts. Mol Ecol. (1993) 2:113–8. doi: 10.1111/j.1365-294X.1993.tb00005.x
69. White T, Bruns T, Lee S, Taylor J, Innis M, Gelfand D, et al. Amplification and direct sequencing of fungal ribosomal RNA genes for phylogenetics. In: Pcr Protocols: A Guide to Methods and Applications. Amsterdam, Netherlands: Elsevier Science (1990). p. 315–22.
70. Lee J, Lee S, Young JPW. Improved PCR primers for the detection and identification of arbuscular mycorrhizal fungi. FEMS Microbiol Ecol. (2008) 65:339–49. doi: 10.1111/j.1574-6941.2008.00531.x
71. Pacific BioSciences. Procedure & Checklist - Preparing SMRTbell® Libraries using PacBio Barcoded Universal Primers for Multiplexing Amplicons (2020). Available online at: https://scholar.google.com/scholar?hl=en&as_sdt=0%2C36&q=Procedure+%26+Checklist+-+Preparing+SMRTbell%C2%AE+Libraries+using+PacBio%C2%AE+Barcoded+Universal+Primers+for+Multiplexing+Amplicons&btnG (Accessed October 23, 2024).
72. Apprill A, McNally S, Parsons R, Weber L. Minor revision to V4 region SSU rRNA 806R gene primer greatly increases detection of SAR11 bacterioplankton. Aquat Microbial Ecol. (2015) 75:129–37. doi: 10.3354/ame01753
73. Caporaso JG, Lauber CL, Walters WA, Berg-Lyons D, Lozupone CA, Turnbaugh PJ, et al. Global patterns of 16S rRNA diversity at a depth of millions of sequences per sample. Proc Natl Acad Sci USA. (2011) 108:4516–22. doi: 10.1073/pnas.1000080107
74. Martin M. Cutadapt removes adapter sequences from high-throughput sequencing reads. EMBnet J. (2011) 17:10–2. doi: 10.14806/ej.17.1.200
75. Callahan BJ, McMurdie PJ, Rosen MJ, Han AW, Johnson AJA, Holmes SP. DADA2: High-resolution sample inference from Illumina amplicon data. Nat Methods. (2016) 13:581–3. doi: 10.1038/nmeth.3869
76. R Core Team. R: A language and environment for statistical computing. Vienna, Austria: R Foundation for Statistical Computing (2022). Available at: https://www.R-project.org/ (Accessed October 20, 2024).
77. Davis NM, Proctor DM, Holmes SP, Relman DA, Callahan BJ. Simple statistical identification and removal of contaminant sequences in marker-gene and metagenomics data. Microbiome. (2018) 6:226. doi: 10.1186/s40168-018-0605-2
78. Nilsson RH, Larsson K-H, Taylor AFS, Bengtsson-Palme J, Jeppesen TS, Schigel D, et al. The UNITE database for molecular identification of fungi: handling dark taxa and parallel taxonomic classifications. Nucleic Acids Res. (2019) 47:D259–64. doi: 10.1093/nar/gky1022
79. Öpik M, Vanatoa A, Vanatoa E, Moora M, Davison J, Kalwij JM, et al. The online database MaarjAM reveals global and ecosystemic distribution patterns in arbuscular mycorrhizal fungi (Glomeromycota). New Phytol. (2010) 188:223–41. doi: 10.1111/j.1469-8137.2010.03334.x
80. Ewels PA, Peltzer A, Fillinger S, Patel H, Alneberg J, Wilm A, et al. The nf-core framework for community-curated bioinformatics pipelines. Nat Biotechnol. (2020) 38:276–8. doi: 10.1038/s41587-020-0439-x
81. Straub D, Blackwell N, Langarica-Fuentes A, Peltzer A, Nahnsen S, Kleindienst S. Interpretations of environmental microbial community studies are biased by the selected 16S rRNA (gene) amplicon sequencing pipeline. Front Microbiol. (2020) 11:550420. doi: 10.3389/fmicb.2020.550420
82. Quast C, Pruesse E, Yilmaz P, Gerken J, Schweer T, Yarza P, et al. The SILVA ribosomal RNA gene database project: improved data processing and web-based tools. Nucleic Acids Res. (2012) 41:D590–6. doi: 10.1093/nar/gks1219
83. De Mendiburu F, Simon R. Agricolae-Ten years of an open source statistical tool for experiments in breeding, agriculture and biology. PeerJ PrePrints. (2015). doi: 10.7287/peerj.preprints.1404v1
84. Shannon CE. A mathematical theory of communication. Bell system Tech J. (1948) 27:379–423. doi: 10.1002/j.1538-7305.1948.tb01338.x
85. McMurdie PJ, Holmes S. phyloseq: an R package for reproducible interactive analysis and graphics of microbiome census data. PloS One. (2013) 8:e61217. doi: 10.1371/journal.pone.0061217
86. Oksanen J, Blanchet FG, Friendly M, Kindt R, Legendre P, McGlinn D, et al. vegan: Community Ecology Package. R package version 2.5-6. 2019. (2020).
87. Bray JR, Curtis JT. An ordination of the upland forest communities of southern Wisconsin. Ecol Monogr. (1957) 27:326–49. doi: 10.2307/1942268
88. Love MI, Huber W, Anders S. Moderated estimation of fold change and dispersion for RNA-seq data with DESeq2. Genome Biol. (2014) 15:550. doi: 10.1186/s13059-014-0550-8
89. Peschel S, Müller CL, Von Mutius E, Boulesteix A-L, Depner M. NetCoMi: network construction and comparison for microbiome data in R. Briefings Bioinf. (2021) 22:bbaa290. doi: 10.1093/bib/bbaa290
90. Wei T, Simko V, Levy M, Xie Y, Jin Y, Zemla J. Package ‘corrplot’ (2017). Available online at: https://github.com/taiyun/corrplot (Accessed May 15, 2024).
91. Wickham H. ggplot2, Use R!. Cham: Springer International Publishing (2016). doi: 10.1007/978-3-319-24277-4
92. Kassambara A, Kassambara MA. Package ‘ggpubr.’ R package version 0.1 6 (2020). Available online at: https://rpkgs.datanovia.com/ggpubr/ (Accessed December, 15, 2023).
93. Lahti L, Shetty S. microbiome R package (2017). Available online at: https://microbiome.github.io/tutorials/ (Accessed January 20, 2024).
94. Cantoran A, Maillard F, Baldrian P, Kennedy PG. Defining a core microbial necrobiome associated with decomposing fungal necromass. FEMS Microbiol Ecol. (2023) 99:fiad098. doi: 10.1093/femsec/fiad098
95. Timmusk S, Nevo E, Ayele F, Noe S, Niinemets Ü. Fighting Fusarium pathogens in the era of climate change: A conceptual approach. Pathogens. (2020) 9:419. doi: 10.3390/pathogens9060419
96. Woo SL, Hermosa R, Lorito M, Monte E. Trichoderma: a multipurpose, plant-beneficial microorganism for eco-sustainable agriculture. Nat Rev Microbiol. (2023) 21:312–26. doi: 10.1038/s41579-022-00819-5
97. Ozimek E, Hanaka A. Mortierella species as the plant growth-promoting fungi present in the agricultural soils. Agriculture. (2020) 11:7. doi: 10.3390/agriculture11010007
98. Li W, Long Y, Mo F, Shu R, Yin X, Wu X, et al. Antifungal activity and biocontrol mechanism of Fusicolla violacea J-1 against soft rot in kiwifruit caused by Alternaria alternata. J Fungi. (2021) 7:937. doi: 10.3390/jof7110937
99. Golzar H, Thomas G, Jayasena KW, Wright D, Wang C, Kehoe M. Neoascochyta species cause leaf scorch on wheat in Australia. Australas Plant Dis Notes. (2019) 14:1. doi: 10.1007/s13314-018-0332-3
100. Bakr RA, Mahdy ME, Mousa E-SM. Biological control of root-knot nematode Meloidogyne incognita by Arthrobotrys oligospora. Egyptian J Crop Prot. (2014) 9:1–11. doi: 10.21608/ejcp.2014.239252
101. Höfte M. The use of Pseudomonas spp. as bacterial biocontrol agents to control plant disease. In: Microbial Bioprotectants for Plant Disease Management. Cambridge, UK: Burleigh Dodds (2021).
102. Zhang N, Wang Z, Shao J, Xu Z, Liu Y, et al. Biocontrol mechanisms of Bacillus : Improving the efficiency of green agriculture. Microbial Biotechnology. (2023) 16:2250–63. doi: 10.1111/1751-7915.14348
103. Saranraj P, Sivasakthivelan P, Al-Tawaha ARM, Sudha A, Al-Tawaha AR, Sirajuddin SN. Diversity and evolution of Bradyrhizobium communities relating to Soybean cultivation: A review. In: IOP Conference Series: Earth and Environmental Science. Bristol, England: IOP Publishing (2021). p. 012208.
104. Dobrzyński J, Naziębło A. Paenibacillus as a biocontrol agent for fungal phytopathogens: is P. polymyxa the only one worth attention? Microbial Ecol. (2024) 87:134. doi: 10.1007/s00248-024-02450-8
105. Olanrewaju OS, Babalola OO. Streptomyces: implications and interactions in plant growth promotion. Appl Microbiol Biotechnol. (2019) 103:1179–88. doi: 10.1007/s00253-018-09577-y
106. Ogwu MC, Srinivasan S, Dong K, Ramasamy D, Waldman B, Adams JM. Community ecology of deinococcus in irradiated soil. Microbial Ecol. (2019) 78:855–72. doi: 10.1007/s00248-019-01343-5
107. Zhang J-L, Song J, Kang Y-H, Wen Y-Y, Nong Y-J, Wang Q, et al. The community of arbuscular mycorrhizal fungi in sugarcane rhizosphere soils in Guangxi, China. Sugar Tech. (2024) 26:131–42. doi: 10.1007/s12355-023-01309-5
108. Hoffman GE, SChadt EE. variancePartition: interpreting drivers of variation in complex gene expression studies. BMC Bioinf. (2016) 17:483. doi: 10.1186/s12859-016-1323-z
109. Koslovsky MD, Vannucci M. MicroBVS: Dirichlet-tree multinomial regression models with Bayesian variable selection - an R package. BMC Bioinf. (2020) 21:301. doi: 10.1186/s12859-020-03640-0
110. Koslovsky MD. A Bayesian zero-inflated dirichlet-multinomial regression model for multivariate compositional count data. Biometrics. (2023) 79:3239–51. doi: 10.1111/biom.13853
111. Kolde R, Kolde MR. Package ‘pheatmap.’ R package 1, 790 (2015). Available online at: https://cran.r-project.org/web/packages/pheatmap/pheatmap.pdf (Accessed January 21, 2024).
112. Heun M, Aramendia E. MatthewHeun/matsbyname: v0.6.10. Zenodo, Geneva, Switzerland (2024). doi: 10.5281/zenodo.10652382.
113. Kannberg S, Lindsey AJ, Chiavegato MB, Lindsey LE. Effect of ultra-early, early, and normal soybean planting dates and rye cover crop on soybean grain yield. Agron J. (2024) 116:1321–30. doi: 10.1002/agj2.21550
114. Eckert DJ. Rye cover crops for no-tillage corn and soybean production. J Prod. Agric. (1988) 1:207–10. doi: 10.2134/jpa1988.0207
115. Ruffo ML, Bullock DG, Bollero GA. Soybean yield as affected by biomass and nitrogen uptake of cereal rye in winter cover crop rotations. Agron J. (2004) 96:800–5. doi: 10.2134/agronj2004.0800
116. Kaspar TC, Jaynes DB, Parkin TB, Moorman TB. Rye cover crop and gamagrass strip effects on NO3 concentration and load in tile drainage. J Env Qual. (2007) 36:1503–11. doi: 10.2134/jeq2006.0468
117. Hayden ZD, Brainard DC, Henshaw B, Ngouajio M. Winter annual weed suppression in rye–vetch cover crop mixtures. Weed Technol. (2012) 26:818–25. doi: 10.1614/WT-D-12-00084.1
118. Blanco-Canqui H, Claassen MM, Presley DR. Summer cover crops fix nitrogen, increase crop yield, and improve soil–crop relationships. Agron J. (2012) 104:137–47. doi: 10.2134/agronj2011.0240
119. Moore EB, Wiedenhoeft MH, Kaspar TC, Cambardella CA. Rye cover crop effects on soil quality in no-till corn silage-soybean cropping systems. Soil Sci Soc America J. (2014) 78:968–76. doi: 10.2136/sssaj2013.09.0401
120. Pokhrel S. Cover Cropping: A Strategy to Healthy Soil and Nitrogen Management in Corn. Virginia Tech University, Blacksburg, (VA (2023). [Doctoral dissertation, Virginia Tech].
121. Snapp S, Surapur S. Rye cover crop retains nitrogen and doesn’t reduce corn yields. Soil Tillage Res. (2018) 180:107–15. doi: 10.1016/j.still.2018.02.018
122. Plaza-Bonilla D, Álvaro-Fuentes J, Cantero-Martínez C. Identifying soil organic carbon fractions sensitive to agricultural management practices. Soil Tillage Res. (2014) 139:19–22. doi: 10.1016/j.still.2014.01.006
123. Congreves KA, Hooker DC, Hayes A, Verhallen EA, Van Eerd LL. Interaction of long-term nitrogen fertilizer application, crop rotation, and tillage system on soil carbon and nitrogen dynamics. Plant Soil. (2017) 410:113–27. doi: 10.1007/s11104-016-2986-y
124. Morris KA, Hornum S, Crystal-Ornelas R, Pennington SC, Bond-Lamberty B. Soil respiration response to simulated precipitation change depends on ecosystem type and study duration. JGR Biogeosci. (2022) 127:e2022JG006887. doi: 10.1029/2022JG006887
125. Liptzin D, Norris CE, Cappellazzi SB, Bean GM, Cope M, Greub KLH, et al. An evaluation of carbon indicators of soil health in long-term agricultural experiments. Soil Biol Biochem. (2022) 172:108708. doi: 10.1016/j.soilbio.2022.108708
126. Crystal-Ornelas R, Thapa R, Tully KL. Soil organic carbon is affected by organic amendments, conservation tillage, and cover cropping in organic farming systems: A meta-analysis. Agricult. Ecosyst Environ. (2021) 312:107356. doi: 10.1016/j.agee.2021.107356
127. Liu H, Zheng Y, Zhang P, Liu L. Claroideoglomus etunicatum affects the diversity and composition of the rhizosphere microbial community to help tall fescue resist saline-alkali stress. Preprint (Version 1). Res Square. (2024). doi: 10.21203/rs.3.rs-4787236/v1
128. Begum N, Qin C, Ahanger MA, Raza S, Khan MI, Ashraf M, et al. Role of arbuscular mycorrhizal fungi in plant growth regulation: implications in abiotic stress tolerance. Front Plant Sci. (2019) 10:1068. doi: 10.3389/fpls.2019.01068
129. Zou YN, Xu YJ, Liu RC, Huang GM, Kuča K, Srivastava AK, et al. Two different strategies of Diversispora spurca-inoculated walnut seedlings to improve leaf P acquisition at low and moderate P levels. Front Plant Sci. (2023) 14:1140467. doi: 10.3389/fpls.2023.1140467
130. Ferrol N, Azcón-Aguilar C, Pérez-Tienda J. Arbuscular mycorrhizas as key players in sustainable plant phosphorus acquisition: An overview on the mechanisms involved. Plant Sci. (2019) 280:441–7. doi: 10.1016/j.plantsci.2018.11.011
131. Klasek SA, Crants JE, Abbas T, Ashley K, Bolton ML, Celovsky M, et al. Potato soil core microbiomes are regionally variable across the continental United States. Phytobiomes J. (2024) 8:168–78. doi: 10.1094/PBIOMES-07-23-0060-R
132. Tosi M, Drummelsmith J, Obregón D, Chahal I, Van Eerd LL, Dunfield KE. Cover crop-driven shifts in soil microbial communities could modulate early tomato biomass via plant-soil feedbacks. Sci Rep. (2022) 12:9140. doi: 10.1038/s41598-022-11845-x
133. Cloutier ML, Murrell E, Barbercheck M, Kaye J, Finney D, García-González I, et al. Fungal community shifts in soils with varied cover crop treatments and edaphic properties. Sci Rep. (2020) 10:6198. doi: 10.1038/s41598-020-63173-7
134. Nevins CJ, Nakatsu C, Armstrong S. Characterization of microbial community response to cover crop residue decomposition. Soil Biol Biochem. (2018) 127:39–49. doi: 10.1016/j.soilbio.2018.09.015
135. Attard E, Poly F, Commeaux C, Laurent F, Terada A, Smets BF, et al. Shifts between Nitrospira - and Nitrobacter -like nitrite oxidizers underlie the response of soil potential nitrite oxidation to changes in tillage practices. Environ Microbiol. (2010) 12:315–26. doi: 10.1111/j.1462-2920.2009.02070.x
136. Xu W, Cai Y-P, Yang Z-F, Yin X-A, Tan Q. Microbial nitrification, denitrification and respiration in the leached cinnamon soil of the upper basin of Miyun Reservoir. Sci Rep. (2017) 7:42032. doi: 10.1038/srep42032
137. DiLegge MJ, Manter DK, Vivanco JM. Soil microbiome disruption reveals specific and general plant-bacterial relationships in three agroecosystem soils. PloS One. (2022) 17:e0277529. doi: 10.1371/journal.pone.0277529
138. Kumar A, Prakash A, Johri BN. Bacillus as PGPR in crop ecosystem. In: Maheshwari DK, editor. Bacteria in Agrobiology: Crop Ecosystems. Springer Berlin Heidelberg, Berlin, Heidelberg (2011). p. 37–59. doi: 10.1007/978-3-642-18357-7_2
139. Dawar S, Wahab S, Tariq M, Zaki MJ. Application of Bacillus species in the control of root rot diseases of crop plants. Arch Of Phytopathol And Plant Prot. (2010) 43:412–8. doi: 10.1080/03235400701850870
140. Ji L, Xin Y, Guo D. Soil fungal community structure and its effect on CO2 emissions in the Yellow River Delta. Int J Environ Res Public Health. (2023) 20:4190. doi: 10.3390/ijerph20054190
141. Li F, Zhang S, Wang Y, Li Y, Li P, Chen L, et al. Rare fungus, Mortierella capitata, promotes crop growth by stimulating primary metabolisms related genes and reshaping rhizosphere bacterial community. Soil Biol Biochem. (2020) 151:108017. doi: 10.1016/j.soilbio.2020.108017
142. Sati SC, Pant P. Evaluation of phosphate Solubilization by root endophytic aquatic Hyphomycete Tetracladium setigerum. Symbiosis. (2019) 77:141–5. doi: 10.1007/s13199-018-0575-y
143. Mazaheri-Naeini M, Sabbagh SK, Martinez Y, Séjalon-Delmas N, Roux C. Assessment of Ustilago maydis as a fungal model for root infection studies. Fungal Biol. (2015) 119:145–53. doi: 10.1016/j.funbio.2014.12.002
144. Horst RJ, Doehlemann G, Wahl R, Hofmann J, Schmiedl A, Kahmann R, et al. Ustilago maydis infection strongly alters organic nitrogen allocation in maize and stimulates productivity of systemic source leaves. Plant Physiol. (2010) 152:293–308.
145. Li X, Wang A, Wan W, Luo X, Zheng L, He G, et al. High salinity inhibits soil bacterial community mediating nitrogen cycling. Appl Environ Microbiol. (2021) 87:e01366–21. doi: 10.1128/AEM.01366-21
146. DeLaune PB, Mubvumba P, Lewis KL, Keeling JW. Rye cover crop impacts soil properties in a long-term cotton system. Soil Sci Soc Amer. J. (2019) 83:1451–8. doi: 10.2136/sssaj2019.03.0069
147. Pittelkow CM, Linquist BA, Lundy ME, Liang X, van Groenigen KJ, Lee J, et al. When does no-till yield more? A Global meta-analysis Field Crops Res. (2015) 183:156–68. doi: 10.1016/j.fcr.2015.07.020
Keywords: fungi, bacteria, rye, soybean, communities, mycorrhizae, soil
Citation: Frey TS, Shah DA, Lindsey LE, Sprunger C, Lopez-Nicora HD and Benitez Ponce MS (2025) Crop rotation and a rye cover crop have minor impacts on soil health, microbial communities, and soybean yield in Ohio. Front. Soil Sci. 5:1535734. doi: 10.3389/fsoil.2025.1535734
Received: 27 November 2024; Accepted: 17 February 2025;
Published: 04 March 2025.
Edited by:
Zhongzheng Yan, East China Normal University, ChinaReviewed by:
Alasdair Noble, AgResearch Ltd, New ZealandSebastián Martínez Kopp, Instituto Nacional de Investigación Agropecuaria, Uruguay
Copyright © 2025 Frey, Shah, Lindsey, Sprunger, Lopez-Nicora and Benitez Ponce. This is an open-access article distributed under the terms of the Creative Commons Attribution License (CC BY). The use, distribution or reproduction in other forums is permitted, provided the original author(s) and the copyright owner(s) are credited and that the original publication in this journal is cited, in accordance with accepted academic practice. No use, distribution or reproduction is permitted which does not comply with these terms.
*Correspondence: Timothy S. Frey, ZnJleS4xNDZAb3N1LmVkdQ==