
94% of researchers rate our articles as excellent or good
Learn more about the work of our research integrity team to safeguard the quality of each article we publish.
Find out more
ORIGINAL RESEARCH article
Front. Soil Sci., 05 July 2024
Sec. Soil Management
Volume 4 - 2024 | https://doi.org/10.3389/fsoil.2024.1426894
This article is part of the Research TopicSoil Additives for Sustaining the Soil Ecosystem ServicesView all 3 articles
 Emmanuel Amoakwah1,2†
 Seong-Heon Kim1†
 Sangho Jeon1*Jae-Hong Shim1Yun-Hae Lee1Soon-Ik Kwon1Seon-Jin Park1
Introduction: There is lack of information on the impact of acidity correctives (lime and silicate) and nitrogen (N), phosphorus (P), and potassium (K) fertilizers on the fertility, carbon stocks, carbon stratification, and carbon sequestration potential of paddy soils. To fill this knowledge gap and contribute to knowledge on how the treatments impact the soil ecosystem functions and services, a long-term field experiment was established in 1954 with four treatments and five replicates arranged in a randomized complete block design.
Methods: Four treatments with five replicates per treatment were laid out in a randomized complete block design. The treatments included control/untreated (CT), only NPK, silicate-fortified NPK (NPKSi), and lime-fortified NPK (NPKLi). The treatments were applied to paddy soils classified as Fluvaquentic Eutrudepts.
Results and discussion: Application of the treatments led to significant increases in soil pH by 0.9, 1.12, and 1.5 pH units in the NPK, NPKLi, and NPKSi-treated soils in 2021, respectively, compared to the initial soil pH. The increase in pH subsequently led to significant reductions in C stratification and C stocks, with reduced rates of C sequestration observed to be more pronounced in the soils treated with lime and silicate-fortified NPK fertilizers (NKPSi and NPKLi). Both NPKSi and NPKLi moderately increased soil fertility. The highest increase in soil fertility was observed in the NPKSi treatment, with an annual growth rate of 0.0160 and a relative change ratio of 128.2% relative to the initial soil fertility index recorded in 1970. A Pearson correlation analysis revealed that soil pH, exchangeable calcium, and available silicate were the soil properties that significantly contributed to the increase in the soil fertility of the treated soils in the rice paddy agroecosystem.
Significance: Conclusively, the inclusion of silicate in long-term fertilization is an effective strategy to mitigate soil acidity and increase soil fertility.
● Co-application of NPK and silicate increased soil pH
● Lime and silicate reduced available phosphorus in NPK fertilized soils
● Silicate and lime increased exchangeable calcium and magnesium concentrations
● Co-application of NPK and acidity correctives moderately increased soil fertility
● The inclusion of silicate and lime reduced carbon stocks in NPK-fertilized soils
Soil’s role in global food security, fiber production, biodiversity conservation, buffering of greenhouse gases, and carbon sequestration cannot be over-emphasized (1–3). Agricultural activities have intensified globally to cope with the ever-increasing food demand of the world’s growing population. The intensification of agricultural activities in the last few decades has drastically affected soil properties and fertility, negatively impacting the soil ecosystem’s multifunctionality. For instance, it is, without doubt, that fertilizers play a significant role in improving soil fertility and crop productivity towards achieving global food security. However, the continuous application of inorganic fertilizers adversely affects soil health, and for that matter, the production potential of soil resources. As a result of the intensive use of imbalanced chemical fertilizers, most of the productive soil resources, especially those under intensive cropping become unproductive. Indiscriminate use of synthetic (inorganic) fertilizers causes soil nutrient deficiencies, impairs the soil ecological balance, deteriorates soil fertility, and causes environmental pollution (e.g., eutrophication) (4–7). Long-term application of inorganic fertilizers has also been reported to cause toxic algal blooms in lakes and streams that pollute the marine ecosystem and endanger aquatic life (8). There is, therefore, the need to revisit and revise national fertilizer programs to improve and maintain the soil resources to benefit from the ecosystem functions and services that the soil provides.
Farmers invariably resort to the use of traditional nitrogen (N), phosphorus (P), and potassium (K) fertilizers (NPK fertilizers) worldwide to achieve high crop yields. Urea and ammonium sulphate are the most commonly used N sources due to their relatively high N content and low cost (9). However, these inorganic N sources cause soil acidification by generating and releasing protons via the nitrification process. The magnitude of the decrease in soil pH through the application of inorganic fertilizers can strongly influence the availability of soil nutrients, plant growth, and yield (10). Negative effects of soil acidification have been reported to include depletion of basic cations, higher solubility of aluminium (Al) and iron (Fe) which potentially cause toxicity in plants (11), and lower phosphorus use efficiency due to P fixation with acidic cations, primarily Al and Fe.
The use of acidity correctives in combination with inorganic fertilizers is one of the sound major interventions in any program designed to improve the multifunctionality of the soil ecosystem and bring about an economic increase in crop production. Lime is the most applied ameliorant used to decrease soil acidity because of its strong acid-neutralizing capacity. However, lime solubility is extremely low (12), which invariably restricts soil pH elevation (13). As a result, most farmers have resorted to the use of other acidity correctives with acid-neutralizing components such as calcium and/or magnesium oxides, hydroxides, carbonates, and silicates. For instance, calcium and magnesium silicates which are similar in chemical composition to lime (calcium or magnesium carbonates) are being used because of their potential to replace lime even more advantageously (14, 15). It is reported that calcium silicate is 6.78 times more soluble than calcium carbonate or hydroxide (16). Also, silicon’s release upon silicate dissolution has been reported to improve soil nutrient availability and crop productivity (17).
Though acidity correctives (lime and silicate) have been used over the years to increase soil pH, there have been tradeoffs relative to the inverse relationship between elevated soil pH and soil organic matter content. Organic matter solubility has been reported to increase with increasing soil pH (18) because of the enhanced creation of negative charges in organic matter. According to Michalzik et al. (19) and Oste et al. (20), the increased solubility of organic matter as pH increases implies significant losses of dissolved organic matter from the soil ecosystem. Moreover, as organic matter solubilizes, more substrates become available which increases microbial activity. An increase in soil microbial activity enhances the oxidation of organic matter and subsequent loss of organic C, and for that matter, C stratification and stocks. Contrasting results have also been reported by other authors (21, 22). For instance, the polyvalent cation released when lime and silicate dissociate in the soil medium forms a bond with the negatively charged organic matter functional groups. This bond is reported to be invariably irreversible, preventing the biological and physico-chemical breakdown of organic matter (20, 23, 24). Furthermore, because solubilized organic matter is an important substrate for microbes, the formation of the bond between Ca and organic matter curtails microbial activity (25). In this instance, organic matter decomposition is inhibited due to the reduced dissolved organic matter and organic matter concentrations. This results in the stabilization of organic matter and subsequent increases in C stocks and stratification.
Soils in the Korean Republic are generally acidic due to the over-reliance on inorganic fertilizers and high rainfall events during early summer, which leach out basic cations from the soil. The Government of South Korea strictly adheres to agricultural policies that primarily focus on self-sufficiency in rice production and ensure price stability for rice (26). In this regard, the Government of the Republic of Korea introduced a lime and silicate fertilizer program to increase soil pH, nutrient availability, and crop yield.
Arguably, no study has been conducted to thoroughly investigate the tradeoffs between soil pH and soil fertility on one hand, and carbon stocks and stratification on the other hand, as impacted by lime and silicate-fortified NPK in a long-term experiment spanning over 6 decades. To fill this knowledge gap and tease apart the importance of the inclusion of NPK to the lime and silicate ameliorants on soil properties, a field experiment was established in 1954 to elucidate the temporal variations in soil fertility indicators, C stocks, and stratification under paddy rice ecosystems. The NPK fertilizers were added to correct the nutrient deficiencies caused by soil acidification.
The objectives of this work were to (i) study and analyze the impact of lime and silicate-fortified NPK fertilizers on soil properties, (ii) elucidate the changes in soil fertility after the application of the amendments to better understand the effectiveness of the combined application of lime and silicate-fortified NPK fertilizers in paddy soils, and (iii) assess the soil carbon stocks and carbon stratification following the application of the amendments in 67 years.
The findings of this study will undoubtedly provide the needed direction and inform policy in adjusting national lime and silicate fertilizer programs in rice paddy ecosystems. The quantification of the temporal changes in soil fertility indicators, carbon stocks, and stratification is key to the development of sustainable soil management systems under paddy agroecosystems.
This long-term experiment was established in 1954 by the National Institute of Agriculture Sciences (NAS), Rural Development Administration (RDA) at the Suwon long-term experimental field (37.27.48 N, 126.99.22 E, 2,010 m2), South Korea. The study area has a mean annual rainfall of 1314 mm and a mean annual temperature of 11.8°C. The soils in this area are classified as Fluvaquentic Eutrudepts (27), with a moderately well-drained topsoil and a partially oxidative humic horizon. The deeper horizons are poorly drained with reducing conditions. Sixteen (16) years after the establishment of the field experiment, full-scale data collection started to ascertain the effects of the applied treatments on soil properties. The chemical characteristics of the soil in the study area before the incorporation of the treatments in 1954 were not available. Therefore, to facilitate the monitoring of temporal changes in soil properties and soil fertility as impacted by the treatments, composite soil samples were collected in 1970 (from the control/untreated plots). The measured soil properties of the control or untreated soils represented the baseline soil characteristics against which the soil properties measured in 2021 were compared. Details of the baseline soil properties measured are presented in Table 1.

Table 1 Baseline (initial) soil properties measured in 1970. Values represent mean ± standard error.
The experimental design used in this study was the randomized complete block design which consisted of four treatments with five replicates per each treatment. Each experimental plot had a dimension of 3 m × 5 m, separated from the adjoining plot by a buffer strip with a distance of 1 m. The treatments used in the study were control (CT), sole NPK (NPK), silicate-fortified NPK (NPKSi), and lime-fortified NPK (NPKLi). In the silicate and lime-fortified NPK treatments, the application rate of each liming material required to increase the soil acidity to a target pH of 6.5 was calculated by using the lime requirement method proposed by Dunn (28). Details of the treatments which include the application rates are presented in Table 2.
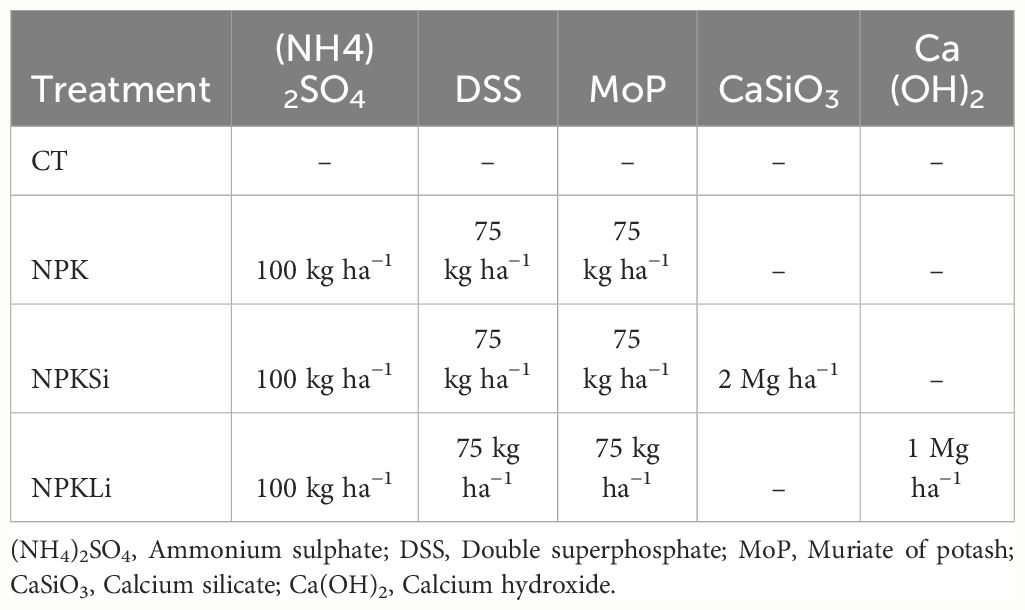
Table 2 The treatments applied and the rates of application of the nutrients.
In 1954, the treatments were applied uniformly on the surface of the earmarked plots. With the aid of a rotovator, the treatments were subsequently incorporated into the soil by plowing to a depth of 15 cm. Application of the lime and silicate in the subsequent years was done only when the soil pH decreased to about 6.5.
Rice seeds (Jinheoung var.) were nursed for at least 20 days and transplanted to the treated and untreated paddy fields in May of every cropping cycle (year). In all instances, half rate of N and full rates of P and K were applied six weeks after transplanting by the side placement method. The remaining half of the nitrogen was top dressed in two equal splits during maximum tillering and flowering stages.
All agronomic practices were strictly adhered to uniformly, across the treated and untreated fields. The only variation was the disparities in the applied treatments. Since 1954, the experimental field has been under rice cultivation during each cropping season every year, with the same treatments, and same agronomic practices. The essence is to monitor long-term changes in soil properties as affected by the treatments. Information about the physiological attributes of rice and yields as affected by the applied treatments is not recorded in this manuscript since the scope of this study is to mainly monitor the temporal changes in soil properties and soil fertility as impacted by the treatments.
In 1970 and 2021, composite soils were collected after harvest in autumn (mid-October to November) from a 15-cm depth from the treated and untreated plots with the aid of a soil auger (5 cm, internal diameter). Five sub-samples were randomly collected and mixed thoroughly to form one homogenized composite sample per plot. The collected field-moist soil samples were placed in well-labelled sealable Ziploc bags and transported to the laboratory for analyses. Before soil analyses, the field-moist samples were allowed to air-dry at room temperature (~25°C) for seven days, sieved in a 2 mm mesh, and analyzed to determine the soil properties in the respective years.
For soil pH, 50 mL of deionized water was added to 10 g of air-dried soil (corresponding to a soil/water ratio of 1:5). The mixture was shaken for 30 min on a mechanical shaker, and pH was measured by a pH meter (Orion 3star, Thermo Electron Corporation, Waltham, Ma, USA). Soil organic matter content was measured by the Tyurin method. In brief, equal amounts of concentrated sulfuric acid (H2SO4) and potassium dichromate (K2Cr2O7) solutions were used to create a mixture of chromium (CM). For twelve hours, the CM was allowed to cool at ambient temperature. Samples of soil free of apparent plant and animal remains were put in test tubes with 10.0 mL of the CM. After that, the test tubes were submerged in a hot water bath for an hour. Glass sticks were used to mix the chromium mixture twice in the test tubes with the soil samples while they were heating. The mixture was allowed to be cooled, and 15 mL of distilled water was added after the reaction period. After oxidation, the excess dichromate was determined by titration with ammonium ferrous sulphate. Soil organic matter was subsequently computed by multiplying the soil organic carbon content by a factor of 1.724 (29).
The Lancaster method (30), which required a two-step extraction process, was used to measure the amount of available phosphorus. 5 g of soil and 5 mL of 0.05 M HCl were mixed in the first step. For ten minutes, this mixture was left undisturbed. In the subsequent phase, 20 milliliters of a mixture comprising 1.58 N glacial acetic acid, 0.125 N malonic acid, 0.187 N malic acid, 0.037 N ammonium fluoride, and 0.03 N aluminum chloride hexahydrate was added to the mixture. Ammonium hydroxide was then used to bring the pH down to 4.0. The samples were then filtered using a medium porosity filter after being shaken for ten minutes. Every sample’s extraction was carried out three times. Following the extraction, the samples’ available P concentrations were measured using spectrophotometry at 720 nm.
The exchangeable cations (K, Ca, Mg, and Na) were extracted with I M NaOAc (pH 7.0) solution, and the concentrations of the cations were determined using an Inductively coupled plasma luminescence photometer (ICP-OES, GBC). Available silicate concentration was determined colorimetrically after extracting with 1 M NaOAc buffer at a of pH 7.0 with 10% ammonium molybdenum and 17% sodium sulfate. The concentrations of available silicate in the samples were measured at 700 nm with a UV-vis spectrophotometer, U-3000, Hitachi. 1 M NaOAc solution (pH 4.0) was used to extract the available silicate and exchangeable cations (K, Ca, Mg, and Na). The available silicate levels in the samples were measured at 700 nm using a UV-vis spectrophotometer, U-3000, Hitachi, while the exchangeable cations were measured using an inductively coupled plasma luminescence photometer (ICP-OES, GBC).
The soil bulk density is an important soil physical property required to calculate soil carbon stocks in an agroecosystem. However, this key soil physical property was not measured during the entire duration of the experiment. Therefore, a Pedo Transfer Function (PTF) derived from a specific set of regional soils by Honeysett and Ratkowsky (31) that is regionally accepted was used to quantify the missing values of the soil bulk density (Equation 1). This PTF was selected based on existing reviews and comparisons with other PTFs.
where BD is the soil bulk density, and OM is the percentage organic matter.
The data obtained from the field experiment reported the soil organic matter (SOM) content. Soil organic carbon (SOC) was, therefore, calculated using Equation 2:
where and are the soil organic carbon and soil organic matter content, respectively. The SOC stock was calculated using Equation 3 proposed by Penman et al. (32):
where, (Mg C ha−1) is the soil organic carbon stock; OC (mg C g−1) is the organic carbon content of the fine earth fraction (< 2 mm); (Mg m−3) is the bulk density of the soil; (cm3 coarse fragment cm−3 soil) is the volume fraction of coarse mineral fragment, thus () is the volume fraction of fine earth; is the thickness (cm) of the sampling depth; 0.1 is a factor for converting mg C cm−2 to Mg C ha−1.
Carbon sequestration rate was estimated relative to changes in soil C stocks in the reference soil C stocks and C stocks recorded in the treated and untreated soils in 2021. In this study, the C stock of Korean forest soils was set as the reference for calculating the rate of C stock change on the assumption that, the C stock before the establishment of the experiment (forest conversion to paddy fields) was the same as the average C stock (42.84 Mg ha−1) of Korean forest soils (33). Carbon sequestration (Mg ha−1) was calculated in the respective treatments in 2021 using Equation 4.
where, represents soil carbon stocks of the respective treatments (Mg ha−1), and is the soil carbon stocks in the reference (forest) soil (Mg ha−1). The mean annual absolute rate of change in soil C stock was used to indicate soil C sequestration rate (Mg ha−1 yr−1).
Soil fertility evaluation is a tool used to holistically assess the impacts of long-term application of soil fertility treatments on soils. The improved Nemerow method was used to evaluate the effects of the treatments on the soil fertility as impacted by the treatments by calculating soil fertility index (SFI). To calculate the SFI, three steps were followed. The first step involved the selection of soil fertility indicators (soil organic carbon, soil pH, available phosphorus, exchangeable calcium, potassium and magnesium, and available silicate). These seven soil properties were selected since they are the soil variables that relate directly to the fertility of Korean paddy soils. The second step involved the calculation of the individual fertility index (Equation 5).
where is the individual soil fertility index; is the measured value of each fertility attribute; and and are the lower and the upper threshold values of each classification standard of paddy rice fields in the Republic of Korea (34).
This was followed by the final step in which the SFI was calculated using the improved Nemerow Soil Fertility Index equation (Equation 6):
where is the overall soil fertility index; is the average value for the individual soil fertility indices; is the minimum value for the individual soil fertility indices; is the number of soil fertility indicators used. The soil fertility index was classified according to the ranges provided by (35) as follows: SFI< 0.9 = low; 0.9 ≤ SFI< 1.8 = moderate; 1.8 ≤ SFI< 2.7 = high; and SFI ≥ 2.7 = very high
To elucidate the temporal variation in the soil fertility indicators, the relative change (Rr) for each soil variable was calculated using Equation 7. Since most of the soil variables from the respective treated and untreated plots were not measured in 1954, the values of the respective soil fertility parameters measured in 1970 were used as the initial or baseline values.
where indicates the relative change ratio of a soil fertility indicator or parameter; is the measured soil fertility parameter value in 1970; and is the measured soil fertility parameter value in 2021.
To appreciate the long-term trends of the impact of the applied amendments on the fertility status of the soil per year, the average annual growth (AAG) rate was calculated (Equation 8).
where is the soil fertility index in 1970, is the soil fertility index in 2021, and denotes the number of years since the treatments were applied.
Data normality and variance homoscedasticity were performed using Shapiro-Wilk and Levene’s tests, respectively. Analysis of variance (ANOVA) was used to test for differences between untreated (control) and treated soils. Differences between any two given treatments were identified using the Holm-Sidak post hoc test. Pearson correlation coefficients between the soil fertility index (SFI) and measured soil fertility indicators (pH, soil organic matter, available phosphorus, exchangeable potassium, magnesium, calcium, and available silicate) were determined. We used p< 0.05 as a criterion for the statistical significance of treatment effects on the measured soil variables unless otherwise stated. Lower/upper case letters beside the mean values indicate statistically significant differences between the applied treatments. Results are presented as mean ± standard error in tables and figures.
After over 6 decades of treatment application, the range of increase in soil pH was between 4.7 and 27.3%, with the untreated soil recording the least increase in pH whereas the soil treated with NPKSi recorded the highest increase in soil pH (Table 3). The increase in soil pH in the NPKSi-treated soils was significantly higher (p = 0.004) than the rest of the treatments. The increase in soil pH as affected by the treatments followed the sequence: NPKSi > NPKLi > NPK > CT (Table 3). Thus, the inclusion of silicate contributed significantly to the increase in soil pH by appreciable 1.5 units over the 67 years.
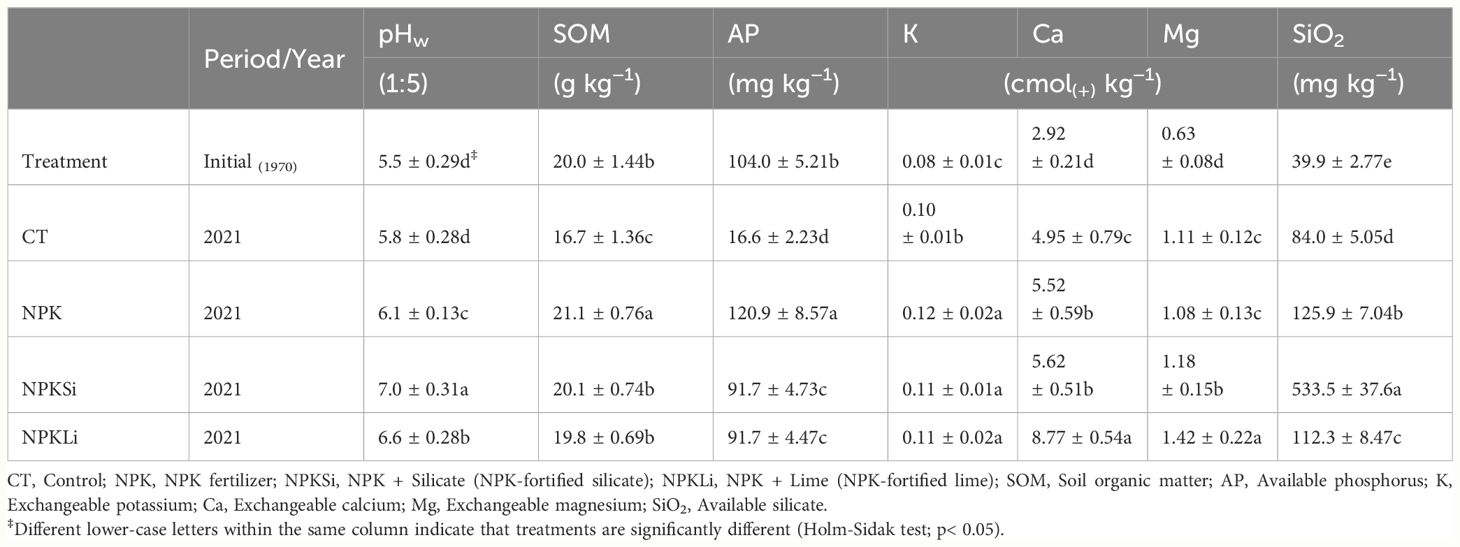
Table 3 Temporal changes in soil properties as impacted by the applied treatments.
The soil organic matter content decreased from a mean value of 20 g kg−1 in the initial soil to 16.74 and 19.81 g kg−1 in the untreated soil and the soils treated with NPKLi, respectively (Table 3). On the contrary, a significant increase in the relative change ratio of SOM of 5.5% was recorded in the sole NPK-treated soils relative to the initial SOM content (Figure 1).
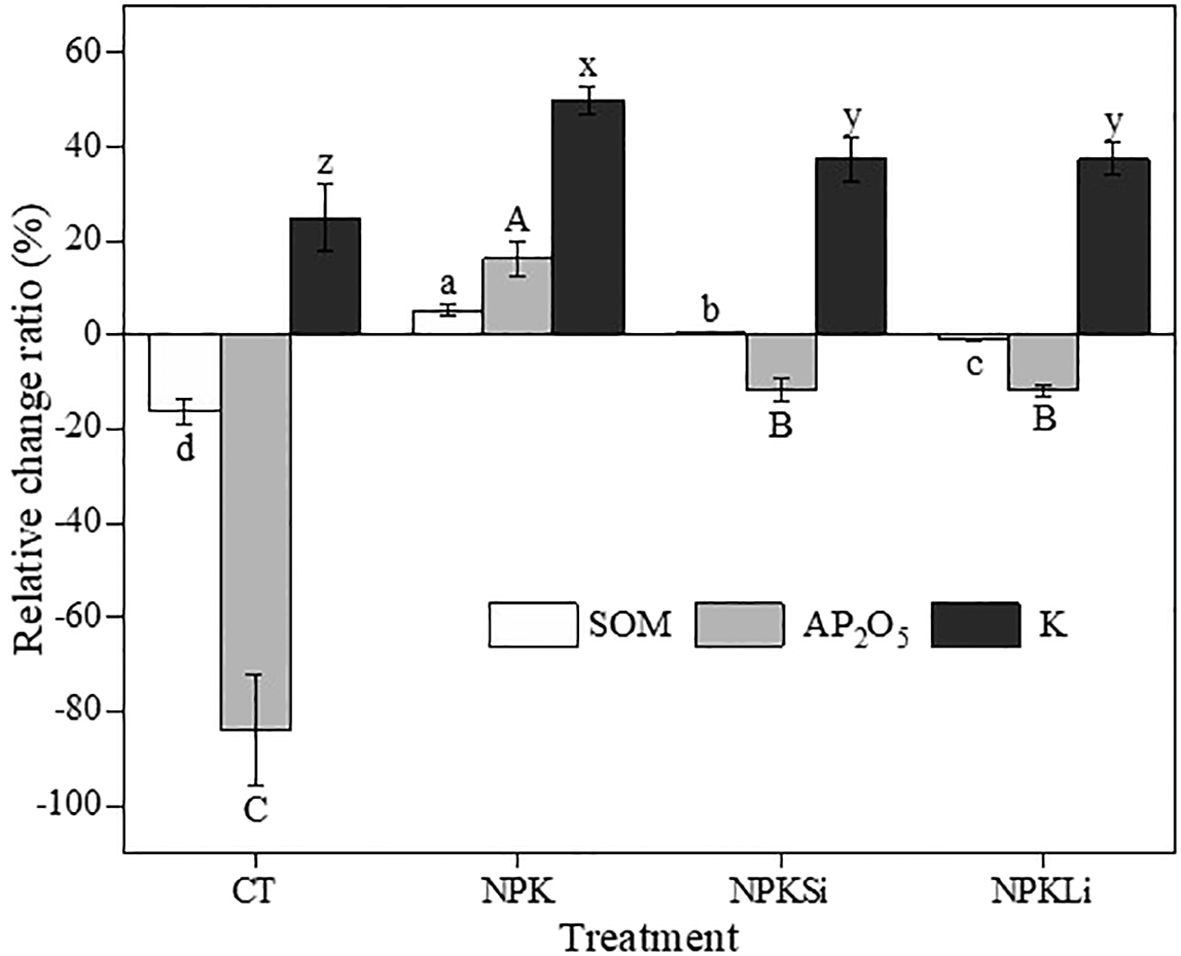
Figure 1 Relative change ratio (Rr %) of soil organic matter (SOM), available phosphorus (AP2O5), and exchangeable potassium (K), under different treatments in 2021. CT, NPK, NPKSi, and NPKLi respectively denote control, sole NPK fertilizer, NPK + silicate applied at 2 Mg ha−1 (silicate-fortified NPK), and NPK + lime applied at 1 Mg ha−1 (lime-fortified NPK). Means separated by different lower-case letters (a vs. b vs. c vs. d) indicate significant differences among the treatments at p< 0.05. Means separated by different lower-case letters (x vs. y vs. z) indicate significant differences among the treatments at p< 0.05. Means separated by different upper-case letters (A vs. B vs. C) indicate significant differences among the treatments at p< 0.05.
Though a relative change ratio of 0.5% in SOM content was observed in the soil amended with NPKSi (Figure 1), this increase was not significantly different from the initial mean SOM value (Table 3).
Except for the NPK treated soils, the application of the rest of the amendments resulted in significant decreases in the available P concentrations 67 years after the application of the treatments. On the average, the application of both NPKSi, and NPKLi resulted in an approximately 11.8% decline in the relative change ratio of the available P content (Figure 1). Similarly, a reduction of about 84% in the relative change ratio of the available P was observed in the untreated soil in 2021. On the contrary, an average increase of 16.3% in the available P was recorded in the NPK-treated soils, relative to the initial available P concentration recorded in 1970. Thus, the inclusion of lime and silicate in NPK fertilization resulted in a significant decline in available P as compared to the sole NPK treatment.
Exchangeable potassium (K) increased from a mean of 0.08 cmol(+) kg−1 in 1970 to 0.10, 0.12 and 0.11 cmol(+) kg−1 in the untreated, NPK-treated, and both NPKSi- and NPKLi-treated soils, respectively. The lowest increase in the relative change ratio (25%) was observed in the untreated soils, whereas the highest increase (50%) was observed in the soils treated with the sole NPK treatment (Figure 1). Interestingly, it was observed that the long-term application of NPK fortified with silicate and lime resulted in a substantial decrease in K as compared to the sole NPK treatment.
Similarly, increases in the exchangeable calcium content were recorded after over 6 decades of treatments application, with increases of 70, 89, 92 and 200% (Figure 2) in the relative change ratio of the exchangeable Ca observed in the soils treated with CT, NPK, NPKSi, and NPKLi, respectively, relative to the initial exchangeable K mean value. Among the treatments, the highest increase was observed in the NPKLi-treated soils.
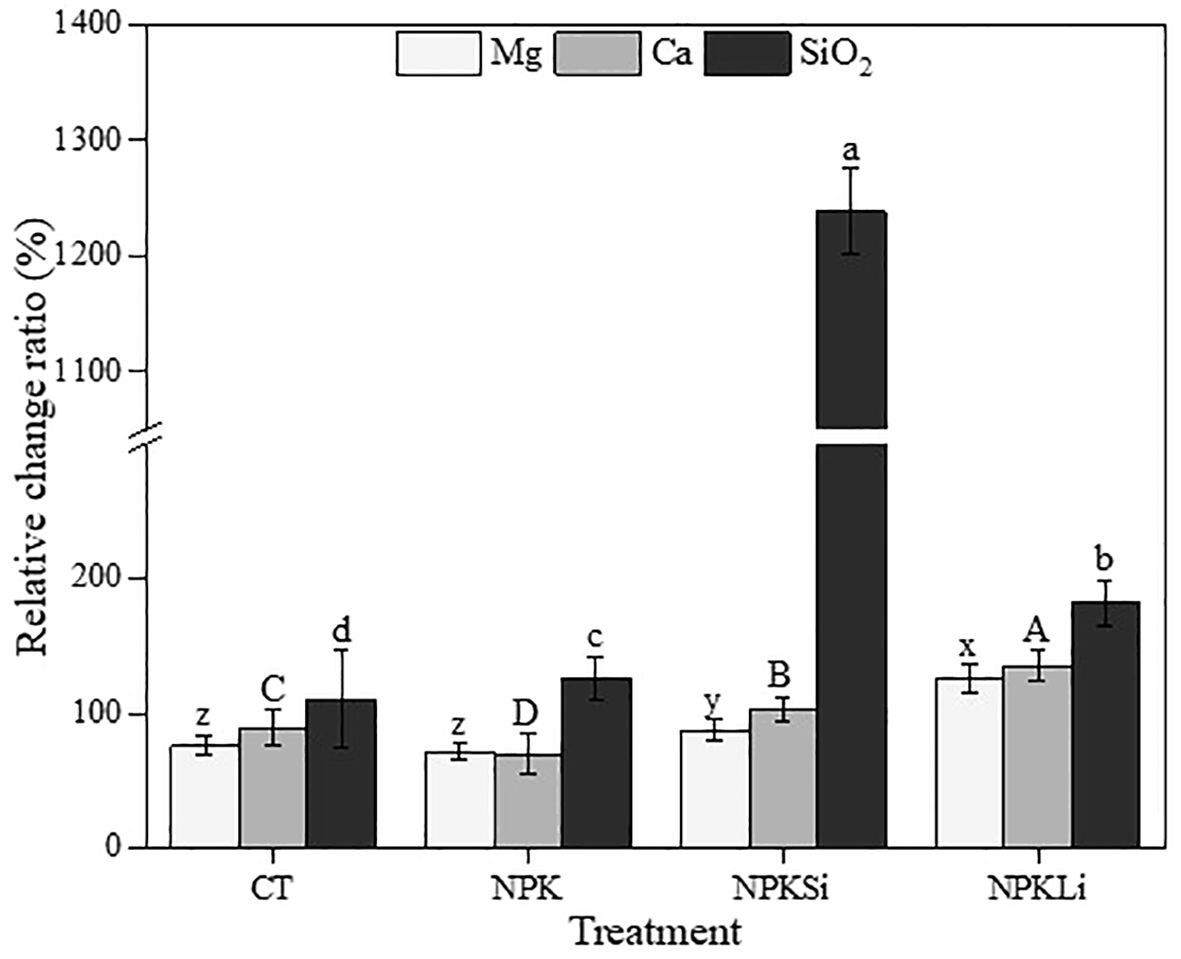
Figure 2 Relative change ratio (Rr %) of exchangeable calcium (Ca), exchangeable magnesium (Mg) and available silicate (SiO2) under different treatments in 2021. CT, NPK, NPKSi, and NPKLi respectively denote control, sole NPK fertilizer, NPK + silicate applied at 2 Mg ha−1 (silicate-fortified NPK), and NPK + lime applied at 1 Mg ha−1 (lime-fortified NPK). Means separated by different lower-case letters (x vs. y vs. z) indicate significant differences among the treatments at p< 0.05. Means separated by different upper-case letters (A vs. B vs. C vs. D) indicate significant differences among the treatments at p< 0.05. Means separated by different lower-case letters (a vs. b vs. c vs. d) indicate significant differences among the treatments at p< 0.05.
A similar trend was observed in the exchangeable magnesium concentrations in 2021, with the highest increase observed in the NPKLi-treated soils (Table 3) and the least Mg content was recorded in the soils amended with the sole NPK fertilizer. However, the Mg content recorded in the soils treated with the sole NPK was not statistically different from the Mg content recorded in the untreated soil. The increase in Mg as impacted by the treatments was in the order of NPKLi > NPKSi > NPK = CT (Table 3).
The mean concentration of available silicate in the initial soil was 39.86 mg/kg in 1970, and it reached 84 mg/kg in the untreated soil in 2021. Similarly, an increasing trend in the available silicate concentration was observed in the treated soils, with mean concentrations of 125.9, 533.5, and 112.3 mg/kg recorded in 2021 in the respective NPK-, NPKSi- and NPKLi-treated soils (Table 3). Compared to the initial silicate concentration, the relative change ratio of the silicate concentration in 2021significantly increased by 2.1-folds, 3.2-folds, 13.4-folds, and 2.8-folds in the CT, NPK, NPKSi-, and NPKLi-treated soils, respectively (Figure 2). Among the NPK-based treatments, the NPK fortified with silicate recorded the highest concentration of available silicate, followed by the NPKLi, with the least recorded in the sole NPK-applied treatments.
To elucidate the impact of the applied treatments on the fertility status of the soils after over 6 decades of treatment application, the soil fertility index (SFI) as an indicator of the fertility of the soil was computed. This was done by calculating and comparing the initial SFI in 1970 with the SFI calculated in 2021 in the untreated and treated soils.
Comparatively, all the treatments significantly (p = 0.0032) increased the SFI of the treated soils as compared to the control and the initial SFI. Statistically, no difference (p = 0.074) in the initial SFI in 1970 and 2021 in the untreated soil was observed (Figure 3).
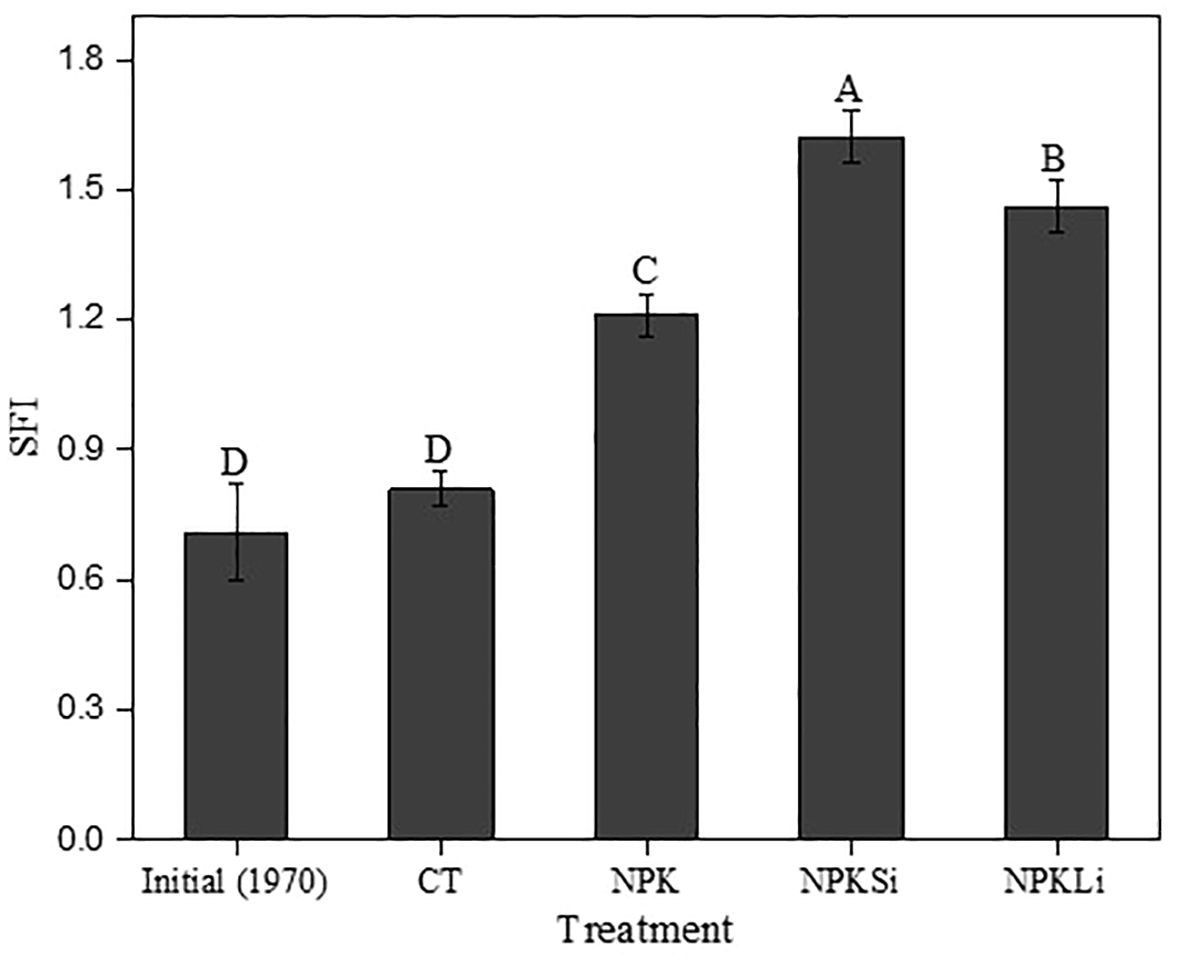
Figure 3 Impact of the long-term application of treatments on the soil fertility index in 2021. CT, NPK, NPKSi, and NPKLi respectively denote control, sole NPK fertilizer, NPK + silicate applied at 2 Mg ha−1 (silicate-fortified NPK), and NPK + lime applied at 1 Mg ha−1 (lime-fortified NPK). Means separated by different upper-case letters (A vs. B vs. C vs. D) indicate significant differences among the treatments at p< 0.05.
Per the classification system by Jin et al. (35), the initial SFI was low (0.71). After over a 6-decade period, the sole NPK, NPKSi, and NPKLi increased the relative change ratio of the soil fertility index by 70, 128, and 106%, respectively), compared to the initial SFI (Figure 4).
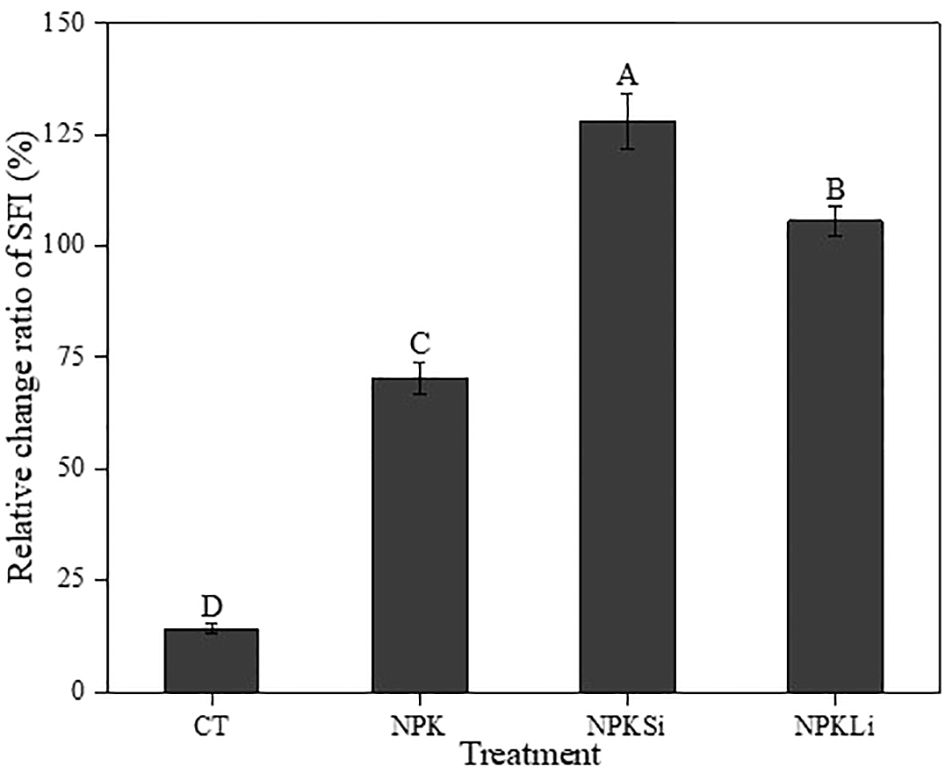
Figure 4 Impact of the long-term application of treatments on the Relative change ratio (Rr) of soil fertility index in 2021. CT, NPK, NPKSi, and NPKLi respectively denote control, sole NPK fertilizer, NPK + silicate applied at 2 Mg ha−1 (silicate-fortified NPK), and NPK + lime applied at 1 Mg ha−1 (lime-fortified NPK). Means separated by different upper-case letters (A vs. B vs. C vs. D) indicate significant differences among the treatments at p< 0.05.
The increase in the SFI as impacted by the treatments was classified as “moderate” as their respective fertility index was found to be 1.21, 1.62, and 1.46. Though all the treatments moderately impacted the fertility of the soils, the fertility index of the soils amended with NPKSi was significantly higher than that of the other treatments. This was followed by the soils treated with NPKLi, substantiating the role of liming materials in soil fertility improvement. The untreated soil recorded a fertility index of 0.81, and therefore, fell within the low-class range (< 0.9). Thus, after over 6 decades, the untreated soil recorded a low soil fertility status.
To ascertain how the treatments applied have performed over the years with respect to soil fertility improvement, the average annual growth (AAG) of the fertility index was determined. The AAG of the fertility indices was found to be positive for the treated soils and the untreated soils (Figure 5).
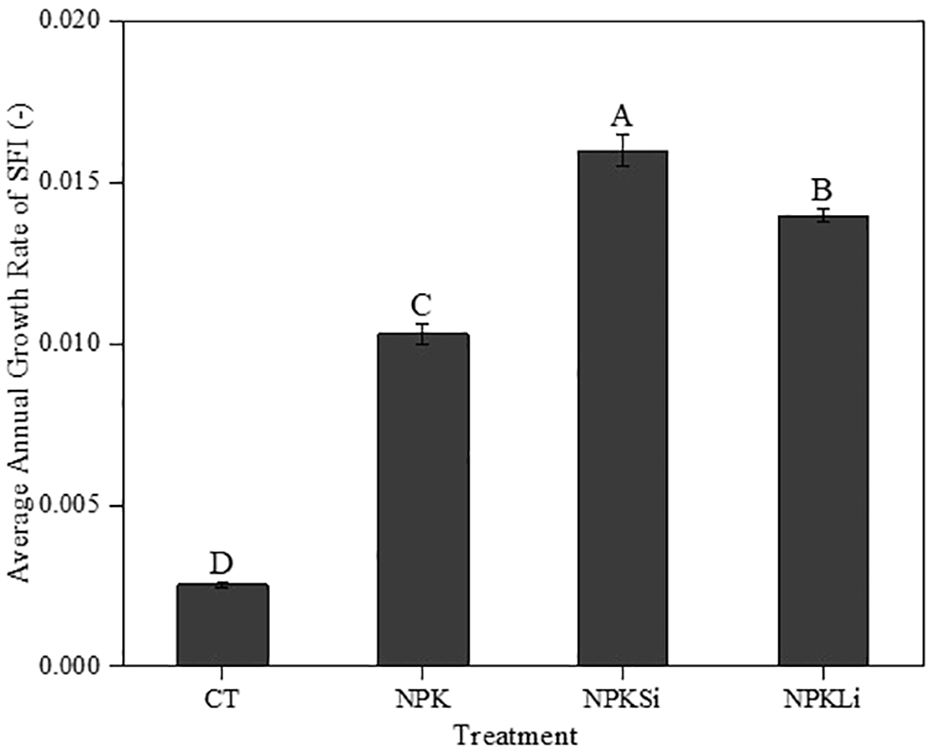
Figure 5 Impact of the applied treatments on the Average annual growth (AAG) of soil fertility index in 2021. CT, NPK, NPKSi, and NPKLi respectively denote control, sole NPK fertilizer, NPK + silicate applied at 2 Mg ha−1 (silicate-fortified NPK), and NPK + lime applied at 1 Mg ha−1 (lime-fortified NPK). Means separated by different upper-case letters (A vs. B vs. C vs. D) indicate significant differences among the treatments at p< 0.05.
Among the NPK-based treatments, the highest AAG was observed in the NPKSi-treated soils with a value of 0.0160 ± 0.0005, and the least AAG was recorded in the sole NPK-treated soils (Figure 5). Thus, averagely, the combined application of NPK and silicate significantly improved the fertility status of the treated soils annually within the 67 years, as compared to the rest of the amendments. Comparatively, the lowest AAG was recorded in the untreated soils after over 6 decades of applying the treatments. Thus, the annual contribution of the treatments to the fertility of the soils from 1970 to 2021 followed the sequence: NPKSi > NPKLi > sole NPK > CT (Figure 5).
To ascertain the relationship between the measured soil properties and soil fertility, Pearson correlation coefficients were determined (Figure 6). From the analysis, it was observed that the measured soil variables that contributed most to the variation in soil fertility after over 6 decades of treatment application were soil pH, exchangeable calcium, and available silicate.
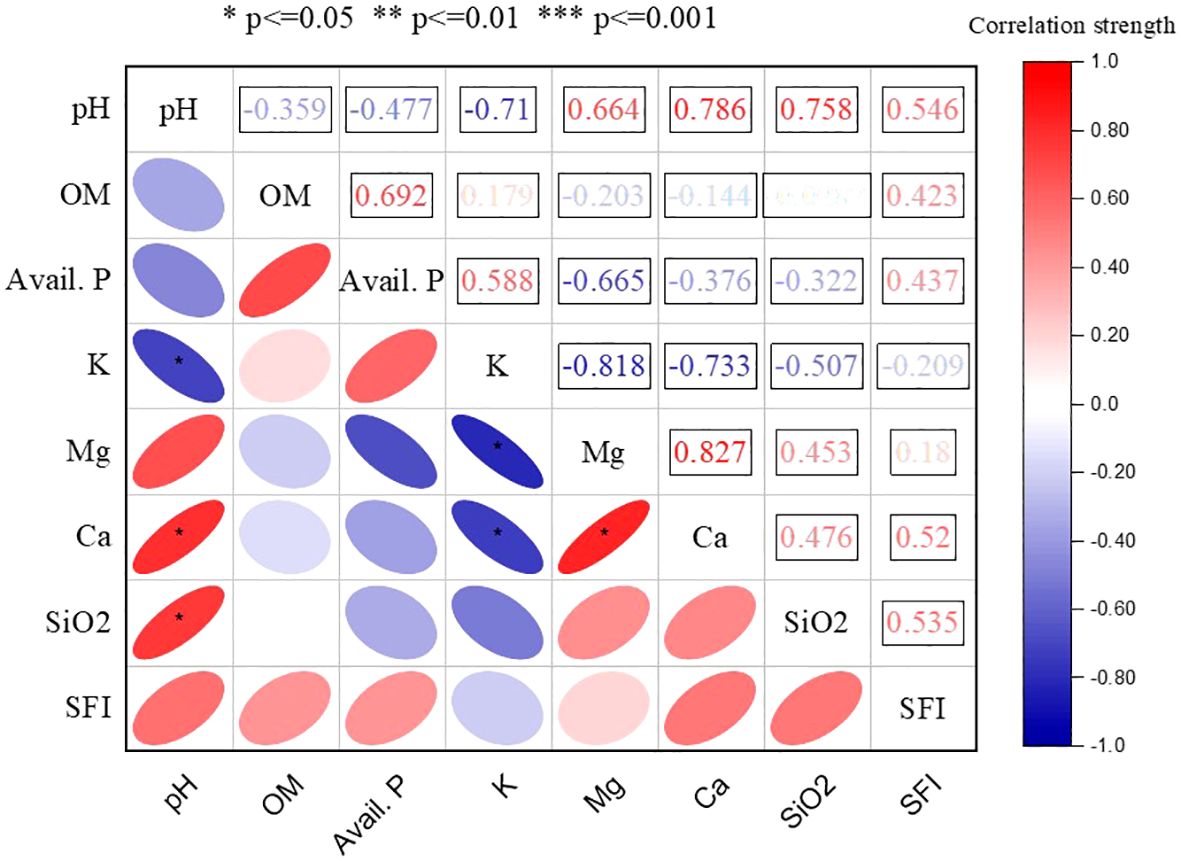
Figure 6 Pearson correlation coefficients between soil fertility index (SFI) and soil properties in 2021. SFI, Soil fertility index; SOM, Soil organic matter; AP2O5, Available phosphorus; K, Exchangeable potassium; Ca, Exchangeable calcium; Mg, Exchangeable magnesium; SiO2, Available silicate.
Thus, among the measured soil variables, Ca, pH, and SiO2 were the properties that were positively associated with soil fertility index (SFI) significantly. The multiple regression showed that the higher availability of Ca released from the inclusion of lime increased the soil pH and improved the soil fertility. Similarly, the SiO2 released from the application NPKSi positively impacted the fertility status of the soil.
The organic carbon (SOC) content of the soils as impacted by the applied amendments were stratified by dividing the respective C contents in the amended soils in 2021 with the respective SOC values at 20 cm of the untreated soil (reference soil) in 2021. The use of the reference (untreated) soil to calculate SOC stratification assessment is crucial so that similar soils under various treatments can be systematically compared. After over 6 decades of treatment application, all the treatments decreased SOC stratification (Table 4). Among the treatments, high SOC stratification was recorded in the soils treated with sole NPK. However, no significant difference (p = 0.48) was observed in the SOC stratification of the sole NPK-amended soils and the soils treated with the NPKSi and NPKLi (Table 4).
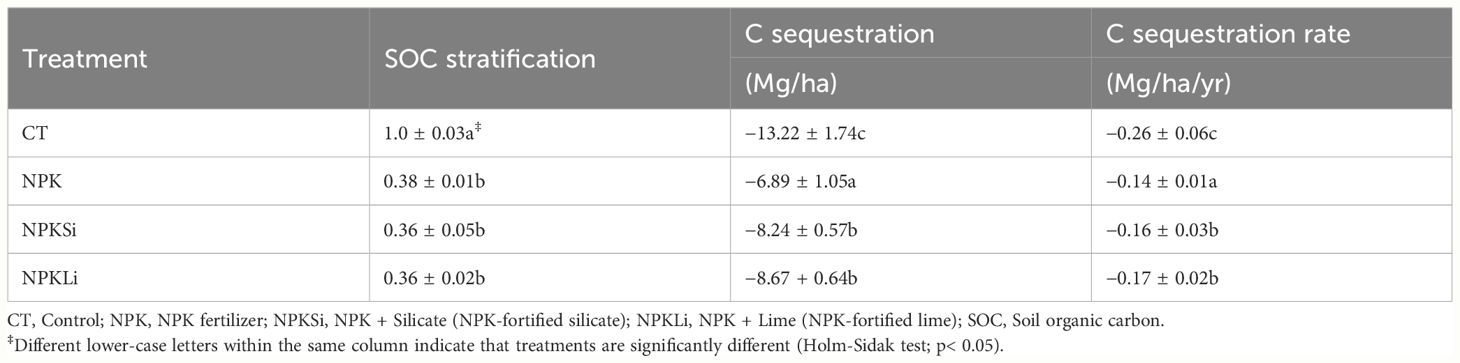
Table 4 Stratification of soil organic carbon (SOC) as impacted by the long-term application of the treatments.
The SOC stocks as affected by the treatments in 2021 were compared with the C stocks under the same treatments in 1970. Among the treatments, the highest SOC was recorded in the soils treated with NPKLi in 1970. Statistically, no significant difference was observed in the SOC stock of the soils treated with sole NPK, NPKSi, and the untreated soils.
However, in 2021, SOC stocks were much higher in the sole NPK-treated soils, compared to the rest of the amendments (Figure 7). Averagely, the untreated soil recorded the least SOC stock with no statistical difference in SOC stocks established between the NPKSi- and NPKLi-treated soils.
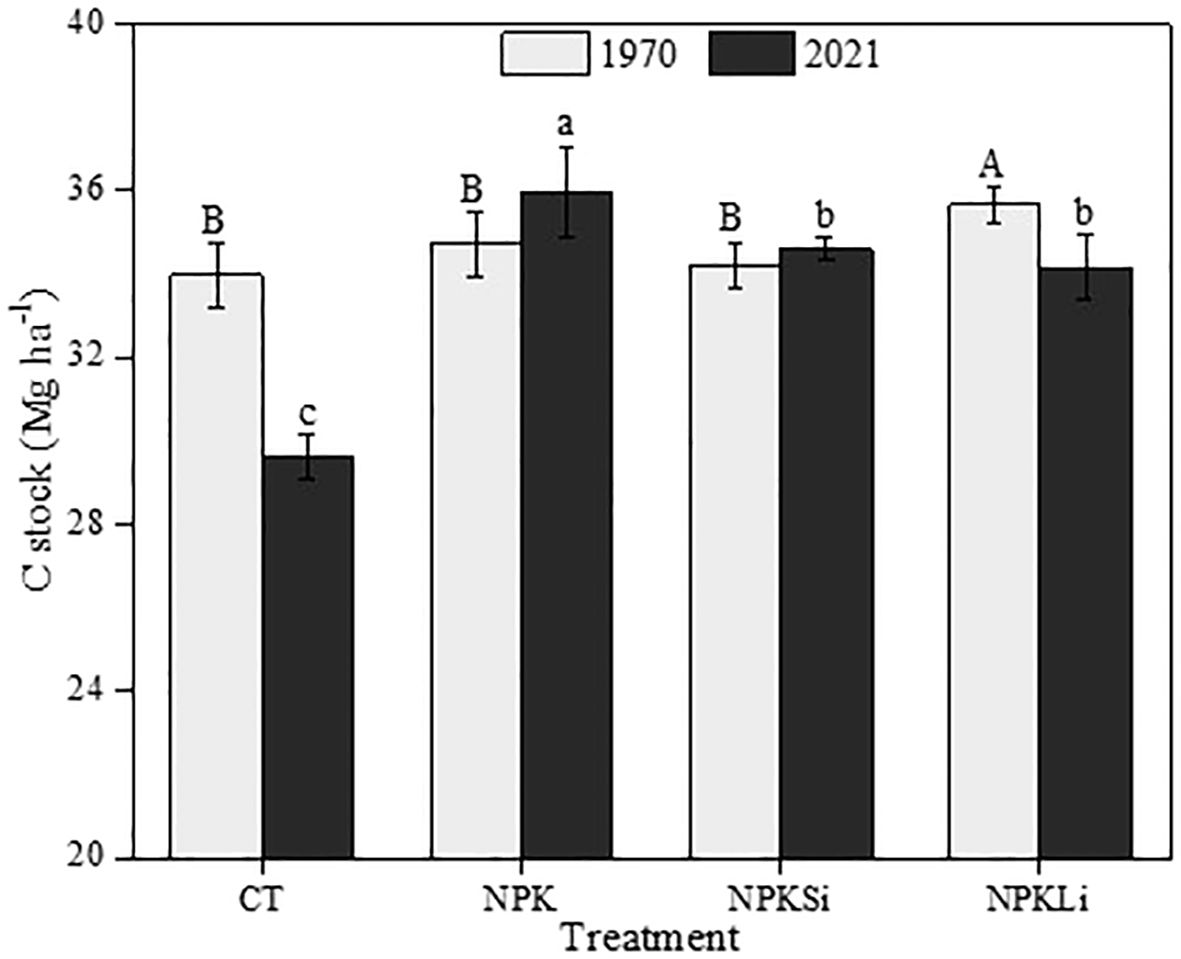
Figure 7 Impact of the applied treatments on soil organic carbon (SOC) stocks in 2021. CT, NPK, NPKSi, and NPKLi respectively denote control, sole NPK fertilizer, NPK + silicate applied at 2 Mg ha−1 (silicate-fortified NPK), and NPK + lime applied at 1 Mg ha−1 (lime-fortified NPK). Means separated by different upper-case letters (A vs. B) indicate significant differences among the treatments at p< 0.05. Means separated by different lower-case letters (a vs. b vs. c) indicate significant differences among the treatments at p< 0.05.
To appreciate the carbon sequestration potential of the amendments following the land use change from forest to paddy fields, the SOC sequestration and rates of sequestration as impacted by the treatments were computed and compared to the average SOC stock of Korean forest soils (42.84 Mg ha−1). Using the average soil C stock of Korean forest soils as the reference or baseline C stocks, all the applied treatments significantly reduced soil C sequestration. The highest decline in soil SOC sequestration was observed in the control soil (−13.22 Mg ha−1) at an absolute rate of 0.26 Mg ha−1 yr−1 (Table 4). Among the NPK-based treatments, the NPKLi treatments recorded a relatively higher decline in SOC sequestration (−8.67, rate = 0.17 Mg ha−1 yr−1), followed by NPKSi treatment (0.36 Mg ha−1, rate = 0.16), with the least observed in the soil treated with sole NPK (6.89 Mg ha−1 yr−1, rate = 0.14) (Table 4).
Soil reaction (pH) is described as the master soil property or variable that influences a lot of soil biological and physico-chemical processes affecting nutrient availability and plant growth and development. To elucidate the temporal variations in soil pH as impacted by the treatments, the change of soil pH over time was quantified via statistical distribution of raw data observations and the relative change ratio of the soil pH (Table 3, Figure 1). These methods of analysing the temporal change confirmed an increase in soil pH in all the treated soils in 2021. However, the highest increase in pH was observed in the NPKSi-treated soils, closely followed by the NPKLi- amended soils at a mean rate of 1.5 and 1.12 pH units, respectively. The increase in pH following the application of the lime and silicate-fortified NPK treatments was found to be within the range of 6.62–7.0, which is above the optimum pH (5.5–6.5) for paddy rice soils as defined by RDA (34).
The significant increase in soil pH in the NPKSi-treated soils may be ascribed to the alkaline nature of the slag silicate fertilizer with a pH of 9.5, and high amount of Ca and Fe which have the tendency to increase the basicity of the soil Though both lime and silicate are acid correctives, the increase in pH in the NPKSi-treated soils was significantly higher than the NPKLi-amended soils. This may partly be attributed to the relatively higher solubility of silicate slag over calcium hydroxide. Silicate slag has a neutralizing capacity of 0.5–0.7 (36) compared to lime (Ca(OH)2, and this gives slag the edge over lime in raising soil pH. Our findings conform to the observation made by Joo and Lee (37) who reported an increase in pH by 0.5 units following the application of silicate slag at a rate of 2 t ha−1 in a field trial.
Widespread use of inorganic nitrogen fertilizers has been reported to cause global soil acidification (38). In most agroecosystems, the application of ammonium-based N fertilizers is the primary cause of soil acidification, accompanied by a substantial decline in exchangeable (basic) cations (Ca, K, and Mg). However, in this study, long-term application of inorganic fertilizer (NPK) rather increased the soil pH by 0.9 pH units. This could possibly be due to the contribution of NPK to vigorous plant growth and root development in the NPK-treated soils, leading to the buildup of humus upon decomposition of the plant roots and crop residues after harvest. This is evidenced in the increased content of the soil organic matter observed in the NPK-treated soils. Soils with high organic matter carbon above 20 g kg−1 are reported to have a higher buffering capacity (26) to resist changes in soil pH. The N source was ammonium sulphate; therefore, it was expected that the oxidation by the nitrification process, coupled with direct uptake of NH4-N by the crop (rice), would result in soil acidification.
However, the high buffering capacity in the NPK-treated soils evidenced by the high SOC content (21.06 g kg−1) recorded in 2021, possibly masked the effect of the released proton ions. Also, the high organic matter recorded in the NPK-treated soils increased the basic cations, which might have contributed equally to the observed pH in the NPK-amended soils.
Among the treatments, the NPKLi treatment caused a significant reduction in the SOM (Table 3, Figure 1) below the sufficiency range (20–30 g kg−1) for paddy rice cultivation defined by RDA (34). This observation could be due to the significant increase in the concentrations of polyvalent cation (Ca2+) (Table 3) possibly due to over-liming, which subsequently led to the soil exchange complex saturated with Ca2+. Saturation of the soil exchange complex with Ca2+ and precipitation of acidic cation (Al3+) by liming could reduce the potential bioavailability of organic matter constituents (39), hence, a decline in the soil organic carbon content. When the exchange complex is saturated with Ca2+, the rate of enzymatic decomposition of soil organic carbon increases (40, 41), and this may partly be responsible for the reduction in the SOC in the limed soils.
Among the NPK-based treatments, significant decreases in the available P content were observed in the NPKSi- and NPKLi-treated soils, with sole NPK-treated soils, recording the highest available P content, relative to the initial P content (Table 3). The decline in the available P content contradicts the observation made by Qaswar et al. (42) who reported a higher P content in soils amended with NPKLi. Holland et al. (43) also reported a significant increase in the soil available P following the application of lime to acidic soils. The reason for the elevated concentrations of the available P was attributed to an accelerated decomposition of organic matter associated with enhanced microbial activities which resulted in the release of inorganic P in the soil solution. However, we found a contrasting result which corroborates the findings of Park and Ro (44). The decrease in the available P is possibly due to the fixation of inorganic P at high pH by the relatively higher Ca concentrations in the soils treated with NPKSi and NPKLi. The soil pH for optimum phosphorus availability is 6.5. At a neutral or high pH (≥ 7), phosphate reacts with calcium to form minerals, such as apatite, which renders P unavailable in the soil and hence decreases P concentrations in the soil solution. The decrease in the P concentrations in the control plots is mainly ascribed to the exclusion of P in crop nutrition, which possibly resulted in significant mining of the native P pools over the years. The decrease in the available P in the untreated soils could also be due to soil erosion and/or leaching due to low aggregate stability and tensile strength as a result of low soil organic matter content (Table 3).
Long-term application of the treatments resulted in increases in the exchangeable K contents, though no significant difference existed between the K content recorded in 1970 and the K content observed in the treated and untreated soils in 2021. On the contrary, significant increases in exchangeable Mg were observed in the treated and untreated soils in 2021, and this was much more pronounced in the soils treated with NPKSi and NPKLi. Our observation contradicts the hypothesis that the bioavailability of Mg in the soil decreases after intensive liming (39). Our findings also contradict the findings of Jaskulska et al. (45) who observed significant decreases in Mg after intensive liming in a long-term fertilizer experiment. The reason behind our observation may be due to the magnitude of the changes in soil pH, dictated possibly by the application rates of the liming materials, the composition of the liming materials, and the soil type. Changes in soil pH through fertilizer application can potentially influence soil nutrient availability and the functionality of the soil ecosystem (10). Soil acidification indicates the relative distributions of acidic and basic cations (38), and the propensity of basic cations to neutralize acidic cations. This primarily depends on exchangeable Ca2+ and Mg2+ ions (46). Therefore, the increase in pH in the NPKLi- and NPKSi-amended soils may have favored the accumulation of Ca2+ and Mg2+ ions released from the applied lime and silicate. Hence, the observed increases in both Ca and Mg.
Significant increases in the available silicate were observed in all the treated soils. However, the magnitude of the increase was much more pronounced in the NPKSi-amended soils. This is mainly due to the inclusion of silicate in the treatments which released appreciable amounts of silicate after its dissolution in the soil matrix. It must be emphasized that not all SiO2 is available in the soil solution to be readily taken up by plants. According to Greger et al. (47), most of it is locked up in native recalcitrant silicate minerals. Its solubility is, therefore, reported to be redox and pH- dependent. Thus, at high pH, the solubility and availability of silicate increase. The observed increases in the available SiO2 in the NPKSi-treated soils could partly be ascribed to silicon-mediated priming which induced the solubility of recalcitrant silicate minerals as pH increased from 5.5 to 7.
Generally, the application of the treatments moderately impacted the fertility of the soils, regardless of the treatment type. However, it was observed that soil fertility varied significantly under the different treatments. The soils treated with NPKSi and NPKLi significantly increased the soil fertility index (SFI), and the magnitude of this observation was significantly higher in the silicate-fortified NPK fertilizer treatment (NPKSi). This was accentuated by the significantly higher annual growth rate (0.016 ± 0.0005) of the soil fertility index as compared to the rest of the treatments. From the Pearson correlation analysis, the observed increases in the soil fertility as impacted by the applied treatments under the long-term fertilization and liming are explained by the soil pH, exchangeable calcium, and available silicate effects (Table 4).
Soil pH is considered a key soil variable that greatly influences soil nutrient availability in the rhizosphere (48), and several soil biological, physico-chemical properties and processes in the soil ecosystem (35). Therefore, it is regarded as a fundamental soil property in the terrestrial ecosystem (49). For instance, soil pH influences the activities of soil enzymes (50) for the biogeochemical cycling of nutrients (51) in the soil ecosystem. Soil microbes are associated with extracellular enzymes, and positive correlations between microbial community composition and diversity with soil pH (between 6.5 and 7.5) have been reported (52, 53). Therefore, at the pH value of 7 observed in the soils treated with NPKSi treatment, soil microbes and extracellular enzymes have been reported to largely impact nutrient bioavailability (54) and soil fertility.
Silicate as a soil variable that greatly influenced the variation in the soil fertility status is attributed to increases in the soil microbial community structure in paddy soils (55) and associated nutrient cycling in soils (56). When silicate dissolves in the soil solution, the released SiO2 anion hydrolyses to produce a hydroxyl ion. This further increases the soil pH, and thus, creates a favorable environment for microbial/enzyme activities which drive processes such as nutrient cycling, decomposition of organic residues, and soil organic matter turnover (57). According to Vestergaard et al. (58) and Schloter et al. (59), soil microbial functions are considered as the most sensitive indicators of soil fertility. Moreover, upon bacterial dissolution of silicates in the soil, calcium is released (60) which equally contributed significantly to the observed increase in the soil fertility status.
Soil C stratification, C stocks, and C sequestration are reported to be influenced by several factors such as soil texture, site preparation and management, vegetation type, and climatic conditions (61, 62). According to Li et al. (63), climate influences soil C accumulation via biotic processes associated with the growth and development of vegetation, as well as organic matter decomposition. Nevertheless, the above-enumerated factors were held constant in this study, since the experimental field was established in the same location with similar soil texture, climate, site preparation, and vegetation type. Therefore, differences in C stock accounted for are explained mainly by the treatment type.
Compared to the average C stock of Korean forest soils, the application of the treatments negatively impacted C sequestration. Expectedly, the untreated soil recorded the lowest C sequestration rate primarily due to the production of low plant biomass, and hence, low C input. The low C input may have emanated from the low soil nutrients due to nutrient depletion which might have adversely affected the soil ecosystem functions and militated against crop productivity. Among the NPK-based treatments, lower C stratification, C stocks, and C sequestration were observed in the lime and silicate-associated NPK fertilizers. Our finding contrasts the observations made by Ji et al. (64) and Reithmaier et al. (65) who reported significant increases in C sequestration in silicate-treated soils. This variation could be due to differences in the duration of the experiments as well as the application rates of the treatments. The reduced C stratification, sequestration, and stocks in the lime and silicate-fortified NPK treatments could be explained by the elevated soil pH levels caused by the treatments. At high pH (6.5–7.5), significant increases in microbial activities and subsequent acceleration of organic matter decomposition have been reported (66). In both treatments (NPKLi and NPKSi), increases in pH from the initial 5.5 to 6.6 and 7, respectively, were observed. These elevated pH values fall within the reported pH value where soil basal respiration rates (microbial activities) and subsequent loss of soil C as CO2 are high. Furthermore, the observed decline in the C stratification, stock, and sequestration could be due to the increased solubility of soil organic matter. Elevated levels of soil pH increase the negative charges on soil organic matter (25), and these negative charges increase the dispersion and dissolution of soil organic matter. Dissolved organic carbon efflux from soils is reported to correlate positively with soil pH (19, 20), hence the observed decreases in C stratification, stocks, and sequestration in the silicate and lime-fortified NPK treatments.
The study elucidated the impact of long-term application of silicate- and lime-fortified NPK fertilizers on soil properties, soil fertility, carbon stratification, carbon stocks, and sequestration. The results obtained from this study demonstrated the following:
● The inclusion of lime and silicate in a long-term NPK fertilization masked and counteracted the potential release of protons from ammonium sulphate which would have otherwise decreased soil pH. Thus, the long-term application of lime- and silicate-fortified NPK fertilizers on paddy soils increased soil pH, with the highest pH observed in the NPKSi-treated soils.
● Long-term application of NPKLi and NPKSi resulted in significant decreases in the available phosphorus and exchangeable potassium contents. On the contrary, significant increases in exchangeable calcium and magnesium concentrations were observed in the soils treated with NPKLi and NPKSi. Moreover, significant increases in available silicate content were also recorded, with the highest silicate content observed in the NKSi-treated soils.
● After over 6 decades (1954–2021), the application of silicate and lime-fortified NPK fertilizers decreased SOC stocks. This observation is ascribed to a decline in C stratification and C sequestration rates possibly due to loss of soil C through increased soil basal respiration at elevated soil pH levels and leaching of dissolved organic carbon at high pH values as a result of possible dispersion of soil organic carbon constituents.
● Long-term application of NPKSi and NPKLi moderately impacted the fertility status of paddy soils regardless of the decline in the C stocks, available P, and K. The increase in the fertility of the NPKSi- and NPKLi-treated paddy soils was greatly influenced by the elevated soil pH, enhanced exchangeable calcium, and available silicate concentrations within 67 years. Though both treatments moderately impacted soil fertility, the NPKSi treatment depicted a comparatively higher annual improvement of soil fertility with a significantly higher fertility index.
In perspective, the long-term application of silicate and lime-fortified NPK treatments (NPKSi and NPKLi) significantly improved the soil fertility properties that greatly impacted the fertility of the paddy soils. However, the long-term application of the treatments should be complemented with other organic amendments (such as biochar) that have the propensity to significantly increase the soil organic matter content and enhance C sequestration. Rice straws should, therefore, be pyrolyzed as biochar to be applied directly to the soils to increase the soil recalcitrant C content and curtail the loss of soil C by preventing or reducing microbial C decomposition of soil C. It is suggested that in NPK fertilization that is complemented with lime and silicate application on paddy soils, the application rates of P and K should be increased to prevent or reduce potential P and K deficiencies in the treated soils.
The raw data supporting the conclusions of this article will be made available by the authors, without undue reservation.
EA: Conceptualization, Data curation, Formal analysis, Investigation, Writing – original draft, Writing – review & editing, Validation, Visualization. S-HK: Formal analysis, Resources, Validation, Writing – review & editing. SJ: Conceptualization, Data curation, Investigation, Supervision, Writing – review & editing, Validation. J-HS: Data curation, Formal analysis, Software, Visualization, Writing – review & editing. Y-HL: Investigation, Resources, Validation, Visualization, Conceptualization, Writing – review & editing. S-IK: Conceptualization, Formal analysis, Funding acquisition, Methodology, Project administration, Resources, Supervision, Visualization, Writing – review & editing. S-JP: Conceptualization, Funding acquisition, Methodology, Project administration, Resources, Software, Supervision, Validation, Writing – review & editing.
The author(s) declare financial support was received for the research, authorship, and/or publication of this article. This research was funded by the Cooperative Research Program for Agricultural Science & Technology Development of the Rural Development Administration, the Republic of Korea (Project No. PJ017283 and No. RS-2023-00232079).
The authors declare that the research was conducted in the absence of any commercial or financial relationships that could be construed as a potential conflict of interest.
All claims expressed in this article are solely those of the authors and do not necessarily represent those of their affiliated organizations, or those of the publisher, the editors and the reviewers. Any product that may be evaluated in this article, or claim that may be made by its manufacturer, is not guaranteed or endorsed by the publisher.
1. Amelung W, Bossio D, de Vries W, Kögel-Knabner I, Lehmann J, Amundson R, et al. Towards a global-scale soil climate mitigation strategy. Nat Commun. (2020) 11:5427. doi: 10.1038/s41467-020-18887-7
2. Nazir MJ, Li G, Nazir MM, Zulfiqar F, Siddique KHM, Iqbal B, et al. Harnessing soil carbon sequestration to address climate change challenges in agriculture. Soil Tillage Res. (2024) 237:105959. doi: 10.1016/j.still.2023.105959
3. Feng J, Liu YR, Eldridge D, Huang Q, Tan W, Delgado-Baquerizo M. Geologically younger ecosystems are more dependent on soil biodiversity for supporting function. Nat Commun. (2024) 15:4141. doi: 10.1038/s41467-024-48289-y
4. Rahman KMA, Zhang D. Effects of fertilizer broadcasting on the excessive use of inorganic fertilizers and environmental sustainability. Sustainability. (2018) 10. doi: 10.3390/su10030759
5. Bisht N, Chauhan PS. Excessive and disproportionate use of chemicals cause soil contamination and nutritional stress. In: Larramendy ML, Soloneski S, editors. Soil Contamination. IntechOpen, Rijeka (2020). doi: 10.5772/intechopen.94593
6. Liu H, Xu H, Wu Y, Ai Z, Zhang J, Liu G, et al. Effects of natural vegetation restoration on dissolved organic matter (DOM) biodegradability and its temperature sensitivity. Water Res. (2021) 191:116792. doi: 10.1016/j.watres.2020.116792
7. Chamoli A, Bhambri A, Karn SK, Raj V. Ammonia, nitrite transformations and their fixation by different biological and chemical agents. Chem Ecol. (2024) 40:166–99. doi: 10.1080/02757540.2023.2300780
8. Bartley R, Henderson A, Prosser I, Hughes A, McKergow L, Lu H, et al. Patterns of erosion and sediment and nutrient transport in the Herbert River catchment, Queensland. Consultancy Report CSIRO Land Water. (2003). doi: 10.4225/08/585ac4ac6b88e
9. Smil V. Nitrogen and food production: proteins for human diets. AMBIO: A J Hum Environ. (2002) 31:126–31. doi: 10.1579/0044-7447-31.2.126
10. Zeng J, Liu X, Song L, Lin X, Zhang H, Shen C, et al. Nitrogen fertilization directly affects soil bacterial diversity and indirectly affects bacterial community composition. Soil Biol Biochem. (2016) 92:41–9. doi: 10.1016/j.soilbio.2015.09.018
11. Dubiková M, Cambier P, Šucha V, Čaplovičová M. Experimental soil acidification. Appl Geochem. (2002) 17:245–57. doi: 10.1016/S0883-2927(01)00081-6
12. Castro GSA, Crusciol CAC. Effects of superficial liming and silicate application on soil fertility and crop yield under rotation. Geoderma. (2013) 195–196:234–42. doi: 10.1016/j.geoderma.2012.12.006
13. Soratto RP, Crusciol CAC. Dolomite and phosphogypsum surface application effects on annual crops nutrition and yield. Agron J. (2008) 100:261–70. doi: 10.2134/agronj2007.0120
14. Carvalho-Pupatto JG, Büll LT, Crusciol CAC. Soil chemical attributes, root growth and rice yield according to slag application. Pesquisa Agropecuária Brasileira. (2004) 39:1213–8. doi: 10.1590/S0100-204X2004001200008
15. Ramos LA, Nolla A, Korndörfer GH, Pereira HS, de Camargo MS. Reactivity of soil acidity correctives and conditioners in lysimeters. Rev Bras Ciec do Solo. (2006) 30:849–57. doi: 10.1590/S0100-06832006000500011
16. Alcarde JC, Rodella AA. Qualidade e legislação de fertilizantes e corretivos. In: Tópicos em Ciência do Solo. Brazil: Universidade Federal de Viçosa (2003). p. 291–334.
17. Xu D, Gao T, Fang X, Bu H, Li Q, Wang X, et al. Silicon addition improves plant productivity and soil nutrient availability without changing the grass:legume ratio response to N fertilization. Sci Rep. (2020) 10:10295. doi: 10.1038/s41598-020-67333-7
18. Solly EF, Weber V, Zimmermann S, Walthert L, Hagedorn F, Schmidt MW. A critical evaluation of the relationship between the effective cation exchange capacity and soil organic carbon content in Swiss forest soils. Front Forests Global Change. (2020) 3:98. doi: 10.3389/ffgc.2020.00098
19. Michalzik B, Kalbitz K, Park JH, Solinger S, Matzner E. Fluxes and concentrations of dissolved organic carbon and nitrogen – a synthesis for temperate forests. Biogeochemistry. (2001) 52:173–205. doi: 10.1023/A:1006441620810
20. Oste LA, Temminghoff EJM, Riemsdijk WHV. Solid-solution partitioning of organic matter in soils as influenced by an increase in pH or ca concentration. Environ Sci Technol. (2002) 36:208–14. doi: 10.1021/es0100571
21. Lofts S, Woof C, Tipping E, Clarke N, Mulder J. Modelling pH buffering and aluminium solubility in European forest soils. Eur J Soil Sci. (2001) 52:189–204. doi: 10.1046/j.1365-2389.2001.00358.x
22. Moore TR, Turunen J. Carbon accumulation and storage in mineral subsoil beneath peat. Soil Sci Soc America J. (2004) 68:690–6. doi: 10.2136/sssaj2004.6900
23. Kalbitz K, Solinger S, Park JH, Michalzik B, Matzner E. Controls on the dynamics of dissolved organic matter in soils: A review. Soil Sci. (2000) 165. doi: 10.1097/00010694-200004000-00001
24. Kaiser K, Guggenberger G. The role of DOM sorption to mineral surfaces in the preservation of organic matter in soils. Organic Geochem. (2000) 31:711–25. doi: 10.1016/S0146-6380(00)00046-2
25. Whittinghill KA, Hobbie SE. Effects of pH and calcium on soil organic matter dynamics in Alaskan tundra. Biogeochemistry. (2012) 111:569–81. doi: 10.1007/s10533-011-9688-6
26. Minasny B, Hong SY, Hartemink AE, Kim YH, Kang SS. Soil pH increase under paddy in South Korea between 2000 and 2012. Agric Ecosyst Environ. (2016) 221:205–13. doi: 10.1016/j.agee.2016.01.042
27. IUSS Working Group W. World reference base for soil resources. World Soil Resour Rep. (2006) 103. doi: 10.1017/S0014479706394902
28. Dunn L. Lime-requirement determination of soils by means of titration curves. Soil Sci. (1943) 56:341–52. doi: 10.1097/00010694-194311000-00003
29. National Institute of Agricultural Science. Methods of soil analysis. Suwon, Korea: Rural Development Administration (2010).
30. Cox MS. The lancaster soil test method as an alternative to the Mehlich-3 soil test method. Soil Science. (2001) 166:484–9. doi: 10.1097/00010694-200107000-00006
31. Honeysett JL, Ratkowsky DA. The use of ignition loss to estimate bulk density of forest soils. J Soil Sci. (1989) 40:299–308. doi: 10.1111/j.1365-2389.1989.tb01275.x
32. Penman J, Gytarsky M, Hiraishi T, Krug T, Kruger D, Pipatti R, et al. Good practice guidance for land use, land-use change and forestry. Hayama, Kanagawa, Japan: Institute for Global Environmental Strategies (2003).
34. National Institute of Agricultural Sciences, RDA. Monitoring project on agri-environment quality for 22 years in Korea. Wangju-Gun, South Korea: Rural Development Authority (2021) p. 30–45 p.
35. Jin J, Wang L, Müller K, Wu J, Wang H, Zhao K, et al. A 10-year monitoring of soil properties dynamics and soil fertility evaluation in Chinese hickory plantation regions of southeastern China. Sci Rep. (2021) 11:23531. doi: 10.1038/s41598-021-02947-z
36. Filipek T. Liming, effects on soil properties. In: Gliński J, Horabik J, Lipiec J, editors. Encyclopedia of Agrophysics. Springer Netherlands, Dordrecht (2011). p. 425–8. doi: 10.1007/978-90-481-3585-1_84
37. Joo JH, Lee SB. Assessment of silicate fetilizers application affecting soil properties in paddy field. Korean J Soil Sci Fertilizer. (2011) 44:1016–22. doi: 10.7745/KJSSF.2011.44.6.1016
38. Tian D, Niu S. A global analysis of soil acidification caused by nitrogen addition. Environ Res Lett. (2015) 10:024019. doi: 10.1088/1748-9326/10/2/024019
39. Olego MÁ, Quiroga MJ, López R, Garzón-Jimeno E. (2021). The importance of liming with an appropriate liming material: long-term experience with a typic palexerult. Plants (2021) 10. doi: 10.3390/plants10122605
40. Andersson S, Nilsson I, Valeur I. Influence of dolomitic lime on DOC and DON leaching in a forest soil. Biogeochemistry. (1999) 47:297–317. doi: 10.1007/BF00992911
41. Chan K, Heenan D. Lime-induced loss of soil organic carbon and effect on aggregate stability. Soil Sci Soc America J. (1999) 63:1841–4. doi: 10.2136/sssaj1999.6361841x
42. Qaswar M, Dongchu L, Jing H, Tianfu H, Ahmed W, Abbas M, et al. Interaction of liming and long-term fertilization increased crop yield and phosphorus use efficiency (PUE) through mediating exchangeable cations in acidic soil under wheat–maize cropping system. Sci Rep. (2020) 10:19828. doi: 10.1038/s41598-020-76892-8
43. Holland JE, White PJ, Glendining MJ, Goulding KWT, McGrath SP. Yield responses of arable crops to liming – An evaluation of relationships between yields and soil pH from a long-term liming experiment. Eur J Agron. (2019) 105:176–88. doi: 10.1016/j.eja.2019.02.016
44. Park JS, Ro HM. Early-stage changes in chemical phosphorus speciation induced by liming deforested soils. J Soil Sci Plant Nutr. (2018) 18:435–47. doi: 10.4067/S0718-95162018005001303
45. Jaskulska I, Jaskulski D, Kobierski M. Effect of liming on the change of some agrochemical soil properties in a long-term fertilization experiment. Plant Soil Environ. (2014) 60:146–50. doi: 10.17221/850/2013-PSE
46. Bowman WD, Cleveland CC, Halada Ĺ, Hreško J, Baron JS. Negative impact of nitrogen deposition on soil buffering capacity. Nat Geosci. (2008) 1:767–70. doi: 10.1038/ngeo339
47. Greger M, Landberg T, Vaculík M. Silicon influences soil availability and accumulation of mineral nutrients in various plant species. Plants. (2018) 7. doi: 10.3390/plants7020041
48. Ferrarezi RS, Lin X, Neira ACG, Zambon FT, Hu H, Wang X, et al. Substrate pH influences the nutrient absorption and rhizosphere microbiome of Huanglongbing-affected grapefruit plants. Front Plant Sci. (2022) 13. doi: 10.3389/fpls.2022.856937
49. Fu C, Zhang H, Tu C, Li L, Liu X, Luo Y. Spatial interpolation of orchard soil pH using soil type and planting duration as auxiliary information. Pedosphere. (2020) 30:628–37. doi: 10.1016/S1002-0160(18)60045-1
50. Reardon CL, Klein AM, Melle CJ, Hagerty CH, Klarer ER, MaChado S, et al. Enzyme activities distinguish long-term fertilizer effects under different soil storage methods. Appl Soil Ecol. (2022), 177:104518. doi: 10.1016/j.apsoil.2022.104518
51. Turner BL. Variation in pH optima of hydrolytic enzyme activities in tropical rain forest soils. Appl Environ Microbiol. (2010) 76:6485–93. doi: 10.1128/AEM.00560-10
52. Fierer N, Jackson RB. The diversity and biogeography of soil bacterial communities. Proc Natl Acad Sci U S A. (2006) 103:626–31. doi: 10.1073/pnas.0507535103
53. Lauber CL, Hamady M, Knight R, Fierer N. Pyrosequencing-based assessment of soil pH as a predictor of soil bacterial community structure at the continental scale. Appl Environ Microbiol. (2009) 75:5111–20. doi: 10.1128/AEM.00335-09
54. Ndabankulu K, Egbewale SO, Tsvuura Z, Magadlela A. Soil microbes and associated extracellular enzymes largely impact nutrient bioavailability in acidic and nutrient poor grassland ecosystem soils. Sci Rep. (2022) 12:12601. doi: 10.1038/s41598-022-16949-y
55. Samaddar S, Truu J, Chatterjee P, Truu M, Kim K, Kim S, et al. Long-term silicate fertilization increases the abundance of Actinobacterial population in paddy soils. Biol Fertil Soils. (2019) 55:109–20. doi: 10.1007/s00374-018-01335-6
56. Marxen A, Klotzbücher T, Jahn R, Kaiser K, Nguyen VS, Schmidt A, et al. Interaction between silicon cycling and straw decomposition in a silicon deficient rice production system. Plant Soil. (2016) 398:153–63. doi: 10.1007/s11104-015-2645-8
57. Rong Y, Wang Y, Guan Y, Ma J, Cai Z, Yang G, et al. Pyrosequencing reveals soil enzyme activities and bacterial communities impacted by graphene and its oxides. J Agric Food Chem. (2017) 65:9191–9. doi: 10.1021/acs.jafc.7b03646
58. Vestergaard G, Schulz S, Schöler A, Schloter M. Making big data smart—how to use metagenomics to understand soil quality. Biol Fertil Soils. (2017) 53:479–84. doi: 10.1007/s00374-017-1191-3
59. Schloter M, Nannipieri P, Sørensen SJ, van Elsas JD. Microbial indicators for soil quality. Biol Fertil Soils. (2018) 54:1–10. doi: 10.1007/s00374-017-1248-3
60. Badr M, Shafei A, Sharaf El-Deen S. The dissolution of K and P-bearing minerals by silicate dissolving bacteria and their effect on sorghum growth. Res J Agric Biol Sci. (2006) 2:5–11.
61. Shi S, Zhang W, Zhang P, Yu Y, Ding F. A synthesis of change in deep soil organic carbon stores with afforestation of agricultural soils. For Ecol Manag. (2013) 296:53–63. doi: 10.1016/j.foreco.2013.01.026
62. Deng L, Zhu G-y, Tang Z-s, Shangguan Z-p. Global patterns of the effects of land-use changes on soil carbon stocks. Global Ecol Conserv. (2016) 5:127–38. doi: 10.1016/j.gecco.2015.12.004
63. Li D, Niu S, Luo Y. Global patterns of the dynamics of soil carbon and nitrogen stocks following afforestation: a meta-analysis. New Phytologist. (2012) 195:172–81. doi: 10.1111/j.1469-8137.2012.04150.x
64. Ji Z, Yang X, Song Z, Liu H, Liu X, Qiu S, et al. Silicon distribution in meadow steppe and typical steppe of northern China and its implications for phytolith carbon sequestration. Grass Forage Sci. (2018) 73:482–92. doi: 10.1111/gfs.12316
65. Reithmaier GMS, Knorr KH, Arnhold S, Planer-Friedrich B, Schaller J. Enhanced silicon availability leads to increased methane production, nutrient and toxicant mobility in peatlands. Sci Rep. (2017) 7:8728. doi: 10.1038/s41598-017-09130-3
Keywords: soil fertility, carbon stratification, carbon sequestration, lime, silicate
Citation: Amoakwah E, Kim S-H, Jeon S, Shim J-H, Lee Y-H, Kwon S-I and Park S-J (2024) Long-term fertilization and liming increase soil fertility but reduce carbon stratification and stocks of paddy rice soils. Front. Soil Sci. 4:1426894. doi: 10.3389/fsoil.2024.1426894
Received: 02 May 2024; Accepted: 18 June 2024;
Published: 05 July 2024.
Edited by:
Jay Prakash Verma, Banaras Hindu University, IndiaReviewed by:
Sudhir Kumar Rajpoot, Banaras Hindu University, IndiaCopyright © 2024 Amoakwah, Kim, Jeon, Shim, Lee, Kwon and Park. This is an open-access article distributed under the terms of the Creative Commons Attribution License (CC BY). The use, distribution or reproduction in other forums is permitted, provided the original author(s) and the copyright owner(s) are credited and that the original publication in this journal is cited, in accordance with accepted academic practice. No use, distribution or reproduction is permitted which does not comply with these terms.
*Correspondence: Sangho Jeon, amVvbjQ1QGtvcmVhLmty
†These authors share first authorship
Disclaimer: All claims expressed in this article are solely those of the authors and do not necessarily represent those of their affiliated organizations, or those of the publisher, the editors and the reviewers. Any product that may be evaluated in this article or claim that may be made by its manufacturer is not guaranteed or endorsed by the publisher.
Research integrity at Frontiers
Learn more about the work of our research integrity team to safeguard the quality of each article we publish.