 Mary E. Foltz
 Agustín Alesso
 Julie L. Zilles
- 1School of Civil and Environmental Engineering, Oklahoma State University, Stillwater, OK, United States
- 2Department of Civil and Environmental Engineering, University of Illinois Urbana-Champaign, Urbana, IL, United States
- 3Department of Crop Sciences, University of Illinois Urbana-Champaign, Urbana, IL, United States
- 4Instituto de Ciencias Agropecuarias del Litoral, Universidad Nacional del Litoral-Concejo Nacional de Investigaciones Científicas y Técnicas, Esperanza, Argentina
Nitrous oxide (N2O), which contributes to global climate change and stratospheric ozone destruction, can be produced during denitrification. Although the N2O ratio, a measure of denitrification completion, is influenced by various properties, studies have largely been limited to site- or treatment-specific conclusions. The primary objective of this study was to identify important factors driving N2O ratios and their relationships in soils by systematically reviewing and quantitatively evaluating results from published laboratory denitrification studies. A database with 60 studies (657 observations) was compiled, including studies meeting the minimum criteria: (i) laboratory experiments on soils, (ii) nutrient (carbon and/or nitrogen) addition, and (iii) N2O and dinitrogen gas measurements. Of these, 14 studies (100 observations) had sufficient data for inclusion in the meta-analysis to assess the effect of added nutrients on the N2O ratio. Furthermore, we modeled the effect of moderators on treatment effect by fitting a meta-regression model with both quantitative and categorical variables. Close review of studies in the database identified soil pH, carbon addition, and nitrogen addition as important variables for the N2O ratio, but trends varied across studies. Correlation analysis of all studies clarified that soil pH was significantly correlated with the N2O ratio, where soils with higher pH had lower N2O ratios. The meta-analysis further revealed that nutrient addition had an overall significant, positive treatment effect (0.30 ± 0.03, P<.0001), indicating that experimentally adding nutrients increased the N2O ratio. The model was most significantly improved when soil texture was used as a moderator. The significance of soil texture for the N2O ratio was a major finding of this study, especially since the assays were usually conducted with soil slurries. Overall, this study highlights the importance of field soil properties (i.e., pH, texture) and laboratory conditions (i.e., nutrient addition) in driving the N2O ratio and N2O production from denitrification in soils.
1 Introduction
Nitrous oxide (N2O) contributes significantly to global climate change and stratospheric ozone destruction (1, 2). Managed and natural soils are a significant source of global N2O emissions (3, 4). However, prediction and modeling of N2O emissions remain challenging (4, 5), hampering efforts to reduce emissions. Several microbial processes are known to produce N2O, including denitrification, nitrification, nitrifier denitrification, and dissimilatory nitrate reduction to ammonia (6–8). This study focuses on denitrification, one important source of N2O in soils (8, 9). Denitrification is the stepwise reduction of nitrate to dinitrogen (N2) gas and can release the intermediate N2O.
Denitrification is typically investigated using acetylene-based or stable isotope approaches; both approaches have been in use for more than 30 years and have different strengths and limitations (e.g., reviewed in 10–12). Environmental factors promoting denitrification include low oxygen levels, sufficient nitrate and organic carbon (C) availability, high soil moisture, alkaline pH, and warm temperatures (13–16).
N2O emissions from denitrification are a function of the overall denitrification rate, how often the pathway stops at the intermediate N2O, and any consumption of N2O that occurs before the N2O is released to the atmosphere. In the acetylene-based approaches, N2O production is typically quantified by conducting a separate set of measurements in the absence of acetylene, whereas in the stable isotope studies both N2O and N2 would typically be quantified directly. The proportion ending at the intermediate N2O is most often quantified through the N2O ratio, defined as N2O produced over total denitrification. A ratio closer to one indicates truncated or less complete denitrification (greater N2O, less N2), while a ratio closer to zero indicates more complete denitrification (less N2O, more N2).
While the N2O ratio is influenced by the same environmental parameters as the overall process of denitrification, the effects are not always the same (8, 13). For example, while denitrification rates tend to increase with both temperature and pH, the N2O ratio decreases as pH increases (8, 17–20). The N2O ratio also decreases when organic carbon is abundant (8, 21). While oxygen typically inhibits denitrification, the presence of low levels of oxygen can increase the N2O ratio (22–24). High nitrate concentrations have also been reported to increase the N2O ratio (24–26). However, the effects of nitrate on the N2O ratio may only appear when carbon is limiting (27). High carbon:nitrogen (C:N) ratios (>25), on the other hand, typically result in no or low N2O ratios (28, 29). The microbial community composition has been suggested as another driver of the N2O ratio, especially since the denitrifying fungi that have been characterized seem to lack the capacity to reduce N2O (30, 31) and bacteria have been identified that can reduce N2O, but lack the capacity to catalyze the earlier steps in the pathway (32, 33). However, the fairly consistent results across different soil types in some studies could argue against this idea (25). Relationships between genetic markers and N2O production also remain elusive (34, 35).
Despite this substantial body of knowledge, N2O emissions remain difficult to predict, and even mechanistic or process-based models often show large differences when compared to field measurements (26, 36–39). Although the recognized spatial and temporal variability (often referred to as hot spots and hot moments) certainly contributes to the difficulty (37, 40), systematically comparing the varied conditions tested in lab assays could provide new insight into drivers of the N2O ratio. Such drivers could be incorporated into empirical models to improve accuracy of direct soil N2O emission estimates.
To investigate drivers of the N2O ratio, we conducted a systematic review and meta-analysis following published guidelines (41–43) of soil studies containing either N2O ratios or measurements that allowed calculation of N2O ratios from laboratory assays. The specific objectives of this study were to (i) determine if nutrient addition (C and/or N) significantly influences the N2O ratio, (ii) identify other factors that may influence the N2O ratio, and (iii) quantify the impact of nutrient addition and other factors on the N2O ratio in soils. We assessed the treatment effect from added C and N during the experiments and modeled the effect of soil moderators to understand factors influencing the N2O ratio under a variety of field managements, soil properties, and experimental conditions.
2 Materials and methods
2.1 Database compilation
The peer-reviewed literature was systematically reviewed (Figure 1) following published guidelines (41, 43) to select publications that included laboratory measurement of denitrification and N2O production potentials in soil. The Scopus search was conducted in August 2021 with the search term ‘nitrous oxide’ and any combination of the terms ‘denitrification potential’, ‘denitrif* enzyme assay*’, ‘denitrif* enzyme activit*’, ‘DEA’, and ‘DNP’ in the title, abstract, or key words. This search yielded 270 results when limited to those available in English. These articles were screened by reviewing abstracts and methods to remove unrelated studies (e.g., biochemistry studies of diethylamine nonoate, abbreviated DEA/NO) or studies that did not include data necessary to calculate the N2O ratio. Included studies met the following minimum criteria: (i) laboratory experiments on soils, (ii) nutrient (C and/or N) addition, and (iii) N2O and N2 measurements, either using acetylene inhibition or direct measurement. In addition, seven studies were identified and included although they did not show up in the original search.
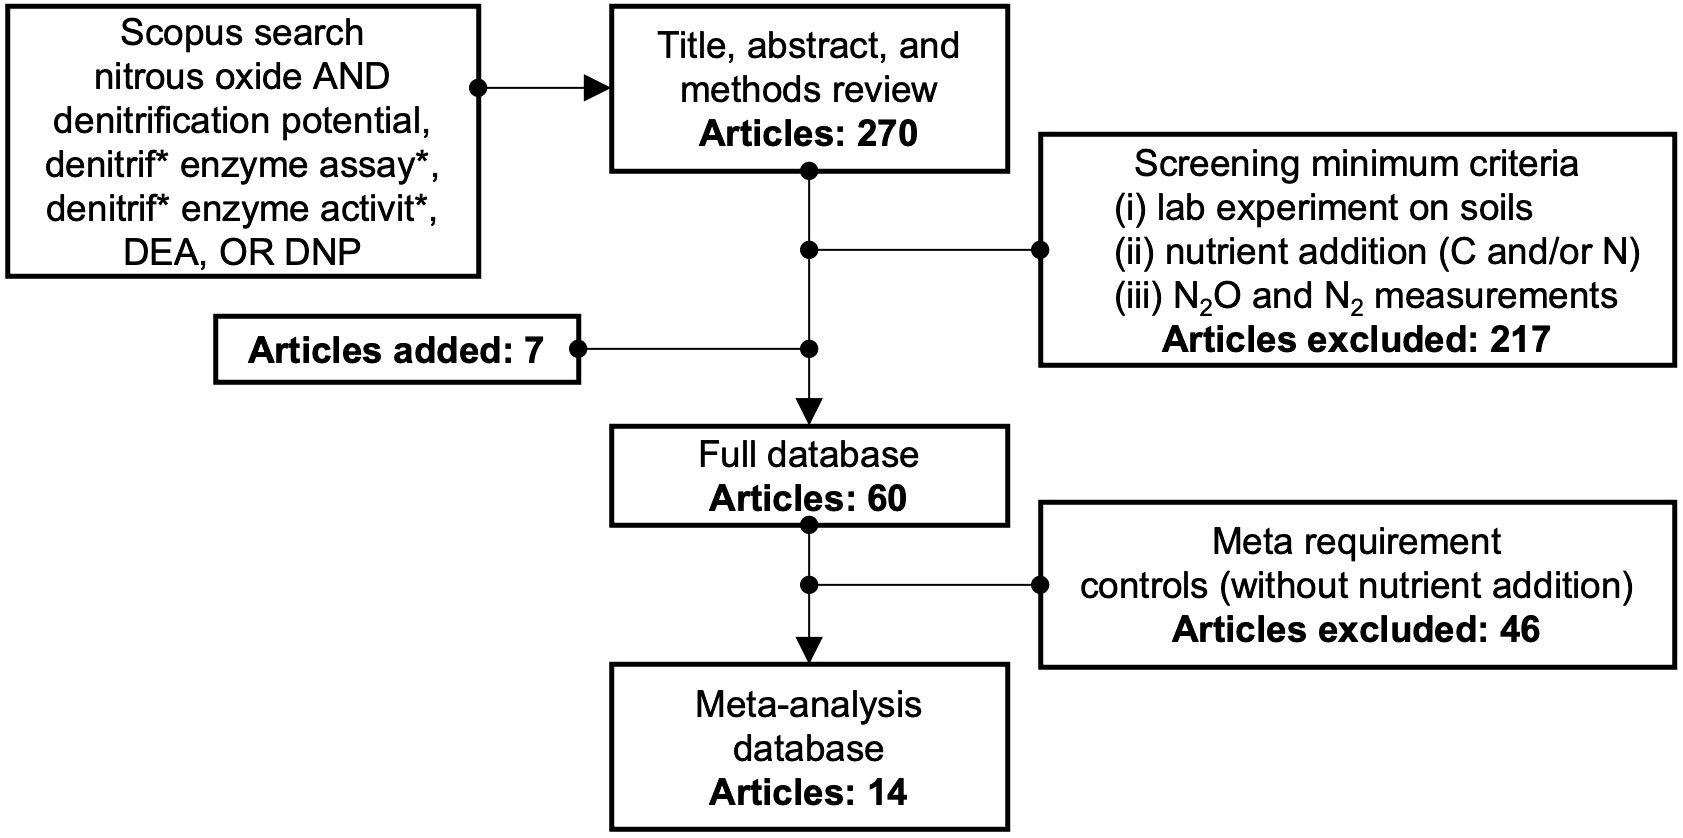
Figure 1 Approach to selecting articles for inclusion in the final and meta databases. The * is standard usage in search engines like Scopus and means the search engine will search words containing the letters before/after the * and allow for variations in the word. For example, our use of "denitrif*" allows for "denitrification" and "denitrifying".
The following data was recorded for each paper: location (country), soil source (e.g., grassland), soil type, soil texture class, soil bulk density, soil pH, soil amount used in experiment, added C and N types and amounts, inhibitors used, headspace gas, incubation time and temperature, and the N2O ratio and error for treatments and controls. Standard conversions were used to report all data with the same units. Data was extracted from tables and text or from figures using GetData version 2.26 (44). From each study, different field treatments, sites, sample locations, dates, experimental treatments, or incubation times were counted as separate observations when replicates and standard deviations were also reported. Missing data for standard deviations and replicates were obtained via author communications or estimated (range of study observations divided by four, with replicates reduced to one observation). When multiple depths were reported, only samples from the topmost soil layer (approximately 0-15 cm) were considered. Soil textures were often estimated using any available information from publications, such as soil series, order, or description.
A total of 60 studies (657 observations) were included in the final database (Supplementary Table 1). Of these, 14 studies (100 observations) also included controls (defined as experiments without nutrient additions) for complete inclusion in the meta-analysis. Studies without controls were still included in the database for use in selection of moderators for the meta-regression. The final database is available as detailed in the “Data Availability Statement” section below.
2.2 Selection of moderators
Moderators for use in model improvement testing (meta-regression) were selected based on a literature review, tree-based modeling, and correlation analysis. All three approaches assessed the effect of categorical and/or numerical study variables on the N2O ratio. The literature review was completed by reviewing results and discussions from all publications in the database to identify factors identified by authors as influencing the N2O ratio. Tree-based modeling and correlation analysis were performed using the full database (n=657) in R version 4.2.2 (45) with the added ‘randomForest’ package for tree-based modeling. With tree-based modeling, a random forest model was fitted to the data and the categorical and/or numerical variables that were the most significant features were assessed through variable importance analysis. For correlation analysis, the nonparametric Spearman’s Rank Correlation test (‘corr.test’ function in R) was used to measure the association between the outcome and moderators. As this procedure is based on ranks, it can handle variables with distributions other than normal.
2.3 Meta-analysis and meta-regression
The meta-analysis was performed in R version 4.2.2 (45) using the ‘metafor’ package (46). A random effects mixed model was used with and without moderators. The effect size was calculated for each observation using the raw mean difference and heterogeneity (tau-squared, τ2) was calculated using the DerSimonian-Laird estimate. Treatment was defined as the experimental addition of C and/or N, and control was defined as identical experiments without any nutrient addition. The variable of comparison between studies was the N2O ratio, a value ranging between 0 and 1, where 0 indicates no N2O production (all of the denitrification is complete) and 1 indicates only N2O is produced. Therefore, the treatment effect (or effect size) was calculated as the mean difference between the N2O ratio for the treatment and control.
The mean difference could range from -1 to 1, with positive values indicating that nutrient addition (treatment) increased the N2O ratio and negative values indicating nutrient addition decreased the N2O ratio. Bias of this meta-analysis was assessed using Spearman’s Rank Correlation between effect size and variance (47).
A meta-regression model was fitted to test moderators, both factors and covariates, that accounted for variability between studies and moderate treatment effect. The model was improved stepwise by adding one moderator at a time and assessing improvement to model fit (Figure 2). Improvements to model fit were assessed using likelihood ratio tests (LRT) between the model with and without the added moderators.
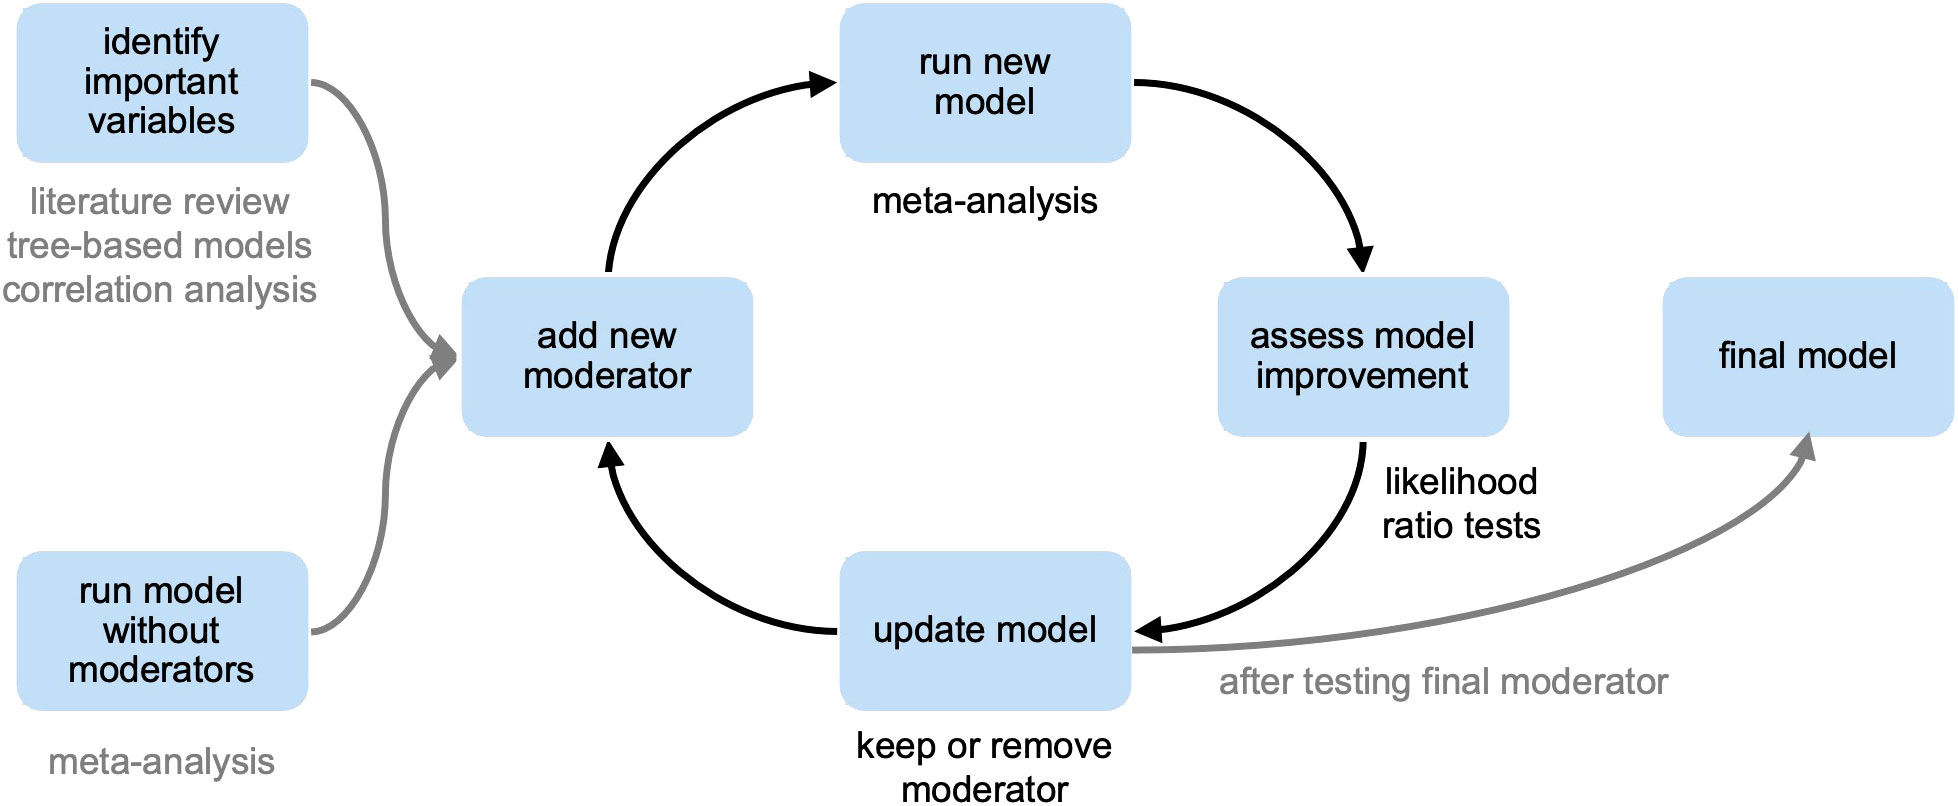
Figure 2 Systematic approach to improving meta-analysis model fit through stepwise addition of moderators.
3 Results
3.1 Database overview
The complete database included studies from twelve countries, encompassing a variety of climates, soils, field managements, and experimental conditions (Table 1). Most studies and observations were based on the acetylene-inhibition technique, with only three studies and 11 observations in the full database from direct measurement (48–50). While the meta-analysis database was able to capture some of the variability of the full database, it was biased towards some sample types. For instance, sandy soils and those from wetlands were more dominant in the meta-analysis database compared to the full database. In addition, mean experimental C addition was an order of magnitude lower in the meta-analysis database.
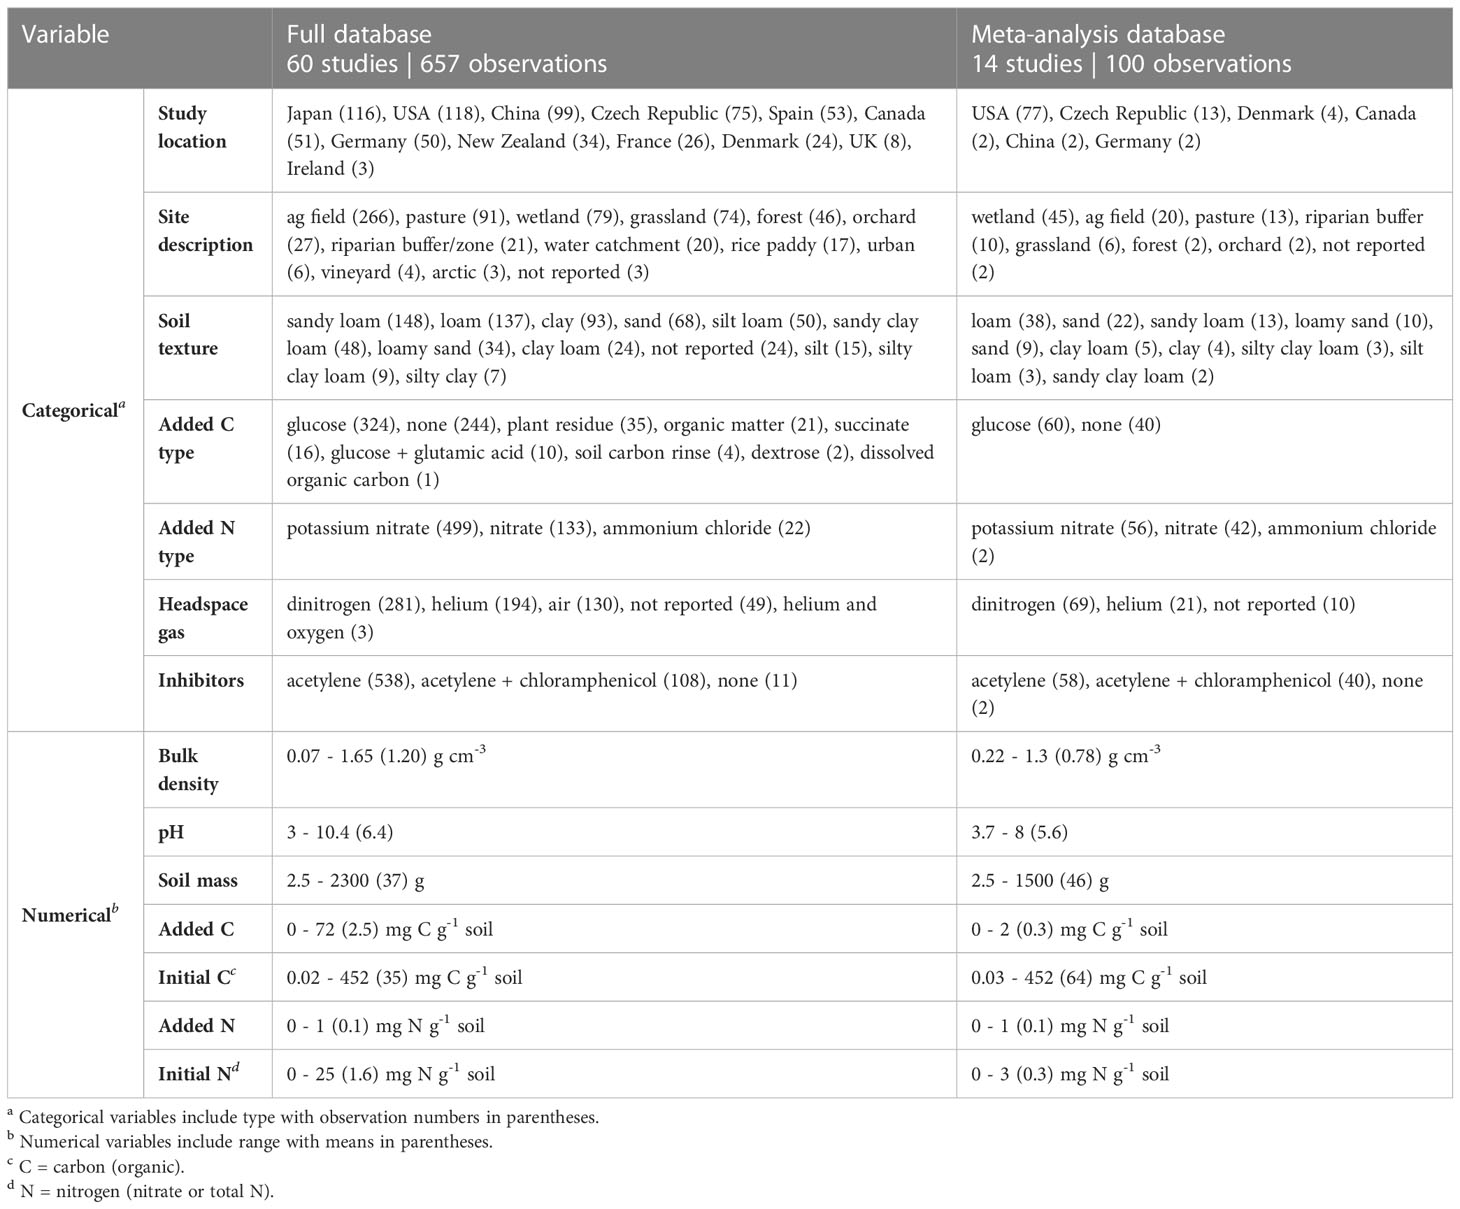
Table 1 Summary of values for categorical and numerical variables included in the full database and meta-analysis database.
3.2 Selection of moderators
The effect of variables on the N2O ratio were assessed through a literature review, tree-based modeling, and correlation analysis, to identify moderators for use in model improvement testing (meta-regression). For the literature review, we began by compiling a list of variables that influence the N2O ratio, based on conclusions from studies in the database. We then identified studies that deliberately manipulated experimental conditions to test the effect of those variables on the N2O ratio. The most common experimental consideration was pH, for which studies considered 2-8 different pH levels for the same soil sample (18, 22, 51–55). The next most common variable was experimental nutrient addition (C and/or N), where most studies only tested the presence or absence of added nutrients (26, 49, 56–58). However, there were two studies that tested multiple levels and combinations of nutrient additions (21, 59). Overall, the literature review highlighted soil pH and experimental nutrient addition as common variables tested for their influence on the N2O ratio.
In parallel, we used a tree-based random forest model to identify variables that were the most important at explaining the variability of N2O ratio in the full database (Supplementary Tables 2, 3). Three splits were sufficient to explain variability without increasing model complexity unnecessarily. The first split was based on soil pH (split at pH 6.65), and the following two splits were based on soil texture (categorical) and added N (split at 0.065 mg N g-1 soil). Therefore, tree-based modeling highlighted soil pH, texture, and experimental N addition as important variables for the N2O ratio. As such, all other considered variables (e.g., incubation temperature, headspace gas, experimental C addition) were considered less important in explaining variability between N2O ratios from studies.
We also applied correlation analysis, identifying numerical variables that correlate most strongly with the N2O ratio in the full database (Figure 3). The strongest correlation was observed for soil pH, with a correlation coefficient of -0.44. The strong negative correlation indicated that the N2O ratio decreased with increases in soil pH. Although other variables exhibited significant correlations, pH was the only variable with a strong correlation to the N2O ratio.
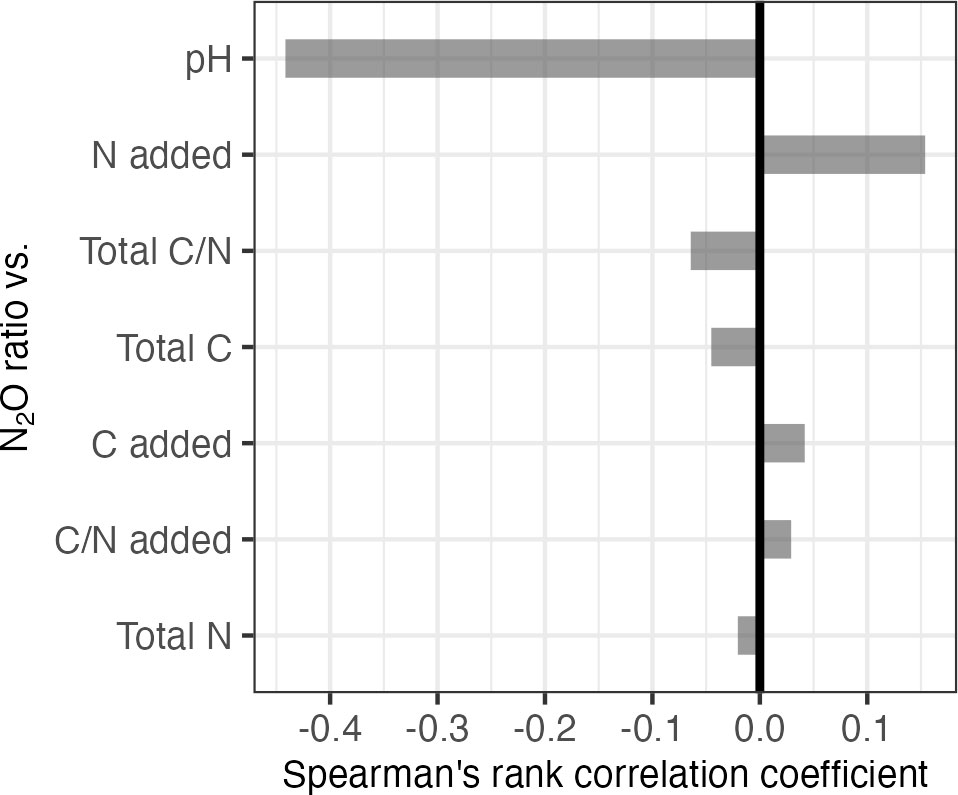
Figure 3 Spearman’s rank correlation coefficients for N2O ratios for treatments (full database, n=657) compared to numerical variables. Positive correlation indicates a direct relationship between the variables, while negative correlation indicates an inverse relationship between the variables. Values near ±1 indicate strong positive or negative correlations, while values near 0 indicate poor correlation. N=nitrogen, C=carbon, C/N=carbon to nitrogen ratio, added=experimental nutrient addition, total=sum of nutrients in soil sample and those added in lab.
3.3 Meta-analysis and meta-regression
For the meta-analysis, the treatment considered was experimental nutrient addition. The meta-analysis was first conducted using a random effects mixed model without moderators. The model showed a significant, positive treatment effect of 0.30 ± 0.03 (P<.0001), indicating that nutrient addition significantly increased the N2O ratio. Since nutrient addition could include C and/or N addition, the conclusion cannot be directly extrapolated to either nutrient addition individually. However, since all observations in the meta-analysis included N addition and only half included C addition, the nutrient addition treatment is biased towards N addition. This reflects the literature as well since all the studies in the full database added N but fewer (63%) added C. The range of added C was smaller in the meta-analysis database (0-2 mg C g-1 soil) than the full database (0-72 mg C g-1 soil). Meta-analysis bias was further assessed using correlation analysis between effect size and variance, which had a correlation coefficient of -0.12 (P=.23), suggesting overall bias was low.
After finding significant effect of treatments on the N2O ratio across studies, improvements to model fit were assessed using LRT between the model with and without the added moderators (Table 2; Supplementary Figure 1). Since pH was identified as important through tree-based modeling and correlation analysis, it was selected as the first moderator. In addition, texture was also tested as the first moderator since it showed up as an important variable in the tree-based model. The model was significantly improved (P<.0002) by adding either pH or texture as the first moderator. Further improvement was found by adding texture to the pH model (P<.0001), but not when pH was added to the texture model (P=.37). Next, nutrient additions and total nutrient levels were added one at a time to the pH and texture model. The model was only significantly improved by using added C (P=.01) or added N (P=.01) as the third moderator. No further significant improvement was found through the addition of more moderators. Each incremental model improvement yielded an equally significant model (P<.0001), but negligible change in τ2 was seen for moderator addition beyond texture (Table 2). Therefore, the model with texture as the only moderator was selected as the final model with a τ2 of.0033, which was a significant improvement from the model without any moderators (τ2=.0394). This outcome signifies that soil texture best explained the variability between studies.
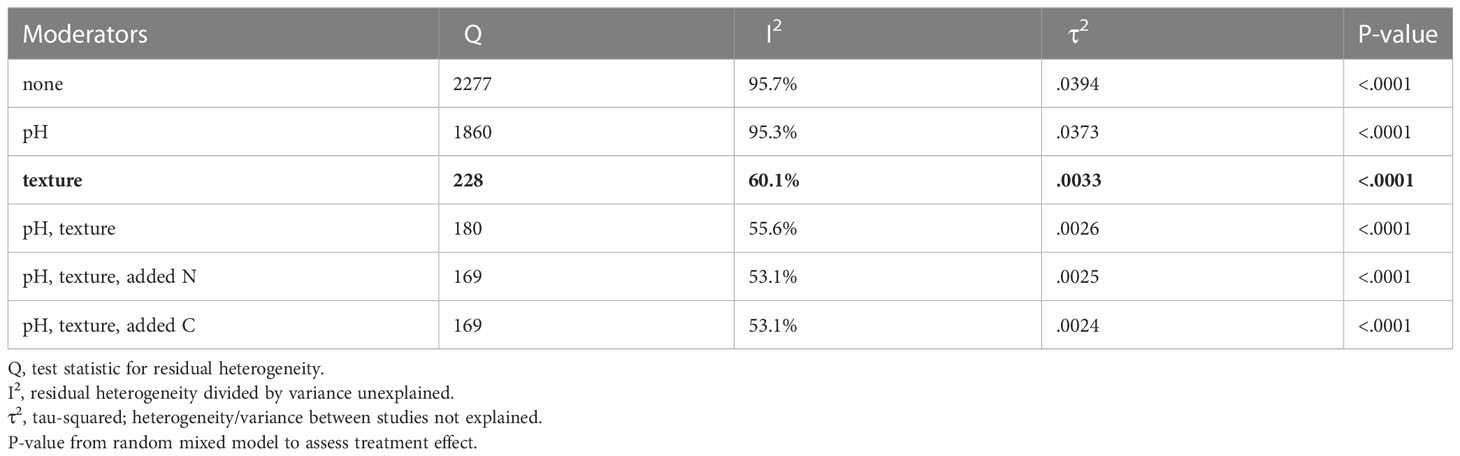
Table 2 Incremental model improvement by adding moderators. Final model selected for discussion is presented in bold.
For the best model (texture as the moderator), there was a significant overall treatment effect (mean difference: 0.17; P<.0001). Therefore, adding a moderator to the model did not change the overall trend observed in the base model—nutrient addition increased the N2O ratio. We also considered the treatment effects within subgroups (i.e., texture class). When separated out by texture (Figure 4), some soil textures (i.e., sandy loam, clay loam, silty clay loam) exhibited more positive treatment effects, indicating a stronger positive influence of nutrient addition on the N2O ratio. All other soil textures had treatment effects near zero. It should be noted, however, that when separating out treatment effects by texture, some comparisons were based on only one or two studies (i.e., silty clay loam, sandy clay loam).
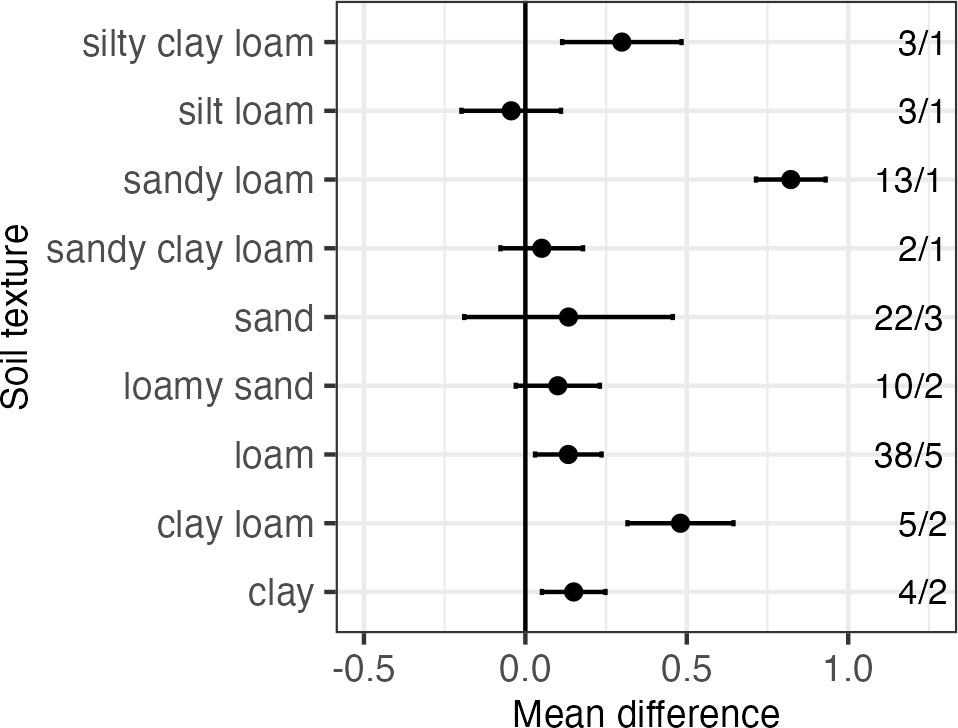
Figure 4 Results from subgroup analysis for N2O ratio treatment effect (mean difference) subdivided by soil texture. Error bars represent 95% confidence intervals. The number of observations and studies included in each category are also presented to the right of the figure (observations/studies).
As the interactions between variables could lead to confounding results, we also considered soil pH and C addition within the texture class subgroups (Supplementary Figures 2, 3). However, no clear trends were observed.
4 Discussion
The primary objective of this study was to identify factors driving N2O ratios and their relationships across a broad range of soils and experimental conditions. To accomplish this, we applied statistical methods (i.e., tree-based models, correlation analyses, meta-analysis, and meta-regression) to data obtained from published denitrification studies. Overall, these approaches revealed that nutrient addition, soil texture, and soil pH are the most influential variables for the N2O ratio. Furthermore, the meta-analysis had an overall positive treatment effect, suggesting that experimental nutrient addition generally increased the N2O ratio in laboratory soil denitrification experiments. The inclusion of data from 60 unique studies enabled trends previously identified (e.g., pH effects) to be confirmed across a diverse range of soil properties and origins and suggested that soil texture is an important driver even in laboratory assays where much of the structure has been disrupted.
4.1 Soil pH
Soil pH showed up as significant in all three moderator selection methods, indicating that soil pH is strongly related to the N2O ratio in soils, with higher pH soils likely have the lowest potential to produce N2O. The general negative correlation between soil pH and the N2O ratio observed in this meta-analysis is consistent with several denitrification studies that explicitly tested at least two different pH levels (18, 22, 51, 52, 54, 55, 60). This relationship has been previously linked to assembly of functional N2O reductase, which is prevented at low pH, ultimately limiting reduction of N2O (61). At least one soil seems to behave differently, with a higher N2O ratio at pH 7.41 than at more acidic pH conditions (53). However, that soil had a native pH of 3.71, and its denitrification activity was greatly diminished by adjusting the pH to 7.41, so it is probably not representative of most soils. The most comprehensive of the considered studies tested eight different pH levels between 3-11 for three distinct pasture soils (natural pH 5.3-6.9) (18). They found the inverse relationship between pH and the N2O ratio could be fit with a single logarithmic function for all 24 data points. Overall, the inverse relationship between soil pH and the N2O ratio was verified here across diverse soil samples and experimental conditions. It would be helpful to test additional soil types at multiple pH levels to determine if the logarithmic function described in that previous study is generally applicable (18). If so, incorporating pH might improve predictive models for N2O emissions from denitrification. For example, a recent study applied regression modeling to determine drivers for N2O production in semi-arid soils and included pH (along with water content and nitrate) in the final model (35).
4.2 Nutrient addition
The meta-analysis showed a significant positive treatment effect, indicating that experimental nutrient addition of N and/or C generally increased the N2O ratio. Studies used in the meta-analysis were biased towards N addition, so this nutrient had more weight in the resulting treatment effect. Indeed, several studies have found that experimental N addition increased the N2O ratio (21, 24, 25, 49, 57–59). The effect of C addition was not considered as often, with a few studies finding an inverse relationship between C addition and the N2O ratio (21, 26, 56) and one finding no significant effect (59).
Interpreting the effect of C addition is complicated by evidence that the C:N ratio can also influence the N2O ratio (28, 29). However, neither the tree-based analyses nor the correlation analyses reported here identified C:N as an important variable for the N2O ratio. Furthermore, the meta-regression was not improved by adding C:N as a moderator, although adding either C or N addition individually slightly improved the model. Inconsistencies in the way soil C and N are measured and reported in publications could have contributed to this discrepancy. Although experimental N additions were usually in the form of nitrate, the carbon additions varied. Differences in C source complicate comparisons of the C:N ratio, as some forms may be more bioavailable than others. Some experimental glucose additions have even been shown to affect organic matter mineralization, potentially mobilizing C and N from soil and making them more bioavailable (62). Furthermore, interactions between these nutrients may complicate the overall effect, as one study noted significant interaction effects between C and N addition (59). Therefore, the impacts of C addition on the N2O ratio need further investigation, with particular attention to the possible influences of the C:N ratio and the form of C added.
4.3 Soil texture
The identification of soil texture as an important moderator of the N2O ratio is a key contribution of this work. While the importance of soil structure (and to a lesser degree texture) for emissions of N2O and other greenhouse gases has been studied (63), the effects of soil structure are generally thought to occur through its influence on soil moisture, anaerobicity, and exchange of gases with the atmosphere. However, the laboratory assays are designed to be as uniform as possible in these properties, usually using soil slurries, so it is striking that soil texture is still an important moderator of the N2O ratio. This could suggest the importance of textural components that would not be impacted by these laboratory manipulations, such as the proportion of clay, silt, and sand. Another possible mechanism could be the influence soil texture and/or structure had on the microbial community before the soil was sampled, leading to differences in their laboratory potential.
To our knowledge, no studies have explicitly tested soil texture effects on the N2O ratio. One study observed a higher N2O ratio in sandy soil compared to loam and clay soil, but the sandy soil also had a lower pH, which could be responsible for the difference (49). Another study found that sandy soils had lower potential to produce N2O, but they did not measure total denitrification, so the influence on the N2O ratio could not be compared (64). A recent study quantified the effect of several categorical variables on global forest and grassland annual N2O emissions from field-based studies and similarly identified soil texture as a significant driver (65). Further, they identified soil clay content to be an important driver for field N2O emissions from forest soils (65).Our meta-regression strongly suggests that soil texture merits greater scrutiny. Considering the low numbers of observations and studies for many soil textures, research priorities should include i) consistent measurement and reporting of detailed soil texture data (percentages of clay, silt, and sand) and ii) studies specifically designed to compare the N2O ratio across soils with different textures, controlling for important variables such as pH and nutrient content. Fortunately, texture has the benefits of being more affordable to measure and less temporally variable than many soil properties, making its addition to planned and future studies more feasible.
5 Conclusions
This study systematically reviewed published data and applied a meta-analysis to assess the influence of experimental nutrient addition on the N2O ratio in soils. A cyclic meta-regression was then applied to identify other moderators of the N2O ratio. The model was most significantly improved by adding soil texture as a moderator, and was moderately improved by adding soil pH and C and/or N addition. This suggests that these variables generally have a strong influence on the N2O ratio and its variability between studies. The significant influence of experimental nutrient additions signifies that the experimental conditions used to quantify the N2O ratio should be closely considered when extrapolating results beyond the laboratory setting. Understanding the relationships between these drivers and N2O emissions can inform future research and guide improvements to models used to predict N2O emissions, for example by incorporating or enhancing the inclusion of soil pH and/or texture. Additional studies would need to be conducted across different soil textures, in particular, to identify appropriate empirical relationships between this variable and the N2O ratio.
Data availability statement
The datasets presented in this study can be found in online repositories. The names of the repository/repositories and accession number(s) can be found below: https://github.com/mary-foltz/Foltz_N2Oratio_meta.
Author contributions
All authors contributed to conception and design of the study. MF conducted literature searches, collected data from publications, and organized the databases. MF and AA performed the statistical analyses and data visualization. MF wrote the first draft of the manuscript. All authors contributed to the article and approved the submitted version.
Funding
This work was supported by the Agriculture and Food Research Initiative program priority area of Renewable Energy, Natural Resources and Environment from the USDA National Institute of Food and Agriculture (grant no. 2015-67019-23584 and grant no. 2018-67011-28071/project accession no. 1015478). Additional support came from Hatch grant ILLU-802-969 and the Oklahoma State University School of Civil and Environmental Engineering.
Acknowledgments
We thank Dr. Germán Bollero for his guidance in model development, and Drs. Syam Dodla, François Oehler, Ma Shutan, and Yan Xiaoyuan for providing additional information on their published studies.
Conflict of interest
The authors declare that the research was conducted in the absence of any commercial or financial relationships that could be construed as a potential conflict of interest.
The author JZ declared that they were an editorial board member of Frontiers at the time of submission. This had no impact on the peer review process and the final decision.
Publisher’s note
All claims expressed in this article are solely those of the authors and do not necessarily represent those of their affiliated organizations, or those of the publisher, the editors and the reviewers. Any product that may be evaluated in this article, or claim that may be made by its manufacturer, is not guaranteed or endorsed by the publisher.
Supplementary material
The Supplementary Material for this article can be found online at: https://www.frontiersin.org/articles/10.3389/fsoil.2023.1194825/full#supplementary-material
References
1. Galloway JN, Aber JD, Erisman JW, Seitzinger SP, Howarth RW, Cowling EB, et al. The nitrogen cascade. BioScience (2003) 53(4):341. doi: 10.1641/0006-3568(2003)053[0341:TNC]2.0.CO;2
2. Ravishankara AR, Daniel JS, Portmann RW. Nitrous oxide (N2O): the dominant ozone-depleting substance emitted in the 21st century. Science (2009) 326(5949):123–5. doi: 10.1126/science.1176985
3. USEPA. Inventory of U.S. greenhouse gas emissions and sinks: 1990-2020. Washington, DC: U.S. Environmental Protection Agency. (2022). Available at: https://www.epa.gov/system/files/documents/2022-02/us-ghg-inventory-2022-main-text.pdf.
4. Tian H, Xu R, Canadell JG, Thompson RL, Winiwarter W, Suntharalingam P, et al. A comprehensive quantification of global nitrous oxide sources and sinks. Nature (2020) 586(7828):248–56. doi: 10.1038/s41586-020-2780-0
5. IPCC. N2O emissions from managed soils, and CO2 emissions from lime and urea applications. In: Guidelines for National Greenhouse Gas Inventories (2006). Institute for Global Environmental Strategies (IGES).
6. Baggs EM. Soil microbial sources of nitrous oxide: recent advances in knowledge, emerging challenges and future direction. Curr Opin Environ Sustain (2011) 3(5):321–7. doi: 10.1016/j.cosust.2011.08.011
7. Braker G, Conrad R. Diversity, structure, and size of N2O-producing microbial communities in soils—what matters for their functioning? Adv Appl Microbiol (2011) 75:33–70. doi: 10.1016/B978-0-12-387046-9.00002-5
8. Quick AM, Reeder WJ, Farrell TB, Tonina D, Feris KP, Benner SG. Nitrous oxide from streams and rivers: A review of primary biogeochemical pathways and environmental variables. Earth-Sci Rev (2019) 191:224–62. doi: 10.1016/j.earscirev.2019.02.021
9. Kumar A, Medhi K, Fagodiya RK, Subrahmanyam G, Mondal R, Raja P, et al. Molecular and ecological perspectives of nitrous oxide producing microbial communities in agro-ecosystems. Rev Environ Sci Biotechnol (2020) 19(4):717–50. doi: 10.1007/s11157-020-09554-w
10. Butterbach-Bahl K, Baggs EM, Dannenmann M, Kiese R, Zechmeister-Boltenstern S. Nitrous oxide emissions from soils: how well do we understand the processes and their controls? Philos Trans R Soc B Biol Sci (2013) 368(1621):20130122. doi: 10.1098/rstb.2013.0122
11. Groffman PM, Altabet MA, Böhlke JK, Butterbach-Bahl K, David MB, Firestone MK, et al. Methods for measuring denitrification: Diverse approaches to a difficult problem. Ecol Appl (2006) 16(6):2091–122. doi: 10.1890/1051-0761(2006)016[2091:MFMDDA]2.0.CO;2
12. Tiedje JM, Simkins S, Groffman PM. Perspectives on measurement of denitrification in the field including recommended protocols for acetylene based methods. Plant Soil. (1989) 115(2):261–84. doi: 10.1007/BF02202594
13. Firestone MK, Davidson EA. Microbiological basis of NO and N2O production and consumption in soil. In: Exchange of Trace Gases Between Terrestrial Ecosystems and the Atmosphere. Hoboken, New Jersey: John Wiley & Sons Ltd (1989).
14. Zumft WG. Cell biology and molecular basis of denitrification. Microbiol Mol Biol Rev MMBR. (1997) 61(4):533–616. doi: 10.1128/mmbr.61.4.533-616.1997
15. Davidson EA, Keller M, Erickson HE, Verchot LV, Veldkamp E. Testing a conceptual model of soil emissions of nitrous and nitric oxides. BioScience (2000) 50(8):667. doi: 10.1641/0006-3568(2000)050[0667:TACMOS]2.0.CO;2
16. Wallenstein MD, Myrold DD, Firestone M, Voytek M. Environmental controls on denitrifying communities and denitrification rates: insights from molecular methods. Ecol Appl (2006) 16(6):2143–52. doi: 10.1890/1051-0761(2006)016[2143:ECODCA]2.0.CO;2
17. Willison TW, Anderson JM. Denitrification potentials, controls and spatial patterns in a Norway spruce plantation. For Ecol Manage (1991) 44(1):69–76. doi: 10.1016/0378-1127(91)90199-6
18. Čuhel J, Šimek M. Effect of pH on the denitrifying enzyme activity in pasture soils in relation to the intrinsic differences in denitrifier communities. Folia Microbiol (Praha). (2011) 56(3):230–5. doi: 10.1007/s12223-011-0045-x
19. Deveautour C, Rojas-Pinzon PA, Veloso M, Rambaud J, Duff AM, Wall D, et al. Biotic and abiotic predictors of potential N2O emissions from denitrification in Irish grasslands soils: A national-scale field study. Soil Biol Biochem (2022) 168:108637. doi: 10.1016/j.soilbio.2022.108637
20. Saggar S, Jha N, Deslippe J, Bolan NS, Luo J, Giltrap DL, et al. Denitrification and N2O:N2 production in temperate grasslands: Processes, measurements, modelling and mitigating negative impacts. Sci Total Environ (2013) 465:173–95. doi: 10.1016/j.scitotenv.2012.11.050
21. Miller MN, Zebarth BJ, Dandie CE, Burton DL, Goyer C, Trevors JT. Crop residue influence on denitrification, N2O emissions and denitrifier community abundance in soil. Soil Biol Biochem (2008) 40(10):2553–62. doi: 10.1016/j.soilbio.2008.06.024
22. Cavigelli MA, Robertson GP. The functional significance of denitrifier community composition in a terrestrial ecosystem. Ecology (2000) 81(5):1402–14. doi: 10.1890/0012-9658(2000)081[1402:TFSODC]2.0.CO;2
23. Firestone MK, Firestone RB, Tiedje JM. Nitrous oxide from soil denitrification: factors controlling its biological production. Science (1980) 208(4445):749–51. doi: 10.1126/science.208.4445.749
24. Firestone MK, Smith MS, Firestone RB, Tiedje JM. The influence of nitrate, nitrite, and oxygen on the composition of the gaseous products of denitrification in soil. Soil Sci Soc Am J (1979) 43(6):1140–4. doi: 10.2136/sssaj1979.03615995004300060016x
25. Blackmer AM, Bremner JM. Inhibitory effect of nitrate on reduction of N2O to N2 by soil microorganisms. Soil Biol Biochem (1978) 10(3):187–91. doi: 10.1016/0038-0717(78)90095-0
26. Foltz ME, Kent AD, Koloutsou-Vakakis S, Zilles JL. Influence of rye cover cropping on denitrification potential and year-round field N2O emissions. Sci Total Environ (2021) 765:144295. doi: 10.1016/j.scitotenv.2020.144295
27. Weier KL, Doran JW, Power JF, Walters DT. Denitrification and the dinitrogen/nitrous oxide ratio as affected by soil water, available carbon, and nitrate. Soil Sci Soc Am J (1993) 57(1):66–72. doi: 10.2136/sssaj1993.03615995005700010013x
28. Hunt PG, Matheny TA, Ro KS. Nitrous oxide accumulation in soils from riparian buffers of a coastal plain watershed–carbon/nitrogen ratio control. J Environ Qual (2007) 36(5):1368. doi: 10.2134/jeq2006.0255
29. Klemedtsson L, Von Arnold K, Weslien P, Gundersen P. Soil CN ratio as a scalar parameter to predict nitrous oxide emissions. Glob Change Biol (2005) 11(7):1142–7. doi: 10.1111/j.1365-2486.2005.00973.x
30. Maeda K, Spor A, Edel-Hermann V, Heraud C, Breuil MC, Bizouard F, et al. N2O production, a widespread trait in fungi. Sci Rep (2015) 5(1):9697. doi: 10.1038/srep09697
31. Shoun H, Fushinobu S, Jiang L, Kim SW, Wakagi T. Fungal denitrification and nitric oxide reductase cytochrome P450nor. Philos Trans R Soc B Biol Sci (2012) 367(1593):1186–94. doi: 10.1098/rstb.2011.0335
32. Jones CM, Graf DR, Bru D, Philippot L, Hallin S. The unaccounted yet abundant nitrous oxide-reducing microbial community: a potential nitrous oxide sink. ISME J (2013) 7(2):417–26. doi: 10.1038/ismej.2012.125
33. Sanford RA, Wagner DD, Wu Q, Chee-Sanford JC, Thomas SH, Cruz-Garcia C, et al. Unexpected nondenitrifier nitrous oxide reductase gene diversity and abundance in soils. Proc Natl Acad Sci (2012) 109(48):19709–14. doi: 10.1073/pnas.1211238109
34. Ma Y, Zilles JL, Kent AD. An evaluation of primers for detecting denitrifiers via their functional genes. Environ Microbiol (2019) 21(4):1196–210. doi: 10.1111/1462-2920.14555
35. McDonald MD, Lewis KL, DeLaune PB, Hux BA, Boutton TW, Gentry TJ. Nitrogen fertilizer driven nitrous and nitric oxide production is decoupled from microbial genetic potential in low carbon, semi-arid soil. Front Soil Sci (2023) 2:1050779. doi: 10.3389/fsoil.2022.1050779
36. Beheydt D, Boeckx P, Sleutel S, Li C, Vancleemput O. Validation of DNDC for 22 long-term N2O field emission measurements. Atmos Environ (2007) 41(29):6196–211. doi: 10.1016/j.atmosenv.2007.04.003
37. Groffman PM, Butterbach-Bahl K, Fulweiler RW, Gold AJ, Morse JL, Stander EK, et al. Challenges to incorporating spatially and temporally explicit phenomena (hotspots and hot moments) in denitrification models. Biogeochemistry (2009) 93(1–2):49–77. doi: 10.1007/s10533-008-9277-5
38. Brilli L, Bechini L, Bindi M, Carozzi M, Cavalli D, Conant R, et al. Review and analysis of strengths and weaknesses of agro-ecosystem models for simulating C and N fluxes. Sci Total Environ (2017) 598:445–70. doi: 10.1016/j.scitotenv.2017.03.208
39. Foltz ME, Zilles JL, Koloutsou-Vakakis S. Prediction of N2O emissions under different field management practices and climate conditions. Sci Total Environ (2019) 646:872–9. doi: 10.1016/j.scitotenv.2018.07.364
40. Groffman PM. Terrestrial denitrification: challenges and opportunities. Ecol Process. (2012) 1(1):11. doi: 10.1186/2192-1709-1-11
41. Moher D, Liberati A, Tetzlaff J, Altman DG. The PRISMA group. Preferred reporting items for systematic reviews and meta-analyses: the PRISMA statement. PLoS Med (2009) 6(7):e1000097. doi: 10.1136/bmj.b2535
42. Borenstein M ed. Introduction to meta-analysis. Chichester, U.K: John Wiley & Sons (2009). 421 p.
43. Mengist W, Soromessa T, Legese G. Method for conducting systematic literature review and meta-analysis for environmental science research. MethodsX (2020) 7:100777. doi: 10.1016/j.mex.2019.100777
44. GetData Graph Digitizer (2013). Available at: http://getdata-graph-digitizer.com/.
45. R Core Team. R: A language and Environment for Statistical Computing. Vienna, Austria: R Foundation for Statistical Computing; 2021. (2023). Available at: https://www.R-project.org/.
46. Viechtbauer W. Conducting meta-analyses in R with the metafor package. J Stat Software (2010) 36(3). doi: 10.18637/jss.v036.i03
47. Rothstein H, Sutton AJ, Borenstein M eds. Publication bias in meta-analysis: prevention, assessment and adjustments. Chichester, England ; Hoboken, NJ: Wiley (2005).
48. Jahangir MMR, Khalil MI, Johnston P, Cardenas LM, Hatch DJ, Butler M, et al. Denitrification potential in subsoils: A mechanism to reduce nitrate leaching to groundwater. Agric Ecosyst Environ (2012) 147:13–23. doi: 10.1016/j.agee.2011.04.015
49. Köster JR, Well R, Dittert K, Giesemann A, Lewicka-Szczebak D, Mühling KH, et al. Soil denitrification potential and its influence on N2O reduction and N2O isotopomer ratios: Effect of denitrification on N2O reduction and N2O isotopomer ratios. Rapid Commun Mass Spectrom. (2013) 27(21):2363–73. doi: 10.1002/rcm.6699
50. Müller C, Stevens RJ, Laughlin RJ, Azam F, Ottow JCG. The nitrification inhibitor DMPP had no effect on denitrifying enzyme activity. Soil Biol Biochem (2002) 34(11):1825–7. doi: 10.1016/S0038-0717(02)00165-7
51. Čuhel J, Šimek M, Laughlin RJ, Bru D, Chèneby D, Watson CJ, et al. Insights into the effect of soil pH on N2O and N2 emissions and denitrifier community size and activity. Appl Environ Microbiol (2010) 76(6):1870–8. doi: 10.1128/AEM.02484-09
52. Čuhel J, Šimek M. Proximal and distal control by pH of denitrification rate in a pasture soil. Agric Ecosyst Environ (2011) 141(1–2):230–3. doi: 10.1016/j.agee.2011.02.016
53. Huang Y, Long XE, Chapman SJ, Yao H. Acidophilic denitrifiers dominate the N2O production in a 100-year-old tea orchard soil. Environ Sci pollut Res (2015) 22(6):4173–82. doi: 10.1007/s11356-014-3653-6
54. Anderson CR, Peterson ME, Frampton RA, Bulman SR, Keenan S, Curtin D. Rapid increases in soil pH solubilise organic matter, dramatically increase denitrification potential and strongly stimulate microorganisms from the Firmicutes phylum. PeerJ (2018) 6:e6090. doi: 10.7717/peerj.6090
55. Bowen H, Maul JE, Cavigelli MA, Yarwood S. Denitrifier abundance and community composition linked to denitrification activity in an agricultural and wetland soil. Appl Soil Ecol (2020) 151:103521. doi: 10.1016/j.apsoil.2020.103521
56. Hunt PG, Matheny TA, Szögi AA. Denitrification in constructed wetlands used for treatment of swine wastewater. J Environ Qual. (2003) 32(2):727–35. doi: 10.2134/jeq2003.7270
57. Tenuta M, Sparling B. A laboratory study of soil conditions affecting emissions of nitrous oxide from packed cores subjected to freezing and thawing. Can J Soil Sci (2011) 91(2):223–33. doi: 10.4141/cjss09051
58. Hunt PG, Miller JO, Ducey TF, Lang MW, Szogi AA, McCarty G. Denitrification in soils of hydrologically restored wetlands relative to natural and converted wetlands in the Mid-Atlantic coastal plain of the USA. Ecol Eng. (2014) 71:438–47. doi: 10.1016/j.ecoleng.2014.07.040
59. Brůček P, Šimek M, Hynšt J. Long-term animal impact modifies potential production of N2O from pasture soil. Biol Fertil Soils. (2009) 46(1):27–36. doi: 10.1007/s00374-009-0402-y
60. Ma S, Wang J, Yan X. Is nitrous oxide reduction primarily regulated by the fungi-to-bacteria abundance ratio in fertilized soils? Pedosphere (2019) 29(5):569–76. doi: 10.1016/S1002-0160(19)60830-1
61. Liu B, Frostegård Å, Bakken LR. Impaired Reduction of N2O to N2 in Acid Soils Is Due to a Posttranscriptional Interference with the Expression of nosZ. Bailey M, editor. mBio (2014) 5(3):e01383–14. doi: 10.1128/mbio.01383-14
62. Jilling A, Keiluweit M, Gutknecht JLM, Grandy AS. Priming mechanisms providing plants and microbes access to mineral-associated organic matter. Soil Biol Biochem (2021) 158:108265. doi: 10.1016/j.soilbio.2021.108265
63. Ball BC. Soil structure and greenhouse gas emissions: a synthesis of 20 years of experimentation. Eur J Soil Sci (2013) 64(3):357–73. doi: 10.1111/ejss.12013
64. Włodarczyk T, Stępniewski W, Brzezińska M, Majewska U. Various textured soil as nitrous oxide emitter and consumer. Int Agrophysics. (2011) 25(3):287–97. doi: 10.31545/intagr/106323
Keywords: DEA, meta-analysis, meta-regression, N2O, nutrients, texture
Citation: Foltz ME, Alesso A and Zilles JL (2023) Field soil properties and experimental nutrient additions drive the nitrous oxide ratio in laboratory denitrification experiments: a systematic review. Front. Soil Sci. 3:1194825. doi: 10.3389/fsoil.2023.1194825
Received: 27 March 2023; Accepted: 07 August 2023;
Published: 18 August 2023.
Edited by:
Debjani Sihi, Emory University, United StatesReviewed by:
Mark McDonald, Argonne National Laboratory (DOE), United StatesJing Hu, Mississippi State University, United States
Copyright © 2023 Foltz, Alesso and Zilles. This is an open-access article distributed under the terms of the Creative Commons Attribution License (CC BY). The use, distribution or reproduction in other forums is permitted, provided the original author(s) and the copyright owner(s) are credited and that the original publication in this journal is cited, in accordance with accepted academic practice. No use, distribution or reproduction is permitted which does not comply with these terms.
*Correspondence: Mary E. Foltz, bWFyeS5mb2x0ekBva3N0YXRlLmVkdQ==