- 1Department of Environmental Sciences, The University of Arizona, Tucson, AZ, United States
- 2Maricopa County Cooperative Extension, The University of Arizona, Phoenix, AZ, United States
- 3Department of Agronomy, Horticulture, and Plant Science, South Dakota State University, Brookings, SD, United States
Introduction: Cover crop (CC) is an essential tool to improve or maintain soil health, potentially improving cash crop productivity. Several recent reports of cash crop yield reduction following cover cropping necessitated this research to guide efficient CC decisions in the season before corn (Zea mays) or soybean (Glycine max) is to be grown.
Methods: Therefore, we designed this multi-year, multi-location study to include the farmers who plant CC following the harvest of a small grain crop, majorly wheat (Triticum aestivum) or oats (Avena sativa), and then grow corn or soybean cash crop in the subsequent season. We also selected the farmers who used a fall CC mix that was winter-terminated, to avoid further complexities. The major objective of this study was to document soil health changes and cash crop yields following CC in eight selected locations around SD for three consecutive CC seasons between 2017-2020. Experimental plots were laid out at the farmer-cooperators’ CC fields, where no cover (NC) ‘control’ was tested against CC in a randomized complete block design (RCBD). Soil samples were analyzed for selected soil health indicators (SHIs): potentially mineralizable nitrogen (PMN), permanganate oxidizable carbon (POXC), soil respiration (SR), soil microbial biomass (SMB), soil nitrate-nitrogen, soil organic matter (SOM), and other basic soil properties (pH, electrical conductivity, etc.); crop and residue biomass were calculated, and cash crop economic yields were measured.
Results and discussion: No statistically significant (p<0.05) advantage was found for SHIs or cash crop yields under CC plots compared to NC plots as these fields had healthy soils (long-term no-till was practiced, high SOM levels >30 g kg-1). These findings directed us to investigate hydroclimatological parameters and climatological indices such as accumulated precipitation, standardized precipitation index (SPI), and standardized precipitation-evapotranspiration index (SPEI) for their impact on CC’s influence on cash crop yields.
Conclusion: Our analyses indicated that hydroclimatology, especially SPEI for the month before CC planting can be used as a tool to guide successful CC decisions, reducing the risk of cash crop yield loss. Further investigations with SPI and SPEI, along with other climatological parameters are needed to explore and design better CC management tools.
1 Introduction
Cover crop (CC) is one of the most recommended tools to improve and maintain soil health globally (1–4). With a multitude of benefits that cover crops provide such as boosting soil health (5), reducing soil erosion (6), maintaining living roots in the soil (7), and enhancing soil fertility through nitrogen (N) fixation (8), CC is a popular choice for conservation agriculture practitioners and enthusiasts. Additionally, CCs can also be used to sequester mobile nutrients, especially nitrate, in their biomass (9, 10), saving water bodies from potential nitrate pollution (11–13).
Traditionally, CCs are used in two major ways: either as a solo crop species or as a combination of different species. This influences the amount of water and nutrients, most importantly N, available to the following cash crops (13–15). Therefore, CC choices can be adjusted to align with the farm goals. Primary criteria to choose CCs are including biodiversity in the crop rotation, sequestering carbon and mobile nutrients and re-releasing them during the following cash crop season, improving soil N fertility through legume CCs, supplementing the need of livestock feed, or providing uniform and durable soil cover. Therefore, to ensure most benefits, CCs can be planted as a mix of multiple species to provide a wide variety of soil health services.
Carbon-nitrogen ratio or C:N is one of the major parameters influencing CC choices in a mix. Depending on the purpose and the duration between the CC season and the next cash crop, a farmer might choose a grass-dominant mix or a broadleaf-dominant mix. Higher C:N ratios in CC residue in the case of a more grass-dominant mix may initially facilitate higher short-term N immobilization, which can lead to insufficient plant-available N in the soil, resulting in an overestimation of required fertilizer-N (16–19). On the other hand, broadleaf CCs generally have a tendency to decompose faster under optimum conditions, resulting in N mineralization occurring sooner in the growing season or even before the cash crop gets an opportunity to use them, eventually contributing to N-leaching potential (20–22). Therefore, variable results of cover cropping on cash crop productivity are common and can be attributed total CC biomass production, composition and components of the plant biomass, time of CC termination, soil types, climate, etc. (2, 22).
However, the climate remains the most important factor because CCs often compete with cash crops for natural resources like water or nutrition (15, 23). Especially in a dryland agricultural system, where precipitation is the only source of water, CCs tend to ‘steal’ water away from the cash crop that follows them in rotation. In the face of climate change, the colliding effect of rising temperature, uncertain precipitations, and drought pose a serious challenge to crop production (24, 25). Such combinations can significantly raise the compounded effect of hydroclimate extremes on the biology of crop production. Thus, future modifications for sustainable crop production should depend on different hydroclimate factors. Therefore, it is necessary to test the impact of CCs, a popular sustainable tool, under different climatic scenarios to design better crop rotations integrating CCs.
Hydroclimate considers both climate and hydrological parameters including their complex interactions, and therefore potentially impacts agriculture and modifies effects of crop management (26–30). Having a continental climate, South Dakota experiences dry and cold winters. The state receives most of its precipitation during the spring and summer months (31). There are insufficient experimental pieces of evidence that explored hydroclimate factors as a tool for planning of cover cropping. This study aims to identify a set of hydroclimatic parameters combined into indices that can be used to guide farmers in successful crop management, especially managing tools like cover cropping, which shares natural resources with major cash crops in the rotation (15, 22). Previous researches have reported that short-term weather variability, changes in precipitation, and soil moisture deficit would affect agricultural productivity (32). Precipitation deficit can pose significant water scarcity by reducing water flow and storage deficit (33, 34). Multiscalar drought indices (standardized precipitation index or SPI and standardized precipitation-evapotranspiration index or SPEI) were found effective to timescale dependent (35) crop responses to water scarcity and water loss (36). Monitoring actual and potential evapotranspiration is also crucial during crop growing season in rainfed areas where soil moisture depletion and evaporation rates are closely correlated (37, 38).
Here we discuss significant outcomes from a multi-year, multi-locational study that was conducted on commercial farm-fields around South Dakota, primarily in central and eastern SD as CCs were evaluated for crop rotations where corn (Zea mays) or soybean (Glycine max) cash crops were grown following the CCs. We selected eight study sites over three years to include environmental variation in our analyses. Conducting these experiments in commercial fields was another important aspect of this study as this study integrated farmers’ general practice, integrating major sources of variation. Previously reported studies evaluated cover cropping majorly in a very controlled conditions, in research or experimental stations (5, 39–43). But this study expanded the scope of the research by incorporating more random effects primarily generated from farm locations, yearly weather variables, and farmers’ choice of CCs. The primary objectives of this study were to measure effects of cover cropping on (i) selected soil health indicators (SHIs) that are universally recognized and suggested by United States Department of Agriculture Natural Resource Conservation Service (USDA-NRCS) (44), and (ii) cash crop productivity. Additionally, the influence of hydroclimatological parameters was investigated for their potential to modify CC impacts on soil health and crop productivities.
2 Materials
2.1 Experimental design
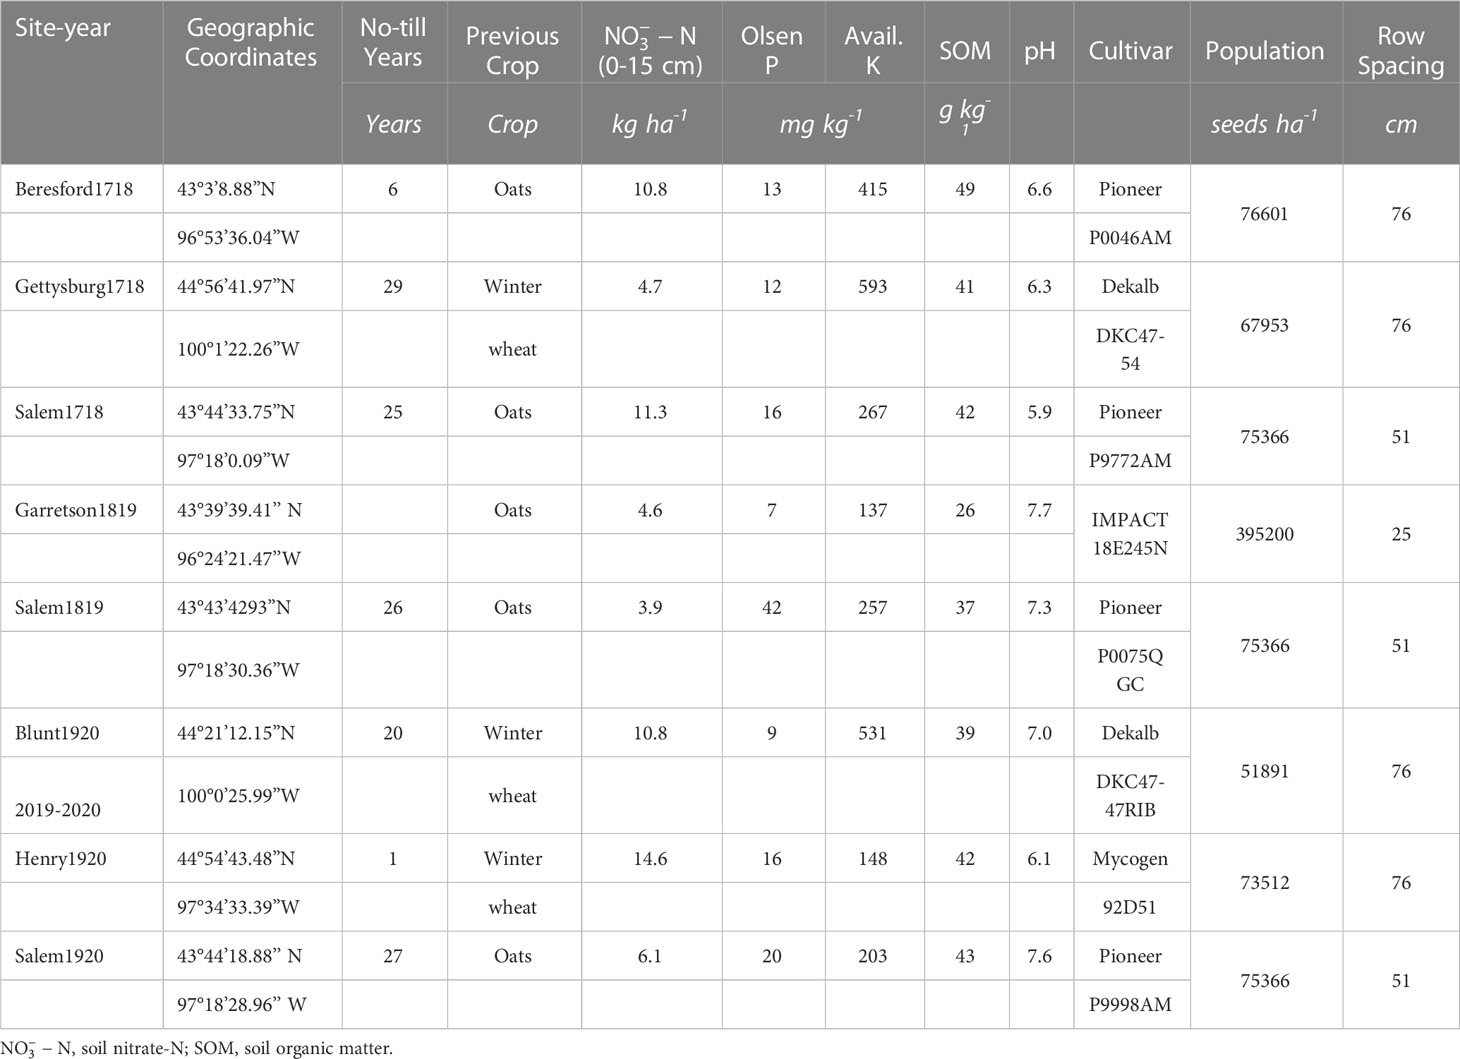
This study was conducted on commercial farms in the eastern and central South Dakota from the fall of 2017 to the fall of 2020 on 8 site-years (Figure 1; Table 1). The study sites were selected to represent diverse agroclimatic regions in SD. For this experiment, we included the farms that follow a specific rotation: small grains such as wheat (Triticum aestivum) or oats (Avena sativa)), followed by a fall CC mix, and then a corn or soybean crop is grown in the next summer (cash crop season). Therefore, impacts of CCs planted in 2017 fall was investigated for the cash crop in 2018 summer, and so on. At all selected sites, the farmer-cooperators practiced no-till and had previous experiences of cover cropping. Therefore, the farmers selected and planted the cover crop mixes that they preferred, and generally the CC mixes had several species of grasses like sorghum (Sorghum vulgare) and millet (Setaria italica), legumes like vetch (Vicia sativa) and clovers (Melilotus alba) and brassicas like radish (Raphanus sativus) and turnips (Brassica rapa) that were winter-terminated, after the first or second frost event.
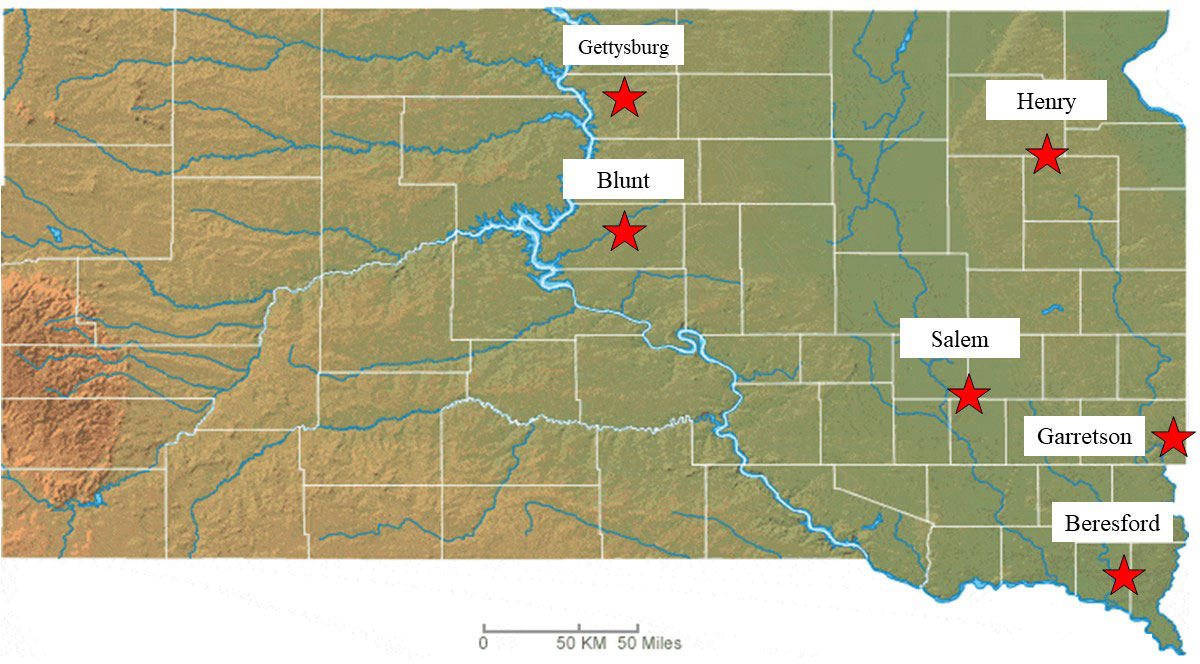
Figure 1 A map of the state of South Dakota indicating the selected study sites during the project between the fall of 2017 and the summer of 2020. source: https://geology.com/
A randomized complete block design (RCBD) was used to compare CC plots with no CC plots, where each treatment was replicated four times. Each whole plot size was 9.2 m in length and 4.6 m in width. CC mixes were planted by the farmer cooperator after the harvest of a small grain in rotation, majorly winter wheat or oats. The project team then established the replicated trial by spraying a broad spectrum herbicide (Glyphosate 0.84 kg a.e. ha-1) to designate no cover control plots, as seen in the picture (Figure 2). No fertilizer was applied to the CC plots. For the following cash crop, the farmer cooperators followed the South Dakota State University recommended fertilization protocol (45). Farmer-cooperators also chose the crop cultivars to be planted on the research plots at populations and row spacings (40, 50, 57, or 75 cm apart) the same as the rest of the field (Table 1).
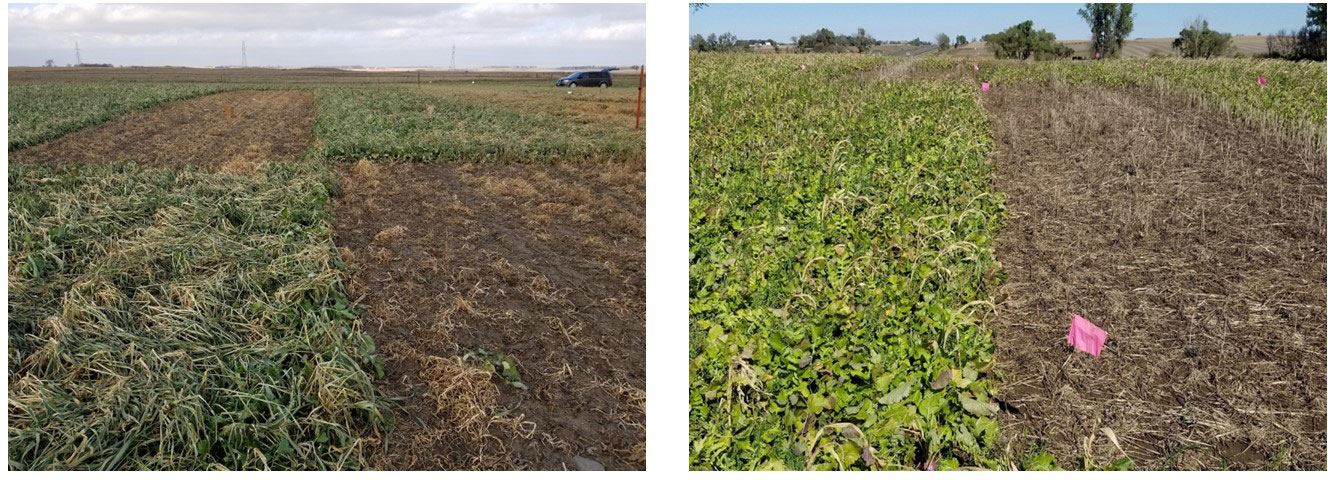
Figure 2 Cover crop and no cover experimental plots established at different farmer-cooperators’ fields after small grain harvest. As the grower cooperators chose their own cover crop mix, we had differences in cover crop composition.
2.2 Soil sampling and analyses
Twelve core soil samples were collected from each replicated experimental plots in the fall before the CCs were winter-terminated and in the spring, before cash crop planting. Soil samples were collected from a depth of 0 to 15 cm using a soil probe with an inside diameter of 1.9 cm. The samples were then air-dried and ground to pass through a 2 mm sieve. These soil samples were analyzed for general soil fertility measurements (nitrate-N, available P, extractable K, soil organic matter, electrical conductivity, and pH) following the recommended chemical soil test procedures for the North Central Region (46) (Table 1).
Furthermore, the selected SHIs, potentially mineralizable N (PMN), permanganate oxidizable C (POXC) also known as ‘active carbon’, soil respiration (SR), and soil microbial biomass (SMB) were determined following standardized protocols. The PMN test was done using the protocol adopted for the Cornell Soil Health Laboratory (47) based on (48). Briefly, the PMN measurement was calculated by subtracting the zero-day soil ammonium (NH4)–N measurement from the NH4–N measurement determined after the soil was incubated in an anaerobic environment (submerged in water) for 7 days. The POXC values were calculated using the protocol adopted by the Cornell Soil Health Laboratory (49), based on methods from (50), with modifications described in (51). Briefly, 2.5g soil was shaken with a potassium permanganate solution to oxidize the ‘active carbon’ fraction in soil, which uses some KMnO4, and reduces the strength of the solution, and then absorption of a further diluted solution is measured to calculate POXC. Soil respiration (SR) was measured using the protocol adopted by the Cornell Soil Health Laboratory (49) that followed methods described by Weaver et al. (52). For SR, 20g soil was incubated for 4 days with a CO2-trap solution (0.5M potassium hydroxide, KOH); change in electrical conductivity of the trap solution during the incubation is used to estimate SR (53). For assessment of microbial biomass under experimental plots, Phospholipid Fatty Acid (PLFA) analyses was conducted on soil samples following methods described in Chowdhury and Dick (54). PLFA is a universally recognized biomarker that provides a representation of living microbial communities in the soil.
2.3 Plant sampling and analyses
All above-ground plant biomass, including CCs and previous crop residue samples were collected within two 30.5 cm2 areas from each replicated CC treatment plot in the fall before CC winter termination. Fall sampling dates occurred between late September and early November, depending on the first freezing event, while spring sampling occurred in late April and May, before the cash crop planting. The surface residue biomass (RB) samples included the total previous crop residue left above-ground in the no-till plots and the CC residue planted in the fall. Previous crop residues are included in the analytical RB samples to include carbon, nutrient and other soil health contribution by these previous crop residues with comparatively higher C:N along with new cover crop residues with comparatively lower C:N to represent nutrient cycling in a traditional no-till system. RB samples were dried in a laminar-flow oven at 60°C until constant mass was reached and weighed to determine dry matter yield, which was converted to mass per area (kg ha-1) basis. Corn grain was harvested mechanically with a small plot combine in the fall from the middle two rows of each 75 cm row spacing plot and the center three rows from each 40, 50, and 57 cm row spacing plots, while soybean grain (Garretson, 2018-2019) was harvested from the center 1.52 m crop row in each plot. All grain yields were calculated on a Mg ha-1 basis. Grain moisture was used to adjust grain yield to 15.5% moisture for corn and 13% moisture for soybean.
2.4 Hydroclimate data sources and analyses
Monthly precipitation (P) (1991-2020) were obtained from the TerraClimate dataset (https://climatetoolbox.org/) (55). This dataset provides data on a monthly basis for global terrestrial surfaces with ~ 4 Km or 2.5 miles (1/24 degree) spatial resolution. Farm-specific weather data would have been useful if the weather stations’ (South Dakota Mesonet) locations (https://climate.sdstate.edu/) were closer to our experimental sites. The weather stations are miles away from our fields, which might not represent actual field conditions. We also checked the Automated Weather Data Network (AWDN) website (https://hprcc.unl.edu/awdn/) for data availability and found there is only one ‘inactive’ station in South Dakota far from our selected locations. Therefore, we used TerraClimate data to deliver more accurate information.
Standardized precipitation-evapotranspiration index (SPEI) data has been collected from WestWide Drought Tracker (WWDT) (https://wrcc.dri.edu/wwdt/about.php), which uses monthly data from PRISM Climate Mapping Program. Another index, namely the Standardized Precipitation Index (SPI), has been considered a meteorological drought index (56) on a range of timescales. This index is widely accepted for the quantification of drought based on precipitation deficit/surplus and is closely related to soil moisture. SPI is available in different timescales (1,3,6, 12, 24, and 48 months) and the values range from +2 to –2 (57, 58). Smaller values indicate drier condition while >0 values are assigned to non-drought conditions. SPEI accounts for climatic water balance and integrates temperature/potential evapotranspiration using the Thornthwaite equation (59) or Penman-Monteith method. The dataset has been collected from TerraClimate (http://www.climatologylab.org/gridmet.html) (60) which has a spatial resolution of ~ 4 Km or 2.5 mile (1/24 degree). The SPEI value always ranges from –5 to +5. The smaller values indicate higher severity of drought whereas greater values indicate a higher degree of moisture or wetter conditions (61).
The values of SPI and SPEI were considered for the month of July each year just before the planting of CCs to indicate the pre-planting hydroclimatic conditions. Our intention was to explore hydroclimatic parameters that are easily accessible and may guide the farmers with information to decide on whether or not they should plant cover crops. All it comes to the fact if they have enough moisture to budget a portion of the water received through precipitation to grow a cover crop. Because, when a farmer needs to decide if they can afford growing a cover crop, they cannot be reliant on the amount of precipitation they might receive precipitation they might receive during the cover crop season or during winter and early spring season next year to be able to grow a ‘profitable’ corn crop. As these farmers practice no-till and can have sufficient surface residue from the previous small grain crop to preserve moisture, they might decide not to grow a cover crop if they did not receive enough precipitation to budget water for a cover crop and save this water for the subsequent cash crop, which might be corn, and growing corn requires a lot of water (62, 63). Otherwise, CCs might adversely affect cash crop yields (15, 23). Therefore, we only considered the hydroclimatic conditions before cover crop planting, because once cover crop is planted, it is already too late for a farmer to decide otherwise. As the water year officially kicks off October each year, the trends of accumulated precipitation and SPEI have been plotted from October (the previous year) to July (before the planting of the CC) for the study sites. Monthly precipitation with the long-term climatology has been plotted (Figures 3A, B) using TerraClimate precipitation data for Salem, SD. Hydroclimatic data of similar timelines were used for the other experimental sites, where 'climatology' refers to the long-term (1991-2020) average of monthly precipitation which is considered normal for a thirty-year period, and provides a threshold to identify the months with below or above-normal precipitation.
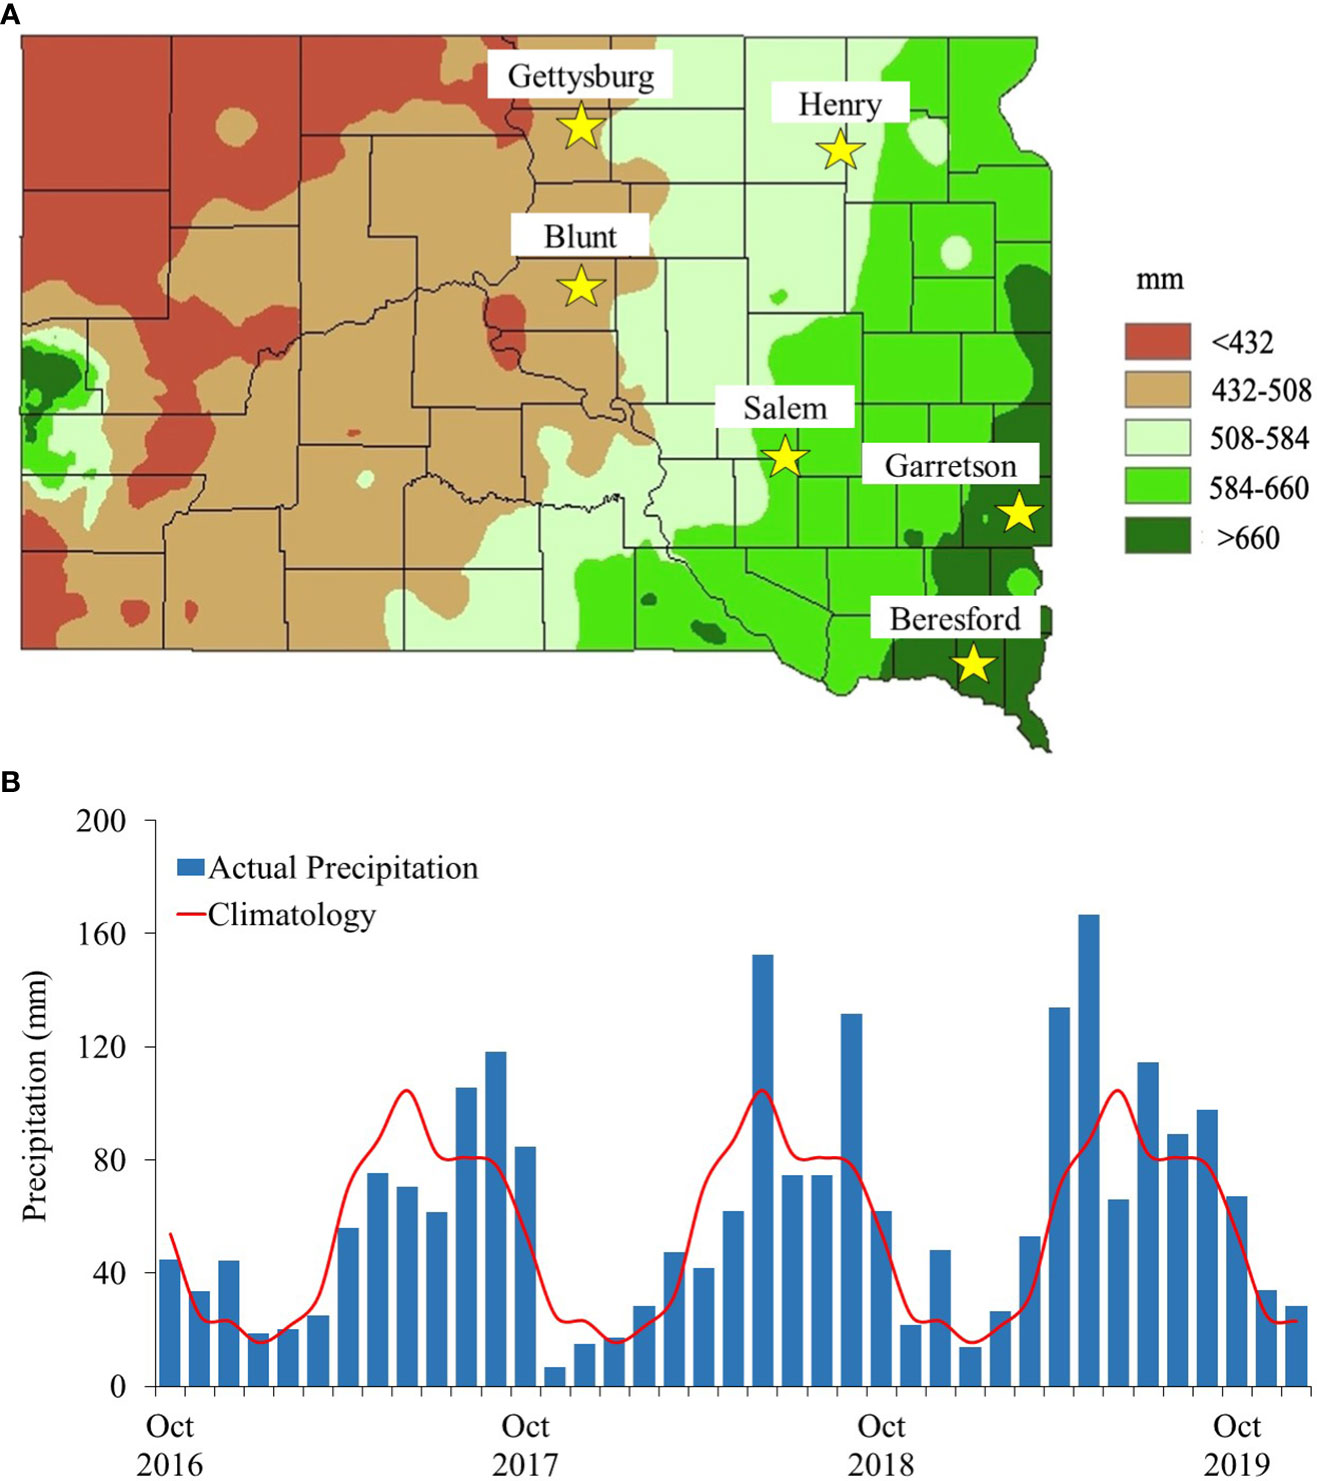
Figure 3 (A) Average long-term annual precipitation map over South Dakota (1991-2020) (in mm) (source: https://climate.sdstate.edu/), (B) monthly precipitation during pre-planting seasons of cover crop, near Salem, SD.
2.5 Statistical analyses
The effects of CC treatments on all parameters measured were analyzed with RStudio statistical software version 4.0.2 and interpreted using a two-way ANOVA and a linear mixed model for all independent variables (64). Site-year, CC treatments (CC vs. NC), and their interaction was considered a fixed-effect, while block within each site-year was considered a random effect, ‘lmertest’ package was used in R tool for analyses (65). Normality and constant variance assumptions were tested and shown to be met using the Shapiro-Wilk normality test and examining the residuals plots using the ‘ggResidpanel’ package (66, 67). Differences among variables under study as affected by CC treatments and site-year were determined using Fishers Least Significant Difference at P < 0.05 significance level for mean separation using the agricolae package (68) within R statistical software. To decide differences among means, the level of significance was declared at P < 0.05. When variables were tested separately under each site-year, a one-way ANOVA was used, but other considerations remained same. Principal component analysis (PCA) on variables was performed using ‘FactoMineR’ package (69) for which all replicated values were used for all the variables under study. All graphical representation of data were prepared in Microsoft Excel or R 4.0.2.
3 Results and discussion
3.1 Impact of cover cropping on soil health indicators
Cover crops did not improve the selected soil health indicators (SHI) as statistically non-significant (p<0.05) effects were found when data from all site-years under study was analyzed, except for soil nitrate-N (Table 2). Soil and residue biomass (RB) data from spring sampling was used in this analyses as the cash crop season began after this sampling event, therefore, the effect of cover cropping was expected to impact these values the most. High variability in soil properties and agronomic management, existing soil health and climatic conditions are the possible reasons we did not find any statistically significant difference between CC treatments, but for different site-years (Table 1). Furthermore, these farmer-cooperators have been practicing conservation practices like no tillage, cover cropping, suitable crop rotations for several years that helped in building soil health in their farms. Therefore, beneficial impacts of cover cropping on SHIs were absent, which is similar to the scenarios when no effect of fertilization is observed on highly fertile fields (70, 71). The only significant difference in nitrate-N values prove that CC potentially saved labile nitrates-N from environmental losses by incorporating in plant biomass as organic N forms.

Table 2 Mean values of selected soil health indicators such as soil nitrate-nitrogen (; kg ha-1), potentially mineralizable nitrogen (PMN; µg g-1 soil week-1), active carbon or permanganate oxidizable carbon (POX-C; mg kg-1), soil respiration (SR; mg CO2 g-1 soil 4-day-1), soil microbial biomass (SMB, picomoles g-1), and residue biomass (RB, kg ha-1) under cover crop and no cover control plots in South Dakota.
Although, the values for the SHIs such PMN, POX-C, and SMB are not significantly different, but 10%, 4%, and 33% higher values were recorded under CC plots compared to no cover plots for PMN, POX-C, and SMB respectively (Table 2). Residual biomass before the cash crop planting was found 9% higher under CC plots compared to the no cover plots, however, we did not find any statistical difference (Table 2). As we sprayed the no cover plots with a broad-spectrum herbicide only during the CC plot establishment, regrowth from previous crops (small grains) and the undecomposed dead plant biomass contributed to the plant residue biomass data under NC treatment. Therefore, under no cover control plots, a combination of volunteer plants (from previous crops) and undecomposed dead plant residues acted as soil cover or soil armor, ‘mimicking’ the CC plots that also had previous crop residues (no-till system) and living plant species, the cover crop species. As the volunteer plant species in the no cover plots are mostly high-biomass producing small grain crops, wheat or oats, therefore most no cover plots had similar amounts of total plant biomass (previous crop residue plus growing plant residue) and hence, provided with similar benefits of CC. Also, we noted that no-till systems leave a significant amount of crop residues, and when plots were laid out randomized, the total biomass therefore often were similar for no cover and CC plots.
Comparable soil health values under CCs and no cover control plots are not rare; many previous experiments reported similar observations (23). To investigate further, we analyzed the site-years separately, but did not find statistically significant difference between CC plots and NC plots for selected SHIs, residue biomass, or cash crop yield (Table 3). Therefore, our data indicates that CC did not provide any statistically significant (p<0.05) soil health or cash crop yield benefit in the site-years investigated, which supports previous findings where no yield benefit was reported (72–74). Some studies even mentioned yield reduction when cover cropping was practiced (23, 75). This finding brought up essential questions against CC as a tool to improve soil health and in providing economic benefits from increased cash crop productivity in the following season. Furthermore, reports of cash crop yield drags and economic losses indicates concerns around CC as a ‘sustainable’ practice (72, 75).
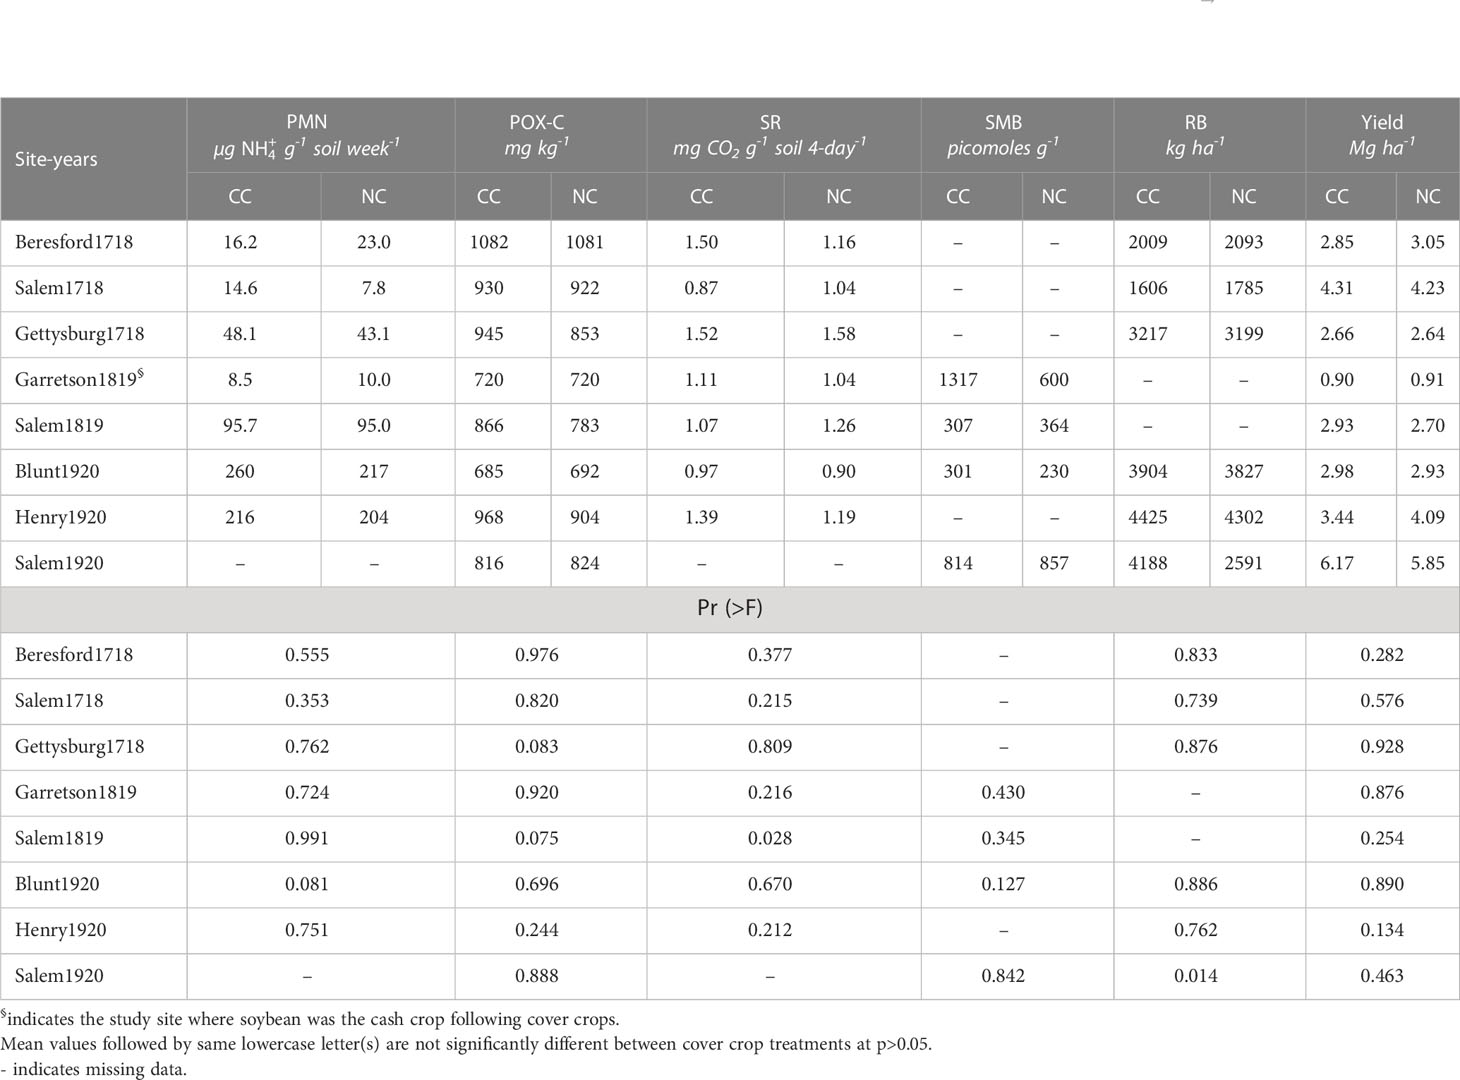
Table 3 Site-year-wise mean values of selected soil health indicators such as potentially mineralizable nitrogen (PMN; µg g-1 soil week-1), active carbon or permanganate oxidizable carbon (POX-C; mg kg-1), soil respiration (SR; mg CO2 g-1 soil 4-day-1), soil microbial biomass (SMB, picomoles g-1), residue biomass (RB, kg ha-1), and cash crop yields (Mg ha-1) under cover crop and no cover control plots for eight site-years in South Dakota.
3.2 Soil health parameters and corn yield: Principal component analyses
The principal component analyses (PCA) for selected soil variables and soil health indicators along with corn yield revealed that SOM status of the field is the major factor affecting crop yields, while the other SHIs do not majorly influence the crop productivity (Figure 4A). One probable reason maybe existing soil health status in the study sites as depicted by high SOM status in the Figure 4B. Due to existing conservation management practices adopted by the farmer-cooperators, the mean SOM levels of the research sites were already high (> 28 g kg-1; highest value 50 g kg-1) and these sites can be considered to have ‘healthy soils’. This may be the reason the impact of cover cropping was not significant in these sites.
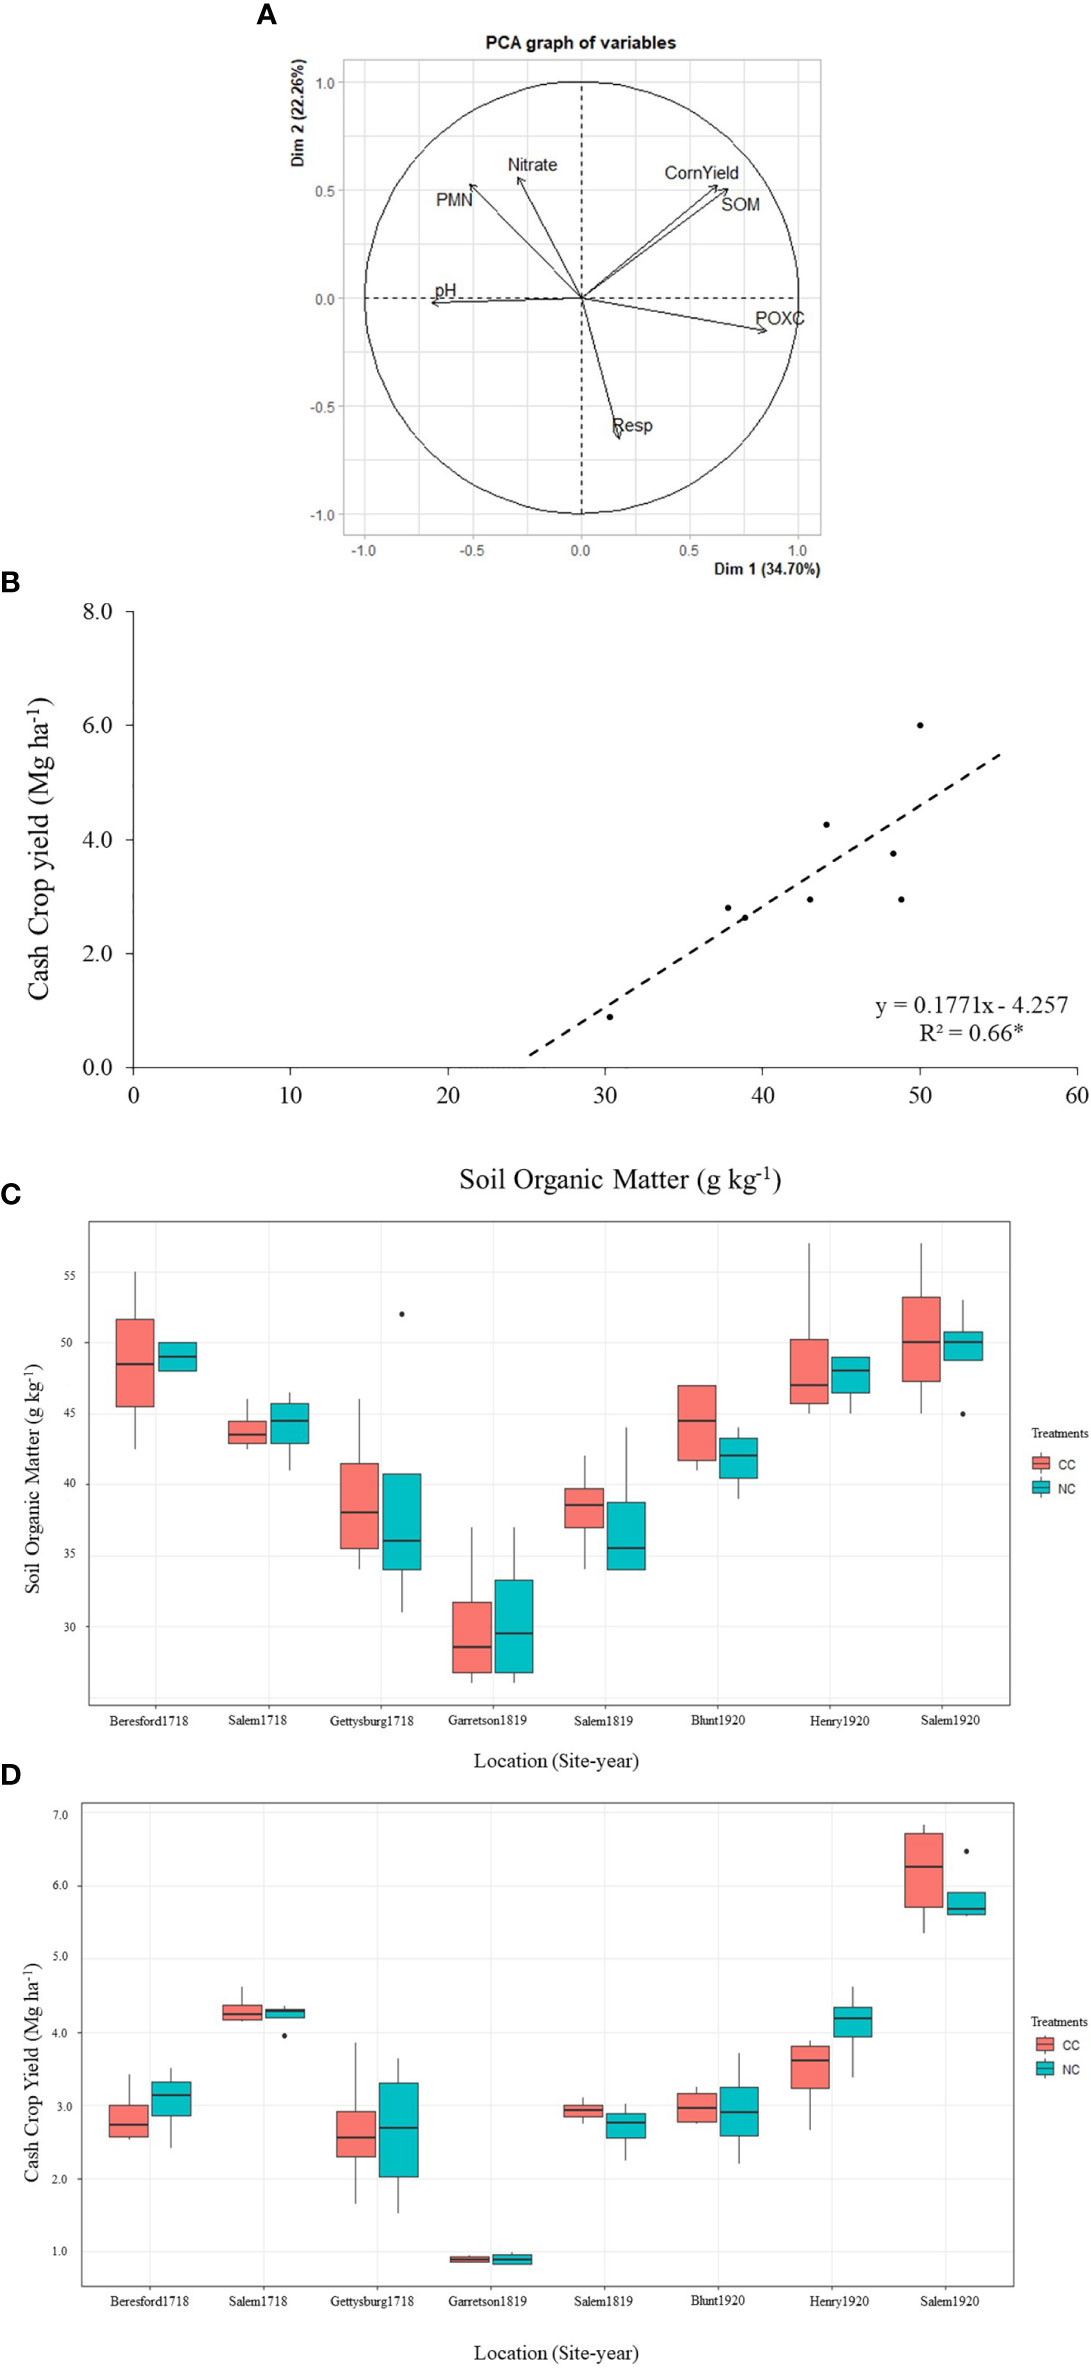
Figure 4 (A) Principal component analyses among selected soil parameters like soil pH, soil organic matter (SOM), nitrate-nitrogen (NO3¯-N), potentially mineralizable nitrogen (PMN), active carbon or permanganate oxidizable carbon (POX-C), soil respiration (SR), and cash crop yields (soybean at Garretson, SD 2018-2019, and corn at other locations; (B) Linear relationship between soil organic matter (SOM, g kg-1) and cash crop yield (Mg ha-1), (C) a boxplot depicting soil organic matter (SOM) status and (D) a boxplot showing cash crop yields (Mg ha-1) under the cover crop (CC) and no cover (NC) control plots at the research sites around South Dakota during 2018, 2019, and 2020 seasons.
When plotted against cash crop yield for all site-years, SOM found to be well correlated with the cash crop yields (Figure 4B). After further investigations, we found that the SOM levels in the study sites showed different trends when categorized year-wise (Figures 4C, D). Cash crop yields followed SOM trends in the study sites during 2019 and 2020 cash crop season, but not during the 2017 season. Furthermore, the SOM levels in all the study sites were high as indicated earlier, therefore, we can speculate that more than soil health status, hydroclimatology of those site-years might be influencing the crop yields following CCs. This finding raised the question if CCs are not contributing to soil health benefits or yield benefits (Tables 2, 3), should it still be considered as economically feasible? Especially, if we consider the Beresford1718 and Henry1920 site-years, where CCs actually reduced cash crop yield (Figures 3C, D). Therefore, it was necessary to study hydro climatological data for these site-years.
3.3 Hydroclimatic trends of study locations
For a rainfed system, climate regulates major yield attributes, especially the hydroclimate as the crop is completely dependent on climate for its water requirement throughout the season. Therefore, we have explored a few indices that indicate the availability of water for the cover crop, and the subsequent cash crop as they share the available water. Figure 3A represents a long-term (1981-2010) average of precipitation received in different parts of the state of SD. The state has shown an increasing trend of precipitation from west to east. From Figure 3B it is evident that the 2017-18 season was drier than, 2018-19 and 2019-20 seasons, but it was hard to predict that before CC planting in the previous season. So, we investigated other hydroclimatological parameters: (i) accumulated precipitation during 10 months before CC planting i.e., October through July, (ii) standardized precipitation index or SPI, and (iii) standardized precipitation-evapotranspiration index or SPEI for the month of July as CCs are generally planted in August.
3.4 Hydroclimatic parameters influencing impacts of CCs on corn yield
In this study, six different locations (around South Dakota) were identified based on cropping season and yield data availability. Firstly, the trends of accumulated precipitation, SPI, and SPEI were compared against yield advantage under CC (the difference in cash crop yields between CC plots and NC control plots) for the only site we could investigate for three consecutive seasons, Salem, SD (Figures 5A–C); high correlations were found for all the three selected hydroclimatological parameters for all three years. This data provides a unique opportunity to investigate further (Figures 5A–C). Therefore, the trends of hydroclimatic parameters, accumulated precipitation, a precipitation index, and a drought index (SPEI in July) were plotted (Figures 6A, B) together to provide an overview of the weather variability 'at the selected locations. According to the trend, Beresford, Salem, and Gettysburg have received lower precipitation (Oct-July) during pre-planting season (2016-17) along with negative SPEI values (Figures 6A, B). Whereas Blunt, Henry, and Salem received higher precipitation during the pre-planting season (2018-19) along with positive values of SPEI. Garretson and Salem during 2017-18 received higher amount of precipitation and SPEI values than 2016-17 season but less than 2018-19. The variability of these three seasons has indicated three distinct hydroclimate periods i.e., dry, neutral, and wet; positive values of SPEI indicate wetter condition whereas negative values indicate drier condition (76, 77).
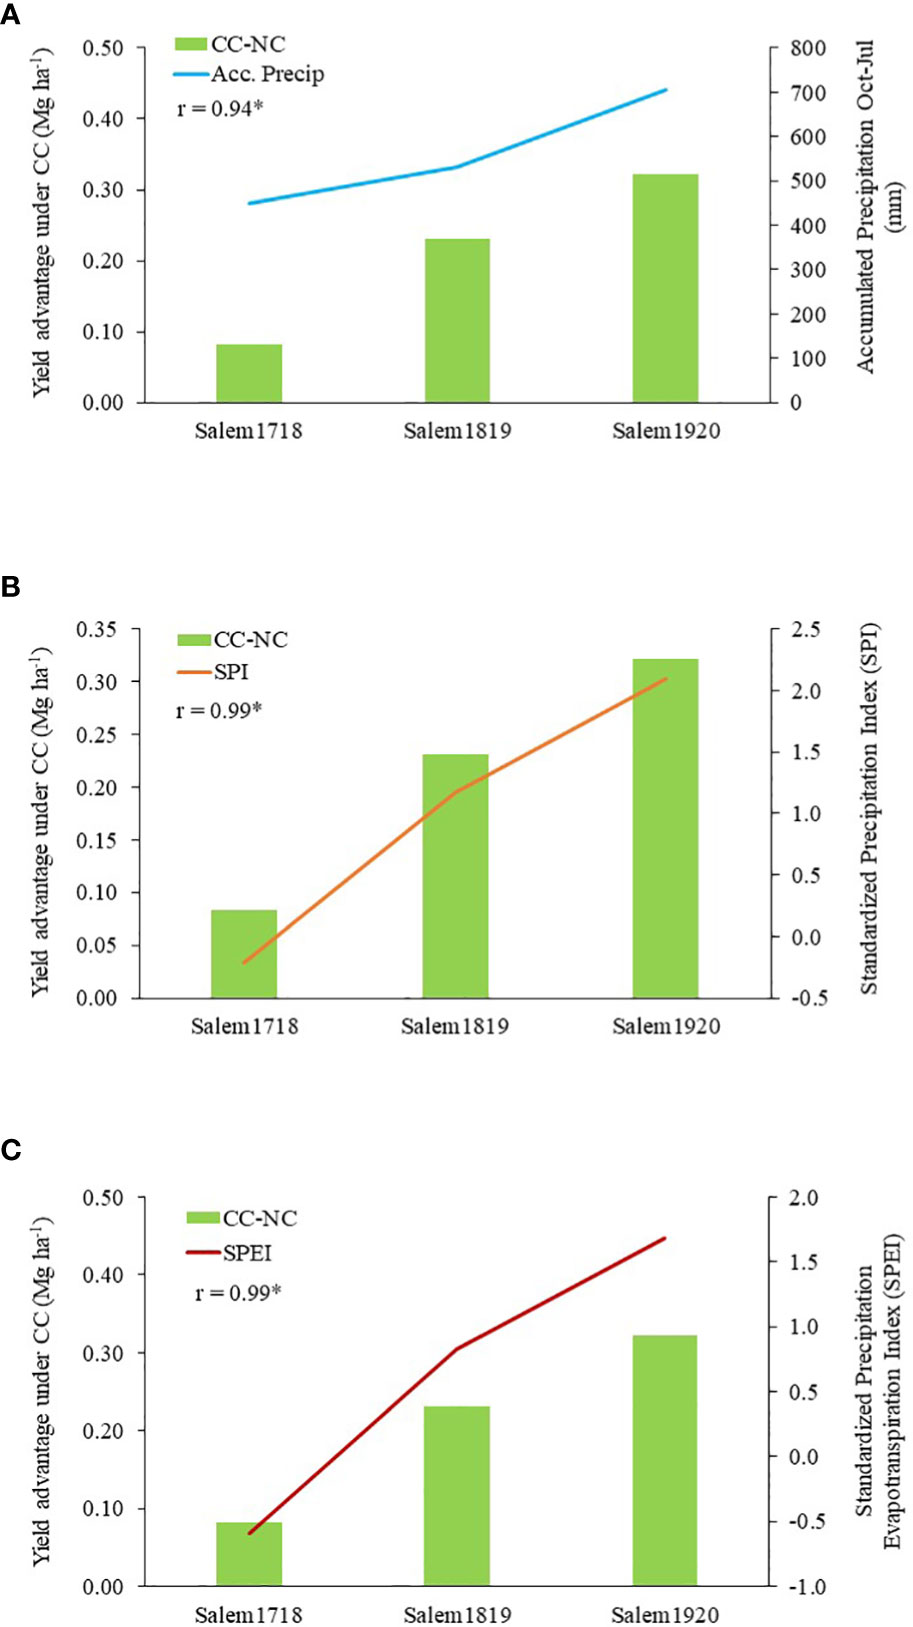
Figure 5 Plots showing hydroclimatological parameters (A) accumulated precipitation (mm) during October-July before cover crop planting, (B) Standardized Precipitation Index (SPI), and (C) Standard Precipitation Evapotranspiration Index (SPEI) influencing yield advantage under cover cropping (difference in yields under cover crop and no cover crop control plots) at Salem study site during three cropping seasons 2017-18, 2018-19, and 2019-2020. '*' indicates statistically significant correlation between the cash crop yield and hydroclimatological parameter.
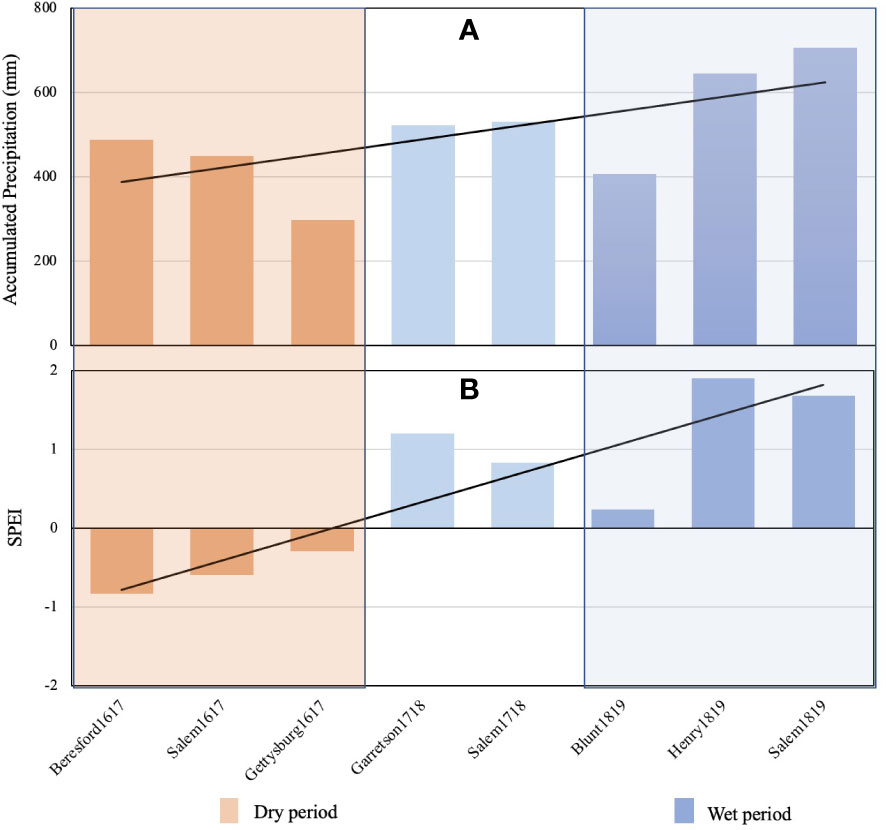
Figure 6 Trends of (A) accumulated precipitation (Oct-July), and (B) SPEI (in July) for the location-year combinations in South Dakota. 2016-17 and 2018-19 are indicated as dry and wet period respectively. Accumulated precipitation is in mm, SPEI is unitless. The black line indicates the linear trendline.
To explore further, we plotted yield advantage under CC against location-wise accumulated precipitation (Oct-Jul), SPI, and SPEI values (Figures 7A–C). Polynomial regression models were calculated for accumulated precipitation and the selected hydroclimatic indicators (accumulated precipitation, SPI, and SPEI); linear regression models were not found statistically significant. SPEI values were found better correlated (coefficient of determination, R2 = 0.53) with CC yield advantage in these locations compared to accumulated precipitation (coefficient of determination, R2 = 0.30) or SPI (coefficient of determination, R2 = 0.14). A better correlation was found with SPEI as this index is calculated using both precipitation and evapotranspiration data, which are critical hydroclimatological parameters, and possibly, majorly contribute to crop growth and yield. It was necessary to find critical levels for SPEI that might guide a farmer to decide on cover cropping in the fall. Solving the model, we found that SPEI values below -0.21 and above 1.62 might provide yield advantage, but if SPEI value for any location is in between these range (-0.21 to 1.62) then the farmer might not get any yield benefit using CCs. Therefore, the farmer may chose not to plant CCs if the subsequent crop is corn (Figure 6). We speculate that when more moisture is available under a very wet year then cover crops can provide a yield advantage just by improving nutrient cycling and soil health, and also by removing excess moisture so that the cash crop can be planted at the ideal time. Contrastingly, when the soil moisture level is very low then cover crops can conserve moisture providing a ‘live mulch’ against evaporation loss (78). Under low moisture availability, cover crops may not produce a lot of biomass that ties up a lot of nutrients. This information may also guide selection of cover crop species under different hydroclimatic scenarios (79). For example, when plenty of moisture is available before cover crop planting, a farmer might choose to select cover crops that produce large biomass. But if the hydroclimatological indices indicate drought conditions, a farmer might decide to use drought resilient, and ‘specific management-targeted’ cover crops, such as radishes to break compaction (80), legumes to fix nitrogen (81), brassicas to irradicate soil-borne-pathogens (82), etc. A recent article from the same region reported that precipitation was the key factor influencing yield and not CC composition or cover cropping (15); this relationship between cash crop yields and SPEI reaffirms that hydroclimatological parameters might be more efficient in deciding crop rotations when cover cropping is included. Mohammed et al. (83) also indicated SPEI as a predictor for corn and wheat yield across Hungary. As we have not seen any soil health benefits in these study sites where farmer-cooperators have already built ‘good soil health’, practicing no-till, sustainable crop rotations, and cover cropping in the earlier seasons, cover cropping might be a ‘potential financial decision’ for a farmer if yield benefits are not expected. Additionally, Figure 8 indicates that higher cover crop biomass negatively influenced cash crop yields. We can speculate that higher amounts of nutrient (especially nitrogen) were accumulated in the cover crop biomass and more moisture was ‘stolen’ from the cash crop when cover crop biomass was higher. This outcome echoed the concerns of many farmers growing cover crops under rainfed system and experiencing cash crop yield loss. Hence, it might be beneficial to use hydroclimatological information before going into another CC season. Overall, our findings indicated that a multiscalar index like SPEI can guide better CC decisions and should be investigated further to create a robust decision-support tool for cover cropping, especially in the rainfed cropping systems.
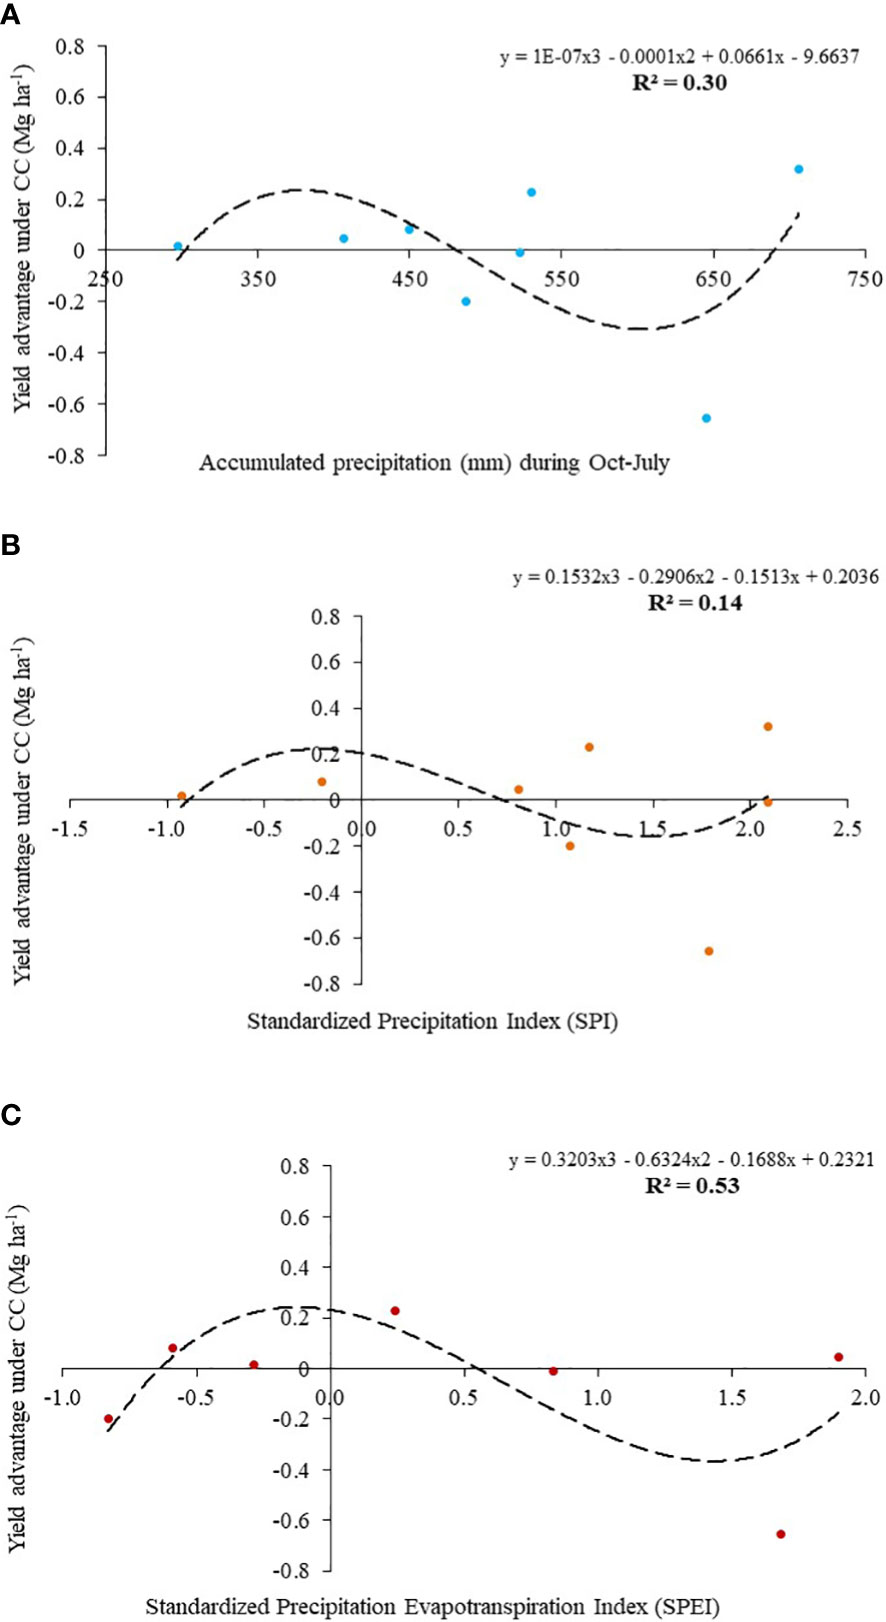
Figure 7 Modelling cover crop yield advantage against selected hydroclimatological parameters (A) accumulated precipitation (mm) during Oct-Jul before cover crop planting, (B) SPI, and (C) SPEI values for all site-year’s under study.
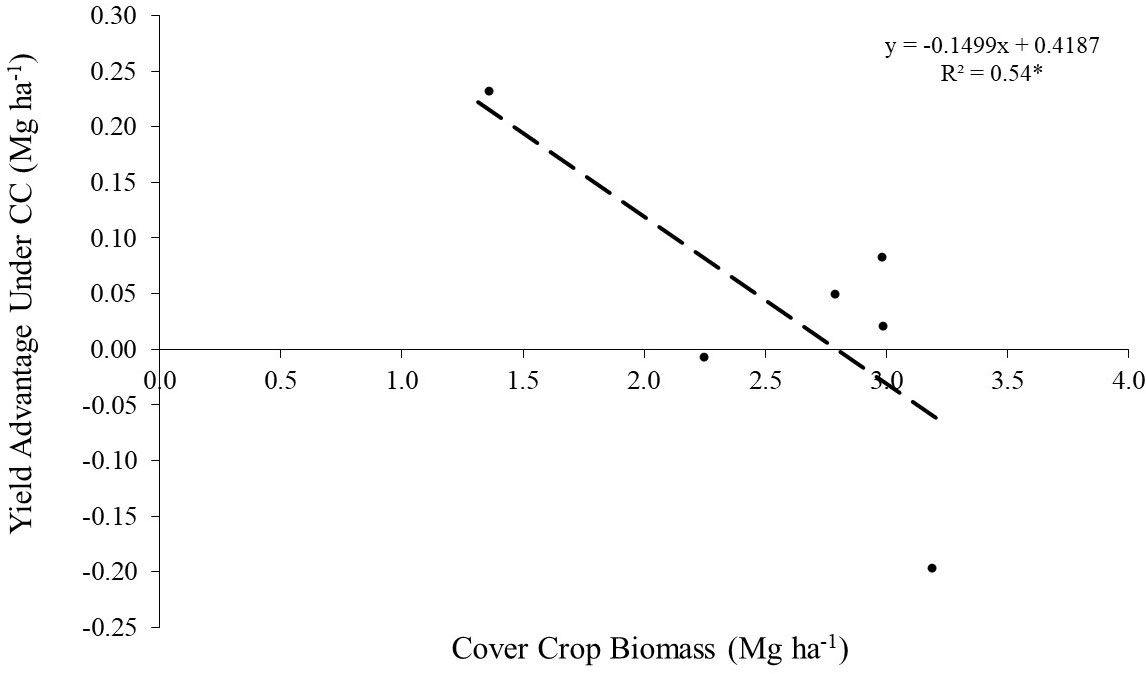
Figure 8 A figure depicting significant negative correlation between cover crop biomass (Mg ha-1) and yield advantage (Mg ha-1) under cover cropping.
4 Conclusion
In this article, we tried to echo a genuine concern of commercial dryland farmers against using CCs in their rotation. Especially when they are planning to grow a crop like corn that requires higher levels of resources like water and nutrients (especially NPK) for optimum productivity. It is obvious that under rainfed agricultural systems, water is more precious, and a farmer would want to invest the water received from precipitation events majorly towards the cash crops, to sustain farm economy and improve socioeconomic status. Therefore, if CCs do not provide additional yield or soil health benefits, similar to what we found in our study, a farmer might choose not to invest money or the limited natural resources like water and nutrients on CCs when the next cash crop in rotation requires substantial amounts of those resources for optimum productivity. Furthermore, in a controlled setup of research stations, the scopes are often limited, therefore, more on-farm research trials are to be conducted to understand the ‘real’ impacts of cover cropping in commercial farms and its sustainability.
Another important aspect of farm management that our study revealed is that existing soil health status and farm’s agronomic practices should be taken into consideration, while deciding on CC integration into crop rotations. It is less probable to see additional soil health benefits of CCs if the soil is healthy enough to support efficient nutrient cycling and ultimately crop production. Therefore, it requires a multidisciplinary approach to make successful CC decisions. As climate change is inevitable, and weather will remain unpredictable, hydroclimatological parameters need to be explored more and more to devise better crop management decisions. Our study also provided information on a multiscalar climatological index such as SPEI that can guide farmers in making crucial decisions regarding inclusion of CC in the rotation. However, this study only explored this parameter, and future studies should be designed to investigate more thoroughly. Weather predictions are often not accurate, hence, it is always risky to depend only on seasonal precipitation to grow cash crops. It might be a safer choice for farmers to decide on cover cropping based on hydroclimatological scenarios before planting of CCs. A hydroclimatological overview or outlook, provided by regional climatologists may provide them information to plan cover cropping profitably. However, there are more to explore, more studies to be done to 'fine-tune' the current models to integrate these hydroclimatological parameters in CC decision tools.
Data availability statement
The raw data supporting the conclusions of this article will be made available by the authors, without undue reservation.
Author contributions
DS, AM, and AB contributed to conception and design of the study. JW, AR, AM, DS, DK, and AB collected all research data. AR and JW conducted all laboratory analyses. DS and JC organized the agronomic data. AM organized the hydroclimatic database. DS performed the statistical analysis. DS wrote the first draft of the manuscript. AM and AB wrote sections of the manuscript. All authors contributed to manuscript revision, read, and approved the submitted version.
Funding
The funding came through USGS (RWO number 117), and USDA NRCS South Dakota funded this multi-year statewide project. The grant number is G17AC00338.
Acknowledgments
We acknowledge Dr. Sandeep Kumar’s soil health lab personnel at South Dakota State University for their help in PLFA analyses. Additionally, we acknowledge all undergraduate interns, who helped us in field sampling and in analyzing the samples in lab.
Conflict of interest
The authors declare that the research was conducted in the absence of any commercial or financial relationships that could be construed as a potential conflict of interest.
Publisher’s note
All claims expressed in this article are solely those of the authors and do not necessarily represent those of their affiliated organizations, or those of the publisher, the editors and the reviewers. Any product that may be evaluated in this article, or claim that may be made by its manufacturer, is not guaranteed or endorsed by the publisher.
References
1. Dabney SM, Delgado JA, Reeves DW. Using winter cover crops to improve soil and water quality. commun. Soil Sci Plant Anal (2001) 32:1221–50. doi: 10.1081/CSS-100104110
2. Snapp SS, Swinton SM, Labarta R, Mutch D, Black JR, Leep R, et al. Evaluating cover crops for benefits, costs and performance within cropping system niches. Agron J (2005) 97:322–32. doi: 10.2134/agronj2005.0322a
3. Kaspar TC, Singer JW. The use of cover crops to manage soil. Soil Manage Build Stable Base Agric (2015), 321–37. doi: 10.2136/2011.soilmanagement.c21
4. Daryanto S, Fu B, Wang L, Jacinthe PA, Zhao W. Quantitative synthesis on the ecosystem services of cover crops. Earth-Science Rev (2018) 185:357–73. doi: 10.1016/j.earscirev.2018.06.013
5. Ghimire R, Ghimire B, Mesbah AO, Sainju UM, Idowu OJ. Soil health response of cover crops in winter wheat–fallow system. Agron J (2019) 111:2108–15. doi: 10.2134/agronj2018.08.0492
6. Haruna SI, Anderson SH, Udawatta RP, Gantzer CJ, Phillips NC, Cui S, et al. Improving soil physical properties through the use of cover crops: A review. Agrosystems Geosci Environ (2020) 3:1–18. doi: 10.1002/agg2.20105
7. Restovich SB, Andriulo AE, Armas-Herrera CM, Beribe MJ, Portela SI. Combining cover crops and low nitrogen fertilization improves soil supporting functions. Plant Soil (2019) 442:401–17. doi: 10.1007/s11104-019-04205-8
8. Perrone S, Grossman J, Liebman A, Sooksa-nguan T, Gutknecht J. Nitrogen fixation and productivity of winter annual legume cover crops in upper Midwest organic cropping systems. Nutr Cycl. Agroecosystems (2020) 117:61–76. doi: 10.1007/s10705-020-10055-z
9. Balota EL, Calegari A, Nakatani AS, Coyne MS. Benefits of winter cover crops and no-tillage for microbial parameters in a Brazilian oxisol: A long-term study. Agric Ecosyst Environ (2014) 197:31–40. doi: 10.1016/j.agee.2014.07.010
10. Sanyal D, Wolthuizen J, Karl D, Bly A. (2019). Cover crops influence soil health, nutrient cycling, and crop yield in south Dakota, in: Embracing the Digital Environment 2019 ASA-CSSA-SSSA International Annual Meeting, Nov 10-13.
11. Blanco-Canqui H. Cover crops and water quality. Agron J (2018) 110:1633–47. doi: 10.2134/agronj2018.02.0077
12. Meyer N, Bergez JE, Constantin J, Justes E. Cover crops reduce water drainage in temperate climates: A meta-analysis. Agron Sustain Dev (2019) 39:1–11. doi: 10.1007/s13593-018-0546-y
13. Sanyal D, Wolthuizen J, Karki D, Bly A. (2019). Cover crops influence soil health, nutrient cycling, and crop yield in south Dakota, in: ASA, CSSA and SSSA International Annual Meetings.
14. O’Reilly KA, Lauzon JD, Vyn RJ, Van Eerd LL. Nitrogen cycling, profit margins and sweet corn yield under fall cover crop systems. Can J Soil Sci (2012) 92:353–65. doi: 10.4141/cjss2011-065
15. Clark JD, Sanyal D, Bielenberg H, Wolthuizen J, Karki D, Rahal A, et al. Precipitation and not cover crop composition influenced corn economic optimal N rate and yield. Agron J (2023) 111:426–41. doi: 10.1002/agj2.21265
16. Ranells NN, Wagger MG. Nitrogen release from grass and legume cover crop monocultures and bicultures. Agron J (1996) 88:777–82. doi: 10.2134/agronj1996.00021962008800050015x
17. Odhiambo JJO, Bomke AA. Grass and legume cover crop effects on dry matter and nitrogen accumulation. Agron J (2001) 93:299–307. doi: 10.2134/agronj2001.932299x
18. Gentile R, Vanlauwe B, Chivenge P, Six J. Interactive effects from combining fertilizer and organic residue inputs on nitrogen transformations. Soil Biol Biochem (2008) 40:2375–84. doi: 10.1016/j.soilbio.2008.05.018
19. Gentry LE, Snapp SS, Price RF, Gentry LF. Apparent red clover nitrogen credit to corn: Evaluating cover crop introduction. Agron J (2013) 105:1658–64. doi: 10.2134/agronj2013.0089
20. McVay KA, Radcliffe DE, Hargrove WL. Winter legume effects on soil properties and nitrogen fertilizer requirements. Soil Sci Soc Am J (1989) 53:1856–62. doi: 10.2136/sssaj1989.03615995005300060040x
21. Fageria NK, Baligar VC, Bailey BA. Role of cover crops in improving soil and row crop productivity. Commun Soil Sci Plant Anal (2005) 36:2733–57. doi: 10.1080/00103620500303939
22. Ruark M, Franzen D. Nitrogen availability from cover crops: Is it always about the c: N ratio? Crop Soils (2020) 53:3–7.
23. Kelly C, Schipanski ME, Tucker A, Trujillo W, Holman JD, Obour AK, et al. Dryland cover crop soil health benefits are maintained with grazing in the U.S. high and central plains. Agric Ecosyst Environ (2021) 313:107358. doi: 10.1016/j.agee.2021.107358
24. Sarhadi A, Ausín MC, Wiper MP, Touma D, Diffenbaugh NS. Multidimensional risk in a nonstationary climate: Joint probability of increasingly severe warm and dry conditions. Sci Adv (2018) 4:eaau3487. doi: 10.1126/sciadv.aau3487
25. Ridder NN, Ukkola AM, Pitman AJ, Perkins-Kirkpatrick SE. Increased occurrence of high impact compound events under climate change. npj clim. Atmos Sci (2022) 5:1–8. doi: 10.1038/s41612-021-00224-4
26. Gatot I, Sofyan A, Rejekiningrum P, Lidon B. The roles of hydro-climatology in upland farming development in Indonesia. (2002).
27. Brown C, Carriquiry M. Managing hydroclimatological risk to water supply with option contracts and reservoir index insurance. Water Resour Res (2007) 43:1–13. doi: 10.1029/2007WR006093
28. Heino M, Guillaume JHA, Müller C, Iizumi T, Kummu M. (2018). The impacts of climate oscillations on crop yields: A multi-model, multi-scenario global study, in: AGU Fall Meeting Abstracts, , B31C-09.
29. Liao C-Y, Lo M-H, Juang J-Y. (2018). Impacts of agricultural irrigation on land-atmosphere coupling strength under different hydroclimatological characteristics, in: AGU Fall Meeting Abstracts, , GC21G-1189.
30. Perera KV. The adaptability of empirical equations to calculate potential evapotranspiration and trend analysis of hydroclimatological parameters for agricultural areas in Newfoundland (2021).
31. Kshatriya US. Comparison of historical precipitation for Aberdeen, Ipswich and eureka, south Dakota. South Dakota State University (2018).
32. Joshi NL, Kar A. Contingency crop planning for dryland areas in relation to climate change. Indian J Agron (2009) 54:237–43.
33. Zargar A, Sadiq R, Naser B, Khan FI. A review of drought indices. Environ Rev (2011) 19:333–34. doi: 10.1139/a11-013
34. Bachmair S, Tanguy M, Hannaford J, Stahl K. How well do meteorological indicators represent agricultural and forest drought across Europe? Environ Res Lett (2018) 13:34042. doi: 10.1088/1748-9326/aaafda
35. Guttman NB. Comparing the palmer drought index and the standardized precipitation index 1. JAWRA J Am Water Resour Assoc (1998) 34:113–21. doi: 10.1111/j.1752-1688.1998.tb05964.x
36. Peña-Gallardo M, Vicente-Serrano SM, Quiring S, Svoboda M, Hannaford J, Tomas-Burguera M, et al. Response of crop yield to different time-scales of drought in the united states: Spatio-temporal patterns and climatic and environmental drivers. Agric For Meteorol (2019) 264:40–55. doi: 10.1016/j.agrformet.2018.09.019
37. Allen RG, Pereira LS, Raes D, Smith M. Crop evapotranspiration-guidelines for computing crop water requirements-FAO irrigation and drainage paper 56 Vol. 300. Fao (1998). p. D05109.
38. Javadian M, Behrangi A, Gholizadeh M, Tajrishy M. METRIC and WaPOR estimates of evapotranspiration over the lake urmia basin: Comparative analysis and composite assessment. Water (2019) 11:1647. doi: 10.3390/w11081647
39. Mbuthia LW, Acosta-Martínez V, DeBryun J, Schaeffer S, Tyler D, Odoi E, et al. Long term tillage, cover crop, and fertilization effects on microbial community structure, activity: Implications for soil quality. Soil Biol Biochem (2015) 89:24–34. doi: 10.1016/j.soilbio.2015.06.016
40. Chu M, Jagadamma S, Walker FR, Eash NS, Buschermohle MJ, Duncan LA. Effect of multispecies cover crop mixture on soil properties and crop yield. Agric Environ Lett (2017) 2:170030. doi: 10.2134/ael2017.09.0030
41. Chahal I, Van Eerd LL. Evaluation of commercial soil health tests using a medium-term cover crop experiment in a humid, temperate climate. Plant Soil (2018) 427:351–67. doi: 10.1007/s11104-018-3653-2
42. Nunes MR, van Es HM, Schindelbeck R, Ristow AJ, Ryan M. No-till and cropping system diversification improve soil health and crop yield. Geoderma (2018) 328:30–43. doi: 10.1016/j.geoderma.2018.04.031
43. Li P, Zhang H, Deng J, Fu L, Chen H, Li C, et al. Cover crop by irrigation and fertilization improves soil health and maize yield: Establishing a soil health index. Appl Soil Ecol (2023) 182:104727. doi: 10.1016/j.apsoil.2022.104727
44. USDA NRCS. Soil quality indicators (Physical, chemical, and biological indicators for soil quality assessment and management) (2015). Available at: https://linkinghub.elsevier.com/retrieve/pii/S0304389411008880.
45. Gerwing J, Gelderman R, Clark J. Fertilizer recommendation guide, SDSU extension (2019). Available at: https://extension.sdstate.edu/sites/default/files/2019-03/P-00039_0.pdf.
46. Gelderman RH, Denning JL, Goos RJ. Recommended chemical soil test procedures for the north central region. north cent. Reg. Res (2015) 221:11.1–4.
47. Moebius-Clune D. Cornell Soil health assessment for quantification of soil respiration. CSH 06 (2016).
48. Drinkwater LE, Cambardella CA, Reeder JD, Rice CW. Potentially mineralizable nitrogen as an indicator of biologically active soil nitrogen. Methods Assess Soil Qual. (1997) 49:217–29. doi: 10.2136/sssaspecpub49.c13
49. Moebius-Clune BN, Moebius-Clune DJ, Gugino BK, Idowu OJ, Schindelbeck RR, Ristow AJ, et al. Comprehensive assessment of soil health – the Cornell framework manual, Edition 3.1. (2016).
50. Weil RR, Islam KR, Stine MA, Gruver JB, Samson-Liebig SE. Estimating active carbon for soil quality assessment: A simplified method for laboratory and field use. Am J Altern. Agric (2003) 18:3–17. doi: 10.1079/AJAA200228
51. Culman SW, Snapp SS, Freeman MA, Schipanski ME, Beniston J, Lal R, et al. Permanganate oxidizable carbon reflects a processed soil fraction that is sensitive to management. Soil Sci Soc Am J (2012) 76:494–504. doi: 10.2136/sssaj2011.0286
52. Weaver RW, Angle S, Bottomley PJ, Smith S, Tabatabai A, Wollum A, et al. Methods of soil analysis part 2 microbiological and biochemical properties soil science society of America book series. (1994).
53. Sanyal D, Wolthuizen J, Bly A. Influence of nitrogen fertilization rate on soil respiration: A study using a rapid soil respiration assay. Nitrogen (2021) 2:218–28. doi: 10.3390/nitrogen2020014
54. Chowdhury TR, Dick RP. Standardizing methylation method during phospholipid fatty acid analysis to profile soil microbial communities. J Microbiol Methods (2012) 88:285–91. doi: 10.1016/j.mimet.2011.12.008
55. Abatzoglou JT, Dobrowski SZ, Parks SA, Hegewisch KC. TerraClimate, a high-resolution global dataset of monthly climate and climatic water balance from 1958-2015. Sci Data (2018) 5:1–12. doi: 10.1038/sdata.2017.191
56. Hayes M, Svoboda M, Wall N, Widhalm M. The Lincoln declaration on drought indices: universal meteorological drought index recommended. Bull Am Meteorol Soc (2011) 92:485–8. doi: 10.1175/2010BAMS3103.1
57. McKee TB, Doesken NJ, Kleist J. (1993). The relationship of drought frequency and duration to time scales, in: Proceedings of the 8th Conference on Applied Climatology, Boston. pp. 179–83.
58. McKee TB, Doesken NJ, Kleist J. (1995). Drought monitoring with multiple time scales, in: Proceedings of the 9th Conference on Applied Climatology, , Boston. pp. 233–6.
59. Hamed MM, Sammen SS, Nashwan MS, Shahid S. Spatiotemporal variation of drought in Iraq for shared socioeconomic pathways. Stochastic Environmental Research and Risk Assessment (2022), 1–11.
60. Abatzoglou JT, Kolden CA. Relationships between climate and macroscale area burned in the western united states. Int J Wildl. Fire (2013) 22:1003–20. doi: 10.1071/WF13019
61. Vicente-Serrano SM, Gouveia C, Camarero JJ, Beguería S, Trigo R, López-Moreno JI, et al. Response of vegetation to drought time-scales across global land biomes. Proc Natl Acad Sci (2013) 110:52–7. doi: 10.1073/pnas.1207068110
62. Stanford G. Rationale for optimum nitrogen fertilization in corn production. J Environ Qual. (1973) 2:159–66. doi: 10.2134/jeq1973.00472425000200020001x
63. Pantoja JL, Woli KP, Sawyer JE, Barker DW. Corn nitrogen fertilization requirement and corn-soybean productivity with a rye cover crop. Soil Sci Soc Am J (2015) 79:1482–95. doi: 10.2136/sssaj2015.02.0084
64. R Core Team. R: A language and environment for statistical computing (2020). Available at: https://www.r-project.org/.
65. Kuznetsova A, Brockhoff PB, Christensen RHB. lmerTest package: Tests in linear mixed effects models. J Stat Software (2017) 82:1–26. doi: 10.18637/jss.v082.i13
66. Goode K, Rey K. ggResidpanel: Panels and interactive versions of diagnostic plots using’ggplot2. ’R Package Version 0.3. 0. (2019).
69. Lê S, Josse J, Husson F. FactoMineR : An r package for multivariate analysis. J Stat Software (2008) 25:1–18. doi: 10.18637/jss.v025.i01
70. Albarenque SM, Basso B, Caviglia OP, Melchiori RJM. Spatio-temporal nitrogen fertilizer response in maize: Field study and modeling approach. Agron J (2016) 108:2110–22. doi: 10.2134/agronj2016.02.0081
71. Raza S, Farmaha BS. Contrasting corn yield responses to nitrogen fertilization in southeast coastal plain soils. Front Environ Sci (2022) 10:955142. doi: 10.3389/fenvs.2022.955142
72. Unger PW, Vigil MF. Cover crop effects on soil water relationships. J Soil Water Conserv (1998) 53:200–7.
73. Osipitan OA, Dille JA, Assefa Y, Knezevic SZ. Cover crop for early season weed suppression in crops: Systematic review and meta-analysis. Agron J (2018) 110:2211–21. doi: 10.2134/agronj2017.12.0752
74. Hunter MC, Kemanian AR, Mortensen DA. Cover crop effects on maize drought stress and yield. Agric Ecosyst Environ (2021) 311:107294. doi: 10.1016/j.agee.2020.107294
75. Badon TB, Prince Czarnecki JM, Krutz LJ, Shockley JM, Baker BH. Cover crop and minimum tillage effects on yield, irrigation water use, and net returns. Agrosystems Geosci Environ (2021) 4:1–10. doi: 10.1002/agg2.20158
76. Ripin EM, Schott H, Barnes J, O’Brien CG, Dowd W, Wraight D, et al. A multi-scalar drought index sensitive to global warming: The standardized precipitation evapotranspiration index – spei. (1989) 23:1–52.
77. Beguería S, Vicente-Serrano SM, Reig F, Latorre B. Standardized precipitation evapotranspiration index (SPEI) revisited: Parameter fitting, evapotranspiration models, tools, datasets and drought monitoring. Int J Climatol (2014) 34:3001–23. doi: 10.1002/joc.3887
78. Munawar A, Blevins RL, Frye WW, Saul MR. Tillage and cover crop management for soil water conservation. Agron J (1990) 82:773–7. doi: 10.2134/agronj1990.00021962008200040024x
79. Ingels C, Horn M, Bugg R, Miller P. Selecting the right cover crop gives multiple benefits. Calif. Agric (1994) 48:43–8.
80. Williams SM, Weil RR. Crop cover root channels may alleviate soil compaction effects on soybean crop. Soil Sci Soc Am J (2004) 68:1403–9. doi: 10.2136/sssaj2004.1403
81. Parr M, Grossman JM, Reberg-Horton SC, Brinton C, Crozier C. Nitrogen delivery from legume cover crops in no-till organic corn production. Agron J (2011) 103:1578–90. doi: 10.2134/agronj2011.0007
82. Larkin RP, Griffin TS. Control of soilborne potato diseases using brassica green manures. Crop Prot (2007) 26:1067–77. doi: 10.1016/j.cropro.2006.10.004
Keywords: cover crop, soil health, standardized precipitation index (spi), standardized precipitation and evapotranspiration index (SPEI), precipitation, corn, no-till
Citation: Sanyal D, Mukherjee A, Rahhal A, Wolthuizen J, Karki D, Clark JD and Bly A (2023) Cover crops did not improve soil health but hydroclimatology may guide decisions preventing cash crop yield loss. Front. Soil Sci. 3:1111821. doi: 10.3389/fsoil.2023.1111821
Received: 30 November 2022; Accepted: 08 March 2023;
Published: 23 March 2023.
Edited by:
Raj Setia, Punjab Remote Sensing Centre (PRSC), IndiaReviewed by:
Swaraj Kumar Dutta, Bihar Agricultural University, IndiaUrszula Norton, University of Wyoming, United States
Copyright © 2023 Sanyal, Mukherjee, Rahhal, Wolthuizen, Karki, Clark and Bly. This is an open-access article distributed under the terms of the Creative Commons Attribution License (CC BY). The use, distribution or reproduction in other forums is permitted, provided the original author(s) and the copyright owner(s) are credited and that the original publication in this journal is cited, in accordance with accepted academic practice. No use, distribution or reproduction is permitted which does not comply with these terms.
*Correspondence: Debankur Sanyal, ZHNhbnlhbEBhcml6b25hLmVkdQ==
 Debankur Sanyal
 Avik Mukherjee2