 Joseph Okello
 Marijn Bauters
 Hans Verbeeck
 John Kasenene3
 Pascal Boeckx
95% of researchers rate our articles as excellent or good
Learn more about the work of our research integrity team to safeguard the quality of each article we publish.
Find out more
ORIGINAL RESEARCH article
Front. Soil Sci. , 10 August 2022
Sec. Soil Biogeochemistry & Nutrient Cycling
Volume 2 - 2022 | https://doi.org/10.3389/fsoil.2022.905010
Tropical montane forests store large amounts of carbon (C), nitrogen (N), and phosphorus (P) in soil. These soil C, N, and P pools are vulnerable to increased losses due to the increasing local temperatures. To gain better insight into the effects of climate warming on biogeochemistry in montane forests in Africa, we established study plots along a natural climate gradient in Uganda between 1,250 and 3,000 m in the Rwenzori Mountains. We studied soil C, N, and P contents as well as 13C and 15N isotopic compositions and leaf nutrient contents. Further, we simulated climate warming by 0.9°C–2.8°C for 2 years by conducting in situ soil mesocosms translocation downslope. The results revealed that, along the elevational gradient, soil organic C increased six-fold from 2.6 ± 1.0% at 1,250–1,300 m to 16.0 ± 1.9% at 2,700–3,000 m, with a linear increase of 0.94% per 100 m of elevation increase. Similarly, soil total N increased five-fold, from 0.3 ± 0.1% to 1.3 ± 0.1%, with a linear increase of 0.07% per 100 m of elevation increase. Further, soil bio-available P increased three-fold, from 9.6 ± 5.2 mg kg−1 to 29.5 ± 3.0 mg kg−1, with a linear increase of 1.4 mg kg−1 per 100 m of elevation increase. Soil δ15N decreased linearly by 0.39‰ per 100 m of elevation increase, ranging from 8.9 ± 0.2‰ to 2.9 ± 0.7‰ at 1,250–1,300 m and 2,700–3,000 m, respectively. The accumulation of soil organic C and total N with elevation is due to slow microbial activity under lower temperature. Indeed, the soil δ15N indicated a more closed N cycling with increasing elevation. However, despite the increasing trend in soil C and nutrient status with elevation, leaf N and P contents decreased linearly with elevation. This is likely due to the impairment of nutrient uptake under low temperature and low pH. In addition, following 2 years of in situ soil warming, we found that the soil δ13C and δ15N values relatively increased. Generally, the results imply that warming triggered accelerated transformation processes of accrued soil organic matter.
Tropical forests are highly productive ecosystems, storing 25% of the terrestrial carbon (C) (1, 2), and harbor 96% of the world’s estimated 45,000 tree species (3). As such, they are important for global biodiversity and biogeochemical cycles (4, 5). However, these ecosystems are strongly threatened by global change, especially increasing global temperature and land use change (6). The current climate warming in the tropics—exacerbated by land use changes—has far-reaching consequences for biodiversity, ecosystem functioning and services, impacting both local and global populations (7). Moreover, unexpectedly, tropical montane forests, previously not considered to be vulnerable to land use change, have recently been subjected to high deforestation rates for conversion to agriculture. For instance, between the year 2014 and 2018, agricultural expansion at the expense of montane forests caused warming of up to 0.05 ± 0.01°C in the Albertine rift mountains of Africa, and warming of up to 2°C occurs under extensive deforestation (6). Such environmental factors are likely to change at high rates (8) and dramatically alter the cycling of C, nitrogen (N), and phosphorus (P), some of the key elements that support terrestrial ecosystems.
Globally, about 1,500 Pg of C and 136 Pg of N are stored in the uppermost meter of the soil layer, representing the largest terrestrial C and N pools (9, 10). However, these soil C and N pools are being lost due to climate warming and land use change involving deforestation of natural vegetation (i.e., indigenous forests, woodlands, and wetlands) for conversion to agricultural land (11). It is hypothesized that over the next 50–100 years, such climate warming due to anthropogenically induced production of greenhouse gases will increase global temperature by 2°C–5°C and up to 4°C–8°C in montane regions (12, 13). The increase in temperature leads to accelerated mineralization of accrued C and N in soil (14). Montane forests store particularly large amounts of accrued and partly undecomposed C in the soil (15–17). As such, if these ecosystems undergo warming, then large amounts of C stored in the soil can quickly be released into the atmosphere, potentially resulting in a strong warming positive feedback (12). Despite imminent threats of anthropogenically induced climate warming in Afromontane regions, there is still uncertainty on how these ecosystems will respond to such changes. Underlying this uncertainty is our limited understanding of how biogeochemical cycles and ecosystem dynamics will change. Elevational gradient transects can act as a long-term environmental gradients (18). As such, applying a short-term experimental warming superposed on this longer-term existing climate gradient along elevations might elucidate how soils and their biogeochemical cycles will respond to a century of rapid warming.
Therefore, to gain insight into the response of soil chemical properties along environmental gradients, we investigated: (i) present-day topsoil C, N, and P contents along a long-term climate gradient in Afromontane elevational gradient; (ii) the corroborating leaf N and P status along the elevational gradient; and (iii) response of soil properties to short-term experimental in situ warming by 0.9°C–2.8°C following an in situ soil mesocosm transplant downslope for a period of 2 years.
The Rwenzori Mountains National Park is located at the border between the Democratic Republic of the Congo and Uganda at latitudes of 0°06′ south and 0°46′ north and longitudes of 29°47′ west and 30°11′ east, covering nearly 1,000 km2. Because of its fragile montane ecosystem, species biodiversity, and endemism, it received a National Park status in 1991 and also was recognized as a world heritage site by the United Nations Scientific, Educational and Cultural Organization (UNESCO) in 1994. The region experiences a moist tropical climate, locally affected by altitude and topography. Annual rainfall varies with elevation, with the heaviest amounts on the eastern slope. Recent rainfall data from the Uganda Wildlife Authority from 2012 to 2015 showed mean annual rainfall ranging between 1,570 ± 334 mm at 1,760 m and 1,806 ± 322 mm at 4,230 m (all elevations refer to above sea level (a.s.l.)).
On the lower foot of the Rwenzori Mountains is the Kibale Forest National Park, located in the Kabarole and Kamwenge districts of western Uganda, covering 795 km². Kibale Forest National Park forms the premontane part of the studied elevational gradient at elevation between 1,250 and 1,300 m. The southern end of this park lies on the floor of the Albertine rift system. The climate is moist tropical and temperatures stay nearly the same almost year-round as it is close to the equator. Recent temperature data recorded using thermocron iButton sensors DS1921G-F5 (iButton, Thermocron Baulkham Hills, Australia), installed at 5-cm soil depth from November 2017 to August 2019, show an average temperature of 19.5°C in the park (Figure 1). The average annual rainfall is 1,365 ± 53 mm and the average air temperature is 27.8 ± 0.74°C (data from 1992 to 2012, Kyembogo weather station in Kabarole district located 20 km from the park, at elevation of 1,400 m, Ministry of Water and Environment). Dominant tree species and soil type for different altitudes in the Rwenzori mountains and the Kibale Forest National Park are listed in Table 1.
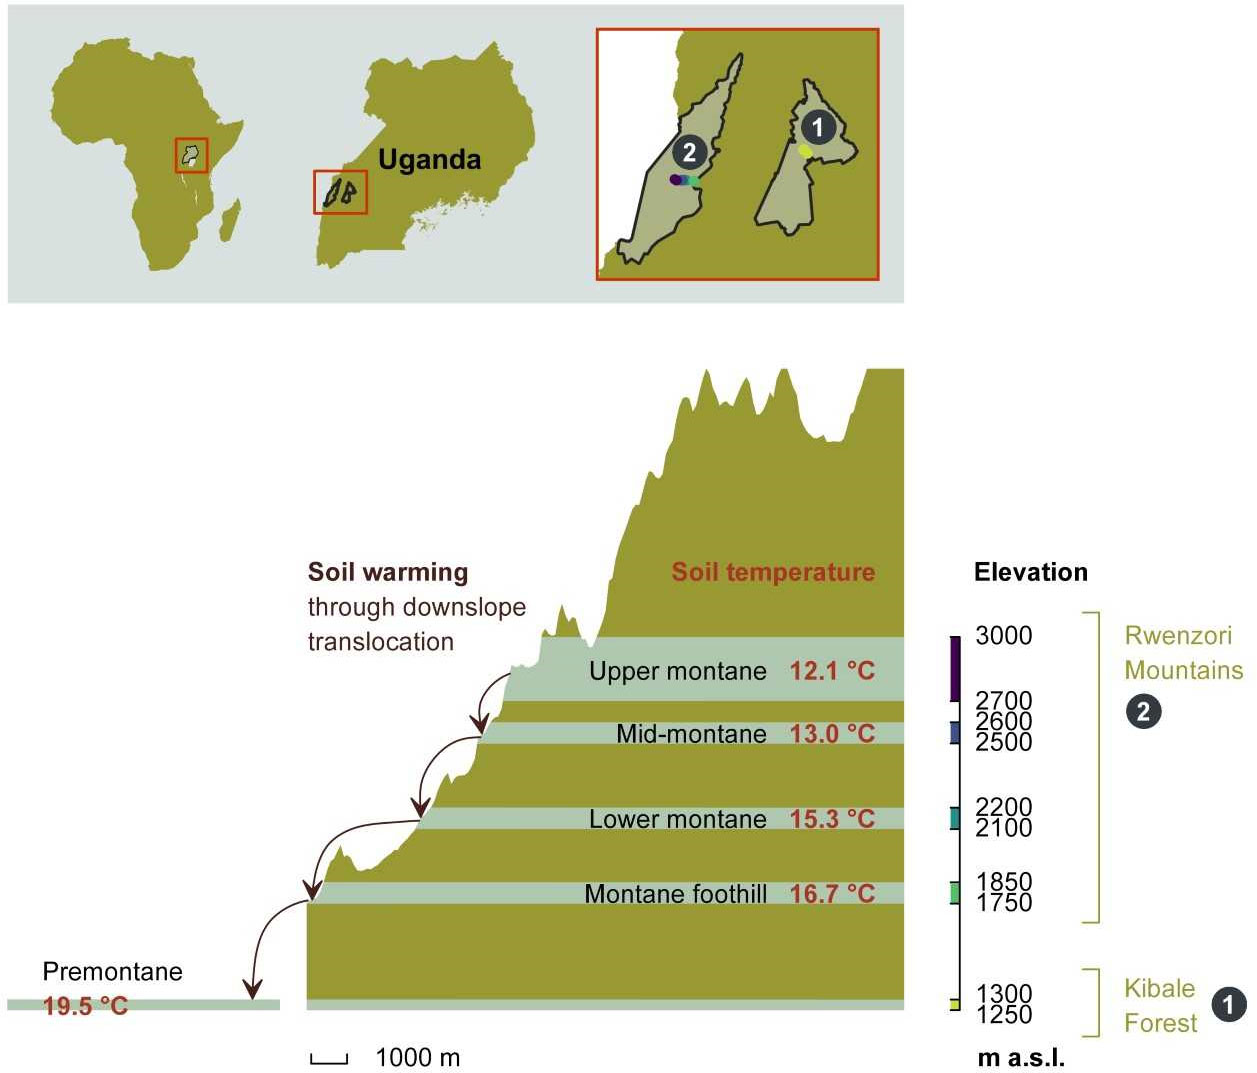
Figure 1 The height profile of the Rwenzori elevational gradient starting from nearby premontane Kibale Forest National Park (1,250–1,300 m a.s.l.) onto the Rwenzori Mountains National Park (1,750–3,000 m a.s.l.). Mean annual in situ temperatures for each of the five elevation clusters are indicated. The setup of in situ warming through downslope translocation of soil cores to the immediate lower elevation cluster is illustrated on the left side of the scheme. Different colors on the elevation axis represent the color code for each elevation cluster throughout the manuscript.
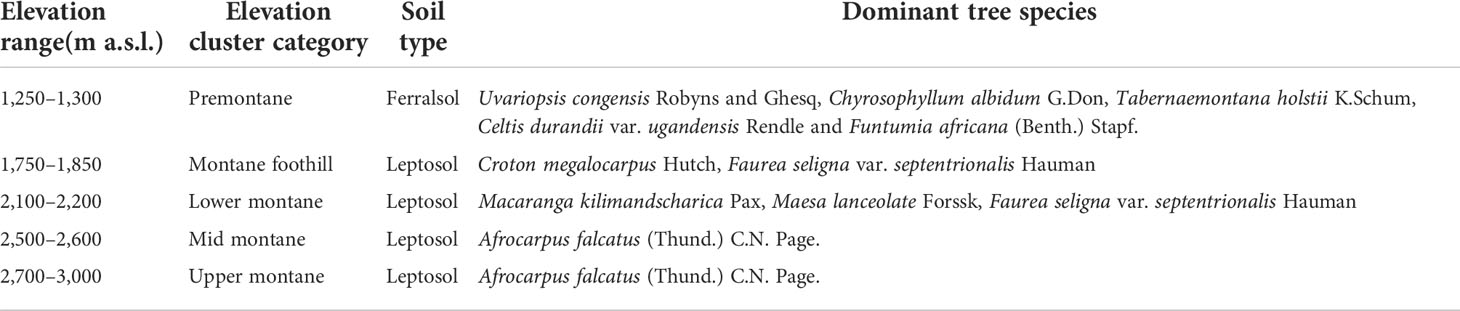
Table 1 Elevation clusters for the studied plots in the east-facing slope of Rwenzori mountains, extending to Kibale Forest National Park, ranging from premontane forest to upper montane forest with major soil type and dominant tree species.
To study soil and leaf chemistry under a long-term climate gradient, coupled with the changes in soil chemical properties following short-term experimental warming, we established 20 permanent sample plots. The plots were established along an elevational gradient from Kibale Forest National Park at 1,250 m to 3,000 m in the Rwenzori Mountains. In each of five elevation clusters, four replicated sample plots were established in close proximity within similar environmental conditions. Each permanent sample plot measures 40 m by 40 m. Four permanent sample plots are located in the premontane Kibale Forest National Park, and a total of 16 permanent sample plots (four at each elevation cluster) are located at different elevation clusters in the Rwenzori Mountains National Park (Table 1, Figure 1). The plots were established in mostly undisturbed and closed-canopy forests, although plots 1 and 2 showed signs of disturbance, likely from landslides.
A plot-level composite soil sample was collected by taking one sample from each of the four 20 m by 20 m sub-plots within each permanent sample plot. Subsequently, the samples were homogenized. Soil sampling was done for the top 30-cm depth. The collected composite soil samples were oven-dried at 60°C for 3 days and after sieved through 2-mm mesh size. Roots were manually removed and the samples were ground. Subsequently, the C, total N contents, and δ15N stable isotope composition were determined using an elemental analyzer (automated nitrogen carbon analyzer; ANCA-SL, SerCon, Cheshire, UK), coupled to an isotope ratios mass spectrometer (IRMS; 20-20, SerCon, Cheshire, UK). For mineral N determination, mineral N (ammonium and nitrate) was extracted by shaking 5 g of dried soil with 20 ml of 0.5 M KCl (1:5 w/v) at 125 rotations per minute for 2 h. The solution was filtered, and mineral N concentration in the filtrate was measured using continuous flow autoanalyzer (Skalar Inc., The Netherlands).
Soil bio-available P was determined using the anion exchange membrane resin strip method (19). Resin strips were first activated by immersing in 500 ml of 0.5 M NaHCO3 (pH 8.5) for 1 h for regeneration into the bicarbonate form. This process was repeated four times using fresh solution of 0.5 M NaHCO3. P was extracted from dried soil by shaking 1 g of sample and two pre-activated resin membranes in 30 ml of deionized water, end over end, for 16 h at room temperature. The resin strips were then removed, and P retained was extracted by shaking the resin strips in 20 ml of 0.5 M HCl, end over end, for 16 h. Finally, soil bio-available P was determined using the standard phosphate calorimetric kit, and the absorbance was measured using a UV 1600 PC spectrophotometer, USA, at 650-nm wavelength. All samples were replicated three times.
To measure soil pH, 5 ml of the oven-dried soil was brought into suspension with 25 ml of 1 M KCl (1:5 v/v) and shaken end-over-end for 1 h. Subsequently, the suspension was left to settle for 2 h, and then, soil pH was measured in the supernatant using a pH glass electrode, model 920A, Orion, England.
To determine the bulk density of the soil, the soil samples were collected from the permanent sample plots using Kopecky ring of 100 cm3 by volume. The total fresh weight of the sample was then recorded, and after, a sub-sample of about 20 g was oven-dried at 105°C for 24 h, and dry weight was taken. From the obtained dry weight of the sub-sample, the dry weight of the entire soil volume in the Kopecky ring was calculated. Finally, the bulk density was calculated as mass of oven-dried soil divided by the total volume of the soil sample.
To determine leaf N and P, we collected 10 fully expanded and intact sun-lit leaves from at least three individual trees per species per plot. The leaves were sampled from dominant tree species that make up at least 50% of the cumulative basal area per elevation cluster. For each selected species per plot, a minimum of three individual trees were sampled as replicates. The leaves were air-dried and later oven-dried at 60°C for 48 h, and the dry mass was determined. The leaves were then ground, and subsequently, C and N contents and δ15N stable isotope composition of leaf samples were analyzed using elemental analyzer (automated nitrogen carbon analyzer; ANCA-SL, SerCon, Cheshire, UK), coupled to IRMS (20-20, SerCon, Cheshire, UK).
For determination of the leaf P content, the ground leaf of each sample was dry-ashed at 550°C for 5.5 h. The ash was dissolved in 2M HCl solution and subsequently filtered through a P-free filter paper. Total P was determined from the filtrate by atomic absorption spectroscopy method no. G-103-93 Rev.2 (Multitest MT7/MT8) (20).
For each tree species considered in a plot, weighted average of the basal area contributions relative to total basal area of the plot was used to transform the leaf traits into community-weighted values (21). The community weighted mean for each trait was assumed to equal the sum of weighted basal area contributions for each species considered in the plot divided by number of species considered:
where:
is the community weighted mean value for trait x;
wi is the basal area fractions of species I;
xi is the mean value of trait x for species I;
N is the number of species.
To experimentally simulate short-term climate warming and assess the response of topsoil (0–10 cm) C, N, and P, and soil pH, in each permanent sample plot, we transplanted intact soil cores of 16-cm diameter by 25-cm length. These soil cores were taken using a metallic soil corer in which a plastic Polyvinyl chloride (PVC) tube of 16-cm diameter by 25-cm length was inserted to collect the intact soil mesocosms. In each plot, four soil mesocosms were transplanted within the same plot (control) and another four were translocated to the plot of lower elevation cluster (warmed). This means that the highest elevation cluster did not receive translocated soil cores from another site and therefore only had a total of 16 controlled soil mesocosms but had soil cores translocated to the lower elevation cluster below it. On the other hand, the lowest elevation cluster only received the 16 soil transplants from the elevation cluster above it, whereas no cores of the cluster itself were translocated. Each cluster therefore had a total of 16 warmed and 16 control soil cores, except the lowest cluster that had no warmed soil transplants. The schematic display of the soil warming experiment by downslope translocation with average annual in situ soil temperatures at 5-cm depth is shown in Figure 1.
After 2 years of in situ incubation of both control and warmed soil cores, the soil cores were collected. The top 10 cm of the soil samples were collected for determination of C, N, and P contents, soil pH, and C and N isotope compositions. The four plot-level soil mesocosm transplants of the same treatment were homogenized. Therefore, in each elevation cluster, a total of four replicated composite samples per treatment were used. The homogenized soil samples were air-dried, after sieved through 2-mm mesh size. Roots were manually removed, and the samples were ground. Subsequently, the C, N, and P contents, as well as δ13C and δ15N stable isotope compositions, were determined as described above. The soil mesocosms that were translocated from higher to lower elevation clusters were warmed by about 0.9°C to 2.8°C on average for 2 years (Figure 1).
To determine whether there was a difference in topsoil physicochemical properties and leaf chemistry along the elevational gradient, we grouped the permanent sample plots into five elevation clusters (Table 1), with each elevational cluster consisting of four nearby study plots within similar elevations and environmental conditions. We employed analysis of variance (ANOVA) to check differences in mean of the studied variables among the five elevation clusters in the study transect. Subsequently, post hoc analysis for multiple comparisons was performed using the Tukey’s honest significance test to explicitly reveal which clusters differ from each other. We used quantile–quantile and residual plots to check that data followed assumptions of ANOVA.
In addition, we checked whether elevational change had an effect on the selected parameters in topsoil and leaf chemistry. Here, we used the linear mixed effect model regression “lme4” package in R software, in which the studied variables along the elevational gradient were predicted using elevation as a fixed effect and elevational cluster as a random effect, to control for spatial clustering of plots within a cluster. In this approach, we used type III ANOVA with Satterthwaite’s approximation method in the linear mixed effect model to estimate the P-values. In each linear mixed effect model, both marginal and conditional R-square values ( and , respectively) were obtained following Nakagawa and Schielzeth (22).
To assess the effect of short-term soil warming on C, N, and P and soil pH at each elevation cluster, we performed a non-parametric Wilcoxon test to compare control and warmed soil mesocosm per elevation cluster. In addition, to check the relative change in the studied variables along the elevational gradient, we fitted a linear mixed effect regression for control and warmed treatments. All data were analyzed using R software version R 3.5.1 (R core development team, 2018), using a 95% confidence interval.
The soil organic carbon (SOC) content increased along the elevational gradient from 2.6 ± 0.1% at lowest elevation cluster of 1,250–1,300 m to 16.0 ± 1.9% at the highest elevation cluster of 2,700–3,000 m (SI Table 1). Further, the SOC increased linearly by 0.94 ± 0.10% per 100 m of elevation increase (, P = 0.003; Figure 2A, Table 2). Similarly, soil total N increased along the elevational gradient from 0.3 ± 0.1% at 1,250–1,300 m to 1.3 ± 0.1% at 2,700–3,000 m (SI Table 1). Soil total N linearly increased at a rate of 0.07 ± 0.01% per 100 m of elevation increase (, P < 0.001; Figure 2B, Table 2). On the other hand, soil mineral N showed no variability along the elevational gradient, ranging between 63.2 ± 10.9 mg kg−1 and 84.0 ± 8.1 mg kg−1 (P = 0.115; Figure 2C, Table 2, SI Table 1). In addition, soil bio-available P showed the highest value of 29.5 ± 3.1 mg kg−1 at 2,700–3,000 m and lowest value of 9.6 ± 5.2 mg kg−1 at 1,250–1,300 m (SI Table 1). Along the elevational gradient, bio-available P increased linearly by 1.4 ± 0.00 mg kg−1 per 100 m of elevation increase (, P < 0.001; Figure 2D, Table 2).
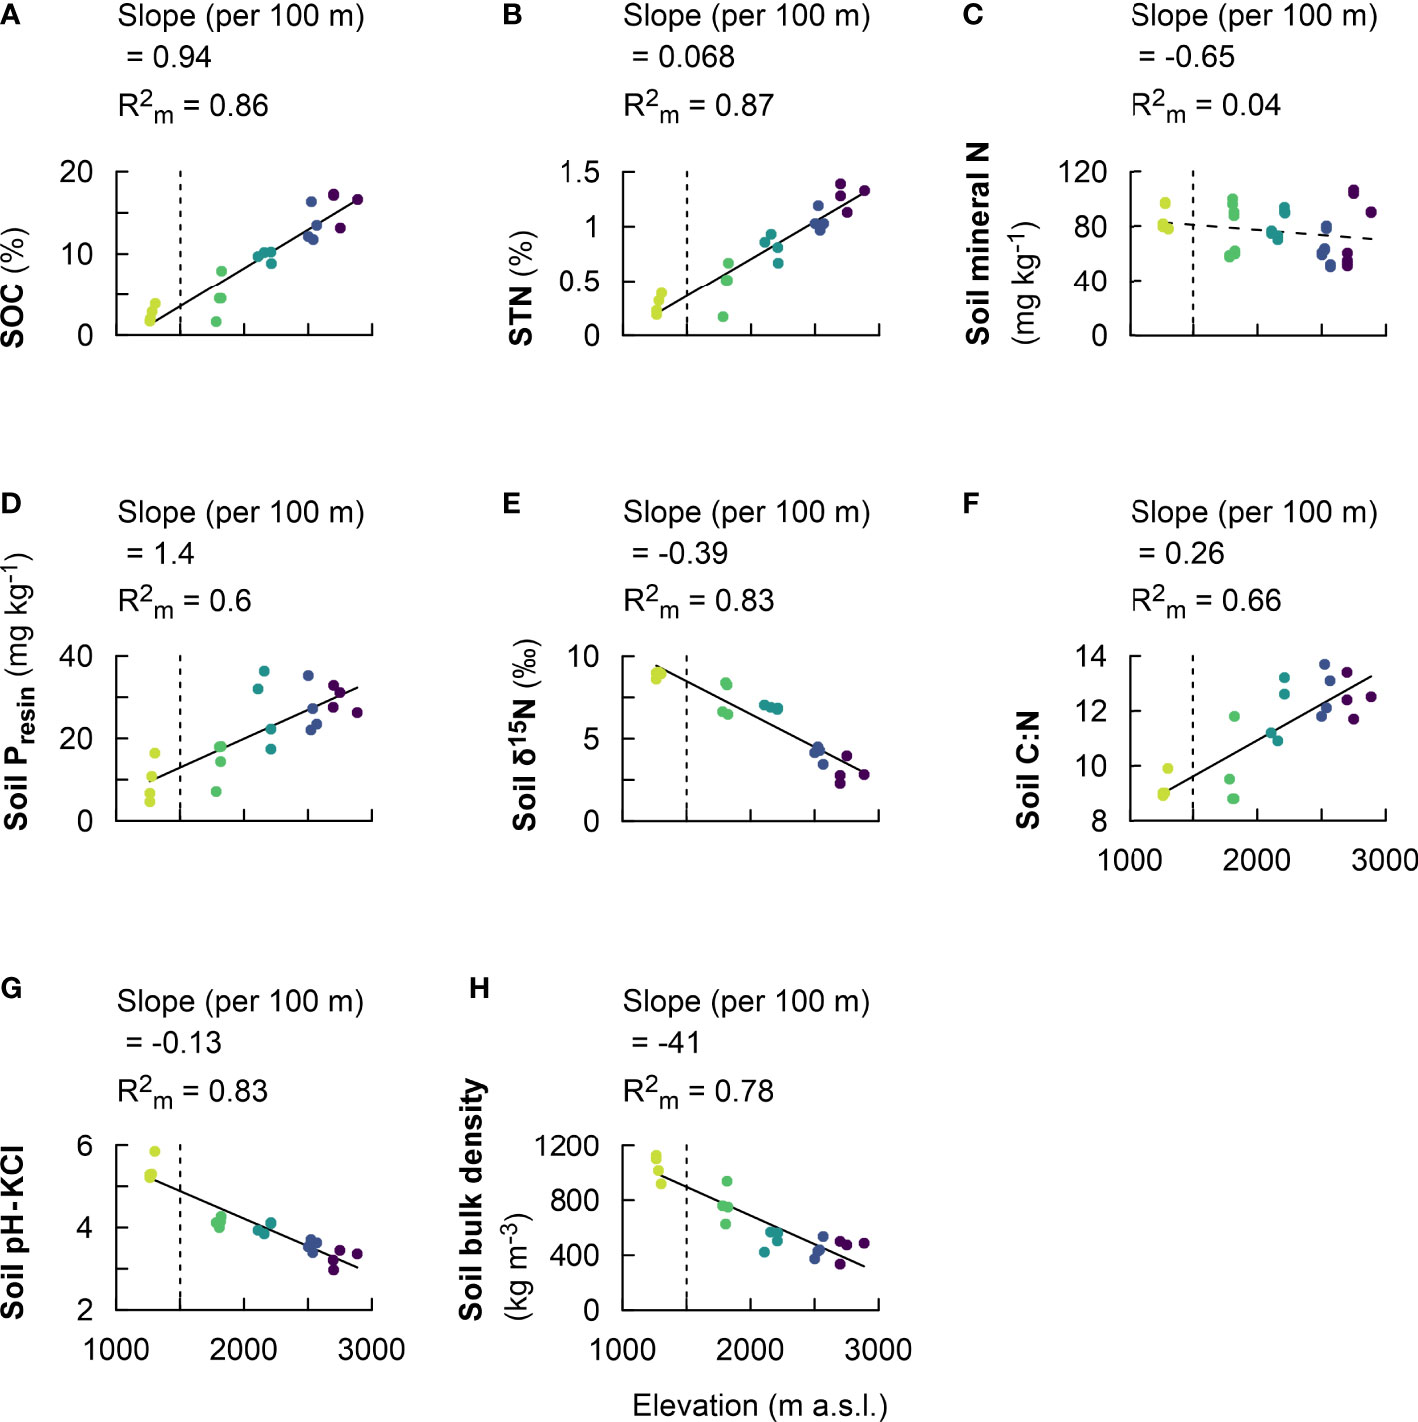
Figure 2 Fixed effect estimates of elevation (per 100-m elevation increase) for topsoil physicochemical properties: soil organic carbon (SOC) (A), soil total nitrogen (STN) (B), soil mineral nitrogen (C), soil resin phosphorus (Presin) (D), soil δ15N (E), soil C:N (F), soil pH-KCl (G), and soil bulk density (H). The slope of the linear mixed effect model estimates per 100 m of elevation increase is indicated (black solid line for a significant effect and black dashed line for no significant effect), as well as the marginal R2 , representing the fraction of the response variable explained by elevation. Plots from montane forest clusters (from 1,750 to 3,000 m a.s.l.) were compared with a nearby premontane forest (separated by vertical dashed line) at an elevation of 1,250–1,300 m a.s.l.
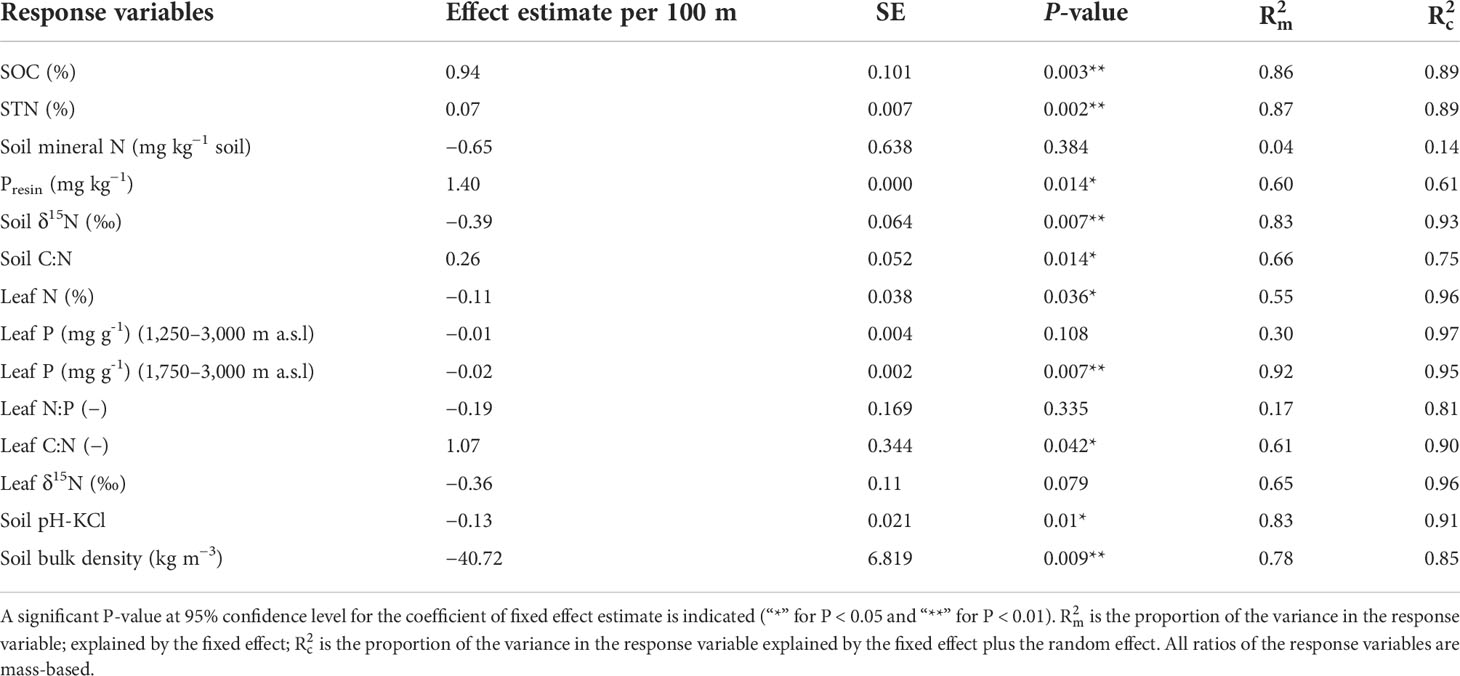
Table 2 Fixed effect estimates of elevation (per 100 m) for response variables; soil organic carbon (SOC), soil total nitrogen (STN), soil mineral N, soil bio-available P (Presin), soil δ15N, soil C:N, leaf N, leaf P, leaf N:P, leaf C:N, soil pH and soil bulk density (BD) with associated standard error (SE), P-value, marginal coefficient of determination , and conditional coefficient of determination .
On the other hand, soil δ15N showed the highest value of 8.9 ± 0.2‰ at 1,250–1,300 m and declined to values between 7.4 ± 1.0 to 4.1 ± 0.4‰ at mid-elevations between 1,750 and 2,500 m, and the lowest value of 2.9 ± 0.7‰ at 2,700–3,000 m (SI Table 1). Soil δ15N decreased linearly by 0.4 ± 0.1‰ per 100 m of elevation increase (, P < 0.001; Figure 2E, Table 2). Further, the ratio of soil carbon-to-nitrogen (C:N) showed higher values of 12.0 ± 1.1 to 12.5 ± 0.7 from 2,000 to 3,000 m and lower values of 9.2 to 9.7 from 1,250 to 1,750 m (SI Table 1). Along the elevational gradient, soil C:N increased linearly by 0.3 ± 0.1 per 100 m of elevation increase (, P < 0.001; Figure 2F, Table 2).
Furthermore, soil pH showed the highest value of 5.4 ± 0.3 at 1,250–1,300 m and decreased to values of ca. 4.0 ± 0.1 in mid-montane forest at elevation clusters of 1,750–2,200 m, which further decreased to the lowest value between 3.6 ± 0.1 and 3.4 ± 0.2 at elevation clusters of 2,500–3,000 m (SI Table 1). Soil pH decreased linearly by 0.13 ± 0.02 per 100 m of elevation increase (P < 0.001; Figure 2G, Table 2). Finally, soil bulk density decreased along the elevational transect, with highest value of 1,039 ± 93 kg m−3 at 1,250–1,300 m, which decreased to 769 ± 129 kg m−3 at 1,750–1,850 m, and the lowest values ranging from 513 ± 67 to 448 ± 76 kg m−3 between elevation clusters of 2,000–3,000 m (SI Table 1). Soil bulk density decreased linearly by 41 ± 7 ± 6.82 kg m−3 per 100 m of elevation increase (P < 0.001; Figure 2H, Table 2).
Leaf N decreased along the elevational gradient, with a higher value of 3.4 ± 0.0% at 1,750–1,850, and decreased to 2.7 ± 0.1% at 1,250–1,300 m and 2.4 ± 0.1% at 2,000–2,200 m, and decreased further to values between 1.9 ± 0.3% and 1.6 ± 0.1% between 2,500 and 3,000 m (SI Table 1). Leaf N decreased linearly by 0.11 ± 0.04% per 100 m of elevation increase (P < 0.001; Figure 3A, Table 2). Meanwhile, leaf P decreased along the elevational gradient, with the highest value of 0.3 ± 0.0 mg g−1 at 1,750–1,850 m, and decreased to 0.2 ± 0.0 mg g−1 at 1,250–1,300 and 2,000–2,200 m, and the lowest value of 0.1 ± 0.0 mg g−1 at 2,700–3,000 m (SI Table 1). Leaf P decreased linearly by 0.02 mg g−1 per 100 m of elevation change (P < 0.001; Figure 3B, Table 2). Further, leaf N:P varied when comparing premontane forest cluster at elevation of 1,250–1,300 m with the rest of the higher elevation clusters from elevation of 1,750–3,000 m (P < 0.001; Figure 3C, SI Table 1). In addition, leaf δ15N decreased from 6.1 ± 0.2‰ at 1,250–1,300 m to 3.5 ± 0.5‰ at 1,750–1,850 m and continued to decrease from elevation cluster of 2,000–3,000 m (SI Table 1). Leaf δ15N tended to decrease linearly by 0.36 ± 0.06‰ per 100 m of elevation increase (P = 0.08; Figure 3D, Table 2). Finally, leaf C:N ratio increased with elevation, with the highest value of 30.7 ± 2.6‰ at the highest elevation cluster of 2,700–3,000 m and the lowest values between 13.7 ± 0.04‰ and 17.2 ± 0.8‰ at elevation clusters between 1,250 and 1,800 m (SI Table 1). Leaf C:N linearly increased by 1.1 ± 0.3 per 100 m of elevation change (P < 0.001; Figure 3E, Table 2).
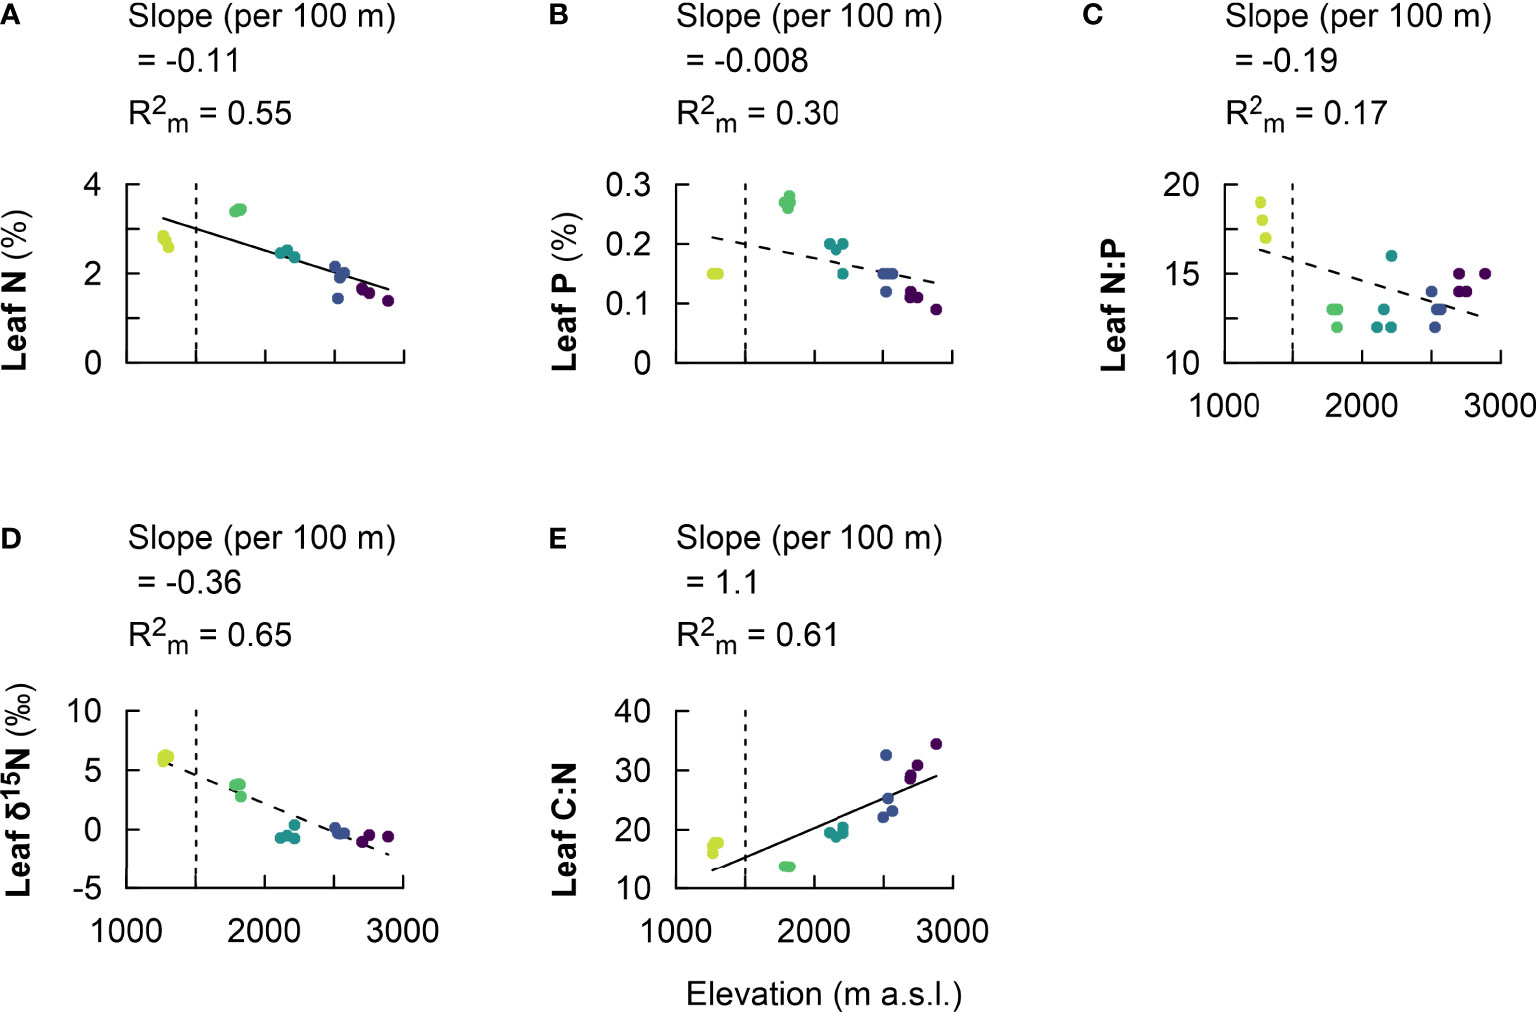
Figure 3 Fixed effect estimates of elevation (per 100-m elevation increase) for response parameters: leaf N (A), leaf P (B), leaf N:P (C), leaf δ15N (D), and leaf C:N (E). The slope of the linear mixed effect model estimates per 100 m of elevation increase is indicated (black solid line for a significant effect and black dashed line for no significant effect), as well as the marginal R2 , representing the fraction of the response variable explained by elevation. Plots from montane forest clusters (from 1,750 to 3,000 m a.s.l.) were compared with a nearby premontane forest (separated by vertical dashed line) at an elevation of 1,250–1,300 m a.s.l. .
After about 2 years of in situ soil warming, SOC, δ13C, total N, δ15N, bio-available P, and pH were assessed in both control and warmed soil. At each elevation cluster no significant difference in the measured soil chemical properties was detected, except for soil pH at 2,500–2,600 m (SI Table 2). However, along the entire elevational gradient, the linear mixed effect model regression generally revealed a trend that warmed soil tended to have relatively lower SOC, total N, and resin P (except at 2,700–3,000 m, where it was the reverse) (Table 3, Figures 4A, C, E, respectively). In addition, warmed soil showed relatively higher enrichment in both soil δ13C and δ15N relative to control (Table 3, Figures 4B, D, respectively). Similarly, soil pH was relatively higher in warmed soil as compared with control (Figure 4F, Table 3).
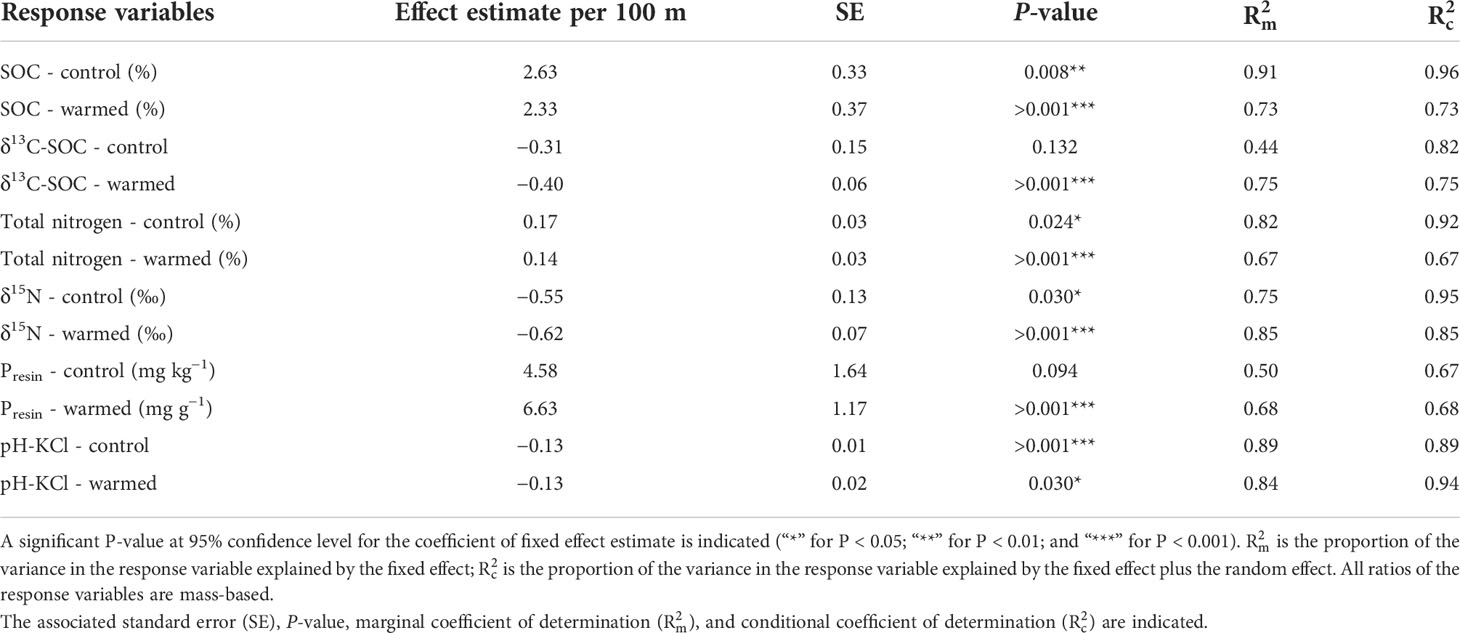
Table 3 Fixed effect estimates of elevation (per 100 m) following in situ soil warming for response variables: organic carbon (SOC), δ13C-SOC, soil total nitrogen (STN), δ15N, bio-available P (Presin), and pH.
The increase of SOC and total N with elevation reported in our study is consistent with findings from other elevational gradients in montane forests (15–17, 23). SOC accumulation along elevational gradient occurs due to the slower decomposer activities under colder conditions at higher elevations as compared with lower elevations (24, 25), resulting in C and N buildup in organic matter (26). In addition, C buildup with increasing elevation is partly attributed to increasing C:N of organic matter, indicating presence of more N depleted substrate with increasing elevation, possibly giving declined mineralization rates (27, 28). Furthermore, the observed decrease in soil pH along the elevational gradient favors organic C accumulation (29, 30). Although the increasing trend in SOC and soil total N content with elevation corroborates findings from a number of elevational transect studies (15–17, 31), other authors have found no relation between SOC and elevation (32, 33). The variations suggest significant influence of local environment in terms of climate, soil properties, and vegetation composition on C and N cycling. Mineral N showed no variation along the transect, despite the increasing trend in total N, indicating accumulation of organic N in mature forest ecosystem (14). Some mature forest ecosystems exhibit a closed N cycle, as such only a minimal portion of the accumulated total N (less than 1%) is released annually (14).
In support of more conservative nutrient cycling in montane forests, soil δ15N revealed a negative relationship with elevation, suggesting a more open N cycle (i.e., relatively more N losses) at lower elevations as compared with higher elevations. Several studies have indicated soil δ15N as proxy for N availability, where higher δ15N values indicate higher relative rates of gross mineralization, nitrification, denitrification, and leaching (34, 35). Ecosystems with more conservative N cycling show less N losses (e.g., and gaseous N) that are depleted in 15N (34, 36). Hence, upon an acceleration of the N cycle, soil δ15N increases because 15N-depleted N species are lost from the ecosystem (37). In agreement with this study, several authors reported decreasing δ15N values with increasing elevation and decreasing mean annual temperature (26, 34, 38, 39). Generally, lower elevation sites are characterized by low C:N ratio and high δ15N values. To the contrary, higher elevation sites are characterized by higher C:N ratio and low δ15N. These results indicates that colder higher elevation sites have developed a more closed, conservative N cycle in comparison to lower elevation sites (35).
Our observation of increasing bio-available P with elevation corroborates results reported by Tan and Wang (32). Low bio-available P at low elevation is likely due to depletion of primary minerals due to acidification (40). This is likely coupled with elevated fixation of P by aluminum and iron, which are common in highly weathered soils (41, 42). At the premontane forest, the lowest bio-available P was detected likely due to P fixation by aluminum complexation (which peaks at pH of 5.5). As pH drops below 5.5 along the elevational gradient, soil bio-available P increases as pH decrease was not sufficient to cause second high fixation from iron complexation (which peaks at pH 3.5) (43).
Our result revealed that both leaf N and P decrease with elevation despite the observed increase in soil-bio-available P and similar mineral N status along the transect. The decrease in leaf N and P status can be explained by increasing stress conditions such as declining soil pH and temperature along the elevational gradient. Low temperature has been shown to cause remarkable decrease in soil nutrient uptake by plants (44). Similarly, nutrient contents in plants decrease with decreasing soil pH (45, 46). Further, the contradictory trend in leaf N and P with soil N and P along elevation is likely associated to change in plant species from a more acquisitive to a more conservative species (47). In addition, the leaf N:P had no trend along the elevational gradient but revealed a significant decline when comparing premontane forest with montane forest (SI Table 1). For these two groups, the leaf N:P ratio suggests that plants incorporated more P than N in montane forest compared with premontane forest, hence indicating lower P relative to N availability in premontane forest as compared with montane forest. The lack of significant linear trend in leaf N:P along the elevational gradient is consistent with some elevational transect studies (48, 49). Further, leaf C:N decreased along the elevational gradient in a similar trend with soil C:N. This indicates that leaf litter is driving C:N in the topsoil. As such, leaf nutrient composition influences soil nutrient composition (50, 51). Similarly, leaf δ15N tended to decrease with elevation in a similar trend with soil δ15N. Leaf δ15N clearly reflected the isotopic signature of the source pools of N, indicating that plants draw N from a pool with δ15N signature similar to the bulk isotopic signature in the soil (52).
Comparisons of control and warmed treatment (2 years, ca. 0.9°C–2.8°C) for each elevation cluster revealed no significant differences, although warmed soil tended to have lower SOC and nutrient contents. The lack of significant difference may be due to the short warming period of the experiment. In addition, high spatial variability in samples (due to variation in slopes and aspects) often precludes powerful statistical tests for small treatment effects (53), as is usually the case in warming experiments. Further, warming may result in a trade-off effects on soil organic C and nutrient contents. For instance increased mineralization rates upon warming are expected to reduce organic C and increase soil mineral N and P contents. Similarly, higher input and turnover of more nutrient-rich litter at lower elevations (47) are expected to increase organic C, N, and P contents. However, increased mineralization rate of organic materials is associated with increased losses of organic C, N, and P (54). In addition, higher nutrient uptake by the more acquisitive plants at lower elevations (where warmed soil mesocosms were translocated) is expected to reduce soil nutrient contents. As such, the trade-off effects of these processes likely dampened the net effect of warming on C, N, and P biogeochemistry. However, the fix effect estimates seem to indicate a trend of relative changes along the elevational gradient upon warming (Table 3). In situ warming led to a relatively higher organic matter transformation in warmed as compared with control soil (Figure 4B). The apparent increase in C and N transformation processes upon warming indeed led to relative depletion of SOC and total N in warmed soil as compared with control (24, 25). This was corroborated by higher δ13C and δ15N values in warmed relative to control soil (Figures 4B, D, respectively). Higher transformation processes of C and N are associated with stronger isotopic fractionation (38), as a result of discrimination against 13C an 15N (55, 56).
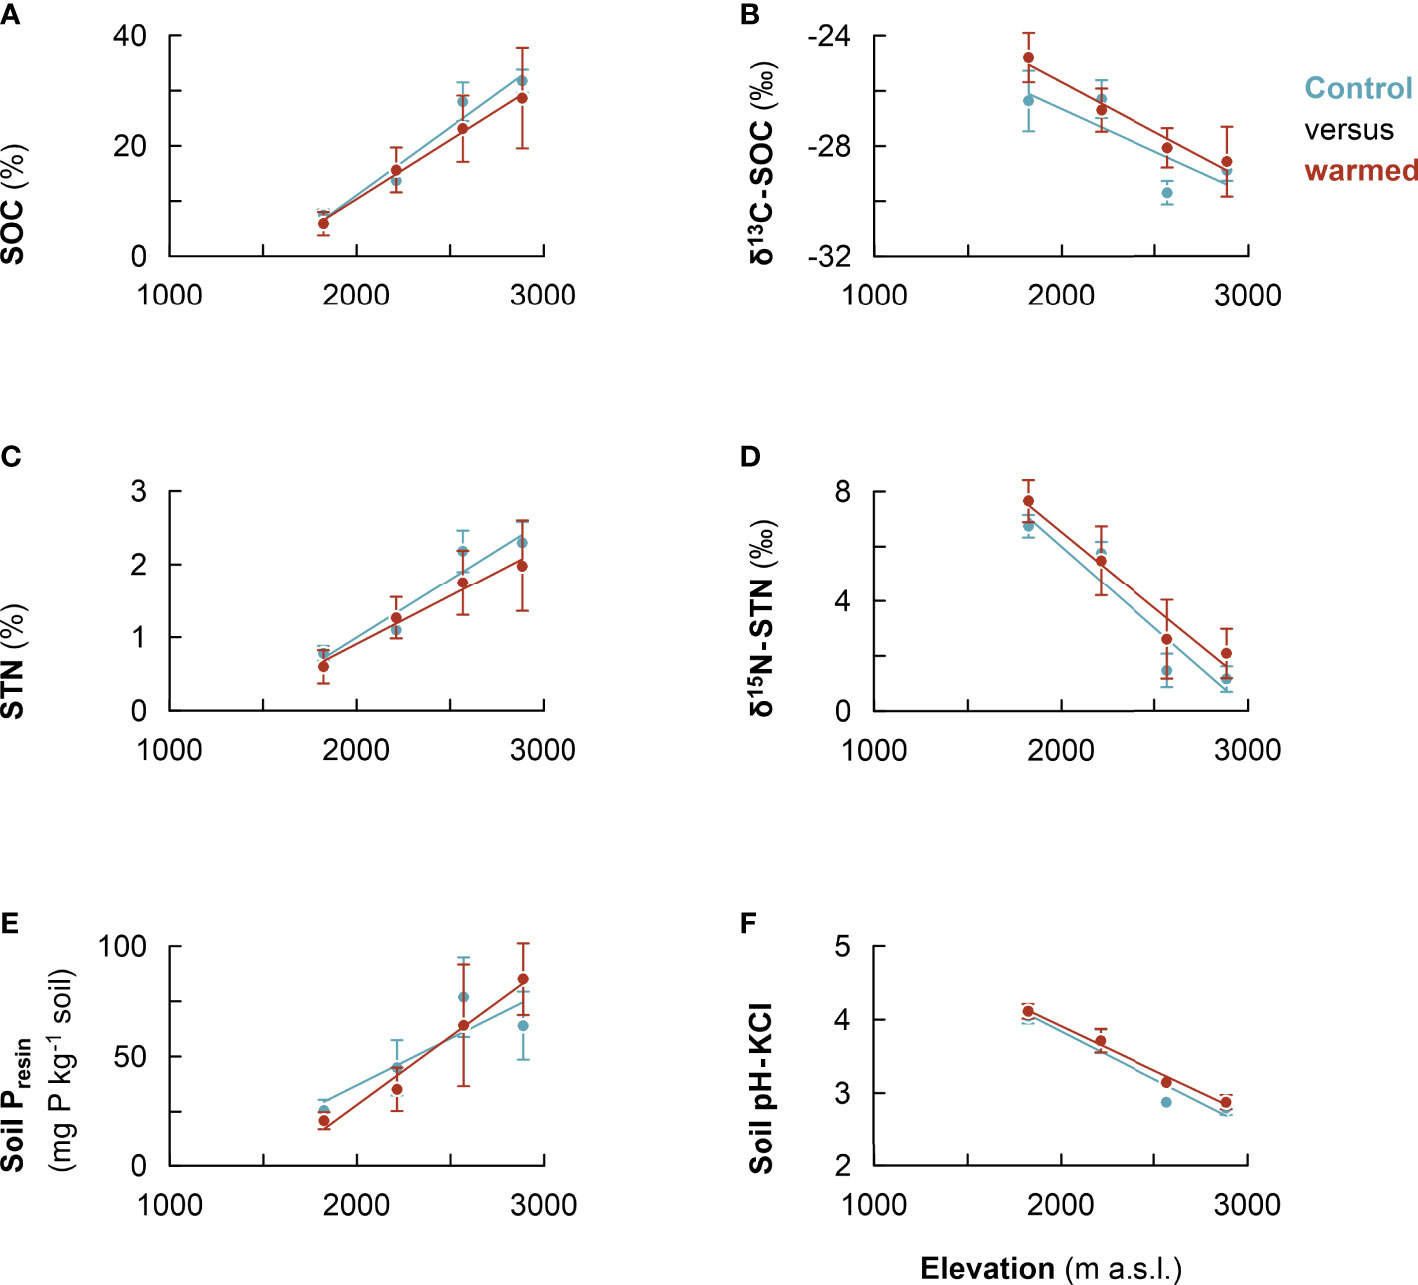
Figure 4 Warming response of soil chemical properties along the Rwenzori elevational gradient; soil organic carbon (SOC) (A), soil δ13C (B), soil total nitrogen (STN) (C), soil δ15N (D), soil resin P (E), and soil pH-KCl (F). Warmed soil (red line) and control (blue line). Mean values were calculated from composite soil samples per elevation cluster (n = 4). The error bars indicate the standard deviation from the mean.
Further, for the soil resin P, warming seems to lead to a mixed effect. In the lower elevations, the increased transformation processes resulted in relative depletion of P in warmed as compared with control. However, in the higher elevations, warming led to relative increase in P in warmed soil as compared with control. The increase in soil available P may be a result of the increased mineralization of organic materials upon warming in higher altitudes. The apparent increase in soil P status upon warming, however, seems to disappear quickly in the warmer elevations as compared with colder elevations. This is likely due to the depletion of accrued organic matter at higher temperatures (14), higher P fixation as usually the case in highly weathered tropical soils, and higher P uptake by more acquisitive plants species at lower elevations. This result indicates that (albeit more experimental data are needed from more locations) warming seems to exacerbate soil P limitation in the lower premontane forests while even further boosting the soil P status in the higher elevations. This is consistent with the observed increasing P levels with elevation (Figure 2D).
Finally, we acknowledge that gross mineralization rate measurement based on 15N dilution method would have been a good additional measurement to give more information on the effect of in situ warming on soil organic matter transformation. However, we did not do this because of logistics as in situ labeling is difficult to organize in these fields.
This study assessed the following: (i) the contents of C, N, and P in soil and leaf along an Afromontane elevational gradient; and (ii) the effects of soil warming on soil chemical properties along the same elevational gradient. The baseline elevational status of C, N, and P in soil and leaf documented in this study is vital for future monitoring of the effect of climate change on biogeochemical cycles of C, N, and P and evolution of soil pH in a century of rapid warming. The results showed evidence of a more closed C and N cycling with increasing elevation. In addition, the results indicated a switch to a more open C and N cycling upon warming. Generally, the results imply that warming leads to accelerated transformation processes of accrued organic materials, leading to increased C and N losses. Similarly, the increase in mineralization of organic materials upon warming appears to exacerbate P limitation in premontane forest but enhances P availability at high elevations of montane forests. The observed effect of short-term warming was likely dampened by the trade-off effects of increased microbial transformation of organic matter upon warming, coupled with the higher input of more nutrient-rich litter at lower elevations versus increased C and nutrient losses and high nutrient uptake at lower elevations.
The original contributions presented in the study are included in the article/Supplementary Material. Further inquiries can be directed to the corresponding author.
All the authors contributed in the conception of the research idea, design of the study, data collection and writing. All the authors have contributed equally to this work and share first authorship. All authors contributed to the article and approved the submitted version.
This work was funded by VLIR-UOS and Mountains of the Moon University under the partnership program of Inter-University Cooperation (IUC), grant number UG2019IUC027A103.
The authors thank Uganda Wildlife Authority for granting permission to conduct this study in two protected National Parks under permit number UWA/COD/96/05. We also thank staff of the Uganda Wildlife Authority at Rwenzori Mountains and Kibale Forest National Parks for their support. Further, we are grateful to the Research Assistant, Mr. Martin Tuisenge, for his tireless efforts and endurance during the demanding field campaigns in the tremendously physically challenging Rwenzori Mountains.
The authors declare that the research was conducted in the absence of any commercial or financial relationships that could be construed as a potential conflict of interest.
All claims expressed in this article are solely those of the authors and do not necessarily represent those of their affiliated organizations, or those of the publisher, the editors and the reviewers. Any product that may be evaluated in this article, or claim that may be made by its manufacturer, is not guaranteed or endorsed by the publisher.
The Supplementary Material for this article can be found online at: https://www.frontiersin.org/articles/10.3389/fsoil.2022.905010/full#supplementary-material
1. Bonan GB. Forests and climate change: forcings, feedbacks, and the climate benefits of forests. science. (2008) 320(5882):1444–9. doi: 10.1126/science.1155121
2. Houghton RA. Tropical deforestation as a source of greenhouse gas emissions. tropical deforestation and climate change ed Mutinho, Schwartzman, (Belem: IPAM) (2005). Vol. 13.
3. Fine PV, Ree RH, Burnham RJ. The disparity in tree species richness among tropical, temperate and boreal biomes: the geographic area and age hypothesis. Trop For Community Ecol (ed. by Carson RP, Schnitzer SA), (2009) 31–45. Blackwell, Oxford.
4. Laughlin DC, Abella SR. Abiotic and biotic factors explain independent gradients of plant community composition in ponderosa pine forests. Ecol Model. (2007) 205(1-2):231–40. doi: 10.1016/j.ecolmodel.2007.02.018
5. Singh S, Pandey C, Sidhu G, Sarkar D, Sagar R. Concentration and stock of carbon in the soils affected by land uses and climates in the western himalaya, India. Catena. (2011) 87(1):78–89. doi: 10.1016/j.catena.2011.05.008
6. Zeng Z, Wang D, Yang L, Wu J, Ziegler AD, Liu M, et al. Deforestation-induced warming over tropical mountain regions regulated by elevation. Nat Geosci. (2021) 14(1):23–9. doi: 10.1038/s41561-020-00666-0
7. Gutlein A, Gerschlauer F, Kikoti I, Kiese R. Impacts of climate and land use on N2 O and CH4 fluxes from tropical ecosystems in the mt. Kilimanjaro region, Tanzania. Glob. Chang. Biol (2018) 24(3):1239–55. doi: 10.1111/gcb.13944
8. Urrutia R, Vuille M. Climate change projections for the tropical Andes using a regional climate model: Temperature and precipitation simulations for the end of the 21st century. J Geophys Res (2009) 114:D02108. doi: 10.1029/2008JD011021
9. Kutsch WL, Bahn M, Heinemeyer A. Soil carbon dynamics: an integrated methodology. Cambridge University Press, Cambridge, UK, New York (2009) 286.
10. Schaufler G, Kitzler B, Schindlbacher A, Skiba U, Sutton M, Zechmeister-Boltenstern S. Greenhouse gas emissions from European soils under different land use: effects of soil moisture and temperature. Eur J Soil Sci. (2010) 61(5):683–96. doi: 10.1111/j.1365-2389.2010.01277.x
11. Kim DH, Sexton JO, Townshend JR. Accelerated deforestation in the humid tropics from the 1990s to the 2000s. Geophys. Res Let. (2015) 42(9):3495–501. doi: 10.1002/2014GL062777
12. Parry M, Parry ML, Canziani O, Palutikof J, van der Linden PJ, Hanson CE. (Eds.), Climate change 2007: Impacts, adaptation and vulnerability: Working group II contribution to the fourth assessment report of the Intergovernmental Panel on Climate Change. Cambridge University Press (2007) 976 pp.
13. Rustad L, Campbell J, Marion G, Norby R, Mitchell M, Hartley A, et al. A meta-analysis of the response of soil respiration, net nitrogen mineralization, and aboveground plant growth to experimental ecosystem warming. Oecologia. (2001) 126(4):543–62. doi: 10.1007/s004420000544
14. Brödlin D, Kaiser K, Hagedorn F. Divergent patterns of carbon, nitrogen, and phosphorus mobilization in forest soils. Front Forest. Global Chang. (2019) 2:66. doi: 10.3389/ffgc.2019.00066
15. Dieleman WI, Venter M, Ramachandra A, Krockenberger AK, Bird MI. Soil carbon stocks vary predictably with altitude in tropical forests: Implications for soil carbon storage. Geoderma. (2013) 204:59–67. doi: 10.1016/j.geoderma.2013.04.005
16. Malhi Y, Girardin CA, Goldsmith GR, Doughty CE, Salinas N, Metcalfe DB, et al. The variation of productivity and its allocation along a tropical elevation gradient: a whole carbon budget perspective. New Phytol. (2017) 214(3):1019–32. doi: 10.1111/nph.14189
17. Tashi S, Singh B, Keitel C, Adams M. Soil carbon and nitrogen stocks in forests along an altitudinal gradient in the eastern Himalayas and a meta-analysis of global data. Glob. Chang. Biol (2016) 22(6):2255–68. doi: 10.1111/gcb.13234
18. Malhi Y, Silman M, Salinas N, Bush M, Meir P, Saatchi S. Introduction: Elevation gradients in the tropics: laboratories for ecosystem ecology and global change research. Global Change Biol (2010) 16(12):3171–5. doi: 10.1111/j.1365-2486.2010.02323.x
19. Nuernberg N, Leal J, Sumner M. Evaluation of an anion-exchange membrane for extracting plant available phosphorus in soils. Commun Soil Sci Plant Anal. (1998) 29(3-4):467–79. doi: 10.1080/00103629809369959
21. Asner GP, Martin RE, Anderson CB, Kryston K, Vaughn N, Knapp DE, et al. Scale dependence of canopy trait distributions along a tropical forest elevation gradient. New Phytol. (2017) 214(3):973–88. doi: 10.1111/nph.14068
22. Nakagawa S, Schielzeth H. A general and simple method for obtaining R2 from generalized linear mixed-effects models. Methods Ecol Evolut. (2013) 4(2):133–42. doi: 10.1111/j.2041-210x.2012.00261.x
23. Jones JA. Environmental influences on soil chemistry in central semiarid Tanzania. Soil Sci Soc America J (1989) 53(6):1748–58. doi: 10.2136/sssaj1989.03615995005300060024x
24. Finzi AC, Moore DJ, DeLucia EH, Lichter J, Hofmockel KS, Jackson RB, et al. Progressive nitrogen limitation of ecosystem processes under elevated CO2 in a warm-temperate forest. Ecology. (2006) 87(1):15–25. doi: 10.1890/04-1748
25. Luo Y, Field CB, Jackson RB. Does nitrogen constrain carbon cycling, or does carbon input stimulate nitrogen cycling? Ecology (2006) 87(1):3–4. doi: 10.1890/05-0923
26. Spehn EM, Rudmann-Maurer K, Korner C, Maselli D. Mountain biodiversity and global change. (2012). GMBA-DIVERSITAS, Basel.
27. Janssen B. Nitrogen mineralization in relation to C:N ratio and decomposability of organic materials. In: Van Cleemput O, Hofman G, Vermoesen A. (eds) Progress in Nitrogen Cycling Studies. Developments in Plant and Soil Sciences (1996), vol 68. Springer, Dordrecht. doi: 10.1007/978-94-011-5450-5_13
28. Parfitt R, Salt G. Carbon and nitrogen mineralisation in sand, silt, and clay fractions of soils under maize and pasture. Soil Res (2001) 39(2):361–71. doi: 10.1071/SR00028
29. Bauters M, Verbeeck H, Doetterl S, Ampoorter E, Baert G, Vermeir P, et al. Functional composition of tree communities changed topsoil properties in an old experimental tropical plantation. Ecosystems. (2017) 20(5):861–71. doi: 10.1007/s10021-016-0081-0
30. Lützow MV, Kögel-Knabner I, Ekschmitt K, Matzner E, Guggenberger G, Marschner B, et al. Stabilization of organic matter in temperate soils: mechanisms and their relevance under different soil conditions–a review. Eur J Soil Sci. (2006) 57(4):426–45. doi: 10.1111/j.1365-2389.2006.00809.x
31. Moser G, Leuschner C, Röderstein M, Graefe S, Soethe N, Hertel D. Biomass and productivity of fine and coarse roots in five tropical mountain forests stands along an altitudinal transect in southern Ecuador. Plant Ecol Divers. (2010) 3(2):151–64. doi: 10.1080/17550874.2010.517788
32. Tan Q, Wang G. Decoupling of nutrient element cycles in soil and plants across an altitude gradient. Sci Rep (2016) 6(1):1–9. doi: 10.1038/srep34875
33. Tewksbury C, Van Miegroet H. Soil organic carbon dynamics along a climatic gradient in a southern Appalachian spruce–fir forest. Can J For Res (2007) 37(7):1161–72. doi: 10.1139/X06-317
34. Boeckx P, Paulino L, Oyarzún C, van Cleemput O, Godoy R. Soil δ15N patterns in old-growth forests of southern Chile as integrator for n-cycling. Isotop. Environ Health Stud (2005) 41(3):249–59. doi: 10.1080/10256010500230171
35. Craine JM, Elmore AJ, Wang L, Augusto L, Baisden WT, Brookshire EJ, et al. Convergence of soil nitrogen isotopes across global climate gradients. Sci Rep (2015) 5(1):1–8. doi: 10.1038/srep08280
36. Nadelhoffer K, Shaver G, Fry B, Giblin A, Johnson L, McKane R. 15 n natural abundances and n use by tundra plants. Oecologia. (1996) 107(3):386–94. doi: 10.1007/BF00328456
37. Templer PH, Arthur MA, Lovett GM, Weathers KC. Plant and soil natural abundance δ 15 n: indicators of relative rates of nitrogen cycling in temperate forest ecosystems. Oecologia. (2007) 153(2):399–406. doi: 10.1007/s00442-007-0746-7
38. Amundson R, Austin AT, Schuur EA, Yoo K, Matzek V, Kendall C, et al. Global patterns of the isotopic composition of soil and plant nitrogen. Global Biogeochem Cycle (2003) 17(1):1031. doi: 10.1029/2002GB001903
39. Bauters M, Verbeeck H, Demol M, Bruneel S, Taveirne C, Van der Heyden D, et al. Parallel functional and stoichiometric trait shifts in south American and African forest communities with elevation. Biogeosciences. (2017) 14(23):5313–21. doi: 10.5194/bg-14-5313-2017
40. Vitousek PM, Porder S, Houlton BZ, Chadwick OA. Terrestrial phosphorus limitation: mechanisms, implications, and nitrogen–phosphorus interactions. Ecol App. (2010) 20(1):5–15. doi: 10.1890/08-0127.1
41. Crews TE, Kitayama K, Fownes JH, Riley RH, Herbert DA, Mueller-Dombois D, et al. Changes in soil phosphorus fractions and ecosystem dynamics across a long chronosequence in Hawaii. Ecology. (1995) 76(5):1407–24. doi: 10.2307/1938144
42. Grubb P. Control of forest growth and distribution on wet tropical mountains: with special reference to mineral nutrition. Annu Rev Ecol Syst. (1977) 8(1):83–107. doi: 10.1146/annurev.es.08.110177.000503
43. Saeki H, Okamoto M. Phosphate fixation by bentonite. Soil Sci Plant Nutr (1956) 2(1):164–70. doi: 10.1080/00380768.1956.10431877
44. Yan Q, Duan Z, Mao J, Li X, Dong F. Effects of root-zone temperature and n, p, and K supplies on nutrient uptake of cucumber (Cucumis sativus l.) seedlings in hydroponics. Soil Sci Plant Nutr (2012) 58(6):707–17. doi: 10.1080/00380768.2012.733925
45. Tichá I. Wilkinson RE (ed.): Plant-environment interactions (books in soils, plants, and the environment). (1995) Biol Plant 37:612. doi: 10.1007/BF02908846
46. Alam SM, Naqvi SSM, Ansari R. Impact of soil pH on nutrient uptake by crop plants Pessaraldi M (Ed.), Handbook of Plant and Crop Stress, Marcel Dekker, New York, NY (1999) 51–60.
47. Okello J, Bauters M, Verbeeck H, Kasenene J, Boeckx P. Aboveground carbon stocks, woody and litter productivity along an elevational gradient in the rwenzori mountains, Uganda. Biotropica (2022) 54(4):906–20. doi: 10.1111/btp.13114
48. Moser G, Hertel D, Leuschner C. Altitudinal change in LAI and stand leaf biomass in tropical montane forests: a transect study in Ecuador and a pan-tropical meta-analysis. Ecosystems. (2007) 10(6):924–35. doi: 10.1007/s10021-007-9063-6
49. van de Weg MJ, Meir P, Grace J, Atkin OK. Altitudinal variation in leaf mass per unit area, leaf tissue density and foliar nitrogen and phosphorus content along an Amazon-Andes gradient in Peru. Plant Ecol Divers. (2009) 2(3):243–54. doi: 10.1080/17550870903518045
50. Kara Ö, Bolat İ, Çakıroğlu K, Öztürk M. Plant canopy effects on litter accumulation and soil microbial biomass in two temperate forests. Biol Fertil. Soil. (2008) 45(2):193–8. doi: 10.1007/s00374-008-0327-x
51. Prescott CE. The influence of the forest canopy on nutrient cycling. Tree Physiol (2002) 22(15-16):1193–200. doi: 10.1093/treephys/22.15-16.1193
52. Averill C, Finzi A. Increasing plant use of organic nitrogen with elevation is reflected in nitrogen uptake rates and ecosystem δ15N. Ecology. (2011) 92(4):883–91. doi: 10.1890/10-0746.1
53. Davidson EA, Janssens IA. Temperature sensitivity of soil carbon decomposition and feedbacks to climate change. Nature. (2006) 440(7081):165–73. doi: 10.1038/nature04514
54. Nottingham AT, Whitaker J, Ostle NJ, Bardgett RD, McNamara NP, Fierer N, et al. Microbial responses to warming enhance soil carbon loss following translocation across a tropical forest elevation gradient. Ecol Let. (2019) 22(11):1889–99. doi: 10.1111/ele.13379
55. Andrews JA, Matamala R, Westover KM, Schlesinger WH. Temperature effects on the diversity of soil heterotrophs and the δ13C of soil-respired CO2. Soil Biol Biochem (2000) 32(5):699–706. doi: 10.1016/S0038-0717(99)00206-0
Keywords: carbon, nitrogen and phosphorus, biogeochemical cycles, Afromontane forests, elevational gradient, climate warming, Uganda
Citation: Okello J, Bauters M, Verbeeck H, Kasenene J and Boeckx P (2022) Response of Afromontane soil organic carbon, nitrogen, and phosphorus to in situ experimental warming along an elevational gradient. Front. Soil Sci. 2:905010. doi: 10.3389/fsoil.2022.905010
Received: 26 March 2022; Accepted: 19 July 2022;
Published: 10 August 2022.
Edited by:
Qiao Xu, Yangzhou University, ChinaReviewed by:
Mianhai Zheng, South China Botanical Garden (CAS), ChinaCopyright © 2022 Okello, Bauters, Verbeeck, Kasenene and Boeckx. This is an open-access article distributed under the terms of the Creative Commons Attribution License (CC BY). The use, distribution or reproduction in other forums is permitted, provided the original author(s) and the copyright owner(s) are credited and that the original publication in this journal is cited, in accordance with accepted academic practice. No use, distribution or reproduction is permitted which does not comply with these terms.
*Correspondence: Joseph Okello, Sm9zZXBoLk9rZWxsb0BVR2VudC5iZQ==
Disclaimer: All claims expressed in this article are solely those of the authors and do not necessarily represent those of their affiliated organizations, or those of the publisher, the editors and the reviewers. Any product that may be evaluated in this article or claim that may be made by its manufacturer is not guaranteed or endorsed by the publisher.
Research integrity at Frontiers
Learn more about the work of our research integrity team to safeguard the quality of each article we publish.