 Jenny Farmer
 Charlie Langan
 Jo U. Smith
- 1School of Biological Sciences, University of Aberdeen, Aberdeen, United Kingdom
- 2ALTER Research, Carbon Foundation of East Africa, Kampala, Uganda
Our study measured heterotrophic carbon dioxide (CO2) emissions in a drained peatland under potato cultivation in south-western Uganda. Soil carbon losses have not previously been reported for this land use, and our study set out to capture the range and temporal variation in emissions, as well as investigate relationships with key environmental variables. Soil chamber-based emission measurements were taken over five days at four points in time over the year to capture daily and monthly variability, including day and night sampling to capture any diurnal variations in temperatures and soil flux. Differences in soil microtopography from mounding of soils for potato beds and drainage trenches had a significant effect on the rate of soil flux. Diurnal sampling showed no significant difference in emissions or soil temperatures in the raised potato beds between day and night. More significant effects on soil flux from environmental drivers, such as water table depth, were observed between months, rather than hours and days. There were significant differences in the relationships between environmental variables and soil flux, depending on if soils had been recently disturbed or not. Area-weighted emissions based on microtopography gave a mean annual emissions factor of 98.79 ± 1.7 t CO2 ha-1 y-1 (± standard error) from this peatland use.
1 Introduction
Globally, peatlands cover approximately 420 million ha, equivalent to 2.8% of the world land area (1). Of this area, approximately 44-170 million ha are found in the tropics (2–4), with an estimated tropical peatland carbon (C) pool of 81.7-91.9 Gt C (4). The C rich soils in peatlands are formed from long-term accumulation of dead plant material, preserved under anaerobic conditions due to high water table levels. Land use change in peatlands results in significant C losses to the atmosphere, principally due to drainage leading to microbial decomposition of the soil C, aquatic export of dissolved and particulate organic C, and methane emissions from drainage channels (5). Of the total area of tropical peatlands, it is estimated that approximately 24.2 Mha are degraded, with a loss of 1.48 Gt CO2 per year (3).
While the Congo Basin in central Africa has the most extensive peatland complex on the continent [and the most extensive in the tropics (6)], neighbouring Uganda is the largest contributor to emissions from degrading peat in Africa, where at least 0.5 Mha of Uganda’s estimated 1.3 Mha of peatland has been degraded, resulting in CO2 emissions of up to 20 Mt yr-1 (7). However, there is limited research into the use of peat soils in Uganda, and the impacts of peatland degradation on soil C and greenhouse gas (GHG) dynamics (8).
Across Uganda wetland types vary, and can be found fringing lakes, in lowland plains and in valley bottoms. Vegetation found in these wetlands are diverse and include grassland, Cyperus papyrus, woodlands, and palms, with plants either anchored into the soil or floating on the water’s surface (9, 10). These wetland areas are where Uganda’s peat soils are found. While the extent of peat soils across the country is still to be fully documented, they are often found underpinning papyrus-dominated wetland areas, in particular in the SW of the country (11). The valley bottom wetlands of the Kigezi highlands close to the border with Rwanda have some of the deepest reported peat deposits of all of Uganda (11), but the most widespread wetland drainage and land use change occurs here as well (12). Wetland conversion is largely due to agricultural drivers, with cultivation of potatoes on these peat soils estimated to provide income of US$ 3,000 ± 1,000 ha-1 yr-1 to smallholder farmers (12).
While the key environmental drivers affecting GHG emissions from soils have been documented in many studies and indicate strong relationships between temperature, water table depth (WTD) and soil respiration flux (13–18), there is limited understanding of these relationships for the diversity of conditions found across tropical peatlands. It is important to highlight the need to differentiate the CO2 emissions from heterotrophic respiration during microbial decomposition of soil organic matter (Rh) and the emissions from roots and autotrophs which is not a result of soil carbon loss (19), The majority of tropical peatland emissions research has been conducted in SE Asia (20, 21), and to a lesser extent in the Amazon basin (22, 23), but there are considerable gaps when it comes to understanding the range and biogeochemistry of C losses experienced by these drained peatlands under the diversity of land use changes and wetland conditions occurring in Sub-Saharan Africa. At an ecosystem level the work of Saunders et al. (8) identified reductions in ecosystem C due to agricultural conversion in wetlands in Uganda based on measurements of photosynthetic CO2 assimilation, but how much soils contribute to overall carbon loss from these systems is unknown.
For these reasons, this study set out to understand the biogeochemistry and rates of C losses from peat soils under land use change, through measurement of heterotrophic CO2 fluxes from a potato cultivated peatland in a deep peat wetland system in SW Uganda. The key objectives of this were to quantify the potential range of soil CO2 fluxes associated with this land use change on this soil, identify if there is temporal variability in these CO2 fluxes, and identify any relationships between soil CO2 fluxes and key environmental variables.
2 Methods
This study was implemented in the catchment of the Ruhuma wetland system in Muko Sub-county, Kabale District, in the Kigezi Highlands of south western Uganda (-1.208752° latitude, 29.830968° longitude, approximately 1,900 m above sea level). The landscape comprises of steep mineral soil hillsides which slope into a minerotrophic wetland valley bottom. The entire landscape is a mosaic of small, privately cultivated plots, with those in the wetland managed under farmer cooperatives, and individual plots distributed between farmers, most of whom manage multiple plots.
The Ruhuma wetland system is part of a network of peat dominated, valley bottom wetlands in the area, located 35 km SW of Kabale town, where the river Ruhuma flows north out of Lake Bunyonyi. The wetland covers approximately 5.47 km2, at an altitude of 1,930 m above sea level. Wetland edge cultivation began in the 1980s and by the late 1990s the majority of the wetland was drained and converted for cultivation (personal communication). Peat depths in this wetland are significant, with measurements in the site indicating depths of over 10 m (personal data), and other studies measuring peat depths of over 20 m in neighbouring wetlands (11). The sapric peat soils found in this wetland are highly organic, with average organic matter contents measured at 87.22 ± 3.9% [± SD, n=198 (24)] and bulk densities averaging 0.125 ± 0.04 g cm3 [± SD, n=835 (24)].
In order to determine the range and temporal variability in fluxes from peat soils under potato cultivation we measured CO2 emissions at daily, weekly and monthly timesteps. To capture the weekly and monthly variability, we conducted four sets of repeated 5-day morning (between 9.00 and 11.00) and afternoon (between 15.00 and 17.00) measurements on thirty randomly located paired collars (15 on raised beds and 15 on adjacent trenches) within a potato field. In addition to this, on the 4th day of each sampling period we added sampling at 18.00, 21.00 and 24.00, and 5.00 and 12.00 the following day, with the intention of capturing diurnal variability in temperatures and emissions. In order to determine the relationships between soil CO2 fluxes and key environmental variables, soil CO2 emissions, soil and air temperatures, WTD were all recorded in situ from each collar for every measurement. Measurements were all conducted from within the same farmer’s field in an area under management by the Rurigita Farmer’s Cooperative of the Ruhuma wetland.
When preparing the experimental design we were limited by the lack of available land use information, in particular around how the soils were used over the year. We targeted our sampling campaigns as best as possible towards capturing the potential difference in environmental and management conditions that the soils would experience over the year. Measurements were taken at the end of the rainy season in May 2014 when wetland soils were dug in preparation for planting of potatoes, in the dry season in August 2014 during the potato growing season, in the rainy season in November 2014 after the harvest at the start of the fallow period, and in February 2015 during the dry season and fallow period prior to the next season of planting. Farmers digging of the potato beds in May involved the clearing of fallow weeds into the old trenches between old, raised beds, and then piling the soil from the previous year’s beds into these trenches. Once the old bed had been transferred into the old trench, further digging down into fresher peat brought up previously unexposed soil which was piled on top of the new beds. After approximately 48 hours these new beds were planted with rows of potatoes. Potatoes grew for approximately 3.5 months, when they were harvested for market with the onset of the new rainy season in September. After harvesting, beds were left fallow until the following June, when the cycle of mining and mounding fresh peat to create new beds was repeated.
Collars made from PVC piping 10 cm in diameter and 5 cm in height were fully inserted into the soil. Care was taken to place collars away from any plants and they were checked on removal at the end of each sampling period to ensure no plant roots were present. These collars remained in situ for each 5-day set of samples and were then removed and randomly placed for the next month’s sampling. Soil CO2 emissions were sampled using a PP Systems EGM-4 with a SRC-1 Soil Respiration Chamber placed onto the collars. Chamber measurements were set to run for up to 120 seconds. The WTD was recorded using a tape-measure and pre-prepared dip-well near to each pair of collars, and soil and air temperature were recorded during each flux measurement using digital thermometers with a 0.1°C resolution.
All data analysis was conducted in R Studio v 1.4.1106 using R v 4.0.4. A linear function was applied to the concentrations of CO2 recorded for each measurement and data was then converted into flux based on the following equation:
where Rh was the rate of efflux (g m-2 hr-1), S was the slope of the concentration increase during the measurement (ppm s-1), P was the pressure in the chamber (mBar, recorded by the EGM), T was the soil temperature (°C), V was the chamber volume (0.001171 m3), and A was the collar area (0.0078 m2). The ratio accounts for the area occupied by one kg mol of CO2 at standard temperature and pressure. Division by 1,000 and multiplication by 3,600 converts kg to g and seconds to hours.
Mean results are presented with either standard deviation (SD) or standard error (SE), as noted in the results. T-tests and analysis of variance (ANOVA) were used to compare results, along with Tukey’s Honestly Significant Difference (HSD). Linear models were developed based on log transformed Rh. We explored a series of linear models for Rh and WTD, soil temperature and soil management (raised beds, trenches and recent disturbance). Regression models were further improved with the log transformation of the Rh.
3 Results
Over 1,300 soil flux measurements were taken as part of this study. We observed a significant difference in the rate of soil flux from the raised beds (referred to as raised beds, n=648), compared to the narrow drainage trenches between them (referred to as trenches, n=653, t-test, p<0.005, Table 1), and as such all results are split based on this micro-topographical difference. Across all samples, the mean heterotrophic respiration (Rh) emissions of CO2 from the raised beds was 1.39 ± 0.6 g m2 hr-1 (± SD) and from trenches was 0.22 ± 0.1 g m2 hr-1.
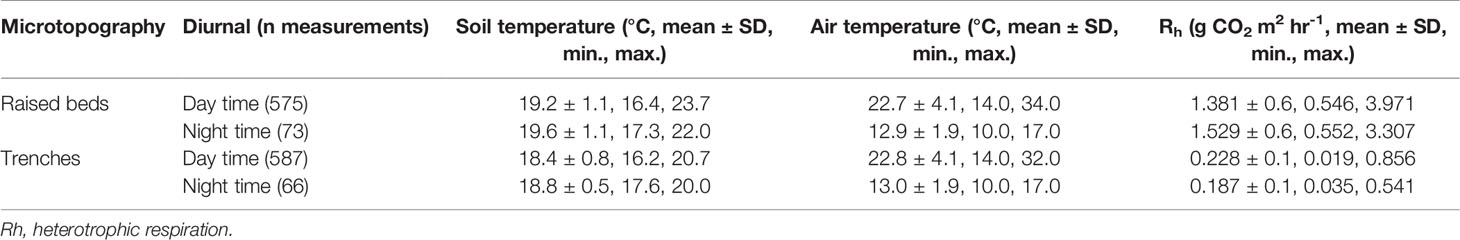
Table 1 Range in day time and night time results for soil and air temperatures and flux, from raised beds and trenches.
3.1 Range in Soil Respiration Fluxes and Environmental Variables
Across all measurements, the minimum air temperature recorded was 10 °C, and the maximum was 34 °C. Day time air temperatures (taken in day light hours; i.e. between 7.00 and 19.00) ranged between a minimum of 14 °C to a maximum of 34 °C, compared to night time measurements which were limited to 10-17 °C. Across all measurements the minimum soil temperature was 16.2 °C and the maximum 23.7 °C. Soil temperatures did not show such a change between day to night conditions, with almost identical mean temperatures reported for daytime and night-time results per micro-topographical class (Table 1). Mean Rh was higher in the night than in the day from the raised beds, whereas from the trenches it was lower. Measured WTDs varied between 21 cm and 81 cm below the soil surface of the raised beds, and between 2 cm above and 52 cm below the soil surface of the trenches.
3.2 Temporal Variability
3.2.1 Daily
Across the entire dataset, separated for raised beds and trenches, we found that there was no significant difference in the Rh measured from the raised beds between the sampling times of day (ANOVA, p=0.27, Figure 1). In the trenches a significant difference in Rh was found between morning and midnight measurements and the morning and measurements taken in the 15.00 to 17.00 time period (ANOVA, Tukey’s HSD, p<0.005). Soil temperature on the raised beds and in the trenches was significantly different between the measurements earlier in the day (the morning and early afternoon measurements from 5.00 – 14.00) compared with the higher later afternoon and night-time measurements (15.00 – 1.00), potentially due to a lag time from daytime sun (p<0.001).
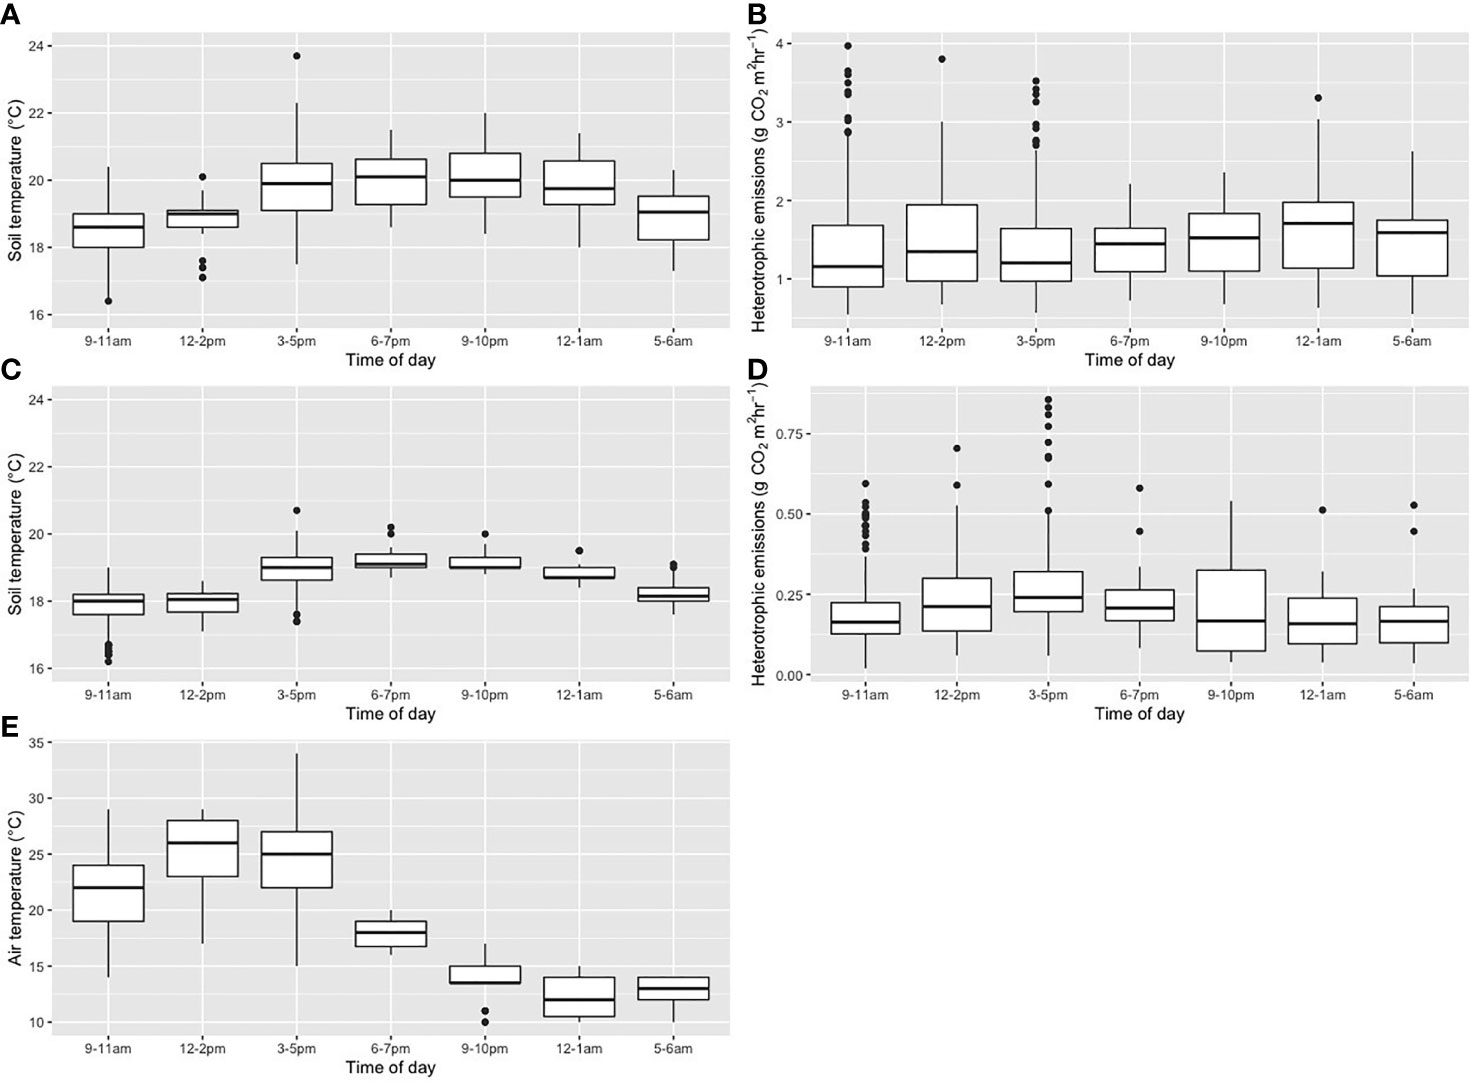
Figure 1 Plots of results for each time of day sampled, for (A) soil temperature and (B) heterotrophic respiration for raised beds, and (C) soil temperature and (D) heterotrophic respiration for trenches, and (E) air temperature for raised beds and trenches combined.
Air temperature showed a significant reduction in temperature over the night-time sampling points (p<0.001).
3.2.2 Day to Day
Using the regularly sampled morning and afternoon datasets, there was a significant difference between the means of some results when compared between the 5 days of sampling, with data grouped based on microtopography, month, and time of day that measurements were taken (ANOVA, with significance determined based on p value <0.05, using the regular morning and afternoon measurements, Table 2). Soil and air temperature were the most frequently different variables between days. The WTD only varied significantly between days in November and February. There were no significant differences in the day-to-day Rh measurements on raised beds, and only in the trenches in November and February, corresponding to the period of variation in the WTD.
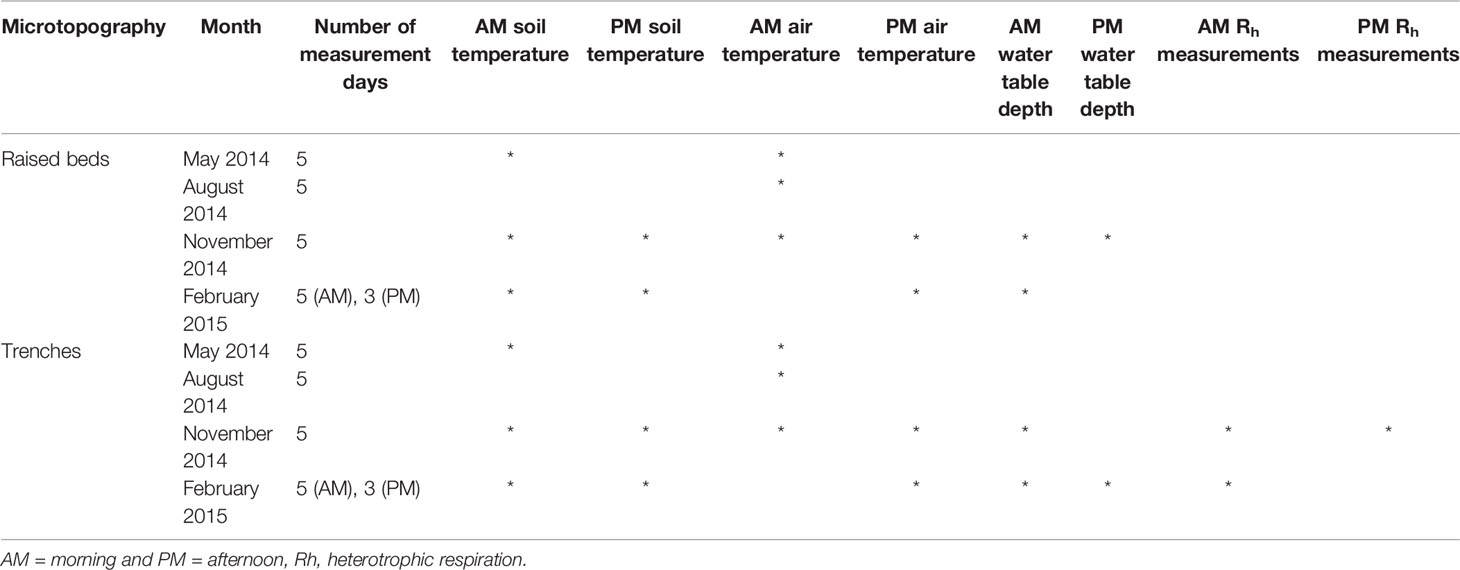
Table 2 Occasions when there was a significant difference (p<0.05) in flux results across the 5 day measurement period per month, split for raised beds and trenches, and split into morning and afternoon measurements.
3.2.3 Month to Month
Measured environmental variables and Rh varied significantly over the year between sampling occasions (p<0.05),; this allowed us to examine the difference between results from raised beds and the trenches using the regularly sampled morning and afternoon data (Tables 3, 4). Comparison between the four months found there were significant differences between most variables measured. In all months except November-May and November-August the WTD was significantly different between months in the raised beds, and across all months there was a significant difference between months in the WTD in the trenches. Soil temperatures were higher on the raised beds than trenches, and were significantly different between almost all months. Average daytime air temperature each month was between 20 and 25 °C, and varied significantly between almost all months. Heterotrophic respiration was higher from the raised beds than trenches and varied significantly between most months.
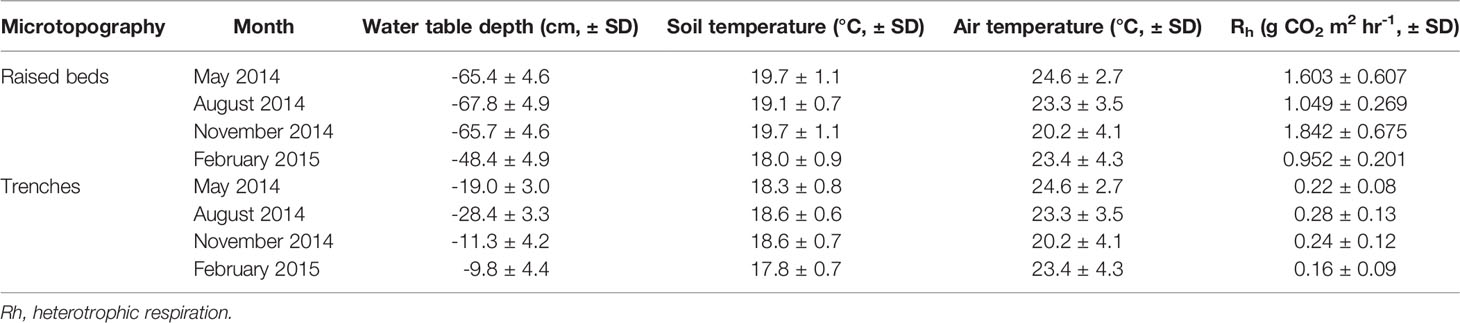
Table 3 The average results and standard deviation from all measurements each month, separated into results from raised beds and trenches.
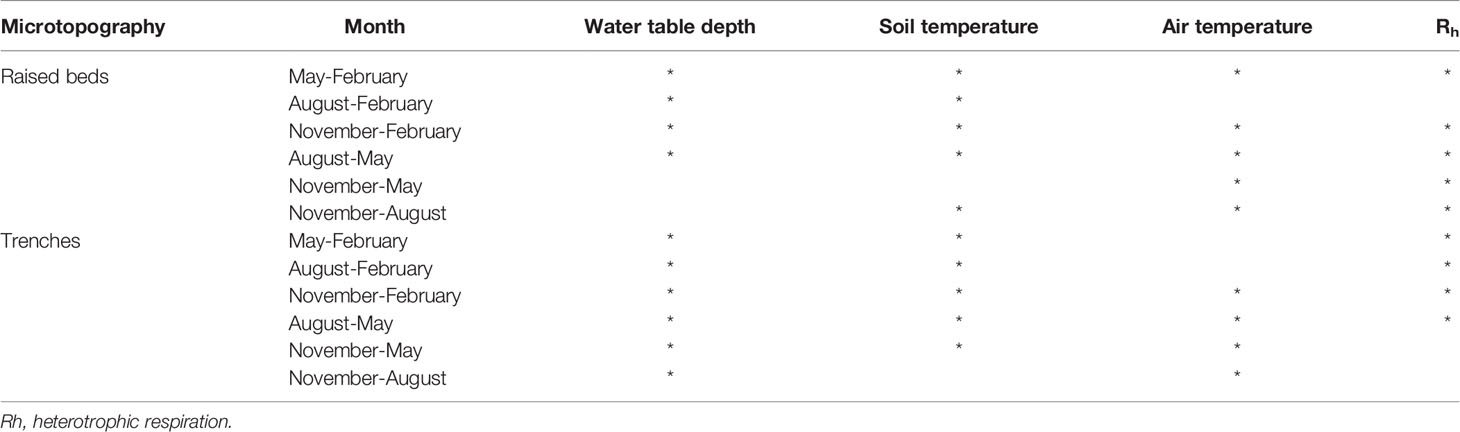
Table 4 Significant differences (p<0.05) in measurements between months based on Tukeys HSD at 95% confidence interval.
3.3 Relationship With Variables
We observed an effect of soil disturbance on the Rh and its relationship with environmental variables. Disturbance was due to digging of the peat for preparation of the raised beds (in May 2014), and from the potato harvest prior to flux sampling in November. At the undisturbed sampling times we saw a significant relationship between the WTD and Rh (p<0.001, adjusted r2 = 0.77) and a strong relationship between the soil temperature and Rh although with high variability (p<0.001, adjusted r2 = 0.07). For the measurements taken when the soil in the raised beds had been recently disturbed these relationships were no longer significant (p>0.3, adjusted r2 = 0, Figure 2).
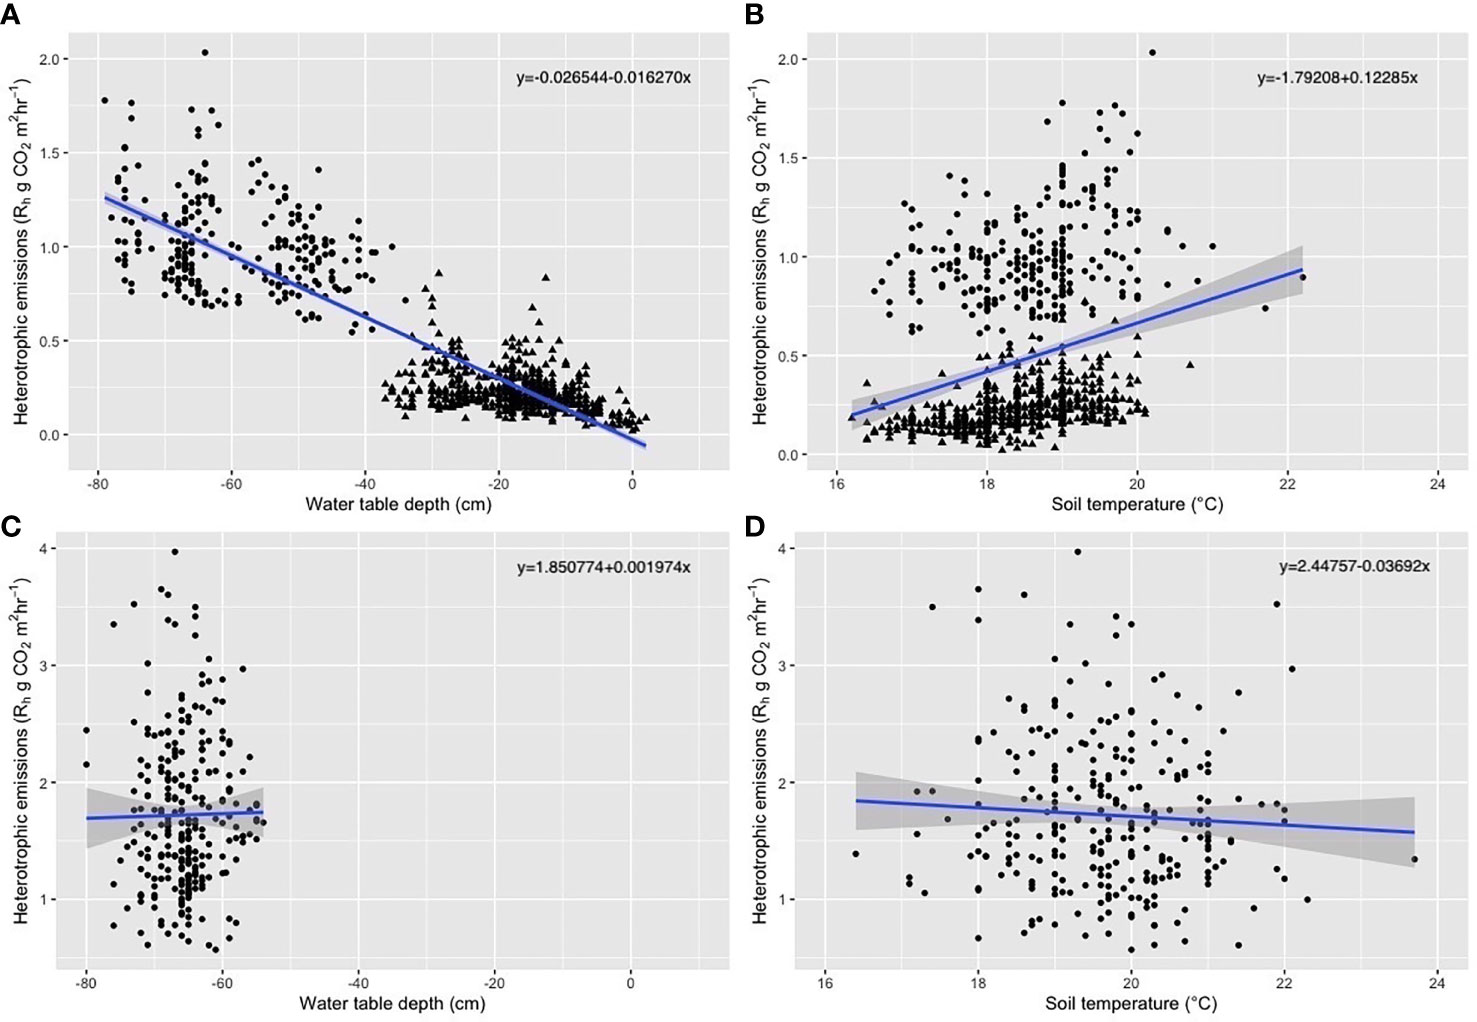
Figure 2 Plots of regression between key environmental variables and heterotrophic respiration (g CO2 m2 hr-1), for (A) water table depth and flux measurements and (B) soil temperature and flux measurements for samples taken when the soil had not recently been disturbed (i.e. May trenches, August raised beds and trenches, November trenches and February raised beds and trenches) and (C) water table and flux measurements and (D) soil temperature and flux measurements when the soil had recently been disturbed (i.e. May and November raised beds) with filled circles representing raised bed data and triangles representing data from trenches.
The log transformation of the Rh further strengthened our regression models. Across the regularly sampled data there was a significant relationship between WTD and logRh (linear model, p<0.001, Table 5 equation (a)), with 81% of the total variance explained by the model (adjusted r2). Soil temperature also showed a significant relationship (linear model, p<0.001, Table 5 equation (b)), but had a lower proportion of the total variance explained by the model (adjusted r2 of 0.23). Linear regression of the logRh with WTD and soil temperature showed a significant relationship and 82% of the total variance explained by the model (Table 5, equation (c)).
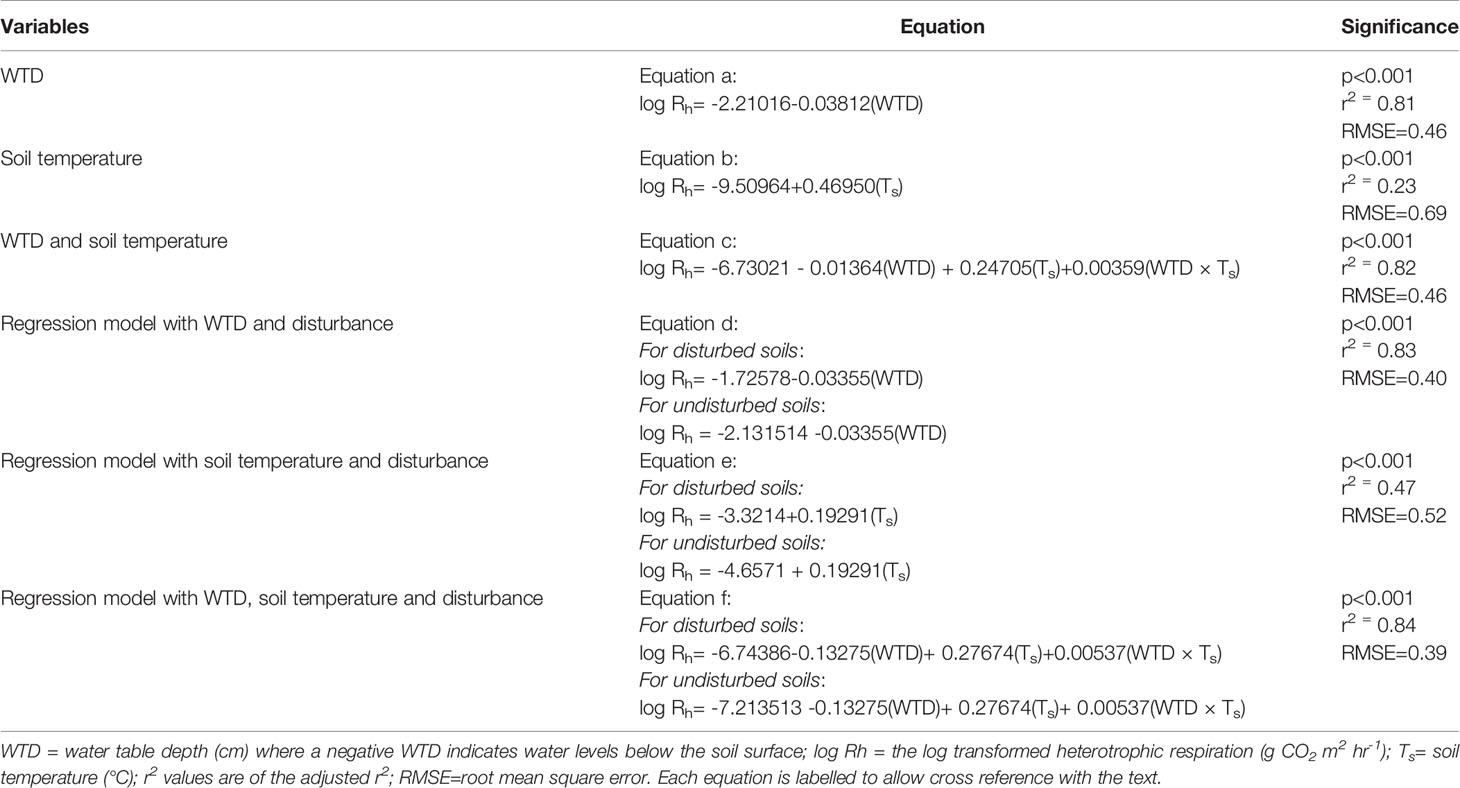
Table 5 Linear models for soil and water table depth, for the regularly sampled morning and afternoon data and for when the data is split based on disturbance (i.e. disturbed data is from raised beds in May and November sampling occasions).
Including the effect of disturbance, there was a significant relationship in the regressions of logRh with WTD, with soil temperature and with both WTD and soil temperature (p<0.001, Table 5 equations (d), (e), (f)). Total variance explained was highest in the regression of logRh with WTD, soil temperature and disturbance (adjusted r2 of 0.84, Table 5), and the best fit between predicted and actual values was also in this model (RMSE = 0.39, Table 5 equation (f)).
3.4 Area Weighed Emissions
The average width of the raised beds was 1.31 ± 0.07 m (± SE) and the average width of the trenches was 0.39 ± 0.1m. Taking into account the size of the study field, this is equivalent to 77 ± 4% (± SE) under raised beds and 23 ± 0.3% (± SE) under trenches. Taking the mean from all Rh measurements, 1.397 ± 0.02 g CO2 m2 hr-1 (± SE) from the raised beds and 0.225 ± 0.005 g CO2 m2 hr-1 (± SE) from the trenches and area-weighing them based on the measured field dimensions provides a mean hourly emissions rate of 1.128 ± 0.019 g CO2 m2 hr-1, equivalent to a mean annual emissions rate of 98.79 ± 1.7 t CO2 ha-1 yr-1 (± SE). While this annual loss estimate is simply based on the means of our measurements, future studies can refine this value through capturing further detail on environmental variables and soil use over the year.
4 Discussion
4.1 Range
The peat soils in this study site were a strong contributor to atmospheric CO2. Due to the mounding of soil to make the raised beds, the raised beds had a thicker layer of soil above the WTD than the trenches and thus showed significantly different rates of soil C loss with area weighed emissions from raised beds on average 10 times higher than from trenches per hectare across each month. While the mean hourly rate of Rh from the trenches were nearly an order of magnitude lower than on the raised beds, they were still significant and comparable with those from other studies when considering a similar concept to the commonly applied micro-topographical classification of hummocks and hollows in peatland soils research (25, 26). Jauhiainen et al., 2005 (27) presented a range of hollow flux measurements between 0.1-0.9 g m2 hr-1 from a tropical forest floor with WTD of 0 to -30 cm, of which our average monthly range in Rh from the trenches sits at the lower end of, between 0.16 to 0.27 g m2 hr-1 with a WTD of -9 to -28 cm.
Comparison with other literature from the African continent is difficult due to a lack of heterotrophic emissions studies on cultivated peat soils. Were et al. (10) reported CO2 fluxes from an intact, waterlogged wetland in eastern Uganda, with mean CO2 fluxes reported to be between 2.4-2.5 g CO2 m2 hr-1 across different wetland vegetation types. This rate of flux is higher than we measured, but is assumed to include autotrophic respiration which our study does not. Carbon dioxide emissions from a cultivated Kenyan wetland (although not strictly Rh as cut stems and roots were still present in collars) reported an approximate maximum of 0.3 g CO2 m2 hr-1 which was at the lower end of our measured emissions, but was not on peat soils (organic carbon content < 5%) (28).
4.2 Temporal Variability
While we observed a significant reduction in air temperature overnight, this was not reflected in the soil temperatures, which showed an increase in temperature into the night with any early morning cooling of the soils still within the range of daytime soil temperatures. The Rh also exhibited little to no difference over the day and night-time measurements- indicating that variability in Rh over a diurnal time frame is not a significant consideration in this site. This is likely to be due to no changes in WTD overnight (the variable that exhibited the strongest influence on emissions), and no soil cooling overnight (in fact a mean 0.4°C increase in nocturnal soil temperatures in both the raised beds and trenches across all measurements). This contrasts with other studies that describe higher soil temperatures and Rh during the middle of the day (29). Other studies have observed lower diurnal temperatures compared to daytime measurements, and applied correction factors to adjust daytime flux measurements based on Q10 (30). Instead, we saw a much stronger difference in the month-to-month observations, in both the measured environmental variables and the Rh.
There are no comparative Rh studies for drained peat soils within Uganda, and so comparison of our estimated annual emissions from these soils can only be done against tropical peats from other countries. Based on the area weighing of our measurements, our annual estimate of emissions from these peat soils of 98.79 ± 1.7 t CO2 ha-1 yr-1 (SE) is within the higher range of emissions compared to other tropical peat fluxes. Southeast Asia provides a strong set of measurements from drained peatlands, in particular under oil palm plantations. Fluxes from SE Asia are highly variable, with an Rh of 18-56 t CO2 ha-1 yr-1 in drained forest and oil palm in Malaysia (31), 74-111 t CO2 ha-1 yr-1 from a range of studies on drained oil palm plantations in SE Asia (32), and 24.9 t CO2 ha-1 yr-1 in a young oil palm plantation in Borneo (33). The Intergovernmental Panel on Climate Change emissions factor for drained cropland and fallow in the tropics is 51 t CO2 ha-1 yr-1 (34). By comparison, peatlands under arable cropping in Europe, which involves annual ploughing of soils, have been shown to emit between 24-92 t CO2 ha-1 yr-1 (35). The management of peat soils in Uganda under potato cultivation involves an annual refreshment of the exposed peat from digging up of new peat to create new raised beds, thus exposing previously waterlogged soils to aerobic conditions. This introduction of fresh peat on an annual basis is different to the soil management of oil palm plantations in SE Asia where the soils are typically not disturbed post-planting. Therefore, it might be expected that the peat soils under repeated cultivation for potatoes would have emissions that remain high, unlike in sites that are not disturbed again after the initial planting period where emissions reduce after initial years since drainage [e.g. in (33) where the initial emissions of 91 t CO2 ha-1 yr-1 dropped to 47 t CO2 ha-1 yr-1 over the first 6 years].
4.3 Environmental variables
The relationships observed between WTD, soil temperature and Rh were not unexpected, as this has previously been demonstrated in multiple studies (35). In some studies, this has been presented as a linear relationship with WTD (36–38) or soil temperature only (39). As water table depth measurements do not require technical equipment, the relationship observed here has the potential for wide use by a variety of stakeholders to evaluate and model the impacts of hydrological management within these systems for reduced carbon losses.
While we observed strong relationships in the soils which had not recently experienced disturbance, we had more varied and higher Rh from the soils that had. Disturbance could cause changes to soil microbial and environmental properties, and has implications for future studies on these soils which need to take these impacts into account, especially when attempting to determine annual change. Other variables not measured here such as changes in soil bulk density, may have a significant combined effect on Rh and will vary as a result of soil management over the year. There may also be an effect of the location of microbial biomass in the soil profile, which have been shown to be more prolific in the upper layers of the soil, with microbial extracellular enzymes involved in C cycling reducing with depth (40).
Due to a lack of literature and available information on the use of these peat soils under this land use prior to our study, our sampling frequency was based on attempting to capture the range of environmental and management conditions that we anticipated would be experienced over the year. Considering that these soils are dug, cultivated, planted, harvested and fallowed at different times over a 12-month period, each of which bring different impacts to the soil, as well as differences in WTD and temperatures over the year, further studies should consider this when planning sampling and modelling of soil C losses. While our study succeeded in capturing different management and WTD conditions over the year, future studies could consider increased sampling intensity to a monthly emissions sampling campaign to ensure the extent of land management impacts are captured. Inclusion of regular soil sampling with these monthly measurements, in particular for bulk density and organic matter content, would enable further analysis of soil change and further refinement of relationships with key variables, and feed into model development and application for estimating land use impacts on these soils. Capturing the spatial variability from cultivated peatlands across the Kigezi highlands would strengthen the estimates of soil C losses for this peatland type and land use. Measurements of continuous in-situ WTD, soil and air temperature, and soil moisture content along with local climate data, would allow for accurate modelling of emissions over the longer term.
4.4 Implications for Peatland Management
In terms of land management impacts and mitigation strategies, initial insight from this study shows considerable soil C losses due to soil drainage and disturbance. Although a number of years have passed since our field study was conducted, these management practices continue and thus these soil carbon losses are still relevant. Efforts to raise water levels would reduce these losses- one low-impact option for farmers could include the transfer of raised bed soils into trenches at the end of the harvest, to allow waterlogging of these soils during the fallow period. Alternatively, re-wetting and restoration of the wetland and exploration of alternative ecosystem service provision (including C payments for avoided emissions) or improved upland soil and crop management for enhanced incomes (and thus reduced household dependency on wetland cultivation) should also be explored. Before significant land management recommendations are made for these soils, the full GHG flux of the system should be further investigated, including the contribution of CH4 emissions under waterlogged conditions, and the impact of the current land use including effects from the application of pesticides or fertilisers on water and soil quality.
5 Conclusions
Management of these peat soils for potato cultivation leads to significant Rh, in particular due to the mounding of fresh peats to ensure soils are raised above the water table. These raised beds had emissions nearly an order of magnitude higher than the trenches in between them.
While there were lower air temperatures at night, nocturnal soil temperature and Rh were not significantly affected and as such we conclude that there is no significant diurnal variability in emissions. Significant temporal variability was found over monthly time steps, rather than over hours or days, as we observed greater changes in key variables (soil temperature and WTD) from our measurements taken in the different months.
Soil management (the different microtopography from the raised beds and trenches, and disturbance from planting and harvesting), as well as the soil temperature and water table depth were the most significant variables that impacted the rate of Rh.
Our area weighed annual flux estimate of 98.79 ± 1.7 t CO2 ha-1 yr-1 is the first attempt at providing an emissions factor for this land use on these peat soils in Uganda.
Data Availability Statement
The raw data supporting the conclusions of this article will be made available by the authors, without undue reservation.
Author Contributions
JF designed the experimental work, conducted the field measurements and data analysis and lead the writing of the manuscript. CL supported the experimental design, contributed to the data analysis and provided input to the manuscript. JS supported the experimental design and provided input to the manuscript. All authors contributed to the article and approved the submitted version.
Funding
This research was conducted under the ALTER research project. ALTER (Grant No: NE-K010441-1) was funded with support from the Ecosystem Services for Poverty Alleviation (ESPA) programme. The ESPA programme is funded by the Department for International Development (DfID), the Economic and Social Research Council (ESRC) and the Natural Environment Research Council (NERC).
Conflict of Interest
The authors declare that the research was conducted in the absence of any commercial or financial relationships that could be construed as a potential conflict of interest.
Publisher’s Note
All claims expressed in this article are solely those of the authors and do not necessarily represent those of their affiliated organizations, or those of the publisher, the editors and the reviewers. Any product that may be evaluated in this article, or claim that may be made by its manufacturer, is not guaranteed or endorsed by the publisher.
Acknowledgments
The authors are grateful to the Wetlands Management Department, District officers, and the Rurigita farmers group for their support of this research. The authors are also grateful to the field support provided by graduates from Kabale University in their fieldwork support during this work.
References
1. Xu J, Morris PJ, Liu J, Holden J. PEATMAP: Refining Estimates of Global Peatland Distribution Based on a Meta–Analysis. Catena (2018) 160(April 2017):134–40. doi: 10.1016/j.catena.2017.09.010
2. Ribeiro K, Pacheco FS, Ferreira JW, de Sousa–Neto ER, Hastie A, Krieger Filho GC, et al. Tropical Peatlands and Their Contribution to the Global Carbon Cycle and Climate Change. Glob. Chang. Biol (2021) 27(3):489–505. doi: 10.1111/gcb.15408
3. Leifeld J, Menichetti L. The Underappreciated Potential of Peatlands in Global Climate Change Mitigation Strategies /704/47/4113 /704/106/47 Article. Nat Commun (2018) 9(1):1–7. doi: 10.1038/s41467-018-03406-6
4. Page SE, Rieley JO, Banks CJ. Global and Regional Importance of the Tropical Peatland Carbon Pool. Glob. Chang. Biol (2011) 17(2):798–818. doi: 10.1111/j.1365-2486.2010.02279.x
5. Sasmito SD, Taillardat P, Fong LS, Ren JWF, Sundahl H, Wijedasa L, et al. Terrestrial and Aquatic Carbon Dynamics in Tropical Peatlands Under Different Land Use Types: A Systematic Review Protocol. Forests (2021) 12(10):1–10. doi: 10.3390/f12101298
6. Dargie GC, Lewis SL, Lawson IT, Mitchard ETA, Page SE, Bocko YE, et al. Age, Extent and Carbon Storage of the Central Congo Basin Peatland Complex. Nature (2017) 542(7639):86–90. doi: 10.1038/nature21048
7. Joosten H. The Global Peatland CO2 Picture, Peatland Status and Drainage Related Emissions in All Countries of the World. Wetlands International (2009). Germany: University of Greifswald
8. Saunders MJ, Kansiime F, Jones MB. Agricultural Encroachment: Implications for Carbon Sequestration in Tropical African Wetlands. Glob. Chang. Biol (2012) 18(4):1312–21. doi: 10.1111/j.1365-2486.2011.02633.x
9. Turyahabwe N, Tumusiime DM, Kakuru W, Barasa B. Wetland Use/Cover Changes and Local Perceptions in Uganda. Sustain. Agric Res (2013) 2(4):95–105. doi: 10.5539/sar.v2n4p95
10. Were D, Kansiime F, Fetahi T, Hein T. Carbon Dioxide and Methane Fluxes From Various Vegetation Communities of a Natural Tropical Freshwater Wetland in Different Seasons. Environ. Proc. (2021) 8(2):553–71. doi: 10.1007/s40710–021–00497–0
11. Hamilton AC, Taylor D. Mire Sediments in East Africa. In: Sedimentation in the African Rifts. London: Geological Society Special Publication (1986). p. 211–7.
12. Langan C, Farmer J, Rivington M, Novo P, Smith JU. A Wetland Ecosystem Service Assessment Tool, Development and Application in a Tropical Peatland in Uganda. Ecol. Indic. (2019) 103:434–45. doi: 10.1016/j.ecolind.2019.04.019
13. Lützow M, Kögel–Knabner I. Temperature Sensitivity of Soil Organic Matter Decomposition—What Do We Know? Biol Fertil. Soil. (2009) 46(1):1–15. doi: 10.1007/s00374–009–0413–8
14. Davidson EA, Janssens IA. Temperature Sensitivity of Soil Carbon Decomposition and Feedbacks to Climate Change. Nature (2006) 440:165–73. doi: 10.1038/nature04514
15. Davidson Ea, Janssens Ia, Lou Y. On the Variability of Respiration in Terrestrial Ecosystems: Moving Beyond Q10. Glob. Chang. Biol (2006) 12(2):154–64. doi: 10.1111/j.1365-2486.2005.01065.x
16. Kirschbaum M. The Temperature Dependence of Soil Organic Matter Decomposition, and the Effect of Global Warming on Soil Organic C Storage. Soil Biol Biochem (1995) 27(6):753–60. doi: 10.1016/0038-0717(94)00242-S
17. Kirschbaum M. The Temperature Dependence of Organic–Matter Decomposition—Still a Topic of Debate. Soil Biol Biochem (2006) 38(9):2510–8. doi: 10.1016/j.soilbio.2006.01.030
18. Reth S, Reichstein M, Falge E. The Effect of Soil Water Content, Soil Temperature, Soil Ph–Value and the Root Mass on Soil CO 2 Efflux – A Modified Model. Plant and Soil (2005) 268:21–33. doi: 10.1007/s11104-005-0175-5
19. Hooijer A, Page S, Jauhiainen J, Lee WA, Lu XX, Idris A, et al. Subsidence and Carbon Loss in Drained Tropical Peatlands.. Biogeosciences (2012) 9(3):1053–71. doi: 10.5194/bg-9-1053-2012
20. Jauhiainen J, Kerojoki O, Silvennoinen H, Limin S, Vasander H. Heterotrophic Respiration in Drained Tropical Peat is Greatly Affected by Temperature – A Passive Ecosystem Cooling Experiment. Environ. Res. Lett. (2014) 9(10):1–18. doi: 10.1088/1748-9326/9/10/105013
21. Marwanto S, Agus F. Is CO 2 Flux From Oil Palm Plantations on Peatland Controlled by Soil Moisture and / or Soil and Air Temperatures? Mitigation and Adaptation Strategies for Global Change (2013) 12:809–19. doi: 10.1007/s11027-013-9518-3
22. Girkin NT, Dhandapani S, Evers S, Ostle N, Turner BL, Sjögersten S. Interactions Between Labile Carbon, Temperature and Land Use Regulate Carbon Dioxide and Methane Production in Tropical Peat. Biogeochemistry (2020) 147(1):87–97. doi: 10.1007/s10533-019-00632-y
23. Arn Teh Y, Murphy WA, Berrio JC, Boom A, Page SE. Seasonal Variability in Methane and Nitrous Oxide Fluxes From Tropical Peatlands in the Western Amazon Basin. Biogeosciences (2017) 14(15):3669–83. doi: 10.5194/bg-14-3669-2017
25. Moore PA, Lukenbach MC, Thompson DK, Kettridge N, Granath G, Waddington JM. Assessing the Peatland Hummock–Hollow Classification Framework Using High–Resolution Elevation Models: Implications for Appropriate Complexity Ecosystem Modeling. Biogeosciences (2019) 16(18):3491–506. doi: 10.5194/bg-16-3491-2019
26. Hirano T, Jauhiainen J, Inoue T, Takahashi H. Controls on the Carbon Balance of Tropical Peatlands. Ecosystems (2008) 12(6):873–87. doi: 10.1007/s10021–008–9209–1
27. Jauhiainen J, Takahashi H, Heikkinen J, Martikainen P, Vasander H. Carbon Fluxes From a Tropical Peat Swamp Forest Floor. Glob Chang Biol (2005) 11:1788–97. doi: 10.1111/j.1365-2486.2005.01031.x
28. Ondiek RA, Hayes DS, Kinyua DN, Kitaka N, Lautsch E, Mutuo P, et al. Influence of Land–Use Change and Season on Soil Greenhouse Gas Emissions From a Tropical Wetland: A Stepwise Explorative Assessment. Sci. Total. Environ (2021) 787:147701. doi: 10.1016/j.scitotenv.2021.147701
29. Hoyt AM, Gandois L, Eri J, Kai FM, Harvey CF, Cobb AR. CO2 Emissions From an Undrained Tropical Peatland: Interacting Influences of Temperature, Shading and Water Table Depth. Glob. Chang Biol (2019) 25(9):2885–99. doi: 10.1111/gcb.14702
30. Jauhiainen J, Hooijer A, Page SE. Carbon Dioxide Emissions From an Acacia Plantation on Peatland in Sumatra, Indonesia. Biogeosciences (2012) 9(2):617–30. doi: 10.5194/bg-9-617-2012
31. Cooper HV, Evers S, Aplin P, Crout N, Dahalan MPB, Sjogersten S. Greenhouse Gas Emissions Resulting From Conversion of Peat Swamp Forest to Oil Palm Plantation. Nat. Commun. (2020) 11(1):1–8. doi: 10.1038/s41467-020-14298-w
32. Page SE, Morrison R, Mailins C, Hooijer A, Rieley JO, Jauhiainen J. Review of Peat Surface Greenhouse Gas Emissions From Oil Palm Plantations in Southeast Asia. Indirect Effects of Biofuel Production Series. Washington DC: The International Council on Clean Transportation White paper. (2011).
33. McCalmont J, Kho LK, Teh YA, Lewis K, Chocholek M, Rumpang E, et al. Short– and Long–Term Carbon Emissions From Oil Palm Plantations Converted From Logged Tropical Peat Swamp Forest. Glob. Chang. Biol (2021) 27(11):2361–76. doi: 10.1111/gcb.15544
34. Drösler M, Verchot LV, Freibauer A, Pan G. Supplement to the 2006 IPCC Guidelines for National Greenhouse Gas Inventories. In: Wetlands. Switzerland: Intergovernmental Panel on Climate Change (2013) 2013. Available at: http://www.ipcc–nggip.iges.or.jp/public/wetlands/.
36. Carlson KM, Goodman LK, May–Tobin CC. Modeling Relationships Between Water Table Depth and Peat Soil Carbon Loss in Southeast Asian Plantations. Environ. Res. Lett. (2015) 10(7):074006. doi: 10.1088/1748-9326/10/7/074006
37. Ojanen P, Minkkinen K. The Dependence of Net Soil Co2 Emissions on Water Table Depth in Boreal Peatlands Drained for Forestry. Mires Peat (2019) 24:1–8. doi: 10.19189/MaP.2019.OMB.StA.1751
38. Swails E, Yang X, Asefi S, Hergoualc’h K, Verchot L, McRoberts RE, et al. Linking Soil Respiration and Water Table Depth in Tropical Peatlands With Remotely Sensed Changes in Water Storage From the Gravity Recovery and Climate Experiment. Mitig. Adapt. Strateg. Glob. Change (2019) 24:575–90. doi: 10.1007/s11027-018-9822-z
39. Jauhiainen J, Kerojoki O, Silvennoinen H, Limin S, Vasander H. Heterotrophic Respiration in Drained Tropical Peat is Greatly Affected by Temperature—a Passive Ecosystem Cooling Experiment. Environ Res Lett (2014) 9(10):105013. doi: 10.1088/1748-9326/9/10/105013
Keywords: tropical peat, soil carbon, cultivation, carbon dioxide, drainage, soil respiration
Citation: Farmer J, Langan C and Smith JU (2022) Temporal Variability in Heterotrophic Carbon Dioxide Emissions From A Drained Tropical Peatland in Uganda. Front. Soil Sci. 2:904647. doi: 10.3389/fsoil.2022.904647
Received: 25 March 2022; Accepted: 24 June 2022;
Published: 15 July 2022.
Edited by:
Jorge Perez-Quezada, University of Chile, ChileReviewed by:
Ifo Suspense Averti, Marien Ngouabi University, Republic of CongoAntonio Lidón, Universitat Politècnica de València, Spain
Copyright © 2022 Farmer, Langan and Smith. This is an open-access article distributed under the terms of the Creative Commons Attribution License (CC BY). The use, distribution or reproduction in other forums is permitted, provided the original author(s) and the copyright owner(s) are credited and that the original publication in this journal is cited, in accordance with accepted academic practice. No use, distribution or reproduction is permitted which does not comply with these terms.
*Correspondence: Jenny Farmer, farmerjen@gmail.com