
94% of researchers rate our articles as excellent or good
Learn more about the work of our research integrity team to safeguard the quality of each article we publish.
Find out more
ORIGINAL RESEARCH article
Front. Soil Sci., 16 May 2022
Sec. Soil Biogeochemistry & Nutrient Cycling
Volume 2 - 2022 | https://doi.org/10.3389/fsoil.2022.849210
This article is part of the Research TopicGreenhouse gas measurements in underrepresented areas of the worldView all 8 articles
 Renata Pinto1,2,3*
 Gabriele Weigelhofer2,3
 Matthias Pucher2,3
 Rebecca Clare Hood-Nowotny2
 Patricia Bonin4António Guerreiro Brito1
 Thomas Hein2
Aquatic-terrestrial interfaces may act as biogeochemical hotspots for greenhouse gas emissions, especially when exposed to frequent transitions between wet and dry phases. The study aimed to analyze the dynamics of nitrogen (N) processing along an inundation gradient from floodplain soils to river sediments and identify environmental factors affecting net nitrous oxide (N2O) production from different microbial sources. Intact soil and sediment cores were subject to two consecutive drying-rewetting cycles in laboratory experiments. The 15N isotope pairing technique was used to quantify N2O emissions sourced from denitrification and nitrification. We observed enhanced N2O emissions from both nitrification and denitrification following drying events. Sites exposed to frequent drying-rewetting cycles appear less affected by drying than hydrologically more stable habitats. Fluxes from nitrification were related to the organic matter content, while fluxes from denitrification were controlled by dissolved organic matter quality changes during the drying-rewetting cycles. This study shows the potential link between carbon metabolism and N2O production, combining the effect of drying-rewetting cycles.
Freshwater ecosystems play a crucial role in nitrogen (N) processing and may be a significant source of nitrous oxide (N2O) (1, 2). N2O emissions from inland waters remain a major source of uncertainty in global greenhouse gas (GHG) budgets (3). These uncertainties are in part related to difficulties quantifying emissions from the underlying processes of N2O production in aquatic systems, preventing more explicit modeling of N2O formation and biogeochemical cycling (2). Understanding these processes is even more challenging at the aquatic-terrestrial interface, where the biogeochemical responses of both systems are affected by drying-rewetting cycles (4, 5). N2O emission peaks have been observed following both drying and rewetting events (hot moments). However, their relevance for global emission estimates has not been quantified yet, as these short-lived peaks can be easily overlooked, and information is scarce (6). These events of enhanced emissions are not frequent but may contribute more than 50% to annual emissions (7).
Aquatic-terrestrial interfaces, such as parafluvial zones and floodplain soils, are characterized by highly dynamic hydrological conditions. Therefore, they are considered as natural biogeochemical hotspots, playing a significant role in land-atmosphere fluxes [e.g., (8, 9)]. N and carbon (C) availability and cycling pathways are strongly influenced by drying-rewetting cycles [e.g., reviewed in Baldwin and Mitchell (10), Borken and Matzner (11), Congreves et al. (12)]. Thus, biogeochemical responses to changes in hydrology and drivers of N2O production need to be assessed, considering N2O fluxes derived from the co-occurrence of processes.
Pathways of N2O production involve the oxidation and reduction of reactive N species, in which N2O is produced as an intermediate reaction product. The main variables affecting N2O cycling are substrate availability (nitrate, ; nitrite, ; ammonium, ), organic carbon, and dissolved oxygen (13). Under reducing conditions, incomplete denitrification is likely to be the globally dominant N2O generating pathway, favored by elevated concentrations and organic carbon availability, while nitrification is favored at higher concentrations of dissolved oxygen and (13). Higher N2O emissions following drying and rewetting cycles have been attributed to periods of enhanced microbial activity due to coupled nitrification-denitrification occurring at the boundary of oxic-anoxic environments (10), whereby their intensity and distribution may be significantly influenced by transient water flows (6, 14). Drying stimulates organic matter mineralization and release in the sediments, which is nitrified once oxygen conditions are favorable for nitrification (15). In turn, the produced can be reduced by denitrifiers which remain active in exposed sediments, due to anoxic microsites during initial stages of drying. With ongoing drought, denitrification is progressively inhibited as the water filled pore space decreases, and tends to accumulate in the sediment, while tends to decrease due to nitrification throughout the dry period (16–19). Rewetting induces a pulse in mineralization and a release of labile organic carbon and inorganic N accumulated during drying, increasing microbial activities and N turnover rates (20). Substrates for N2O production are also made available from the release of intracellular solutes from cell lysis and/or as part of cell osmoregulation, induced by drying and rewetting events (10, 15).
While increases in N and C availability following drying-rewetting cycles are known to occur, for example due to enhanced mineralization (11), the quality of available substrates may also influence N2O fluxes. Evidence suggests dissolved organic matter processing, composition (i.e., aromaticity), and quality are affected by dry-wet cycles (21), which likely links to N2O flux dynamics, with less aromatic compounds contributing to mineralization and N2O pulses during these events. Hydrological transitions affect stream metabolism and the composition of dissolved organic matter due to changes in abiotic (e.g., evaporation, leaching of particulate organic matter) and biotic (e.g., microbial uptake) processes (22, 23). Stream fragmentation tends to increase dissolved organic matter (DOM) biodegradability with a short pulse of protein-like, autochthonous DOM net release at the beginning of the disconnection (21, 22). This leads to a shift toward a tryptophan-like, non-humified, bioavailable DOM, most likely related to microbial cell lysis and/or DOM exudation under stress conditions (23). The presence of these protein-like fluorophores has been positively correlated with denitrification rates, as well as N2O fluxes (14, 24). Linking the quality of labile C compounds to N2O dynamics has been recently highlighted as a research gap (12).
The aim of this study was to quantify the contribution of nitrification and denitrification to N2O emissions in response to drying-rewetting cycles along an inundation gradient, from river sediments (inundated) to parafluvial sediments (intermittently inundated), and floodplain soils (rarely inundated), as well as to identify the main drivers of N2O emissions for the different processes. We hypothesized that drying-rewetting cycles enhance N2O emissions from both nitrification and incomplete denitrification as they influence not only N availability, but also DOM quality. We explored the potential link between N2O dynamics and DOM quality (14) and hypothesized that changes in the quality and composition of available C substrates due to drying-rewetting cycles should favor N2O emissions, with more labile forms supporting higher process rates. The prediction of N2O emissions and the relative role of microbial source will benefit from a deeper understanding of the biogeochemical pathways and the context for N2O production under varying hydrological conditions.
The study area is located in a recently restored area of the Traisen River (48°22.386′ N, 15°49.613′ E; LIFE+ Traisen project, www.life-traisen.at), one of the Danube tributaries in Austria. The Traisen became heavily modified after the construction of the Altenwörth hydropower plant in 1976. A river stretch close to the mouth with the Danube was extended by 7.5 km, straightened, and regulated by flood protection dams. These modifications reduced the hydrologic connectivity between river and floodplain, resulting in a loss of natural aquatic and terrestrial habitats.
For the experiments, soil and sediment cores were collected along an inundation gradient consisting of three sites: a permanently inundated site (river sediments), an intermittently inundated site (parafluvial sediments), and a rarely-inundated site (floodplain soil). At each sampling site, 6 intact cores (h = 10–15 cm, d = 14 cm) were collected using an iron corer (d = 14 cm) in a total of 18 cores (6 cores per 3 sites). Immediately after sampling, the intact cores were transferred to the mesocosms apparatus used for the incubations (Figure 1) and then transported to the laboratory.
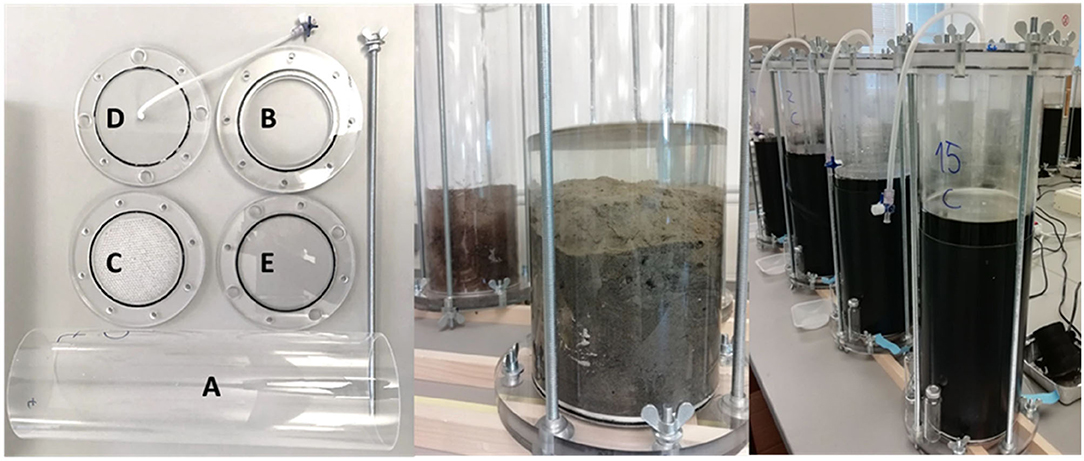
Figure 1. Mesocosm apparatus. Each mesocosms consisted of one fixed part and one removable part. The fixed part consisted of a cylinder (h = 485 mm, outer/inner d = 150/142 mm; A) attached to an open plate at the top (d = 210 mm, t = 20 mm; B) and to a perforated plate at the bottom (d = 210 mm, t = 12 mm; C). Plates B and C had an indentation fitted with a rubber gasket, to ensure that all 3 parts were sealed tightly. The removable part consisted of 2 plates, a top plate and a bottom plate (d = 210 mm, s = 8 mm, D and E, respectively). Plates D and E were fitted with a rubber gasket, to ensure that all parts (A–D) were sealed tightly during deployment for the gas measurements. Plate D was equipped with the gas sampling apparatus, and was attached to plate B during gas sampling. Plate E was secured to plate C and was removed when the test mesocosms needed to be drained. All mesocosms parts were attached together with lengthwise bolts, screws, nuts, butterfly nuts and washers. The mesocosms were covered with a solid black liner to prevent light exposure.
Intact soil and sediment cores were subject to two consecutive drying-rewetting cycles in laboratory experiments (Figure 2). The 15N isotope technique was used to quantify the contribution of nitrification and denitrification to N2O emissions in response to drying-rewetting cycles.
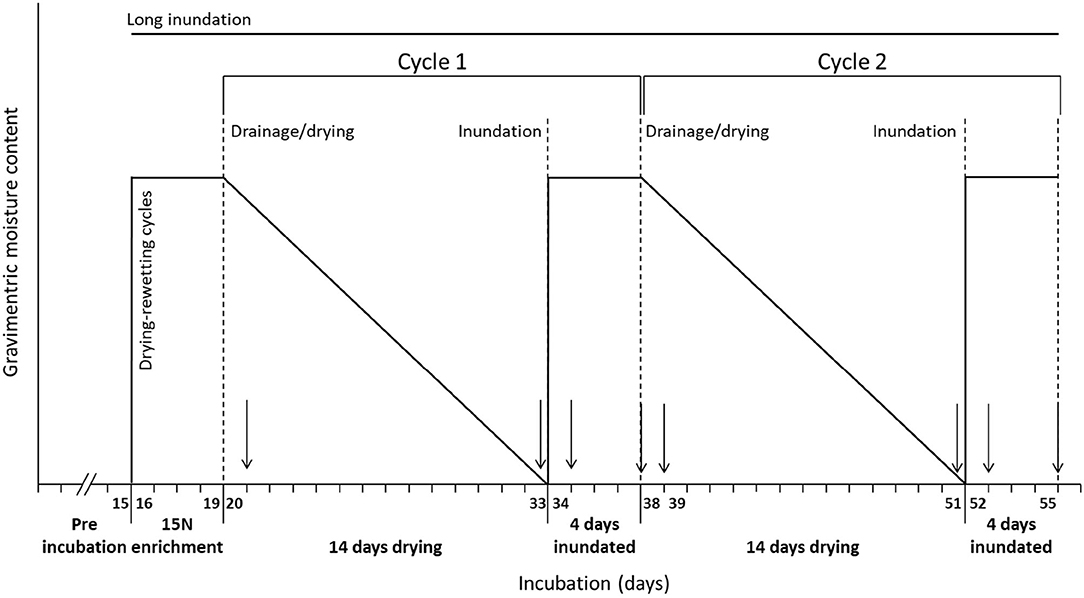
Figure 2. Schematic diagram of the experimental design and drying-rewetting cycles. The arrows show sampling dates (sampling frequency equal for all cores). Nine cores were kept inundated until the end of the experiment (long inundation cores) and nine cores were subject to two consecutive drying-rewetting cycles (drying-short inundation cores).
Plexiglas mesocosms (485 mm height, 142 mm diameter, covered with black PVC foil) were used for the intact core incubations (for more detailed information on the cores, see Figure 1). For the 15N-label application, all cores were inundated (total of 4 days), following an initial incubation settling period. The overlying water was enriched with 15 to a target value of 110 μmol L−1 (using K15NO3 [98 15N atom%] Sigma-Aldrich). A water pump was placed in each mesocosm to ensure complete mixing in the mesocosms and avoid stratification of the water column. In situ water was used in all cores.
After this period, a total of nine cores (three cores per three sites) were kept inundated until the end of the experiment (long inundation cores; control). The remaining nine cores (drying-short inundation cores; treatment) were subject to two consecutive drying-rewetting cycles, Cycle 1(C1) and Cycle 2 (C2), respectively. Each cycle consisted of a drying period (14 days) followed by a short inundation period (4 days) (Figure 2). At the end of each short inundation period, the cores were allowed to drain completely from the bottom, mimicking percolation in natural conditions where the top layer that becomes exposed to the atmosphere after inundation. The length of the cycles was set considering N dynamics and enhancement during the drying period [first 10–14 days; e.g., (19)], and increases in microbial activity due to a rapid substrate release and lysis of bacterial cells in the first few days after rewetting [~4 days; e.g., (15)].
Samples of soil and sediment and N2O were taken from all cores at fixed sampling dates in each hydrological cycle (C1 and C2) accounting for the initial and final of each period: on day 1 and day 14 during the drying period, on day 1 and day 4 during the short inundation period (Figure 2). The long inundation cores were equally sampled at the same dates to be compared with the dry-wet effects.
At each sampling date, the mesocosms were closed gas-tight and headspace gas samples were collected at 0, 30, 60, and 90 min deployment time by 60 mL gas-tight syringes transferred to 20 ml gas-tight glass vials (which had been flushed with He and pre-evacuated, crimped with a rubber septa) using a three-way valve connected to the gas sampling apparatus. The vials were over-pressurized and stored upside down to prevent ambient air intrusion and gas leakage until further analysis. All vials were stored and shipped to the Mediterranean Institute of Oceanography (Aix-Marseille Université) for the analysis of N2O isotopic species concentrations (44N2O, 45N2O, and 46N2O) using GC-MS (25). Sample injection was performed using a modified head-space autosampler (TriPlus 300, Thermo Fisher). GC-MS analysis was performed using an Interscience Compact GC system equipped with AS9-HC and AG9-HCT columns.
The cores were sampled sequentially. At each sampling date, sediment, and soil samples were collected from each core after gas sampling, using a stainless steel corer (drying phase; d = 1 cm) or via a glass tube with a rubber stopper (inundation phase; d = 1 cm), with minimal core disturbance. The cores were sampled at a depth of ≈10 cm. Approximately 8 grams of sample were taken to perform the analyses at each sampling date, and the mass loss during the experiment was accounted for in the calculations. Samples were transferred to 50 ml tubes and stored at 4°C until further analysis. Soil and sediment extracts were analyzed for mineral N (, , ), dissolved organic carbon (DOC) and dissolved organic matter (DOM) quality. Mineral N species [0.5 mol L−1 K2SO4 extraction; (26)] were measured photometrically with a plate reader (Varioskan Flash,Thermo Fischer Scientific, Vaanta, Finland) at 540 nm (, ) and 660 nm (). DOC [nanopure water extraction; (27)] was analyzed on a total carbon analyzer (Sievers 900, GE Analytical Instruments) and DOM quality was determined via fluorescence (excitation-emission spectra EEM) and absorbance spectra (28). Fluorescence intensity was measured at excitation (Ex) wavelengths from 200 to 450 nm and emission (Em) wavelengths from 250 to 600 nm at 5 nm intervals (1 cm quartz cuvette; Hitachi F-7000 Fluorescence Spectrophotometer). Measurements were blank-corrected against ultra-pure water, corrected against inner-filter effects, and normalized to Raman units. This is commonly corrected with the absorbance-based approach. From an extra absorbance measurement of the same sample (in the photometer), the effects of the absorbance influencing the fluorescence can be calculated and subsequently corrected (29, 30). Absorbance scans were performed between 200 and 700 nm at 0.5 nm intervals (5 cm quartz cuvette; Shimadzu UV-1700 UV-VIS Spectrophotometer). Soil and sediment water content (SWC%) was determined on an oven-dry weight basis (105°C for 24 h) and organic matter (OM%) by loss on ignition (450°C for 4 h).
To characterize changes in DOM, fluorescence peaks and indices were calculated using the eemR R package (31), absorbance parameters and the PARAFAC analysis were derived with the staRdom R package (32). The freshness index (BIX) is assumed to be an indicator for the presence of recent autochthonous (microbially-derived) DOM production and autotrophic productivity and was calculated using the emission intensity ratio 380/430 nm at an excitation of 310 nm (33). The humification index (HIX) is used as an indicator of the degree of humification of DOM and was calculated as the peak area under the emission spectra (Σ435–480/Σ300–445 nm) at constant excitation at 254 nm (34). Excitation spectra at 370 nm were used to calculate the fluorescence index (FI) values from the ratio of intensities emitted at 470/520 nm (35), with lower values indicating DOM from terrestrial origin (FI ~ 1.2) and higher values corresponding to autochthonous DOM (FI ~ 1.8; 25). Fluorescence peaks A and C were measured at Ex/Em = 250–260 nm/380–480 nm and Ex/Em = 330–350/420–480 nm, respectively, and peaks B and T were measured at Ex/Em = 270–280/300–320 nm and Ex/Em = 270–280/320–350 nm, respectively (36–38). Rayleigh and Raman scatter bands of first and second order were removed and interpolated. The absolute tolerance in the PARAFAC fitting process was set to 10−11. We used the leverage of each sample to check for outliers, but we did not identify any. The leverage is a measurement of the influence of a sample on the PARAFAC model. Values of 0 mean that a sample is exactly the average of all samples while a value of 1 means that the sample shares no characteristics with any other. Samples with an outstanding leverage are inspected specifically and if they show especially high noise or e.g., a unique EEM peak, which might be from unclean sample treatment, they are identified as outliers and removed from the sample set (39). The PARAFAC model validation was done with a split-half comparison. The sample set is split into four subsample sets: A, B, C, D. Subsamples are then combined and compared: AB vs. CD, AC vs. BD, AD vs. BC. This is a cross-validation that allows to identify features that are only present in few samples, by observing differences in the models calculated from different subsample sets. A split-half comparison which shows similar PARAFAC components for all subsets is considered an indicator for a stable model with suitable correction steps and a reasonable number of components (40). We compared the PARAFAC components of this study to those of other studies using the openfluor.org database (41). Fluorescence is expressed in Raman units (R.U.).
The 15N tracer based methods are widely applied to quantify denitrification rates by adding 15N-labeled [15()] and measuring gaseous products after an incubation period. The basis of IPT lies on the fact that the labeled 15 can be traced by the production of 14N15N (29N2, 45N2O) and 15N15N (30N2, 46N2O) gas, detected over the high atmospheric 14N14N (28N2, 44N2O), as a result of the redox reaction: 2 + 10 e- + 12 H+ → N2 + 6 H2O. The N2O is an intermediate species along the reaction pathway ( → → NO → N2O → N2) however it can be the final product if denitrification is incomplete.
Based on the m/z (mass divided by charge number of ions) peaks of N2O (m/z 44, m/z 45, m/z 46), a revised IPT method was used to estimate N2O production rates from denitrification and nitrification (42). Denitrification of 14 and 15 includes the production of N2O via denitrification, which produces 44N2O, 45N2O, and 46N2O molecules. Nitrification of 14 produces 44N2O molecules.
The ratio between 14 and 15 undergoing denitrification (r14) was derived from an estimator of r14, based on 15N-N2O production (r14-N2O). Since 15N-N2O was only sourced from denitrification, r14-N2O is not influenced by anammox (43). The distribution of 15N2O can be used to estimate r14 according to Equation 1:
(Equation 1) r14−N2O = P45/2·P46, where P45 and P46 are the production rates of 45N2O and 46N2O, respectively, and r14−N2O is an estimator of r14 based on 15N2O production
Theoretically, the N2O produced by nitrification can be calculated from the production rate of 44N2O measured by IRMS ([D44 + N44]IRMS), which comprises 44N2O production rate via nitrification (N44) and 44N2O production rate via denitrification (D44) (Equations 2, 3) (44).
(Equation 2) N44 = ([D44 + N44]IRMS)–D44, where N44 is the production rate of 44N2O via nitrification, D44 is the production rate of 44N2O via denitrification, and [D44 + N44]IRMS is the total production rate of 44N2O measured by IRMS
D44 is calculated from:
The rate of N2O formation via denitrification can be calculated as the difference between the total rate of N2O formation measured by IRMS ([D44 + N44]IRMS + P45+ P46) and Equation 2 (44).
The gas flux change rates between drying and short inundation phases and between long inundation and drying and short inundation treatments were determined. The change in N2O flux rates (%) was calculated using the average flux values observed for each event (45):
where Flux change (%) is the relative effect of the event on gas flux, Fluxpost−event is the rate of peak gas flux following the event, and Fluxpre−event is the rate of gas flux before the event (i.e., drying or short inundation). This approach compares fluxes between consecutive drying and short inundation events.
To compare N2O fluxes between the long inundation and drying and short inundation treatments, the changes in gas fluxes were calculated similarly to Equation 4, but using Fluxdrying and Fluxshort−inundation (substituting Fluxpost−event in each case) and Fluxlong−inundation (substituting Fluxpre−event).
The analysis was carried out in the R environment for statistical computing (R version 4.0.; RStudio version 1.2.1335, RStudio, Inc.). A redundancy analysis (RDA) was applied to relate N2O fluxes to environmental parameters and determine which explanatory variables best explain the variation in the fluxes (46). The type II scaling was used as to analyze the correlative relationships between variables. N2O fluxes from nitrification and denitrification were entered as species data, and mineral N (, , and ), DOC and OM quantity and quality (PARAFAC components, BIX, HIX, FI) were entered in the RDA as explanatory variables. The categorical variables inundation gradient (site), frequency (cycle number), and phase (drying and inundation) were also included as explanatory variables. A forward selection procedure (1,000 permutations) was used to select statistically significant explanatory variables. The resulting model was tested with an ANOVA-like permutation test for RDA (PERMANOVA, 999 permutations). All the aforementioned statistical analyses were computed with the vegan package (47). Post-hoc comparison between groups was performed after a significant result determined by PERMANOVA, using the non-parametric multivariate analog of the t-statistic, with significance determined by permutation [pairwiseAdonis package; (48)]. To compare the magnitude of the difference between the group means, we computed Cohen's d (or standardized differences), defined as the difference between the means divided by the root mean square of two standard deviations (49) [rstatix package; (50)]. Larger d-values reflect greater effect sizes and positive d values indicate higher flux values.
Initial N- concentrations are higher in the floodplain soil and decrease along the inundation gradient, with lower concentrations in river sediments for both control and treatment cores (Supplementary Table 0). A similar trend observed for N- concentrations. Initial N- concentrations were lower in the parafluvial sediments (control and treatment cores), and higher in the floodplain soil (control cores) and river sediments (test cores).
Drying significantly increased N- concentrations compared to long and short inundation at all sites (Figure 3; Supplementary Tables 1, 2). The floodplain soil had significantly higher N- concentrations than the parafluvial and river sediments during cycle 1 (all phases; Supplementary Tables 1, 2) and cycle 2 (drying phase; Supplementary Tables 1, 2). Similarly, N- concentrations tended to be higher during the drying phase at all sites (Figure 3) and were significantly higher in the floodplain soil than in the parafluvial and river sediments for both cycle 1 and cycle 2 (all phases; Supplementary Tables 1, 2). N- concentrations tended to be higher during the drying phases in the river sediments rather than in the floodplain soil and parafluvial sediments, while the opposite was observed during the inundation phases (Figure 3; Supplementary Tables 1, 2).
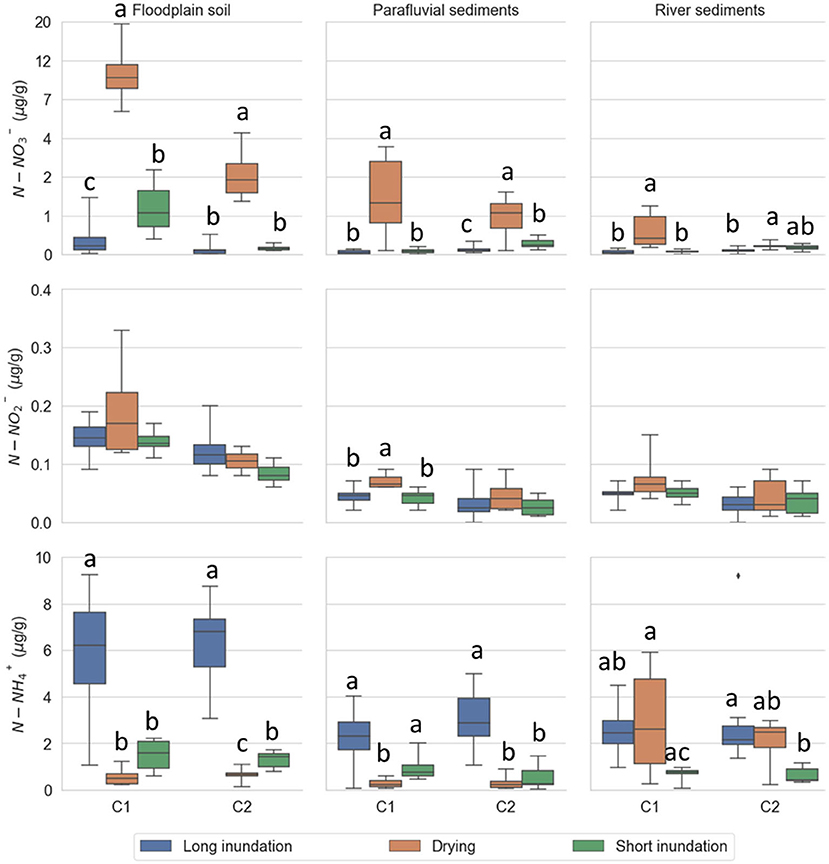
Figure 3. Mineral N content in soil and sediment extracts per site (floodplain soil, parafluvial sediments, river sediments) for each phase (long inundation, drying phase, short inundation phase). The data is aggregated by cycle (cycle 1 and 2). For each cycle, the treatment cores were subject to drying (orange; n = 6) and short inundation (green; n = 6) events. The control cores (blue; n = 12) were kept flooded throughout the entire experiment and were equally sampled at the same dates as the treatment cores. Nitrate content was pseudo log transformed for better visibility of range. Error bars are the 95% confidence interval, the bottom and top of the box are the 25th and 75th percentiles, the line inside the box is the 50th percentile (median), and any outliers are shown as points.
DOC concentration was significantly higher in the floodplain soil than in the other sites (both cycles) and tended to be lower during the short inundation phase in the floodplain soil and river sediments (Figure 4; Supplementary Tables 3, 4). OM content (Figure 4) was significantly higher in the floodplain soil than in the river sediments (both cycles; Supplementary Tables 3, 4) and parafluvial sediments (cycle 2; Supplementary Tables 3, 4).
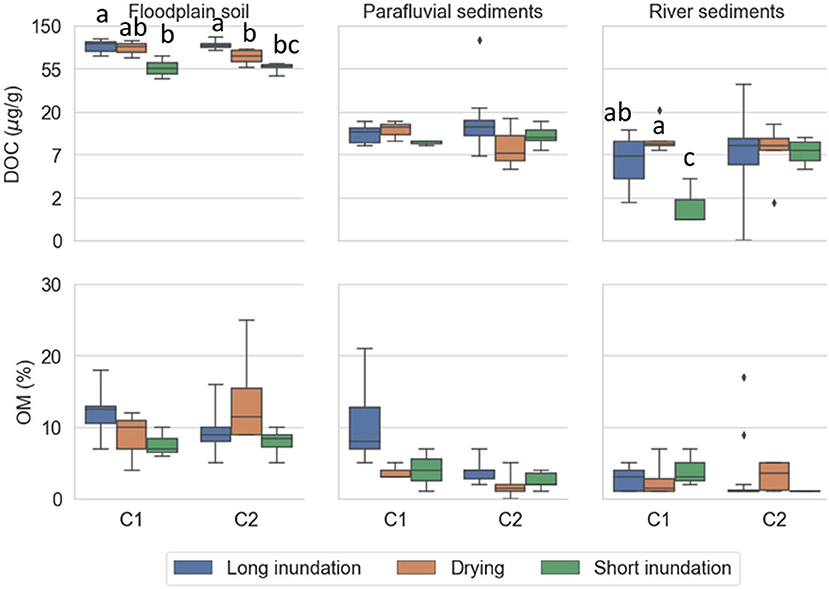
Figure 4. DOC and OM content in soil and sediment extracts per site (floodplain soil, parafluvial sediments, river sediments) for each phase (long inundation, drying phase, short inundation phase). The data is aggregated by cycle (cycle 1 and 2). For each cycle, the treatment cores were subject to drying (orange; n = 6) and short inundation (green; n = 6) events. The control cores (blue; n = 12) were kept flooded throughout the entire experiment and were equally sampled at the same dates as the treatment cores. DOC concentration was pseudo log transformed for better visibility of range. Error bars are the 95% confidence interval, the bottom and top of the box are the 25th and 75th percentiles, the line inside the box is the 50th percentile (median), and any outliers are shown as points.
The higher HIX values indicate a higher degree of humification in the floodplain soil extracts than in the parafluvial and river sediment extracts (all phases). The parafluvial and river sediments present a higher fresh-like to humic-like ratio (BIX) than the floodplain soil. The FI ranges for all sites indicate that DOM is from allochthonous sources (average FI values ~ 1.2). FI values are generally higher in the drying phase than in the short inundation phase in all sites and for both cycles (Figure 5; Supplementary Table 5).
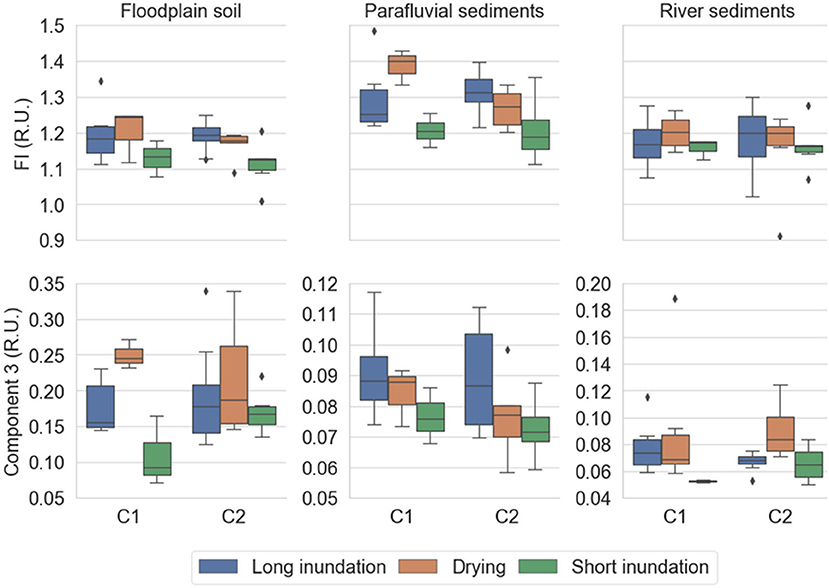
Figure 5. FI and PARAFAC component 3 from soil and sediment extracts per site (floodplain soil, parafluvial sediments, river sediments) for each phase (long inundation, drying phase, short inundation phase). The data is aggregated by cycle (cycle 1 and 2). For each cycle, the treatment cores were subject to drying (orange; n = 6) and short inundation (green; n = 6) events. The control cores (blue; n = 12) were kept flooded throughout the entire experiment and were equally sampled at the same dates as the treatment cores. Error bars are the 95% confidence interval, the bottom and top of the box are the 25th and 75th percentiles, the line inside the box is the 50th percentile (median), and any outliers are shown as points.
The PARAFAC analysis identified 3 components consistent with those previously reported and well-matched with the OpenFluor database (http://www.openfluor.org; Supplementary Table 6). The excitation-emissions regions of each component can be found in Supplementary Figure 1. The modeled component 1 (C1) is described as a terrestrial, humic-like fluorophore originating from degradation of plant and/or soil derived DOM. Component 2 (C2) is also described as a terrestrial humic-like fluorophore derived from lignin (medium processing) and microbial activity. Component 3 (C3) is described as a labile protein-like fluorophore (tryptophan-like) of microbial origin and recent biological production. The R.U. (components 1–3) tended to decrease from the drying phase to the short inundation phase and increased from the short inundation phase to the drying phase at all sites, with less variation between phases for the parafluvial sediments (Supplementary Table 7). For all treatments, the relative proportion of component 1 and 2 was higher in the floodplain soil (C1% and C2%: ~40 and ~50%, respectively), than in the parafluvial and river sediments (C1% and C2%: ~30 and ~40%, respectively), and component 3 was higher for the parafluvial and river sediments (C3%: ~30%) than in the floodplain soil (C3%: ~10%; Supplementary Table 7).
Despite the typically high variability of N2O emissions in both long inundation cores and drying-rewetting cores, there was evidence of higher N2O emissions during the drying phase of cycle 2 (Figure 6; Supplementary Table 8). Comparing both phases, N2O fluxes derived from nitrification were significantly higher in the drying phase than in the long inundation treatment (F = 20.32, p = 0.003) in the river sediments during cycle 1. Cycle 2 showed more distinct patterns. N2O fluxes from nitrification were significantly higher under the drying phase vs. short inundation phase (F = 3.25, p = 0.012) in the river sediments. N2O fluxes from denitrification were also significantly higher in the drying phase than in the short inundation phase (F = 4.83, p = 0.015; F = 5.95, p = 0.018) and in the long inundation (F = 6.60, p = 0.045; F = 5.92, p = 0.045) in the floodplain soil and river sediments, respectively.
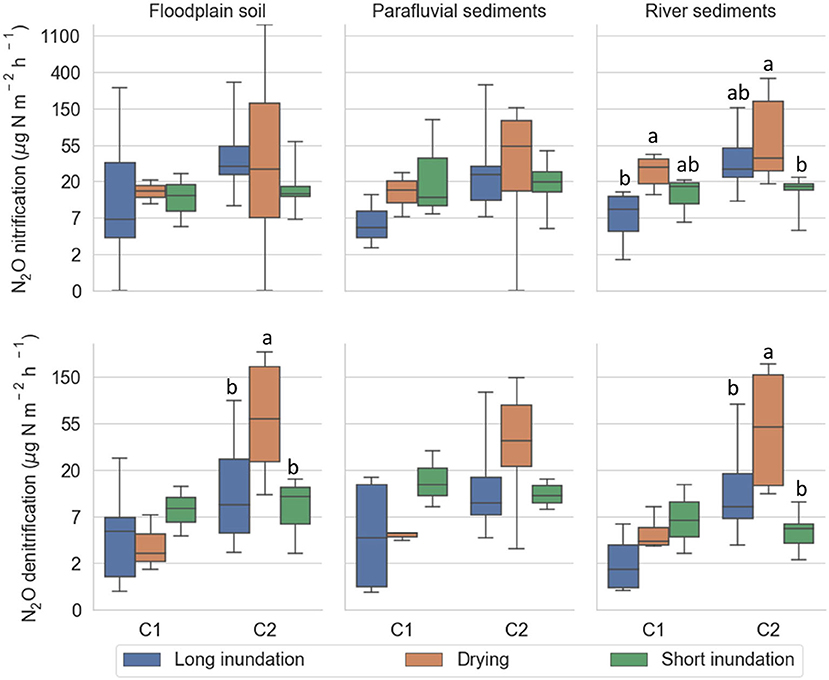
Figure 6. N2O fluxes derived from nitrification (A) and denitrification (B) per site (floodplain soil, parafluvial sediments, river sediments), for each phase (long inundation, drying phase, short inundation phase). The data is aggregated by cycle (cycle 1 and 2). For each cycle, the treatment cores were subject to drying (orange; n = 6) and short inundation (green; n = 6) events. The control cores (blue; n = 12) were kept flooded throughout the entire experiment and were equally sampled at the same dates as the treatment cores. Error bars are the 95% confidence interval, the bottom and top of the box are the 25th and 75th percentiles, the line inside the box is the 50th percentile (median), and any outliers are shown as points.
Cohen's d was calculated to compare the effect sizes of the different phases on N2O emissions derived from nitrification and denitrification (Supplementary Table 9). Overall, the effects of drying and short inundation were larger than the long inundation, whereby short inundation had stronger effects during the first cycle (N2O emissions derived from nitrification and denitrification), and drying had greater effect size during the second cycle (N2O emissions derived from denitrification).
The relative effect of drying and rewetting events on nitrification and denitrification was calculated as the gas flux change rates between long-term inundation and drying-rewetting treatments as well as between the drying phase and short-term inundation. During cycle 1, the short inundation increased N2O emissions from denitrification at all sites. Flux changes were highest in river sediments (167%), followed by the parafluvial sediments (125%) and floodplain soil (13%). The highest flux change occurred for nitrification (529%) during the short inundation in the parafluvial sediments. During cycle 2, increases in N2O emissions from both nitrification and denitrification were observed at all sites during the drying phase. Flux increases were highest in the floodplain soil (387 and 350%, respectively), followed by the river (180 and 271%, respectively), and parafluvial (38 and 155%, respectively), sediments.
At the sites not frequently exposed to drying-rewetting cycles, i.e., the floodplain soil and river sediments, the fluxes from both nitrification and denitrification were more affected by drying than in the parafluvial site. Flux changes were highest in the floodplain soil (1,947 and 1,100%), followed by the river sediments (720 and 1,013%) and the parafluvial sediments (50 and 211%), for nitrification and denitrification, respectively. During cycle 1, the parafluvial sediments were more impacted by the short inundation event (175 and 260%) than the floodplain soil (−6% and 125%) and the river sediments (−46 and 60%) for nitrification and denitrification, respectively. During cycle 2, the N2O fluxes from nitrification and denitrification decreased at all sites during the short inundation event.
The forward selection procedure indicated that: OM content, DOM availability and quality (DOC, component 3 and FI), the frequency (C1 and C2) and phase (drying and inundation), were the key environmental factors relating N2O fluxes (Figure 7; Supplementary Table 10). Approximately 42% of the flux variability could be explained by the selected environmental variables (constrained variance: 42%, unconstrained variance: 58%; F = 10.8; p = 0.001), with the first axis explaining a significant part of the variance of the response variables (F = 75.6; p = 0.002). The angles between all vectors on the RDA triplot reflect their linear correlation. Namely, the higher fluxes observed during the drying phase (cycle 2) were related to changes in DOM quality (with respect to denitrification) and to higher DOC and OM contents explaining higher fluxes derived from nitrification, after the first drying-rewetting cycle. Lower N2O fluxes during the inundation phase were concurrent with lower FI values.
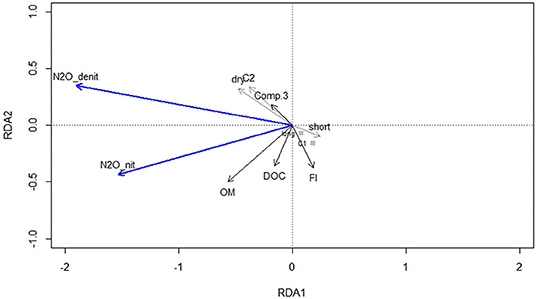
Figure 7. RDA ordination triplot (type II scaling—correlation plot) of N2O fluxes derived from nitrification and denitrification. Response variables are ordinated as blue arrows, quantitative explanatory variables as black arrows and qualitative explanatory variables as gray arrows. Centroids for the long inundation treatment and cycle 1 are given as gray squares for reference.
We hypothesized that drying-rewetting cycles in aquatic systems enhance N2O from both nitrification and incomplete denitrification as these events affect key variables influencing N2O cycling, namely substrate availability and DOM quality. Similar to other studies, tended to be higher during the drying phase and lower during the inundation, while tended to be lower during drying and higher during wet conditions. These shifts are indicative of enhanced N processing rates. The increase in content and decrease of most likely results from OM mineralization and continuous nitrification, throughout the drying period (16, 17, 19). Higher denitrification rates have also been detected between the onset of drying as a result of increased net nitrification rates, as well as N mineralization rates (19, 51).
Nitrification was an important source of N2O emissions. Studies have shown that nitrification rates can be equal or greater than denitrification rates in inland waters (3, 52, 53), and in saturated wetland soils and after drainage and often plays an underappreciated contributing to N2O emissions under these conditions (27). We observed highly enhanced N2O emissions from both nitrification and denitrification following drying events, although these peaks were only apparent after repeated drying during cycle 2. This pattern suggests that the transition from wet to dry phases has a high potential for N2O pulses from nitrification and denitrification (Figure 6, cycle 2), especially if these cycles are recurring. This trend has been observed previously in other studies. In soils, the highest N2O emission peak intensities have also been shown to occur during the drying phase compared to the wetting (near-saturation) phase and were correlated positively with the amount of water drained (54). Similarly, enhanced N2O emissions were measured during the transition from flooded to dry sediment conditions in a seasonal floodplain lake (51). The high N processing activity during initial drying was attributed to high spatial heterogeneity in redox conditions. Koschorreck (51) assumed that the patchy distribution of oxic and anoxic microsites between flooding and sediment drying increased the oxic-anoxic boundary area where coupled nitrification-denitrification could occur, increasing N2O emissions.
Drying-rewetting cycles drive environmental gradients, affecting N2O production and emission, namely O2 gradients, and substrate diffusion and availability and release. During these transitions, suboptimal conditions for both nitrification and denitrification can lead to an increase in N2O emissions, for example, inhibition of N2O reductase by O2, which catalyzes the reduction of N2O to N2 during denitrification (55). Higher processing rates and N2O fluxes are often observed when nitrification and denitrification processes are coupled [reviewed in (6)]. These fluxes are most likely driven by physical mechanisms related to the release of entrapped N2O in an initial stage, and sustained by a period of enhanced microbial activity thereafter (10, 18, 56). Comparing the different sites, changes in flux rates due to drying point to N2O pulses of a smaller magnitude in areas frequently exposed to drying-rewetting cycles, indicating that N2O peaks may become less intense after several drying-rewetting cycles (11). These differences may relate to community compositions which are site specific (i.e., soil, long inundated sediments, temporarily inundated sediments), therefore different microbial associations may be favored at each site, and indicative of functional differences during environmental changes (57).
We acknowledge the presence of DNRA in the long inundation cores due to favorable conditions for this pathway, namely strictly anaerobic sediments and limited N- supply. However, we consider the influence from this pathway to N2O emissions to be negligible compared to emissions from denitrification, as N2O is not an intermediate product, but rather is only produced when N- is allowed to accumulate (13). In these conditions, the complete DNRA process with the end product of might be more efficiency than the incomplete reduction that produces N2O (42), which is in agreement with the increased N- concentrations (Figure 3).
Drying-rewetting cycles affect C content and quality (e.g., 20) in addition to N availability and N cycling pathways (11). The variation in N2O fluxes was best explained by OM content and availability (nitrification) and DOM quality (denitrification). DOM is a complex mixture of organic compounds and is typically the most abundant source of C (DOC) in aquatic systems (58), fueling microbial processes, including denitrification (59). It results from a combination of allochthonous and autochthonous sources and their microbial processing (60). In rivers, most DOM is derived from allochthonous sources (soil and plant material) (58). Here, we observed that DOM is more terrestrially derived (FI ~ 1.2), not only in soil but also in parafluvial and river sediments, although the DOM composition differed between soils and sediments.
Results from the DOM quality support the hypothesis that hydrologically driven changes in DOM favor N2O emissions. In this study, the increased N2O fluxes from denitrification during the second drying phase were related to DOM quality changes specific to the tryptophan-like peak. This correlation suggests a change in the DOM pool during drying-rewetting cycles. This link seems to originate from the quality of the DOM pool, and related to the dependence on readily available organic carbon, which influences C and N turnover processes. Because most denitrifiers are heterotrophic, the potential for N2O production via denitrification increases, with more labile forms of DOC supporting higher denitrification rates [(13) and references therein; (61); accepted]. Hence the role of DOM depends not only on the quantity but also on its quality. The variability in hydrological connectivity plays an essential role in DOM composition (22, 23), with protein-like components achieving maximum abundances in the littoral zones (62). Therefore, in hydrologically dynamic areas, the high availability of protein-like substrates suggests a high DOM turnover by heterotrophic microbes. Indeed, a positive correlation between the presence of protein-like fluorophores and denitrification rates and N2O fluxes has been previously observed in fluvial ecosystems (14, 24).
Our study observed an increase in fluorescence intensity for a protein-like component during transitions from short inundation to the drying phase (Figure 5). Component 3 shows protein-like characteristics similar to freshly produced tryptophan, consistent with others previously reported and well-matched with the Open Fluor database with similarity scores (Tucker's congruency coefficients) of > 0.95. In particular, a similar component was identified in a study investigating the driving role of hydrological connectivity on DOM processing [(21), Supplementary Table 6]. The study identified periods with disproportionately high rates of DOM processing (hot moments), one of which was characterized by a short pulse of protein-like, autochthonous DOM net release at the beginning of hydrological disconnection. Similarly, other studies have found higher protein-like fluorescence as drought proceeds, indicating a shift to more tryptophan-like, non-humified, bioavailable DOM (22, 23).
DOC content was also generally higher during the drying than in the rewetting phase. Increases in DOC quantity and DOM bioavailability have been reported in streams during initial surface drying (21, 23, 63). Together with an increase in DOC concentration, these changes in DOM composition are likely related to microbial cell lysis and/or DOM exudation in response to stress conditions (10, 23). Therefore, these phases could be considered biogeochemical hot moments (4). Lower FI fluorescence observed during the inundation phase may indicate that a greater relevance of allochthonous sources exists, most likely originating from soil and sediment leachates (22). Lower N2O emissions were likely the combined result of complete reduction of N2O to N2 by denitrification and exhaustion of NO3 and/or NO2. Overall, evidence suggests that dissolved organic matter processing, composition (i.e., aromaticity), and quality are affected by drying-rewetting cycles. These cycles are linked to higher N2O emissions, with fewer aromatic compounds contributing to OM mineralization and N2O pulses.
Nitrification was not related to concentrations but to soil and sediment OM content and availability (DOC) during drying. These results suggest that was provided to nitrification via N mineralization (52), increasing N2O emissions through this process. Although nitrification is a chemo-autotrophic process, organic carbon can be an important regulator of nitrification rates via environmental C/N ratios and competition between heterotrophic and nitrifying bacteria (64, 65). Indeed, DOC availability decreased between drying cycles and the higher N2O fluxes observed for nitrification during the second drying phase could be related to a less inhibitory effect of organic carbon.
Hydrological connectivity plays a fundamental role in environmental variables that drive N2O production, making hydrologically dynamic areas hotspots for emissions. A critical knowledge gap is understanding the main drivers for N2O production originating from co-occurring processes during drying-rewetting cycles, which are affected by a wide range of factors that are intensified during these events, such as moisture conditions, O2 availability, C and N availability and quality.
Nitrification and denitrification processes co-occur during drying-rewetting phases. Here, we found that the transition from wet to dry phase showed a high potential for large N2O pulses. Organic matter content and quality, and the hydrological dynamics are key environmental factors affecting N2O fluxes, highlighting the link between the DOM quality and N2O dynamics, as well as the driving role of hydrology on both. N2O fluxes due to drying appear to be smaller at sites exposed to frequent drying-rewetting cycles than in hydrologically more stable habitats, likely related to community compositions which are site specific; nevertheless, these areas remain active spots for emissions during hydrological changes. Nitrification was a significant source of N2O emissions compared to denitrification.
Relevant changes of biogeochemical processes occur during the transitions between hydrological phases, affecting N2O dynamics originating from different microbial processes. DOM quality and quantity best explained the variation in N2O fluxes originating from denitrification and nitrification, respectively. Similarly to N2O peak emissions, short-term DOM changes during drying-rewetting transitions can be easily overlooked but are crucial for N2O flux dynamics. Thus, spectroscopic methods should be integrated into biogeochemical monitoring of different hydrological conditions (drying-rewetting cycles) to have a complete perspective of the role of DOM composition on N2O emissions. The results from this study point to the link between C metabolism and N2O production, providing insight into the effect of drying-rewetting cycles on the potential substrate supply for processes driving N2O emissions. This research gap deserves further research, namely studies across systems with different hydrological settings and land uses, to reinforce these findings. As our results suggest, in areas characterized by highly dynamic and extreme hydrological conditions, namely aquatic-terrestrial interfaces, drawdown areas and intermittent lotic and lentic ecosystems, these changes in DOM quality factors potentially play a significant role in N2O emissions and are still widely unexplored.
The original contributions presented in the study are included in the article/Supplementary Material, further inquiries can be directed to the corresponding author.
RP and TH conceived and designed the study. RP conducted the experimental work and performed the laboratory analysis. RH-N and PB assisted with stable isotope methodology and stable isotope analysis and data analysis. RP and MP performed data analysis. RP, GW, and TH wrote the paper with inputs from MP, AB, RH-N, and PB. All authors contributed to the article and approved the submitted version.
RP was supported by a Ph.D., grant from Fundação para a Ciência e a Tecnologia, I.P. (FCT), Portugal, under the Doctoral Programme FLUVIO—River Restoration and Management (PD/BD/114181/2016).
The authors declare that the research was conducted in the absence of any commercial or financial relationships that could be construed as a potential conflict of interest.
All claims expressed in this article are solely those of the authors and do not necessarily represent those of their affiliated organizations, or those of the publisher, the editors and the reviewers. Any product that may be evaluated in this article, or claim that may be made by its manufacturer, is not guaranteed or endorsed by the publisher.
We are grateful to Beate Pitzl, Gertraud Steniczka, Katharina Winter, Annette Puritscher, and Corinne Valette for their laboratory assistance and to Giseli Swerts, Elmira Akbari, and André Fonseca for their field assistance. The OMICS platform at the Mediterranean Institute of Oceanography (M.I.O) where biogas analyses were performed is in compliance with ISO9001-2015. We thank Nina Welti for her inputs and support with the stable isotope methodology.
The Supplementary Material for this article can be found online at: https://www.frontiersin.org/articles/10.3389/fsoil.2022.849210/full#supplementary-material
1. Durand P, Breuer L, Johnes PJ. Nitrogen processes in aquatic ecosystems. In: Sutton M, Howard C, Erisman J, Billen G, Bleeker A, Grennfelt P, Grinsven H, and Grizzeti B, editors. The European Nitrogen Assessment: Sources, Effects and Policy Perspectives. Cambridge University Press (2011).
2. Ivens W, Tysmans DJJ, Kroeze C, Lohr AJ, vanWijnen J. Modeling global N2O emissions from aquatic systems. Curr Opin Environ Sustain. (2011) 3:350–8. doi: 10.1016/j.cosust.2011.07.007
3. Maavara T, Lauerwald R, Laruelle G, Akbarzadeh Z, Bouskill N, Van Cappellen P, et al. Nitrous oxide emissions from inland waters: are IPCC estimates too high? Glob Change Biol. (2018) 25:473–88. doi: 10.1111/gcb.14504
4. McClain ME, Boyer EW, Dent CL, Gergel SE, Grimm NB, et al. Biogeochemical hot spots and hot moments at the interface of terrestrial and aquatic ecosystems. Ecosystems. (2003) 6:301–12. doi: 10.1007/s10021-003-0161-9
5. Goldman AE, Graham EB, Crump AR, Kennedy DW, Romero EB, Anderson CG, et al. Biogeochemical cycling at the aquatic–terrestrial interface is linked to parafluvial hyporheic zone inundation history. Biogeosciences. (2017) 14:4229–41. doi: 10.5194/bg-14-4229-2017
6. Pinto R, Weigelhofer G, Brito AG, Hein T. Effects of dry-wet cycles on nitrous oxide emissions in freshwater sediments: a synthesis. PeerJ. (2021) 9:e10767. doi: 10.7717/peerj.10767
7. Dorich CD, Conant RT, Albanito F, Butterbach-Bahl K, Grace P, Scheer C, et al. Improving N2O emission estimates with the global N2O database. Curr Opin Environ Sustain. (2020) 47:13–20. doi: 10.1016/j.cosust.2020.04.006
8. Downing J. Emerging global role of small lakes and ponds: little things mean a lot. Limnetica. (2008) 29:9–24. doi: 10.23818/limn.29.02
9. Marcé R, Obrador B, Gómez-Gener L, Catalán N, Koschorreck M, Arce M, et al. Emissions from drying phaseinland waters are a blind spot in the global carbon cycle. Earth Sci Rev. (2019) 188:240–8. doi: 10.1016/j.earscirev.2018.11.012
10. Baldwin DS, Mitchell AM. The effects of drying and re-flooding on the sediment and soil nutrient dynamics of lowland river-floodplain systems: a synthesis. Regul Rivers Res Manage. (2000) 16:457–67. doi: 10.1002/1099-1646(200009/10)16:5<457::AID-RRR597>3.0.CO;2-B
11. Borken W, Matzner E. Reappraisal of drying and wetting effects on C and N mineralization and fluxes in soils. Glob Change Biol. (2009) 15:808–24. doi: 10.1111/j.1365-2486.2008.01681.x
12. Congreves KA, Wagner-Riddle C, Si BC, Clough TJ. Nitrous oxide emissions and biogeochemical responses to soil freezing-thawing and drying -wetting. Soil Biol. Biochem. (2018) 117:5–15. doi: 10.1016/j.soilbio.2017.10.040
13. Quick AM, Reeder WJ, Farrell TB, Tonina D, Feris KP, Benner SG. Nitrous oxide from streams and rivers: a review of primary biogeochemical pathways and environmental variables. Earth Sci Rev. (2019) 191:224–62. doi: 10.1016/j.earscirev.2019.02.021
14. Pinto RMS, Weigelhofer G, Diaz-Pines E, Brito AG, Zechmeister-Boltenstern S, Hein T. River-floodplain restoration and hydrological effects on GHG emissions: biogeochemical dynamics in the parafluvial zone. Sci Total Environ. (2020) 715:136980. doi: 10.1016/j.scitotenv.2020.136980
15. Qiu S, McComb AJ. Drying-induced stimulation of ammonium release and nitrification in reflooded lake sediment. Mar Freshw Res. (1996) 47:531–36. doi: 10.1071/MF9960531
16. Arce MI, Sánchez-Montoya MM, Vidal-Abarca MR, Suárez ML, Gómez R. Implications of flow intermittency on sediment nitrogen availability and processing rates in a mediterranean headwater stream. Aquat Sci. (2014) 76:173–86. doi: 10.1007/s00027-013-0327-2
17. Merbt SN, Proia L, Prosser JI, Mart í E, Casamayor EO, von Schiller D. Stream drying drives microbial ammonia oxidation and first-flush nitrate export. Ecology. (2016) 97:2192–8. doi: 10.1002/ecy.1486
18. Arce MI, von Schiller D, Bengtsson MM, Hinze C, Jung H, Eloy Alves RJ, et al. Drying and rainfall shape the structure and functioning of nitrifying microbial communities in riverbed sediments. Front Microbiol. (2018) 9:2794. doi: 10.3389/fmicb.2018.02794
19. Gómez R, Arce MI, Sánchez JJ, Sanchez-Montoya MM. The effects of drying on sediment nitrogen content in a Mediterranean intermittent stream: a microcosms study. Hydrobiologia (2012) 679:43–59. doi: 10.1007/s10750-011-0854-6
20. Fromin N, Pinay G, Montuelle B, Landais D, Ourcival JM, Joffre R, et al. Impact of seasonal sediment desiccation and rewetting on microbial processes involved in 581 greenhouse gas emissions. Ecohydrology (2010) 3:339–48. doi: 10.1002/eco.115
21. Harjung A, Sabater F, Butturini A. Hydrological connectivity drives dissolved organic matter processing in an intermittent stream. Limnologica. (2018) 68:71–81. doi: 10.1016/j.limno.2017.02.007
22. Vázquez E, Amalfitano S, Fazi S, Butturini A. Dissolved organic matter composition in a fragmented mediterranean fluvial system under severe drought. Biogeochemistry. (2011) 102:59–72. doi: 10.1007/s10533-010-9421-x
23. von Schiller D, Graeber D, Ribot M, Timoner X, Acuña V, Marti E, et al. Hydrological transitions drive dissolved organic matter quantity and composition in a temporary mediterranean stream. Biogeochemistry. (2015) 123:429–46. doi: 10.1007/s10533-015-0077-4
24. Barnes R, Smith R, Aiken GR. Linkages between denitrification and dissolved organic matter quality, boulder creek watershed, Colorado. J Geophys Res Biogeosci. (2012) 117:e2011JG001749. doi: 10.1029/2011JG001749
25. Stevens RJ, Laughlin RJ, Atkins GJ, Prosser SJ. Automated determination of nitrogen-15-labeled dinitrogen and nitrous oxide by mass spectrometry. Soil Sci Soc Am J. (1993) 57:981–8. doi: 10.2136/sssaj1993.03615995005700040017x
26. Hood-Nowotny R, Hinko-Najera N, Inselsbacher E, Lachouani P, Wanek W. Alternative methods for measuring inorganic, organic, and total dissolved nitrogen in soil. Soil Sci Soc Am J. (2010) 74:1018–27. doi: 10.2136/sssaj2009.0389
27. Morse JL, Bernhardt ES. Using 15N tracers to estimate N2O and N2 emissions from nitrification and denitrification in coastal plain wetlands under contrasting land-uses. Soil Biol Biochem. (2013) 57:635–43. doi: 10.1016/j.soilbio.2012.07.025
28. McKnight DM, Boyer EW, Westerhoff PK, Doran PT, Kulbe T, Andersen DT. Spectrofluorometric characterization of DOM for indication of precursor material and aromaticity. Limnol Oceanogr. (2001) 46:38–48. doi: 10.4319/lo.2001.46.1.0038
29. Kothawala DN, Murphy KR, Stedmon CA, Weyhenmeyer GA, Tranvik LJ. Inner filter correction of dissolved organic matter fluorescence. Limnol Oceanogr. Methods. (2013) 11:616–30. doi: 10.4319/lom.2013.11.616
30. Weigelhofer G, Jirón TS, Yeh TC, Steniczka G, Pucher M. Dissolved organic matter quality and biofilm composition affect microbial organic matter uptake in stream flumes. Water. (2020) 12:3246. doi: 10.3390/w12113246
31. Massicotte P. eemR: Tools for Pre-Processing Emission-Excitation-Matrix (EEM) Fluorescence Data. (2020). Available online at: https://cran.r-project.org/package=eemR
32. Pucher M, Wünsch U, Weigelhofer G, Murphy K, Hein T, Daniel G. staRdom: versatile software for analyzing spectroscopic data of dissolved organic matter in R. Water. (2019) 11:2366. doi: 10.3390/w11112366
33. Huguet A, Vacher L, Relexans S, Saubusse S, Froidefond J, Parlanti E. Properties of fluorescent dissolved organic matter in the Gironde Estuary. Org Geochem. (2009) 40:706–19. doi: 10.1016/j.orggeochem.2009.03.002
34. Zsolnay A, Baigar E, Jimenez M, Steinweg B, Saccomandi F. Differentiating with fluorescence spectroscopy the sources of dissolved organic matter in soils subjected to drying. Chemosphere. (1999) 38:45–50. doi: 10.1016/S0045-6535(98)00166-0
35. Cory RM, McKnight DM. Fluorescence spectroscopy reveals ubiquitous presence of oxidized and reduced quinones in DOM. Environ Sci Technol.. (2005) 39:8142–9. doi: 10.1021/es0506962
36. Coble PG. Marine optical biogeochemistry: the chemistry of ocean color. Chem Rev. (2007) 107:402–18. doi: 10.1021/cr050350+
37. Dong W, Wan J, Tokunaga T, Gilbert B, Williams KH. Transport and humification of dissolved organic matter within a semi-arid floodplain. J Environ. Sci. (2017) 57:24–32. doi: 10.1016/j.jes.2016.12.011
38. Hansen AM, Kraus TEC, Pellerin BA, Fleck JA, Downing BD, Bergamaschi BA. Optical properties of dissolved organic matter (DOM): effects of biological and photolytic degradation. Limnol Oceanogr. (2016) 61:1015–32. doi: 10.1002/lno.10270
39. Bro R. PARAFAC. Tutorial and applications. Chemometr Intel Lab Syst. (1997) 38:149–71. doi: 10.1016/S0169-7439(97)00032-4
40. Murphy KR, Stedmon CA, Graeber D, Bro R. Fluorescence spectroscopy and multi-way techniques. Anal Methods. (2013) 5:1–29. doi: 10.1039/c3ay41160e
41. Murphy KR, Stedmon CA, Wenig P, Bro R. OpenFluor– an online spectral library of auto-fluorescence by organic compounds in the environment. Anal Methods. (2014) 6:658–61. doi: 10.1039/C3AY41935E
42. Hsu TC, Kao SJ. Technical note: simultaneous measurement of sedimentary N2 and N2O production and a modified 15N isotope pairing technique. Biogeosciences. (2013) 10:7847–62. doi: 10.5194/bg-10-7847-2013
43. Trimmer M, Risgaard-Petersen N, Nicholls JC, Engström P. Direct measurement of anaerobic ammonium oxidation (anammox) and denitrification in intact sediment cores. Mar Ecol Prog Ser. (2006) 326:37–47. doi: 10.3354/meps326037
44. Master Y, Shavit U, Shaviv A. Modified isotope pairing technique to study N transformations in polluted aquatic systems: theory. Environ Sci Technol. (2005) 39:1749–56. doi: 10.1021/es049086c
45. Kim DG, Vargas R, Bond-Lamberty B, Turetsky MR. Effects of soil rewetting and thawing on soil gas fluxes: a review of current literature and suggestions for future research. Biogeosciences. (2012) 9:2459–83. doi: 10.5194/bg-9-2459-2012
47. Oksanen J, Simpson GL, Blanchet FG, Kindt R, Legendre P, Minchin PR, et al. vegan: Community Ecology Package. R package version 2.5-6 (2019). Available online at: https://CRAN.R-project.org/package=vegan
48. Martinez Arbizu P. pairwiseAdonis: Pairwise Multilevel Comparison Using Adonis. R Package Version 0.4 (2020).
49. Cohen J. Statistical Power Analysis for the Behavioral Sciences. Second edition. Hillsdale, NJ: Lawrence Earlbaum Associates (1988)
50. Kassambara A. rstatix: Pipe-Friendly Framework for Basic Statistical Tests. R package version 0.6.0 (2020). Available online at: https://CRAN.R-project.org/package=rstatix
51. Koschorreck M. Nitrogen turnover in drying sediments of an amazon floodplain lake. Microb Ecol. (2005) 49:567–77. doi: 10.1007/s00248-004-0087-6
52. Arango CP, Tank JL. Land use influences the spatiotemporal controls of nitrification and denitrification in headwater streams. J North Am Benthol Soc. (2008) 27:90–107. doi: 10.1899/07-024.1
53. Beaulieu JJ, Tank JL, Hamilton SK, Wollheim WM, Hall RO, Mulholland PJ, et al. Nitrous oxide emission from denitrification in stream and river networks. Proc Natl Acad Sci USA. (2011) 108:214–9. doi: 10.1073/pnas.1011464108
54. Rabot E, Hénault C, Cousin I. Temporal variability of nitrous oxide emissions by soils as affected by hydric history. Soil Sci Soc Am J. (2014) 78:434–44. doi: 10.2136/sssaj2013.07.0311
56. Reverey F, Grossart HP, Premke K, Lischeid G. Carbon and nutrient cycling in kettle hole sediments depending on hydrological dynamics: a review. Hydrobiologia. (2016) 775:1–20. doi: 10.1007/s10750-016-2715-9
57. Febria CM, Hosen JD, Crump BC, Palmer MA, Williams DD. Microbial responses to changes in flow status in temporary headwater streams: across-system comparison. Front Microbiol. (2015) 6:522. doi: 10.3389/fmicb.2015.00522
58. Benner R. Molecular indicators of the bioavailability of dissolved organic matter. In: Findlay SEG, Sinsabaugh RL, editors. Aquatic Ecosystems: Interactivity of Dissolved Organic Matter. Amsterdam: Elsevier (2003). p. 121–37. doi: 10.1016/B978-012256371-3/50006-8
59. Seitzinger SP. Linkages between organic matter mineralization and denitrification in eight riparian wetlands. Biogeochemistry. (1994) 25:19–39. doi: 10.1007/BF00000510
60. Webster JR, Meyer JL. Organic matter budgets for streams: a synthesis. J North Am Benthol Soc. (1997) 16:141–61. doi: 10.2307/1468247
61. Pucher M, Fldl P, Graebner D, Felsenstein K, Hein T, Weigelhofer G. Complex interactions of in-stream dissolved organic matter and nutrient spiralling unravelled by Bayesian regression analysis. Biogeosciences (2021) 18:3103–22. doi: 10.5194/bg-18-3103-2021
62. Massicotte P, Frenette JJ. Spatial connectivity in a large river system: resolving the sources and fate of dissolved organic matter. Ecol Applic. (2011) 21:2600–17. doi: 10.1890/10-1475.1
63. Fellman JB, Dogramaci S, Skrzypek G, Dodson W, Grierson PF. Hydrologic control of dissolved organic matter biogeochemistry in pools of a subtropical dryland river. Water Resourc Res. (2011) 47:W06501. doi: 10.1029/2010WR010275
64. Strauss EA, Lamberti GA. Regulation of nitrification in aquatic sediments by organic carbon. Limnol Oceanogr. (2000) 45:1854–9. doi: 10.4319/lo.2000.45.8.1854
Keywords: N2O, nitrification, denitrification, drying-rewetting, sediments, floodplain
Citation: Pinto R, Weigelhofer G, Pucher M, Hood-Nowotny R, Bonin P, Brito AG and Hein T (2022) Dry-Wet Cycles Affect Nitrous Oxide Emissions Across Aquatic-Terrestrial Interfaces: A Mesocosms Study. Front. Soil Sci. 2:849210. doi: 10.3389/fsoil.2022.849210
Received: 05 January 2022; Accepted: 21 April 2022;
Published: 16 May 2022.
Edited by:
Sonja Leitner, International Livestock Research Institute (ILRI), KenyaReviewed by:
Gretchen Maria Gettel, IHE Delft Institute for Water Education, NetherlandsCopyright © 2022 Pinto, Weigelhofer, Pucher, Hood-Nowotny, Bonin, Brito and Hein. This is an open-access article distributed under the terms of the Creative Commons Attribution License (CC BY). The use, distribution or reproduction in other forums is permitted, provided the original author(s) and the copyright owner(s) are credited and that the original publication in this journal is cited, in accordance with accepted academic practice. No use, distribution or reproduction is permitted which does not comply with these terms.
*Correspondence: Renata Pinto, cmVuYXRhbXNwaW50b0BzYXBvLnB0
Disclaimer: All claims expressed in this article are solely those of the authors and do not necessarily represent those of their affiliated organizations, or those of the publisher, the editors and the reviewers. Any product that may be evaluated in this article or claim that may be made by its manufacturer is not guaranteed or endorsed by the publisher.
Research integrity at Frontiers
Learn more about the work of our research integrity team to safeguard the quality of each article we publish.