 Eleanor E. Lucadamo1
 Sam E. Wortman
 Anthony C. Yannarell
94% of researchers rate our articles as excellent or good
Learn more about the work of our research integrity team to safeguard the quality of each article we publish.
Find out more
ORIGINAL RESEARCH article
Front. Soil Sci., 10 February 2022
Sec. Soil Biology, Ecosystems and Biodiversity
Volume 2 - 2022 | https://doi.org/10.3389/fsoil.2022.824087
This article is part of the Research TopicManagement of agroecosystems for enhancement of soil microbial communities and soil natural fertilityView all 10 articles
Cover crops can continue to affect agricultural systems even after they have been terminated by influencing nitrogen dynamics and by altering soil microbial communities. These post-termination effects can influence soil fertility, weed pressure, and the dynamics of potential plant pathogens in the narrow window of time between cover crop termination and cash crop emergence. We evaluated the post-termination effects of 12 different spring-sown cover crop mixtures and monocultures on soil nitrogen and microbial communities on two different organic farms in Central Illinois (on Lawson silt loam soil) and Northern Illinois (on Virgil silt loam soil). In comparison to control plots with no cover crops, all cover crop treatments significantly reduced soil nitrate levels but increased the potentially mineralizable nitrogen pool following termination. Nitrate levels of cover crop plots approached those of controls after 2 and 4 weeks, respectively, but potentially mineralizable nitrogen levels in cover plots remained elevated for at least 4 weeks following termination. Monocultures of Brassica cover crops showed the greatest decrease in soil nitrate, while Brassicas and unplanted control plots containing high biomass of weeds showed the greatest increase in potentially mineralizable nitrogen in comparison to plant-free control plots. In contrast to their effect on soil nitrogen, cover crops had very limited impact on the composition of soil microbial communities. Overall microbial community composition varied across sites and years, and only soil fungi significantly responded to cover cropping treatments. Nevertheless, we found that some highly correlated groups of soil microbes showed significant responses to soil nitrate and to high plant biomass. Key members of these correlated groups included ammonia-oxidizing organisms and saprotrophic fungi. Our results suggest that cover crops may reduce the potential for springtime nitrogen leaching losses by retaining nitrogen in the soil organic pool, and they may also have impacts on the soil microbial community that are particularly relevant for nitrogen cycling and decomposition of plant residues.
Cover crops are important tools employed in organic agriculture to improve soil quality and fertility (1–4). Living cover crops can prevent soil erosion during fallow periods and compete directly with weeds for sunlight and nutrients (5, 6). However, cover crops can continue to effect the soil system after they have been terminated, and these impacts can persist for hours, days, or weeks (7). For example, red clover cover crop residues suppressed weed seed germination for 30 days after termination through a combination of allelochemical release and stimulation of weed-suppressive microbial activity (8). These post-termination effects of cover crops can influence the soil microbial environment by altering nutrient pools, rates of residue decomposition, and relative abundance of plant mutualists and pathogens (9–18). Even if post-termination cover crop effects are short-lived, they can have important impacts on agriculture because they occur in a critical window of time when agroecosystems are subject to pressure from early season weeds and increased risk of soil nitrogen leaching losses (19, 20).
Living cover crops, their decaying “green manure” residues, and the soil microbial community can all influence the amount, timing, and the form of plant-available nitrogen (1, 21). These effects can vary widely across different combinations of plant and microbial species. Winter and spring cover crops can be used to take up excess or residual nitrates in the soil over the fallow season (22), reducing nitrate leaching and deprive early season weeds of nitrogen (5, 6). Grasses like oat (Avena sativa) and spring wheat (Triticum aestivum) are particularly good at this (2, 22–25). Legume species such as field pea (Pisum sativum) and fava bean (Vicia faba) can provide significant nitrogen contributions to agricultural systems via nitrogen fixation (26, 27). Plants of the family Brassicaceae can rapidly accumulate biomass to choke out weeds and sequester nitrogen (28), but they also produce allelopathic chemicals that can reduce plant growth and microbial activity (29, 30).
Upon termination, cover crop residues release nitrogen back to the soil, where the processes of decomposition, nitrogen mineralization, and nitrogen immobilization are governed by soil microorganisms interacting with plant tissues of varying qualities and composition. Soil microorganisms have a threshold carbon to nitrogen ratio (C:N) of 26:1. Plants with lower C:N ratios result in net nitrogen mineralization, while residues with higher C:N result in net nitrogen immobilization (31, 32). Legumes, which have low C:N ratios of 10–15 (33, 34), decompose rapidly as organic nitrogen is mineralized into plant-available forms (nitrate and ammonium) once microbial nitrogen demand is satisfied (35, 36). Grasses have high C:N ratios, ranging from 33 to 94 for oat and wheat, respectively (13, 31), and this can result in slower residue decomposition and net immobilization of nitrogen (37). The combination of high grass biomass and high C:N ratio results in less inorganic nitrogen made available for the crops that follow. Though there is variation among Brassicas, they vary between 10 and 31 C:N ratios of their plant tissues (38–40), so they are generally below the 26:1 microbial threshold. However, Brassica allelopathic secondary metabolites can suppress microbial decomposition and nitrogen mineralization (6, 21, 41, 42), which can result in slower overall conversion of organic nitrogen to plant-available forms (28).
In addition to their effect on soil nitrogen pools, cover crops can also affect soil-borne pathogen prevalence and promote plant-beneficial microbes. Cover cropping with canola (Brassica napus L.) was shown to reduce the incidence of disease caused by Rhizoctonia solani in potato (10) and apple (43). Many beneficial, pathogen-antagonistic, soil bacteria and fungi have also been identified to respond positively cover cropping (10, 15, 16). Wheat has also been found to enrich fungal diversity and reduce pathogen populations compared to oat (44). In general, more diverse microbial communities have been shown to experience a greater degree of resilience and are better equipped to suppress potentially pathogenic taxa (16, 45–47). However, fungi tend to cause more damage to agricultural crops than bacteria (46), so is not always the case that increased fungal diversity is a net benefit for crops. In order to fully understand how cover crops influence the soil in ways that can promote or hinder future crop growth, we need to identify specific microbial taxa that respond to cover cropping with different plant species.
Legumes, grasses, and simple mixtures of the two are most commonly used cover crops (5, 6, 48). Mustards and other plants from the Brassicaceae family can be used as short-season cover crops in the cooler climates of the upper Midwest (49), and they are sometimes included with other cover crop species as part of diverse mixtures (50). While there is considerable research showing that cover crops shape the soil microbial community (5, 6, 10, 15, 16), it is not well-understood if more diverse mixtures of grass, legume, and Brassica species yield increased benefits to soil quality and microbiology that may, in turn, improve subsequent crop growth. Planting diverse cover crop mixtures may allow us to take advantage of the myriad effects of different plant types on soil fertility and microbiology, and there is a growing popularity in the use of diverse cover crop mixtures, or “cocktails,” in the organic farming community (3, 5, 24, 51–54). In this study, we aimed to investigate whether different multi-species cover crop mixtures had differential effects on soil nitrogen pools and soil microbial composition in the weeks following cover crop termination. By looking at six species of cover crops grown in monocultures and diverse, five-species mixtures, we sought to answer the following questions: (1) do the dynamics of soil nitrogen pools (nitrate, ammonium, and potentially mineralizable nitrogen) vary among different cover crop combinations; (2) how do soil microbial communities change as a result of cover cropping with different plant types (grasses, weeds, Brassicas, legumes, or mixtures); and (3) what are the most important drivers in determining the dynamics of microbial communities following cover crop termination?
Our research took place as part of the same field experiment that has been previously described by Holmes and colleagues (55). Two organic vegetable farms participated in the experiment in 2015 and 2016: PrairiErth Farm in Atlanta, IL (40°13'N 89°13'W) and Kinnikinnick Farm in Caledonia, IL (42°27'N 88°52'W). The soil type at PrairiErth farm was Lawson silt loam (fine-silty, mixed, superactive, mesic Aquic Cumulic Hapludoll), and the dominant soil type at Kinnikinnick farm was Virgil silt loam (fine-silty, mixed, superactive, mesic Udollic Endoaqualf). Cropping history at both sites was highly varied, including both vegetable and grain crops. Both farms were certified organic under the United States Department of Agriculture National Organic Program guidelines; Kinnikinnick Farm since 1994 and PrariErth Farm since 2004.
Spring-sown cover crops were planted in a randomized complete block design with four replicates of 12 treatments and two controls. Blocks were 4 m by 56 m in size, with each block accommodating fourteen 4 m by 4 m plots for the treatments (twelve cover crop plantings and two controls). Six cover crops were included in the study: two grasses (oat, Avena sativa, and spring wheat, Triticum aestivum), two legumes (field pea, Pisum sativum, and fava bean, Vicia faba) and two Brassicas (Yellow mustard, Sinapis alba, and purple top turnip, Brassica campestris). A “weedy” control treatment was included that received no cover crop seed but allowed volunteer weed growth, and the experiment also included a plant-free control maintained by hand-pulling. Cover crops were planted in monocultures and all possible five-species mixtures for a total of six monocultures and six mixture treatments with two controls. For subsequent analyses, the 14 cover crops will be referred to as “cover crop treatments.” Cover crop diversity refers to whether the treatment was a mixture, monoculture, or control. Seeding application rates were as described by Holmes et al. (55). Cover crops were planted in early (PrariErth) or late (Kinnikinnick) April by hand-broadcasting, and seeds were lightly incorporated using gravel rakes and drag harrows. Cover crops grew for ~2 months before termination by mowing and rotavation to a depth of 15 cm.
Aboveground cover crop biomass was measured from two randomly-tossed quadrats (45.7 cm by 61 cm) immediately before termination, as previously described (55). Weeds, which were treated as a single “species,” were separated from cover crops and weighed separately. Dry weights were calculated for each cover crop species and used for subsequent analyses.
We sought to investigate the short-term impacts of cover crops in the period between termination and when typical cash crops would emerge. We collected soil samples from plots for three time points after cover crop termination: within 1 week (immediate effects), after 1 or 2 weeks (medium-term effects), and after 4 weeks (at typical crop emergence). Precise sampling dates varied for each site-year, depending on weather and soil conditions. In 2015, soils from each plot were collected at 3, 7, and 34 days post-termination at PrariErth and 6, 18, and 32 days post-termination at Kinnikinnick. In 2016, samples were collected 3, 17, and 33 days post-termination at PrairiErth and 5, 14, and 34 days post-termination at Kinnikinnick. From each plot, we collected 16 randomly-spaced soil cores down to depth of 10 cm, and we combined these cores to obtain a single composite sample for each plot. For microbial community composition (see below) a subsample of ~20 g was collected immediately from each composite sample, and then frozen at −20°C and freeze-dried for DNA extraction. Approximately 50 g of the remaining soil was air-dried for subsequent nitrogen content analysis.
Soil inorganic nitrogen content was assessed using standard methods for plant-available, exchangeable ammonium and nitrate through KCl-extraction (56) followed by colorimetric quantification of nitrate and ammonium. For each sample, two subsamples of 10 ± 0.05 g were weighed into 50 mL centrifuge tubes. One subsample was incubated anaerobically to quantify potentially mineralizable organic nitrogen (see below), while the other was processed immediately for inorganic nitrogen content.
For inorganic nitrogen extraction, 40 mL 1 M KCl was added and samples were shaken at approximately 240 rotations per minute at room temperature for 50 min. Nitrate and ammonium contents were quantified by colorimetric reactions. Nitrate analysis followed Doane and Horwath (57): a solution of sulfanilamide and N-(1-napththyl)-ethylenedaimine dihydrochloride in saturated vanadium (III) chloride was combined with each KCl extract and incubated in the dark for 4 h. Ammonium analysis followed Weatherburn (58): a solution of sodium salicylate, sodium citrate, sodium tartrate and sodium nitroprusside was combined with each KCl extract and with a 2% bleach:1.5 M sodium hydroxide solution and incubated for 50 min at room temperature. Absorbance values were measured at 540 nm for nitrate and 650 nm for ammonium to colorimetrically quantify nitrogen concentration using Epoch Biotek plate reader spectrophotometer and Gen5 software. Standard curves of known concentrations of KNO3 and (NH4)2SO4 were used to measure nitrate and ammonium concentrations, respectively. For all nitrogen assay results, concentrations were converted to mg/kg soil.
Potentially mineralizable nitrogen (PMN) was measured following protocols adapted from Drinkwater et al. (59) and Moebius-Clune et al. (60). The anaerobic incubation subsamples were combined with 10 mL ddH2O and the headspace was cleared of O2 with the addition of He gas to create a waterlogged, anaerobic environment in order to inhibit the oxidation of ammonium. These subsamples were incubate anaerobically at 37°C for 7 days in order to accumulate mineralized ammonium. Total PMN was determined by measuring the ammonium concentration following the protocol described above. PMN was calculated as the difference in ammonium concentration after and before the 7-day incubation.
Whole-community microbial DNA was extracted from freeze-dried soil samples using the FastDNA Spin Kit for Soil (MP Biomedicals, Solon, OH) following the manufacturer's protocol. Extracted DNA was purified at 65°C for 15 min with 1% cetyl-trimethylammonium bromide (CTAB) to remove humic acids. Samples were further extracted with 24:1 chloroform: alcohol to remove residual impurities. DNA was precipitated and washed three times with ethanol, then dried in a vacuum concentrator and dissolved in 1 x Tris-EDTA buffer. The purified DNA was adjusted to ~20 ng/μL and stored at −80°C until further analysis.
To prepare samples for sequencing, 10 μL of each sample was added to a 96-well PCR plate and sequenced on a single flow cell using Illumina MiSeq V3 platform at W. M. Keck Center for Comparative and Functional Genomics at the University of Illinois at Urbana-Champaign. For bacteria and archaea, the V4-V5 region of 16S rRNA was sequenced using primers 515F (5'-GTGYCAGCMGCCGCGGTAA-3') and 806R (5'-GGACTACVSGGGTATCTAAT-3') (61). For fungi, the internal transcribed spacer (ITS) region between the 18S and large subunit rRNA genes was sequenced using primers ITS3-F (5'-GCATCGATGAAGAACGCAGC-3') and ITS4-R (5'-TCCTCCGCTTATTGATATGC-3') (62). Samples for 2015 and 2016 were sequenced separately and combined for downstream analyses. A total of 22,722,058 raw reads were obtained from samples in 2015 and 21,685,014 in 2016 from both bacterial and fungal sequences. Library size ranged from 3,979 to 112,830 sequences per sample for the fungal ITS region with a mean of 16,997 sequences per sample, and 3,551–102,839 sequences per sample from the bacterial V4 region with a mean of 12,280 sequences per sample.
Sequence files were obtained as fastq files. Paired-end 16S sequences were merged using Fast Length Adjustment of Short reads (FLASH) software (63). Quality filtering of fastq files was performed using the FASTX-Toolkit software; sequence reads with a quality score of <30 and with fewer than 90% of bases were removed (64). Sequences were binned into discrete operational taxonomic units (OTUs) based on 97% similarity using usearch (65). Quantitative Insight into Microbial Ecology (MacQIIME version 1.9.2) was used for aligning and assigning of sequences (66). Sequences were aligned using the basic local alignment search tool (BLAST), and taxonomy was assigned based on the Greengenes reference database for bacteria and archaea and the UNITE database for fungi (67–69). Sequences identified as plants, protists, chloroplasts, and mitochondria were removed. Read counts were rarefied to 5,100 for bacterial sequences and 2,900 for fungal sequences. After rarefying, there were 527 samples from which 16,069 unique bacterial and 112 unique archaeal OTUs and were detected from the 16S rRNA gene. For the fungal sequences, there were 560 samples from which 4,932 fungal OTUs were identified from the ITS region after rarifying. Sequences have been uploaded to GenBank, BioProject # PRJNA503856.
Data sets and R code to perform the following analyses are available online at https://github.com/acyann/post-termination-cover-crops.
We examined whether soil nitrogen levels differed between mixtures, monocultures and controls. We combined cover crop treatments by functional group and/or mixture, and therefore these analyses used the following treatment groups: brassica monocultures (mustard and turnip), grass monocultures (wheat and oat), legume monocultures (pea and bean), mixtures, and controls (plant-free or weedy). We also examined whether these patterns changed over time after termination. For these analyses, we used three complete site-years and one partial site-year due to experimental problems at PrairiErth in 2016 (55). Each complete site-year included 56 plots (12 treatments x 4 blocks), sampled at three time points. For PrairiErth 2016, we only included soil data for brassica monocultures (mustard and turnip) and the two controls (4 plots x 4 blocks), sampled at three time points. All data were analyzed using R software version 4.1.1 (70). Linear mixed effects models were used to determine how cover crop type influenced measures of soil nitrogen and total soil phenolic content using the packaged nlme version 3.1-153 (71). We fit separate models for each of the three time points (1, 2, and 4 weeks following termination), and we evaluated each of the three nitrogen species (nitrate, ammonium, and PMN) separately. Cover crop type was treated as the fixed effect and year, site, and replicate as nested random effects. Models were fit using the maximum likelihood approach. To test for mean differences between treatment groups (i.e., cover crop type), Tukey's Honestly Significant Difference (HSD) post-hoc tests were run using the package multcomp version 1.4-18 (72). Results of the linear mixed models and Tukey HSD tests were considered significant at the level of alpha <0.05.
Data sets and R code to perform the following analyses are available online at https://github.com/acyann/post-termination-cover-crops.
To parallel the soil nitrogen analyses described above, we examined whether soil nitrogen levels differed between mixtures, monocultures and controls, and also over time following termination. We used the same samples as described above (three complete site-years, plus a limited set of samples from PrairiErth 2016), and we used the same treatment groups defined by plant functional group. We used permutational multivariate analysis of variance (PERMANOVA) with the function “adonis” from the R package vegan version 2.5-7 (73). All analyses used the Bray-Curtis distance matrix with 999 permuations to construct the null distribution. We first ran a PERMANOVA model including site, year, and their interaction in order to determine if these random effects influenced microbial communities. We then tested for the effect of time and cover crop treatment using a restricted permutation scheme by stratifying on the random effects site and year (for the test of time since termination) or site, year, and time (for the test of cover crop treatment). We visualized patterns in microbial community composition through two-dimensional non-metric multidimensional scaling of the Bray-Curtis matrix.
To provide a more in-depth analysis of microbial responses, we also examined correlations between microbial taxa and various environmental drivers in our data set, including soil nitrogen, site/year/time, and cover crop biomass. For this analysis, we conducted a weighted gene co-expression network analysis (WGCNA), which has previously been used for soil microbiome analysis in a variety of soil environments (74–77). We only used samples from the three complete site-years, because we did not have biomass data from PrairiErth in 2016 (55). We further restricted this analysis to the most abundant microbial taxa in our sample set. For both 16S and ITS, OTU tables were either filtered to exclude OTUs with a relative abundance of <0.01% or to include only the top 1000 OTUs, whichever method was more restrictive. The abundances of these top OTUs were normalized using the total sum scaling (TSS) method and then log2 transformed.
We then conducted a weighted gene co-expression network analysis (WGCNA) to determine patterns of co-occurrence among OTUS and between these OTU groups and our environmental data. WGCNA first uses network analysis to identify highly correlated “modules” of OTUs that respond in concert, and then it seeks to identify environmental correlates for each of these modules. For this analysis, we used the package WGCNA version 1.70-3 (78, 79). The network was constructed based on the patterns of interactions across OTUs. A dendrogram was constructed, which creates a hierarchical topology for the network. From this point, a soft threshold was applied, which guides where the dendrogram is cut, and that cut separates the network into modules that display co-abundance. The location where the dendrogram is cut is determined by the topological features, expressed as the variable β, which is selected based on where graphs describing the scale independence and mean connectivity level off. This value sets the power for blockwise module construction (80). For the 16S network, β = 5 was used; for the ITS network, β = 6 was used. The minimum module size was set to 20 OTUs. This generated four modules for the 16S network and three modules for the ITS network. Correlation values between modules and environmental data (cover crop type, soil nitrogen, etc.) were generated on a heat map. Hub taxa were identified as the taxa in each module with a module correlation of R > 0.70 or R < −0.70. Taxonomy was visualized using ggplot2 (81). Heatmaps were visualized using WGCNA.
Across all site years, soil nitrate concentrations were greatest in the plant-free control plots within the 1st week after cover crop termination (Figure 1A). Soil nitrate in brassica plots was significantly lower than in the plant-free control plots during the 1st week, but there was no significant difference in soil nitrate across any of the cover crop monocultures or mixtures. Soil nitrate levels decreased over the 4-week post-termination period, particularly for the plant-free control plots, which were indistinguishable from cover crop plots by the 2nd week after termination (Figure 1A). By the 4th week, all soil nitrate levels were statistically indistinguishable across plots.
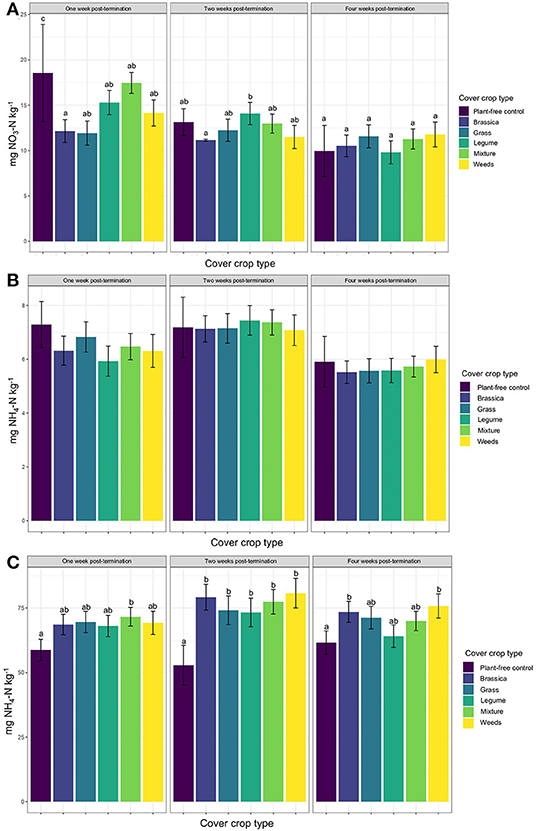
Figure 1. Mean soil (A) nitrate, (B) ammonium, and (C) potentially mineralizable nitrogen (PMN) over the course of the 4 week sampling period post-cover crop termination, by cover crop type. Letters indicate significant differences from the plant-free control from Tukey's HSB post-hoc test (p < 0.05).
Soil ammonium levels were not statistically different across any cover crop treatment or controls at any time point after termination (Figure 1B). Soil ammonium levels tended to be highest during the 2nd week after termination, although the levels in plant-free controls were also high within the 1st week (Figure 1B).
Levels of potentially mineralizable organic nitrogen (PMN) were elevated in all cover crop plots relative plant-free controls, although this elevation was only statistically significant for cover crop mixtures (Figure 1C). All cover crop monocultures and mixtures had significantly higher PMN than plant-free controls by the 2nd week (Figure 1C), and PMN levels were highest overall at this time. By week four, only the brassica and weedy-control plots had significantly higher PMN than plant-free controls, with all other cover crop treatments having intermediate PMN values.
Site, year, and their interaction were significant predictors of soil bacterial and fungal community composition (Table 1), so we used stratification in subsequent models to test for effects of time and cover crop treatment. When stratified within site and year, time since termination was significant for both bacterial and fungal community composition (Table 1). When stratified within site, year, and time, cover crop type was a significant predictor of fungal community composition, but not of bacterial community composition (Table 1). Non-metric multidimensional scaling of microbial communities primarily reflected the overwhelming influence of site-year differences (Supplementary Figures 1, 2).
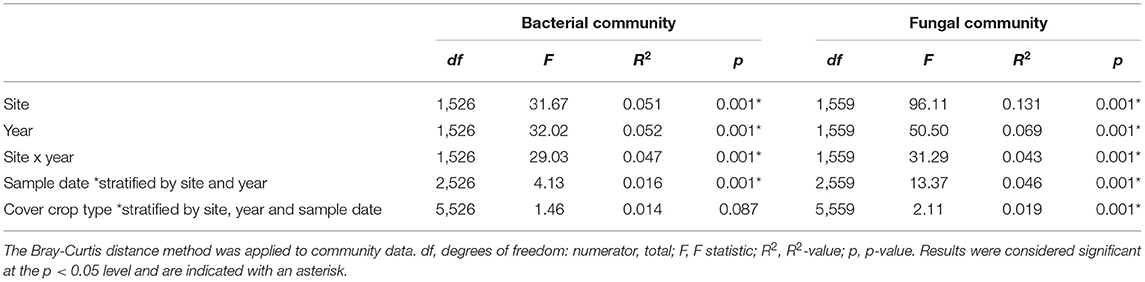
Table 1. PERMANOVA tests were carried out on the entire dataset to evaluate the influences of site, year, cover crop type, cover crop diversity or sample date influenced bacterial and fungal community composition.
A total of four modules were identified by the WGCNA analysis for 16S data (Figure 2 and Table 2). The composition of the four modules was taxonomically distinct, and the relative proportions of phylum-level representation of the modules differed greatly with that of the overall soil microbiome (Figure 2). Module 1 was largely composed of Actinobacteria, Crenarcheaota, and Proteobacteria; Module 2 Proteobacteria and Bacteroidetes; Module 3 Acidobacteria, Actinobacteria, and Proteobacteria; and Module 4 Actinobacteria, Crenarchaeota, and Proteobacteria. Module 1 was most positively correlated with 2015 sampling year (R = 0.19, p < 0.05), Kinnikinnick farm (R = 0.50, p < 0.05), and weed biomass (R = 0.31, p < 0.05) (Figure 3). The hub taxa in Module 1 included mostly unclassified Candidatus Nitrososphaera, a type of ammonia-oxidizing Archaea (Table 2). Module 2 was most positively correlated with 2016 sampling year (R = 0.64, p < 0.05) and most negatively correlated with soil nitrate (R = −0.36, p < 0.05), soil ammonium (R = −0.36, p < 0.05), soil PMN (R = −0.23, p < 0.05), weed biomass (R = −0.41, p < 0.05), and total biomass (R = −0.26, p < 0.05). The hub taxa in Module 2 included both Flavobacterium spp. (Bacteroidetes) and Beta- and Gamma-proteobacteria. Module 3 was most positively correlated with PrariErth farm (R = 0.86, p < 0.05), 2015 sampling year (R = 0.18, p < 0.05), soil nitrate (R = 0.38, p < 0.05), and total cover crop biomass (R = 0.36, p < 0.05). This was the largest module and hub taxa were diverse: negative hub taxa included Candidatus Nitrososphaera spp. while positive hub taxa included mostly Proteobacteria, Actinobacteria, and Acidobacteria. Module 4 was most positively correlated with 2015 sampling year (R = 0.29, p < 0.05), PrariErth farm (R = 0.58, p < 0.05), soil nitrate (R = 0.51, p < 0.05), total cover crop biomass (R = 0.32, p < 0.05), and most negatively correlated with sampling days post-cover crop termination (R = −0.27, p < 0.05). Hub taxa for Module 4 were comprised mostly of unclassified Gaiellaceae.
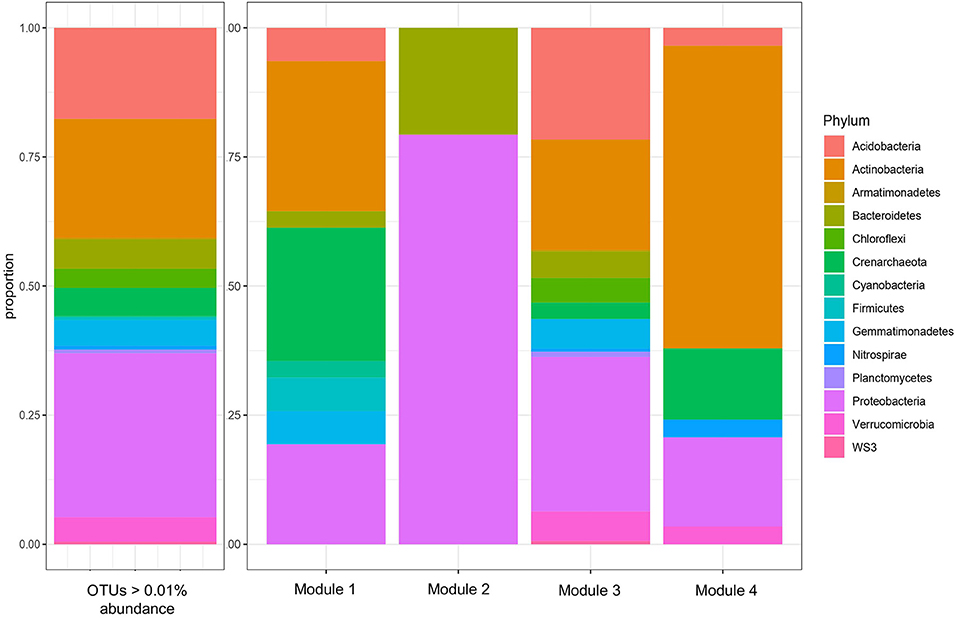
Figure 2. Taxonomic composition, by phylum, of all 16S OTUs above 0.01% abundance, and of the four modules of 16S OTUs identified by WGCNA. The threshold of 0.01% abundance was used determine OTUs to include in the subsequent WGCNA.
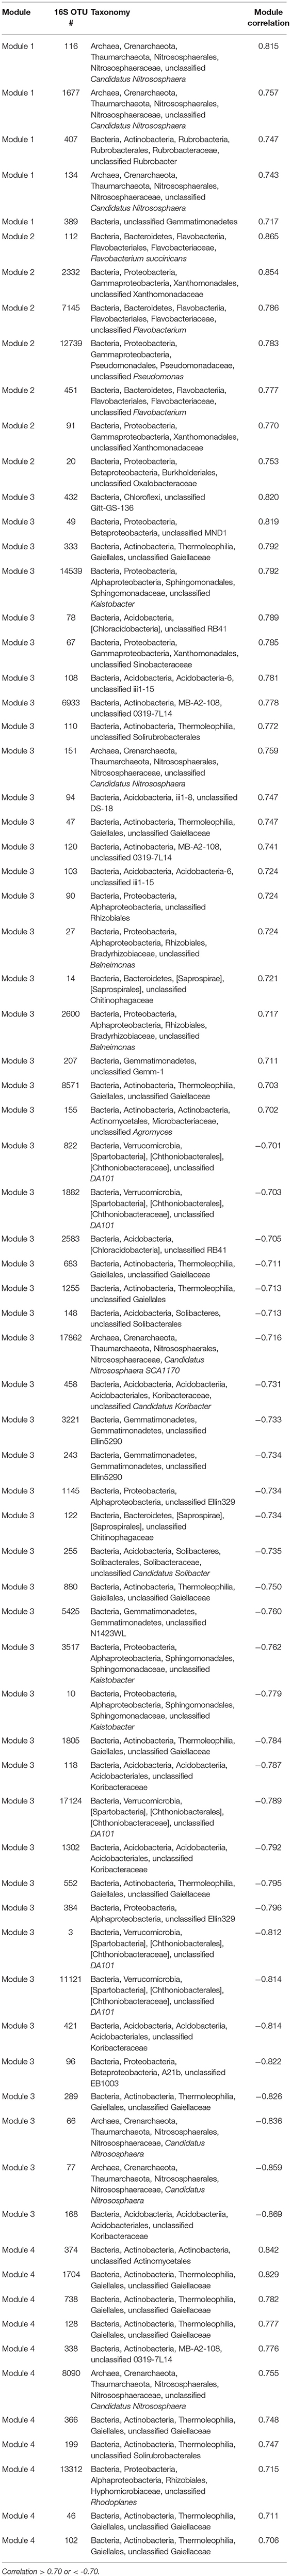
Table 2. 16S hub taxa by module.
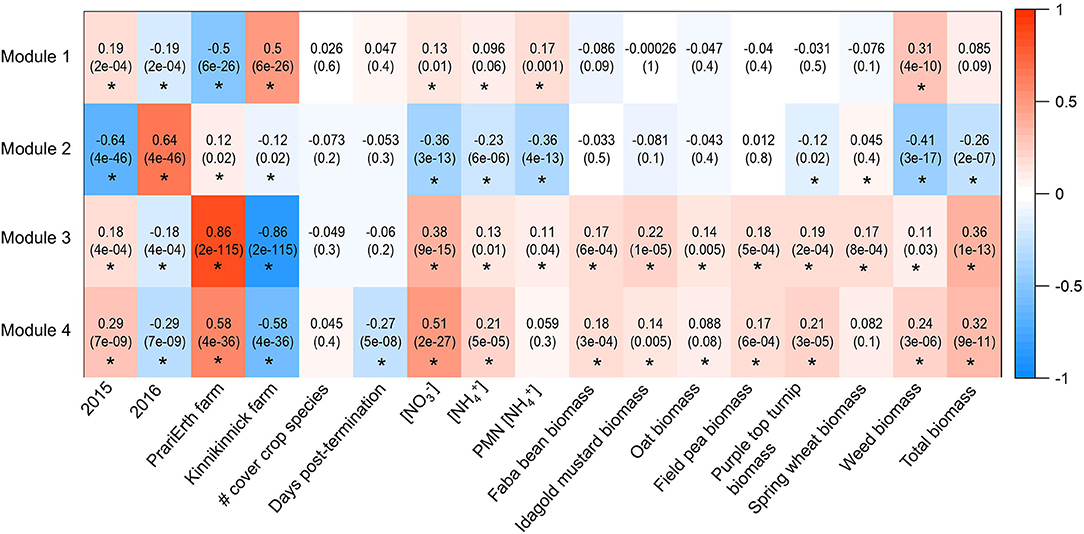
Figure 3. Heatmap generated for 16S WGCNA analysis. Values are correlations and p-values are in parentheses. Asterisks indicate significant correlations at the level of p < 0.05.
Three modules were identified among ITS OTUs in the WGCNA analysis (Figure 4). At the class level, the three modules were broadly similar in their relative taxonomic composition. They were also compositionally similar to the overall fungal community, although Sordariomycetes and Dothidiomycetes tended to be over-represented in modules relative to the overall community, and Agaricomycetes tended to be under-represented in modules. Module 1 was most positively correlated with 2015 (R = 0.42, p < 0.05), PrariErth farm (R = 0.97, p < 0.05), soil nitrate (R = 0.52, p < 0.05), and total cover crop biomass (R = 0.43, p < 0.05) (Figure 5). Hub taxa in this module included Sordariomyctes and Leotiomycetes (Table 3). Module 2 was most positively correlated with 2016 (R = 0.96, p < 0.05) and Kinnikinnick farm (R = 0.46, p < 0.05) and most negatively correlated with soil nitrate (R = −0.61, p < 0.05), soil ammonium (R = −0.33, p < 0.05), weed biomass (R = −0.46, p < 0.05), and total cover crop biomass (R = −0.48, p < 0.05). The top hub taxa in Module 2 included Cystolepiota adulterine and Dothidiomycetes. Module 3 generally had much weaker correlations to environmental variables, and it was positively correlated with 2016 (R = 0.36, p < 0.05) and Kinnikinnick farm (R = 0.21, p < 0.05) and negative correlated with soil nitrate (R = −0.20, p < 0.05) and total cover crop biomass (R = −0.20, p < 0.05). The hub taxa in Module 3 included Mortierella capitate, Trichocladium asperum, and other Sordariomyctes.
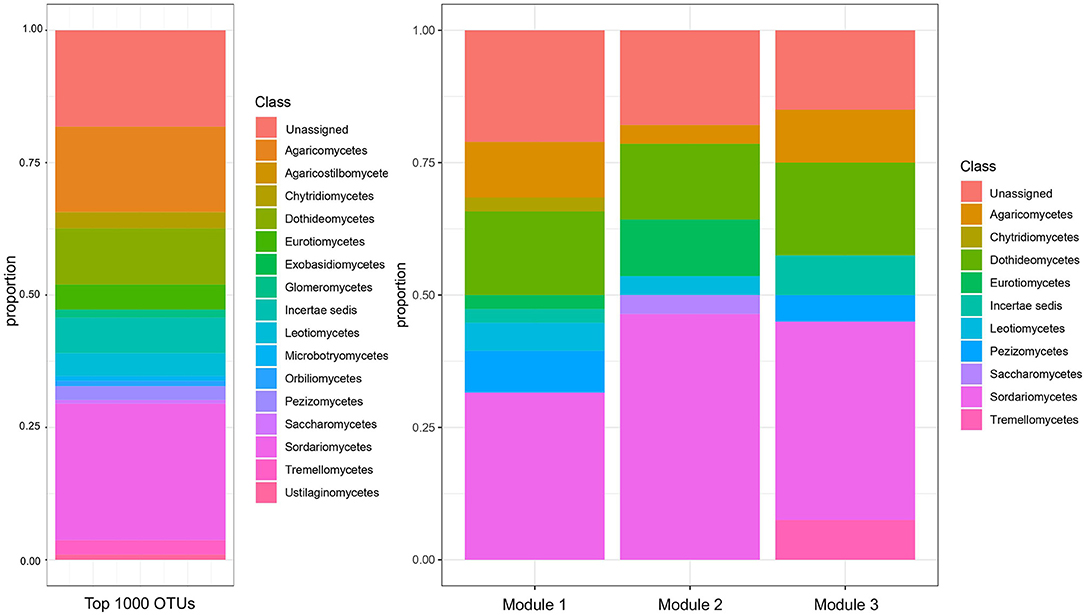
Figure 4. Taxonomic composition, by class, of the top 1000 ITS OTUs and of the three modules of ITS OTUs identified by WGCNA. The threshold of top 1000 OTUs was applied for the subsequent WGCNA analysis.
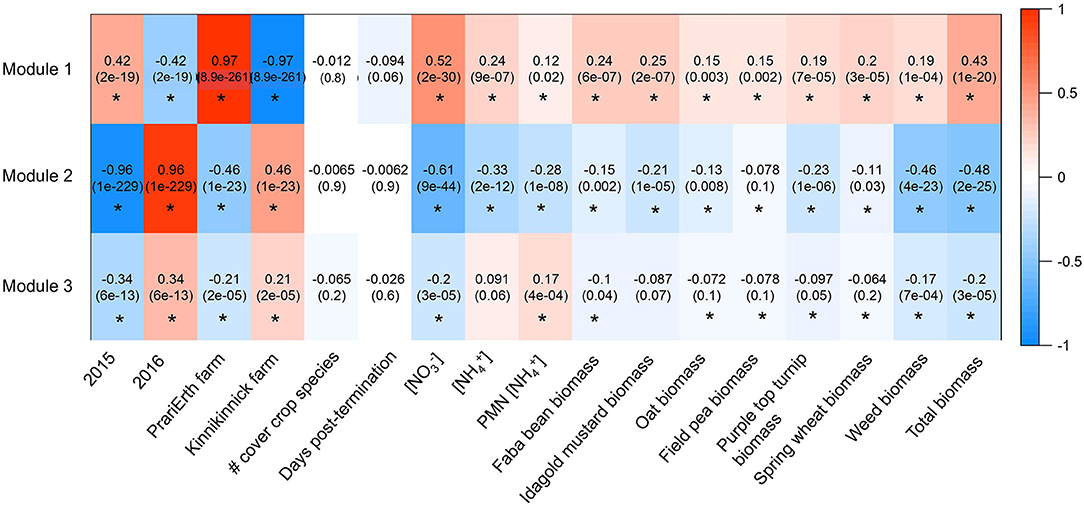
Figure 5. Heatmap generated for ITS WGCNA analysis. Values are correlations and p-values are in parentheses. Asterisks indicate significant correlations at the level of p < 0.05.
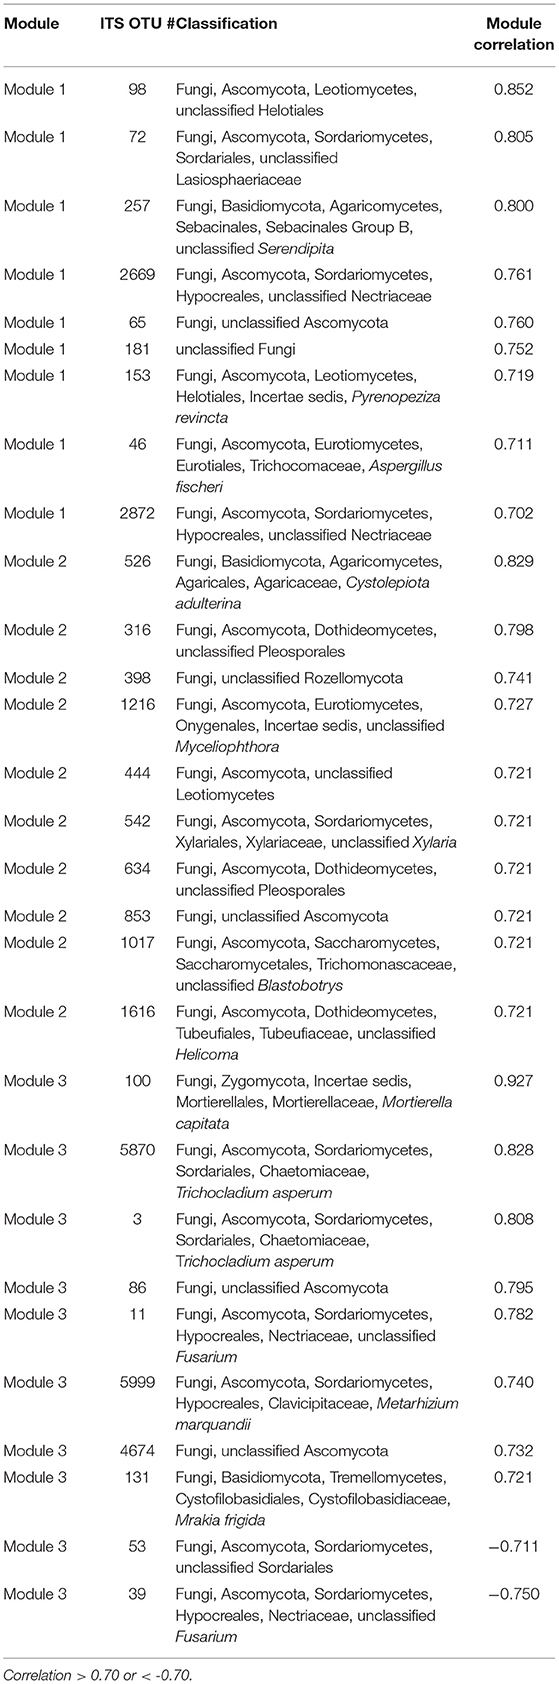
Table 3. ITS hub taxa by module.
Compared to plant-free controls, cover cropping had a significant impact on soil nitrogen levels in these short-term, springtime trials, but we found very few overall differences between plots that used different functional groups of cover crops (brassicas vs. grasses vs. legumes). By far, the most important differences appeared to be between plots that contained some kind of plant cover (including weeds) and the plant-free control plots. Plots with plant cover had lower soil nitrate and higher potentially mineralizable nitrogen than plant-free controls in the first few weeks following termination, although these differences largely disappeared by the 4th week. Microbial community composition in our study was largely driven by site and year, suggesting that large scale spatial and temporal effects are the primary determinants of soil microbial species pools. Nevertheless, our network analysis revealed coordinated responses in highly-correlated modules of soil bacteria and fungi in cover cropped systems, and we discuss these in more detail below.
Soil nitrate concentrations were initially greater under the plant-free control plots than any plots with cover crops. The inclusion of cover crops in this system should therefore minimize risk of nitrate leaching in the weeks following termination, as has been previously observed (20, 38, 40). Significant mineral nitrogen uptake by brassicas and weeds during the growing season may have further supported greater PMN concentrations during the fallow period prior to subsequent crop establishment (20). From an ecological and environmental sustainability perspective, lower concentrations of nitrate in the spring, during times of heavy rainfall and increased risk for leaching, may be advantageous. The five-species mixtures all contained at least one brassica, one legume, and one grass species, in addition to volunteer weed growth. It was, therefore, not surprising that the post-termination effects of mixtures on soil mineral nitrogen were consistently moderate. Holmes et al. (55) found that mixtures were consistently productive throughout the study, generating neither the most nor least biomass. Like the other more productive cover crops (brassicas, weeds, and grasses), nitrate losses were low under mixtures following termination. Similar to grasses, ammonium concentrations following mixtures declined steadily, though less dramatically.
Under mixtures, PMN concentrations were also moderate, and the relative dominance of brassicas in some of the mixtures (55) could have influenced the post-termination effects of those mixtures. PMN concentrations have been reported to decrease in mixtures with increasing proportions of grasses like rye or rye grass (82), and the mixtures in this study were heavily influenced by high biomass producers such as brassicas and weeds instead of grasses (55). This difference in PMN may also be reflected by the lower C:N ratios of legumes than grasses, and contribute to higher PMN due to more easily mineralizable content form tissues (20). Since mixtures contained tissues with variable C:N ratios, decomposition was occurring at different rates during the four-week sampling period. Organic nitrogen mineralization from legumes was likely more rapid due to low C:N ratios (83), lowering the overall PMN content when averaged across the 4-week sampling period. The quick release of nitrogen from legumes likely contributed to increased soil nitrate and slightly decreased soil PMN under mixtures as compared to monocultures like brassicas.
Organic farmers must prioritize their goals for planting spring-sewn cover crops. If the objectives are to reduce potential nitrate leaching and increase the potential for nitrogen mineralization throughout the upcoming growing season, then our study shows that a brassica monoculture such as Idagold mustard would accomplish this goal. However, while low soil nitrate concentrations post-cover crop incorporation may be beneficial for suppressing weed establishment, low mineral nitrogen could potentially hinder future crop growth if nitrogen demands are not met. If the goal of cover cropping is to increase nitrogen fixation, and subsequently inorganic nitrogen supply for crops, then a legume monoculture or mixture would allow for increased inorganic nitrogen available to subsequent crops while reducing the growth and establishment of weeds in legume monocultures. Determining the correct legume to use and ensuring that it will establish effectively when planted in a mixture will also be necessary to ensure successful establishment of all species.
Year and site were the strongest drivers of microbial community composition, which was illustrated in the PERMANOVA analysis. Therefore, it wasn't surprising to find that year and farm were often the strongest drivers in the WGCNA analysis. For the bacterial and archaeal OTUs, module 2 was strongly associated with the year 2016, and subsequently Kinnikinnick since biomass data that year was only available from that farm. Likewise, module 3 was strongly influenced by PrariErth farm. Castle et al. (84) also found that site-specific controls were most influential on short-term responses of soil bacterial communities under different cover crop treatments. The other correlations (nitrate, PMN, cover crop biomass) were considerably weaker, and thus challenging to disentangle the overarching strong effects of site and year. For the fungal OTUs, module 1 was very strongly influenced by PrariErth farm and module two by the year 2016. It is important to recognize these strong site and year effects, which reflect large scale temporal and spatial drivers of soil microbial communities. However, because these effects are idiosyncratic to our study, they hinder our ability to speculate about how cover cropping may affect microbial communities more generally. Therefore, we focus the remainder of our discussion on the remaining modules that showed much weaker correlations with site and year, and may therefore better reflect more general features of microbial response to cover cropping.
In the analysis of bacterial and archaeal OTUs, module 1 had a relatively strong positive correlation with weed biomass. There is a prevalence of ammonia-oxidizing organisms within the hub taxa from this module. The most abundant taxa from 16S module 1 were ammonia-oxidizing archaea of the genus Candidus Nitrosphaera. Individual ammonia-oxidizing bacterial and archaeal OTUs displayed individualistic responses to cover crop biomass, for example they were found in other modules of the analysis (module 3, module 4). In a concurrent study at this site, similar concentrations of soil ammonium across all cover crop types were reported, so detection of ammonia-oxidizing microorganisms across various cover crop biomasses was not entirely surprising. Though archaea made up <1% of the total “bacterial” 16S sequences that were analyzed in this study, they are ubiquitous in soils and are generally resistant to changing environmental conditions (85–87).
Ammonia-oxidizing bacteria and archaea are responsible for the first step of nitrification, conversion of ammonium to nitrite. This pathway is particularly important in agricultural systems, where nitrogen loss via nitrification decreases the pool of available inorganic nitrogen for subsequent crop uptake (12). The positive correlation between these ammonia-oxidizing OTUs and weed biomass may suggest that weeds, when at high biomass, can further support nitrification in soils. This may be an important discovery in the effort to reduce inorganic nitrogen losses in agriculture, which is a major concern in the Midwest.
Other hub taxa of note in 16S module included a single Rubrobacter, which are widely distributed in soils, such as grasslands, prairies, and pastures (88). Hub taxa for this module also included a Gammatimonadetes OTU, a taxon that has been found may be adapted to low soil moisture (89).
16S module 4 had negative correlation with sampling date (positive week 1), positive correlation with soil nitrate (nitrate levels also higher in week 1, across all cover crop types) and positive correlation with total cover crop biomass. The hub taxa in this module were overwhelmingly unclassified OTUs of the family Gaiellaceae (phylum: Actinobacteria). OTUs of the order Gaiellales have been shown to predominate in extreme environment, including saline-alkaline soils (90), wastewater treatments plants (91), and marine ecosystems (92). There was a single Actinomycetales (phylum: Actinobateria). Members of this order are often found in soil habitats and can support plant growth via biological nitrogen fixation (93, 94). There was one Rhizobiales (phylum: Proteobacteria), which also includes nitrogen-fixing associative taxa (95–98). There was also an ammonia-oxiziding archaea in this module, a potential producer of increased soil nitrate levels, which module 4 was also positively with. Rhodoplanes was also identified as a hub taxa in this module, and taxa of this family are photosynthetic with denitrification properties (99).
Fungal module 3 was negatively correlated with soil nitrate and total cover crop biomass, which likely links it to the plant-free control plots or the cover crop treatments with lower successful establishment. One of the hub taxa was Mortierella capitate (phylum: Zygomycota), which has been found to promote crop growth (100). There were two taxa identified as Trichocladium asperum, a polyphyletic genus of the family Chaetomiaceae that has been found a number of habitats, including soils and decomposing plant material (101). Other members of the family are commonly found in decomposing plant material and play a role in plant degradation (102). Some other species in the family have causes neurological disease in humans (103). Another hub taxa belongs to the family Nectriaceae, which also includes important human and plant pathogens (104). Hub taxa Metarhizium marquandii includes plant-growth promoting fungi (105).
Taken together, changes in these 16S and ITS modules suggest that the more general coordinated responses of soil microbial communities in our study were primarily associated with changes in soil nitrate concentrations and overall plant biomass. Given that plant cover was also a key driver of soil nitrate in our study, we conclude that a major impact of springtime cover cropping is to drive changes in soil nitrate levels, and that soil nitrate, in turn, is a key driver of microbial community composition, particularly for bacteria. Cover cropping also promoted an increase in potentially mineralizable nitrogen pools in soils, and the presence of saprotrophic fungi in the hub taxa of module 3 suggests that the decomposition of cover crop residues may drive subsequent soil microbial changes over time.
The datasets presented in this study can be found in online repositories. The names of the repository/repositories and accession number(s) can be found at: https://www.ncbi.nlm.nih.gov/genbank/, BioProject # PRJNA503856.
AH, SW, and AY designed the research. AH maintained the experimental research plots. AH and AY collected the samples. EL produced the data. EL and AY conducted the data analysis and wrote the manuscript. All authors contributed to the article and approved the submitted version.
This work was supported by AFRI Foundational and Applied Science Program grant no. 2015-67013-22948 and by the Hatch Act of 1887 project accession nos. 1004684 and 1021769 from the USDA National Institute of Food and Agriculture. This material is based upon work supported by the National Science Foundation under BII Grant No. 2022049. This work was also supported by the Ceres Trust Organic Research Initiative through Grant no. Ceres 2015-01667.
The authors declare that the research was conducted in the absence of any commercial or financial relationships that could be construed as a potential conflict of interest.
All claims expressed in this article are solely those of the authors and do not necessarily represent those of their affiliated organizations, or those of the publisher, the editors and the reviewers. Any product that may be evaluated in this article, or claim that may be made by its manufacturer, is not guaranteed or endorsed by the publisher.
We gratefully acknowledge Dave Bishop of PrairiErth Farm and David Cleverdon of Kinnikinnick Farm for their invaluable support of this research, which was conducted on their land. We also acknowledge A. W. Kent, S. Kuwayama, M. O'Loughlin, T. Ying, A. Gatdula, and S. Guillmot for research support and A. S. Davis and C. Pittelkow for advice in preparation of this manuscript.
The Supplementary Material for this article can be found online at: https://www.frontiersin.org/articles/10.3389/fsoil.2022.824087/full#supplementary-material
Supplementary Figure 1. NMDS plot of bacterial communities representing all cover crop treatments. Each point represents a single sample and the bacterial community from that sample. Due to the significant effects of site and year, points are labeled by their site-year interactions. The Bray-Curtis distance method was used to perform the NMDS, with a stress level of 0.164. Ellipses represent the 95% confidence interval around the centroid for the given site-year.
Supplementary Figure 2. NMDS plot of fungal communities representing all cover crop treatments. Each point represents a single sample and the fungal community from that sample. Due to the significant effects of site and year, points are labeled by their site-year interactions. Bray-Curtis distances were used to perform the NMDS, with a stress level of 0.214. Ellipses represent the 95% confidence interval around the centroid for the given site-year.
1. Doran JW, Smith MS. Role of cover crops in ntirogen cycling. In: Hargrove WL, editor. Cover Crops for Clean Water. Ankeny, IA: SWCS (1991).
2. Tonitto C, David MB, Drinkwater LE. Replacing bare fallows with cover crops in fertilizer-intensive cropping systems: A meta-analysis of crop yields and N dynamics. Agric Ecosyst Environ. (2006) 112:58–72. doi: 10.1016/j.agee.2005.07.003
3. Wortman SE, Francis CA, Lindquist JL. Cover crop mixtures for the western corn belt: Opportunities for increased productivity and stability. Agron J. (2012) 104:699–705. doi: 10.2134/agronj2011.0422
4. van der Putten WH, Bardgett RD, Bever JD, Bezemer TM, Casper BB, Fukami T, et al. Plant-soil feedbacks: The past, the present and future challenges. J Ecol. (2013) 101:265–76. doi: 10.1111/1365-2745.12054
5. Akemo MC, Regnier EE, Bennett MA. Weed suppression in spring-sown rye (Secale cereale)–pea (Pisum sativum) cover crop mixes. Weed Technol. (2000) 14:545–9. doi: 10.1614/0890-037X(2000)014[0545:WSISSR]2.0.CO;2
6. Kumar V, Brainard DC, Bellinder RR. Effects of spring-sown cover crops on establishment and growth of hairy galinsoga (Galinsoga ciliata) and four vegetable crops. HortScience. (2009) 44:730–6. doi: 10.21273/HORTSCI.44.3.730
7. Wurst S, Ohgushi T, Allen E. Do plant- and soil-mediated legacy effects impact future biotic interactions? Funct Ecol. (2015) 29:1373–82. doi: 10.1111/1365-2435.12456
8. Lou Y, Davis AS, Yannarell AC. Interactions between allelochemicals and the microbial community affect weed suppression following cover crop residue incorporation into soil. Plant Soil. (2016) 399:357–71. doi: 10.1007/s11104-015-2698-8
9. Madden NM, Mitchell JP, Lanini WT, Cahn MD, Herrero EV, Park S, et al. Evaluation of conservation tillage and cover crop systems for organic processing tomato production. Horttechnology. (2004) 14:243–50. doi: 10.21273/HORTTECH.14.2.0243
10. Larkin RP, Honeycutt W. Effects of different 3-year cropping systems on soil microbial communities and rhizoctonia diseases of potato. Phytopathology. (2006) 96:68–79. doi: 10.1094/PHYTO-96-0068
11. Carrera LM, Buyer JS, Vinyard B, Abdul-Baki AA, Sikora LJ, Teasdale JR. Effects of cover crops, compost, and manure amendments on soil microbial community structure in tomato production systems. Appl Soil Ecol. (2007) 37:247–55. doi: 10.1016/j.apsoil.2007.08.003
12. van der Heijden MG, Bardgett RD, van Straalen MN. The unseen majority: Soil microbes as drivers of plant diversity and productivity in terrestrial ecosystems. Ecol Lett. (2008) 11:296–310. doi: 10.1111/j.1461-0248.2007.01139.x
13. Pascault N, Cecillon L, Mathieu O, Henault C, Sarr A, Leveque J, et al. In situ dynamics of microbial communities during decomposition of wheat, rape, alfalfa residues. Microb Ecol. (2010) 60:816–28. doi: 10.1007/s00248-010-9705-7
14. Fernandez AL, Sheaffer CC, Wyse DL, Staley C, Gould TJ, Sadowsky MJ. Structure of bacterial communities in soil following cover crop and organic fertilizer incorporation. Appl Microbiol Biotechnol. (2016) 100:9331–41. doi: 10.1007/s00253-016-7736-9
15. Vukicevich E, Lowery T, Bowen P, Úrbez-Torres JR, Hart M. Cover crops to increase soil microbial diversity and mitigate decline in perennial agriculture. A review. Agronomy Sustain Dev. (2016) 36:385. doi: 10.1007/s13593-016-0385-7
16. Brennan EB, Acosta-Martinez V. Cover cropping frequency is the main driver of soil microbial changes during six years of organic vegetable production. Soil Biol Biochem. (2017) 109:188–204. doi: 10.1016/j.soilbio.2017.01.014
17. Finney DM, Buyer JS, Kaye JP. Living cover crops have immediate impacts on soil microbial community structure and function. J Soil Water Conserv. (2017) 72:361–73. doi: 10.2489/jswc.72.4.361
18. Liu J, Yu Z, Yao Q, Hu X, Zhang W, Mi G, et al. Distinct soil bacterial communities in response to the cropping system in a Mollisol of northeast China. Appl Soil Ecol. (2017) 119:407–16. doi: 10.1016/j.apsoil.2017.07.013
19. Kruidhof HM, Bastiaans L, Kropff MJ. Cover crop residue management for optimizing weed control. Plant Soil. (2009) 318:169–84. doi: 10.1007/s11104-008-9827-6
20. Tribouillois H, Cohan JP, Justes E. Cover crop mixtures including legume produce ecosystem services of nitrate capture and green manuring: Assessment combining experimentation and modelling. Plant Soil. (2015) 401:347–64. doi: 10.1007/s11104-015-2734-8
21. Bending GD, Turner MK, Burns IG. Fate of nitrogen from crop residues as affected by biochemical quality and the microbial biomass. Soil Biol Biochem. (1998) 30:2055–65. doi: 10.1016/S0038-0717(98)00081-9
22. Brandi-Dohrn FM, Hess M, Selker JS, Dick RP, Kauffman SM, Hemphill DDJ. Nitrate leaching under a cereal rye cover crop. J Environ Qual. (1997) 26:181–6. doi: 10.2134/jeq1997.00472425002600010026x
23. Kaspar TC, Singer JW. The use of cover crops to manage soil. In: Hattfield JL, Sauer TJ, editors. Soil Management: Building a Stable Base for Agriculture. Madison, WI: American Society of Agronomy and Soil Science Society of America (2011).
24. Wortman SE, Francis CA, Bernards ML, Drijber RA, Lindquist JL. Optimizing cover crop benefits with diverse mixtures and an alternative termination method. Agron J. (2012) 104:1425. doi: 10.2134/agronj2012.0185
25. O'Connell S, Shi W, Grossman JM, Hoyt GD, Fager KL, Creamer NG. Short-term nitrogen mineralization from warm-season cover crops in organic farming systems. Plant Soil. (2015) 396:353–67. doi: 10.1007/s11104-015-2594-2
26. Wagger MG, Cabrera ML, Ranells NN. Nitrogen and carbon cycling in relation to cover crop residue quality. J Soil Water Conserv. (1998) 53:214–8.
27. Luscher A, Mueller-Harvey I, Soussana JF, Rees RM, Peyraud JL. Potential of legume-based grassland-livestock systems in Europe: A review. Grass Forage Sci. (2014) 69:206–28. doi: 10.1111/gfs.12124
28. Jackson L, Wyland L, Stivers L. Winter cover crops to minimize nitrate losses in intensive lettuce production. J Agric Sci. (1993) 121:55–62. doi: 10.1017/S0021859600076796
29. Brown PD, Morra MJ. Control of soil-borne plant pests using glucosinolate-containing plants. Adv Agronomy. (1997) 61:167–231. doi: 10.1016/S0065-2113(08)60664-1
30. Haramoto ER, Gallandt ER. Brassica cover cropping for weed management: A review. Renewable Agricul Food Syst. (2004) 19:187–98. doi: 10.1079/RAFS200490
31. Hu S, Grunwald NJ, van Bruggen AHC, Gamble GR, Drinkwater LE, Shennan C, et al. Short-term effects of cover crop incorporation on soil carbon pools and nitrogen availability. Soil Sci Soc Am J. (1997) 61:901–11. doi: 10.2136/sssaj1997.03615995006100030027x
33. Yousef AN, Sprent JI. Effects of NaCl on growth, nitrogen incorporation and chemical composition of incoculated and NH4NO3 fertilized Vicia faba (L.) plants. J Exp Bot. (1983) 34:941–50. doi: 10.1093/jxb/34.8.941
34. Jensen ES. Nitrogen immobilization and mineralization during initial decomposition of 15N-labelled pea and barley residues. Biol Fertil Soils. (1997) 24:39–44. doi: 10.1007/BF01420218
35. Stevenson FJ, Cole MA. The Internal Cycle of Nitrogen in Soil. Cycles of Soil: Carbon, Nitrogen, Phosphorus, Sulfur, and Micronutrients. New York, NY: Wiley (1985).
36. Wagger MG. Time of desiccation effects on plant composition and subsequent nitrogen release from several winter annual cover crops. Agron J. (1989) 81:236–41. doi: 10.2134/agronj1989.00021962008100020020x
37. Teasdale JR, Abdul-Baki AA. Comparison of mixtures vs. monocultures of cover crops for fresh-market tomato production with and without herbicide. HortScience. (1998) 33:1163–6. doi: 10.21273/HORTSCI.33.7.1163
38. Chaves B, DeNeve S, Hofman G, Boeckx P, Van Cleemput O. Nitrogen mineralization of the vegetable root residues and green manures as related to their (bio)chemical composition. Eur J Agronomy. (2004) 21:161–70. doi: 10.1016/j.eja.2003.07.001
39. USDA. Manhattan Plant Material Center Cover Crop Study. U.S. Department of Agriculture, Natural Resources Conservation Service Kansas (2013).
40. Brennan EB, Smith RF. Mustard cover crop growth and weed suppression in organic, strawberry furrows in California. HortScience. (2018) 53:432–40. doi: 10.21273/HORTSCI12576-17
41. Ohno T, First PR. Assessment of the Folin and Ciocalteu's method for determining soil phenolic carbon. J Environ Q. (1998) 27:776. doi: 10.2134/jeq1998.00472425002700040008x
42. Gao J, Xie Y, Jin H, Liu Y, Bai X, Ma D, et al. Nitrous oxide emission and denitrifier abundance in two agricultural soils amended with crop residues and urea in the North China plain. PLoS ONE. (2016) 11:e0154773. doi: 10.1371/journal.pone.0154773
43. Mazzola M, Mullinix K. Comparative field efficacy of management strategies containing Brassica napus seed meal or green manure for the control of apple replant disease. Plant Dis. (2005) 89:1207–13. doi: 10.1094/PD-89-1207
44. Benitez MS, Taheri WI, Lehman RM. Selection of fungi by candidate cover crops. Appl Soil Ecol. (2016) 103:72–82. doi: 10.1016/j.apsoil.2016.03.016
45. Reynolds HL, Packer A, Bever JD, Clay K. Grassroots ecology: Plant-microbe-soil interactions as drivers of plant community structure and dynamics. Ecology. (2003) 84:2281–91. doi: 10.1890/02-0298
46. Brussaard L, de Ruiter PC, Brown GG. Soil biodiversity for agricultural sustainability. Agric Ecosyst Environ. (2007) 121:233–44. doi: 10.1016/j.agee.2006.12.013
47. Lehman RM, Acosta-Martinez V, Buyer JS, Cambardella CA, Collins HP, Ducey TF, et al. Soil biology for resilient, healthy soil. J. Soil Water Conserv. (2015) 70:12A–8. doi: 10.2489/jswc.70.1.12A
48. Akemo MC, Bennett MA, Regnier EE. Tomato growth in spring-sown cover crops. HortScience. (2000) 35:843–8. doi: 10.21273/HORTSCI.35.5.843
49. Björkman T, Lowry C, Shail JW, Brainard DC, Anderson DS, Masiunas JB. Mustard cover crops for biomass production and weed suppression in the Great Lakes region. Agron J. (2015) 107:1235–49. doi: 10.2134/agronj14.0461
50. Chu M, Jagadamma S, Walker FR, Eash NS, Buschermohle MJ, Duncan LA. Effects of multispecies cover crop mixture on soil properties and crop yield. Agricul Environ Lett. (2017) 2:170030. doi: 10.2134/ael2017.09.0030
51. Creamer NG, Baldwin KR. An evaluation of summer cover crops for use in vegetable production systems in North Carolina. HortScience. (2000) 35:600–3. doi: 10.21273/HORTSCI.35.4.600
52. Cardinale BJ, Wright JP, Cadotte MW, Carroll IT, Hector A, Srivastava DS, et al. Impacts of plant diversity on biomass production increase through time because of species complementarity. PNAS. (2007) 104:18123–8. doi: 10.1073/pnas.0709069104
53. Wortman SE, Francis CA, Bernards MA, Blankenship EE, Lindquist JL. Mechanical termination of diverse cover crop mixtures for improved weed suppression in organic cropping systems. Weed Sci. (2013) 61:162–70. doi: 10.1614/WS-D-12-00066.1
54. Smith RG, Atwood LW, Warren ND. Increased productivity of a cover crop mixture is not associated with enhanced agroecosystem services. PLoS ONE. (2014) 9:e97351. doi: 10.1371/journal.pone.0097351
55. Holmes AA, Thompson AA, Wortman SE. Species-specific contributions to productivity and weed suppression in cover crop mixtures. Agron J. (2017) 109:2808. doi: 10.2134/agronj2017.06.0309
56. Mulvaney RL. Chapter 38: Nitrogen — inorganic forms. In: Sparks DL, Page AL, Helmke PA, Loeppert RH, Soltanpour PN, Tabatabai MA, editors. Methods of Soil Analysis. Part 3. Chemical Methods. Madison, WI: Soil Science Society of America, Inc. and American Society of Agronomy, Inc. (1996).
57. Doane TA, Horwáth WR. Spectrophotometric determination of nitrate with a single reagent. Anal Lett. (2003) 36:2713–22. doi: 10.1081/AL-120024647
58. Weatherburn WM. Phenol-hypochlorite reaction for determination of ammonia. Anal Chem. (1967) 39:971–4. doi: 10.1021/ac60252a045
59. Drinkwater LE, Cambardella CA, Reeder JD, Rice CW. Potentially mineralizable nitrogen as an indicator of biologically active soil nitrogen. Soil Sci Soc Am J. (1996) 49:217–29. doi: 10.2136/sssaspecpub49.c13
60. Moebius-Clune BN, Moebius-Clune BK, Gugino BK, Idowu OJ, Schindelbeck RR, Ristow AJ, et al. Potentially Minerablizable Nitrogen. Geneva, NY: Cornell University (2016).
61. Caporaso JG, Lauber CL, Walters WA, Berg-Lyons D, Lozupone CA, Turnbaugh PJ, et al. Global patterns of 16S rRNA diversity at a depth of millions of sequences per sample. Proc Nat Acad Sci USA. (2011) 108:4516–22. doi: 10.1073/pnas.1000080107
62. White TJ, Bruns T, Taylor J. Amplification and direct sequencing of fungal ribosomal RNA genes for phylogenetics. In: Innis MA, Gelfand DH, Sninsky JJ, White TJ, editors. PCR Protocols: A Guide to Methods and Applications. New York, NY: Academic Press (1990). doi: 10.1016/B978-0-12-372180-8.50042-1
63. Magoč T, Salzberg SL. FLASH: Fast length adjustment of short reads to improve genome assemblies. Bioinformatics. (2011) 21:2957–63. doi: 10.1093/bioinformatics/btr507
64. Gordon A, Hannan GJ. FastX Tool Kit. (2010). Available online at: http://hannonlab.cshl.edu/fastx_toolkit
65. Edgar RC. Search and clustering orders of magnitude faster than BLAST. Bioinformatics. (2010) 26:2460–1. doi: 10.1093/bioinformatics/btq461
66. Caporaso JG, Kuczynski J, Stombaugh J, Bittinger K, Bushman FD, Costello EK, et al. QIIME allows analysis of high-throughput community sequencing data. Nat Methods. (2010) 7:335–6. doi: 10.1038/nmeth.f.303
67. Altschul SF, Gish W, Miller W, Myers EW, Lipman DJ. Basic local alignment search tool. J Mol Biol. (1990) 3:403–10. doi: 10.1016/S0022-2836(05)80360-2
68. DeSantis TZ, Hugenholtz P, Larsen N, Rojas M, Brodie EL, Keller K, et al. Greengenes, a chimera-checked 16S rRNA gene database and workbench compatible with ARB. Appl Environ Microbiol. (2006) 72:6069–5072. doi: 10.1128/AEM.03006-05
69. Urmas K, Nilsson RH, Abarenkov K, Tedersoo L, Taylor AF, Bahram M, et al. Toward a unified paradigm for sequence-based identification of fungi. Mol Ecol. (2013) 22:5271–7. doi: 10.1111/mec.12481
70. Team RC. R: A Language and Environment for Statistical Computing. Vienna: R Foundation for Statistical Computing (2017).
71. Pinheiro J, Bates D, DebRoy S, Sarkar D, Team RC. Nlme: Linear and Nonlinear Mixed Effect Models. (2017). Available online at: https://CRAN.R-project.org/package=nlme
72. Hothorn T, Bretz F, Westfall P. Simultaneous inference in general parametric models. Biom J. (2008) 50:346–63. doi: 10.1002/bimj.200810425
73. Oksanen JF, Blanchet FG, Friendly M, Kindt R, Legendre P, McGlinn D, et al. Vegan: Community Ecology Package. (2017). Available online at: https://CRAN.R-project.org/package=vegan
74. Castillo JD, Vivanco JM, Manter DK. Bacterial microbiome and nematode occurrence in different potato agricultural soils. Soil Microbiol. (2017) 74:888–900. doi: 10.1007/s00248-017-0990-2
75. Hewavitharana SS, Klarer E, Reed AJ, Leisso R, Poirier B, Honaas L, et al. Temporal Dynamics of the Soil Metabolome and Microbiome During Simulated Anaerobic Soil Disinfestation. Front Microbiol. (2019) 10:2365. doi: 10.3389/fmicb.2019.02365
76. Yue Y, Shao T, Long X, He T, Gao T, Zhou Z, et al. Microbiome structure and function in rhizosphere Jerusalem artichoke grown in saline land. Sci Total Environ. (2020) 724:138259. doi: 10.1016/j.scitotenv.2020.138259
77. Favela A, Bohn MO, Kent AD. Maize germplasm chronosequence shows crop breeding history impacts recruitment of rhizospher microbiome. ISME J. (2021) 15:2454–64. doi: 10.1038/s41396-021-00923-z
78. Langfelder P, Horvath S. WGCNA: an R package for weighted correlation network analysis. BMC Bioinform. (2008) 9:559. doi: 10.1186/1471-2105-9-559
79. Langfelder P, Horvath S. Fast R functions for robust correlations and hierarchical clustering. J Statistical Sofware. (2012) 46:1–17. doi: 10.18637/jss.v046.i11
80. Ghazalpour A, Doss S, Zhang B, Wang S, Plaisier C, Castellanos R, et al. Integrating genetic and network analysis to characterize genes related to mouse weight. PLoS Genet. (2006) 2:e130. doi: 10.1371/journal.pgen.0020130
81. Wickham H. ggplot2: Elegant Graphics for Data Analysis. New York, NY: Spring-Verlag (2009). doi: 10.1007/978-0-387-98141-3
82. Kuo S, Sainju UM. Nitrogen mineralization and availability of mixed leguminous and non-leguminous cover crop residues in soil. Biol Fertil Soils. (1998) 26:346–53. doi: 10.1007/s003740050387
83. Brennan EB, Boyd NS, Smith RF. Winter cover crop seeding rate and variety affects during eight years of organic vegetables: III cover crop residue quality and nitrogen mineralization. Agron J. (2013) 105:171–82. Available online at: https://www.ars.usda.gov/ARSUserFiles/21904/BrennanPeerRevPdfs/Agron%20J%20105p171.pdf
84. Castle SC, Samac DA, Gutknecht JL, Sadowsky MJ, Rosen CJ, Schlatter D, Kinkel LL. Impacts of cover crops and nitrogen fertilization on agricultural soil fungal and bacterial communities. Plant Soil. (2021) 466:139–50. doi: 10.1007/s11104-021-04976-z
85. Simon HM, Dodsworth JA, Goodman RM. Crenarchaeota colonize terrestrial plant roots. Environ Microbiol. (2000) 2:495–505. doi: 10.1046/j.1462-2920.2000.00131.x
86. Bates ST, Berg-Lyons D, Caporaso JG, Walters WA, Knight R, Fierer N. Examining the global distribution of dominant archaeal populations in soil. ISME J. (2011) 5:908–17. doi: 10.1038/ismej.2010.171
87. Maul JE, Buyer JS, Lehman RM, Culman S, Blackwood CB, Roberts DP, et al. Microbial community structure and abundance in the rhizosphere and bulk soil of a tomato cropping system that includes cover crops. Appl Soil Ecol. (2014) 77:42–50. doi: 10.1016/j.apsoil.2014.01.002
88. DeBruyn JM, Nixon LT, Fawaz MN, Johnson AM, Radosevich M. Global biogeography and quantitative seasonal dynamics of Gemmatimonadetes in soil. Appl Environ Microbiol. (2011) 77:6295–300. doi: 10.1128/AEM.05005-11
89. Fawaz MN. Revealing the Ecological Role of Gemmatimonadetes Through Cultivation and Molecular Analysis of Agricultural Soils. Master's Thesis. University of Tennessee (2013)
90. Peng M, Jia H, Wang Q. The effect of land use on bacterial communities in saline alkali soil. Curr Microbiol. (2017) 74:325–33. doi: 10.1007/s00284-017-1195-0
91. Shu D, He Y, Yue H, Wang Q. Microbial structures and community functions of anaerobic sludge in six full-scale wastewater treatment plants as revealed by 454 high throughput pyrosequencing. Bioresour Technol. (2015). 186:163–72. doi: 10.1016/j.biortech.2015.03.072
92. Chen R, He Y, Cui L, Li C, Shi S, Long L, Tian X. Diversity and distribution of uncultured and cultured gaiellales and rubrobacterales south china sea sediments. Front Microbiol. (2021) 12:657072. doi: 10.3389/fmicb.2021.6570752
93. Buckley DH, Huangyutitham V, Hsu SF, Nelson TA. Stable isotope probing with 15N2 reveals novel noncultivated diazotrophs in soil. Appl Environ Microbiol. (2007) 73:3196–204. doi: 10.1128/AEM.02610-06
94. Yadav AN, Verma P, Kumar S, Kumar V, Kumar M, Sugitha TCK, et al. Chapter 2: Actinobacteria from rhizosphere: molecular diversity, distributions, and potential biotechnological applications. In: Singh BP, Gupta VK, Passari K, editors. New and Future Developments in Microbial Biotechnology and Bioengineering. Boston, MA: Elsevier (2018). doi: 10.1016/B978-0-444-63994-3.00002-3
95. Ivanova EG, Doronina NV, Shepelyakovskaya AO, Laman AG, Brovko FA, Trotsenko YA. Facultative and obligate aerobic methylobacteria synthesize cytokinins. Microbiol. (2000). 69:646–51. doi: 10.1023/A:1026693805653
96. Delmotte N, Knief C, Chaffron S, Innerebner G, Roschitzki B, Schlapbach R, von Mering C, Vorholt JA. Community proteogenomics reveals insights into the physiology of phyllosphere bacteria. Proc Natl Acad Sci USA. (2009) 106:16428–33. doi: 10.1073/pnas.0905240106
97. Verginer M, Siegmund B, Cardinale M, Müller H, Choi Y, Míguez CB, Leitner E, Berg G. Monitoring the plant epiphyte Methylobacterium extorquens DSM 21961 by real–time PCR and its influence on the strawberry flavor. FEMS Microbiol Ecol. (2010). 74:136–45. doi: 10.1111/j.1574-6941.2010.00942.x
98. Erlacher A, Cernava T, Cardinale M, Soh J, Sensen CW, Grube M, et al. Rhizobiales as funtional and endosymbiontic members of the lichen symbiosis of Lobaria pulmonaria L. Front Microb. (2015) 6:53. doi: 10.3389/fmicb.2015.00053
99. Hiraishi A, Imhoff JF. Rhodoplanes. In: BSM Trust, editor. Bergey's Manual of Systematics of Archaea and Bacteria. Hoboken, NJ: John Wiley & Sons, Inc. (2021). doi: 10.1002/9781118960608.gbm00826.pub2
100. Li F, Zhang S, Wang Y, Li Y, Li P, Chen L, et al. Rare fungus, Mortierella capitata, promotes crop growth by stimulating primary metabolisms related genes and reshaing rhizosphere bacterial community. Soil Biol Biochem. (2020) 151:108017. doi: 10.1016/j.soilbio.2020.108017
101. Hernández-Restrepo M, Gené J, Casañeda-Ruiz RF, Mena-Portales J, Crous PW, Guarro J. Phylogeny of saprobic microfungi from Southern Europe. Stud Mycol. (2017) 86:53–97. doi: 10.1016/j.simyco.2017.05.002
102. Guppy KH, Thomas C, Thomas K. Cerebral fungal infections in the immunocompromised host: a literature review and a new pathogen—Chaetomium atrobrunneum: Case report. Neurosurgery. (1998) 43:1463–69. doi: 10.1097/00006123-199812000-00122
103. Abbott SP, Sigler L, McAleer R. Fatal cerebral mycoses caused by the ascomycete Chaetomium strumarium. J Clin Microbiol. (1995) 33:2692–8.
104. Lombard L, van der Merwe NA, Groenewald JZ, Crous PW. Generic concepts in netriaceae. Stud Mycol. (2015) 80:189–245. doi: 10.1016/j.simyco.2014.12.002
Keywords: cover crops, nitrogen, microbial community, organic agriculture, early season pulse, nitrate, organic N, agricultural management
Citation: Lucadamo EE, Holmes AA, Wortman SE and Yannarell AC (2022) Post-termination Effects of Cover Crop Monocultures and Mixtures on Soil Inorganic Nitrogen and Microbial Communities on Two Organic Farms in Illinois. Front. Soil Sci. 2:824087. doi: 10.3389/fsoil.2022.824087
Received: 28 November 2021; Accepted: 18 January 2022;
Published: 10 February 2022.
Edited by:
Nigel Victor Gale, University of Toronto, CanadaReviewed by:
Mahaveer P. Sharma, ICAR Indian Institute of Soybean Research, IndiaCopyright © 2022 Lucadamo, Holmes, Wortman and Yannarell. This is an open-access article distributed under the terms of the Creative Commons Attribution License (CC BY). The use, distribution or reproduction in other forums is permitted, provided the original author(s) and the copyright owner(s) are credited and that the original publication in this journal is cited, in accordance with accepted academic practice. No use, distribution or reproduction is permitted which does not comply with these terms.
*Correspondence: Anthony C. Yannarell, YWN5YW5uQGlsbGlub2lzLmVkdQ==
Disclaimer: All claims expressed in this article are solely those of the authors and do not necessarily represent those of their affiliated organizations, or those of the publisher, the editors and the reviewers. Any product that may be evaluated in this article or claim that may be made by its manufacturer is not guaranteed or endorsed by the publisher.
Research integrity at Frontiers
Learn more about the work of our research integrity team to safeguard the quality of each article we publish.