- 1Nanomedicine and Nanotoxicology Group, Physics Institute of São Carlos, University of São Paulo, São Carlos, Brazil
- 2Chemistry Department, Laboratory in Bioanalytical of Nanosystems, Faculty of Philosophy, Science and Letters at Ribeirão Preto, University of São Paulo, Ribeirão Preto, Brazil
Tuberculosis (TB) was, until SARS-CoV-2 pandemic, the leading cause of death by a single infectious agent contaminating over 10.6 million people with 1.6 million deaths in 2021 worldwide. Herein, we present a proof-of-principle strategy for detecting the recombinant protein CFP10:ESAT6 using an impedimetric immunosensor, which could aid in the diagnosis of tuberculosis. The immunosensor was developed using indium tin oxide electrodes modified by 3-aminopropyltrimethoxysilane monolayer to covalently immobilize anti-CFP10 antibodies. The protein interaction with the antibody recognition platform was directly monitored and measured by cyclic voltammetry and electrochemical impedance spectroscopy, respectively. After the analytical features optimization, a Langmuir isotherm response from 0.5 ng mL-1 to 50 ng mL-1 of pCFP10:ESAT6, limit of detection of 4.80 ng mL-1 and limit of quantification of 15.97 ng mL-1 were achieved, in a 4-hour assay time. Selectivity tests conducted in the presence of DENV NS1 and SARS-CoV-2 Spike proteins at a concentration of 20 ng mL-1, which is one-tenth of the concentration used to optimize pCFP10, indicate that the immunosensor is selective for pCFP10:ESAT6. Additionally, repeatability and reproducibility tests confirm that the immunosensor is suitable, accurate, and selective for detecting the CFP10:ESAT6 protein. The small sample volume required, and short testing time underscore the remarkable capabilities of this immunosensor and its potential for point-of-care screening and diagnostic aid applications.
1 Introduction
First reported over a century ago, Tuberculosis (TB) was the leading cause of death by a single infectious agent contaminating over 10.6 million worldwide in 2022, until SARS-CoV-2 pandemic (Daniel, 2006; WHO, 2023). Despite the efforts to eradicate TB epidemic by the year 2035, the increased number of new cases has warned world health agencies. The first pillar towards TB eradication consists of integrated, patient-centered care and prevention, including the development of methods for early diagnosis (WHO, 2015). The traditional methods used for TB diagnosis are chest radiography, sputum smear microscopy, liquid culture and molecular tests (Acharya et al., 2020). Although their extensive use, these methods have several limitations, such as the inability to detect latent infection, the non-differentiation between live and dead bacilli or long periods of time to obtain the initial result, i.e., up to 8 weeks for liquid culture results (Acharya et al., 2020).
To overcome this scenario, fast molecular tests are recommended by the World Health Organization (WHO) as initial diagnostic tests for TB, such as Xpert MTB/RIF Ultra (Ultra) (Cepheid, Sunnyvale, CA, United States) and Truenat MTB, MTB Plus, and MTB-RIF Dx assays (Molbio Diagnostics, Verna, India), some of which can simultaneously detect drug resistance (Silva et al., 2011). These tests utilize real-time PCR to detect the DNA of the M. tuberculosis complex (MTBC). The Ultra test has a limit of detection (LOD) of 19 bacterial colony-forming units (CFU) per milliliter of sputum, and in the case of positive results, it also detects mutations in the rpoB gene, associated with rifampicin resistance (Lou-Franco et al., 2023). The Truenat MTB and MTB Plus tests exhibit LODs of 100 and 29 CFU/mL, respectively (Das et al., 2022). The MTB-RIF Dx assay detects rifampicin resistance in DNA extracted from a patient’s sputum specimen (Silva et al., 2011; Gilbride et al., 2021). Nevertheless, the costs and infrastructure requirements of molecular testing methods do not allow scaling up, and many regions around the world still rely on outdated TB diagnostic tests (Azmi et al., 2021).
Electrochemical biosensors have emerged as a promising alternative for TB diagnosis due to their simplicity, low-cost instrumentation, extremely low detection limits, and fast response (Lightbody et al., 2008). These biosensing platforms are particularly interesting for integration with portable devices due to their ease of miniaturization, batch fabrication, and integration with an electronic acquisition module on a single chip (He et al., 2016). Additionally, electrochemical signals, such as electrical current and potential, can be collected by simple, portable, and low-cost instruments with low power consumption, offering an alternative for the development of POC diagnostic devices (He et al., 2016).
Several biosensors systems have been developed to detect mycobacteria for TB diagnosis. Silva and coworkers developed a biosensing platform based on a colorimetric Au-nanoprobe system and optoelectronic sensor to detect a specific DNA target derived from MTBC, namely M. tuberculosis and M. bovis, with a LOD of 50 fmol μL-1 (Silva et al., 2011). Another colorimetric biosensor was reported by Lou-Franco et al., using a proof-of-concept smartphone-based competitive immunological test to detect M. bovis, exploiting the peroxidase-mimicking activity of gold nanostars (Lou-Franco et al., 2023). The immunosensor was able to detect the target with a limit of detection of 7.2 × 10³ CFU mL-1. Furthermore, a biogenic AuNP conjugated with a monoclonal antibody specific for M. bovis (QUBMA-Bov) with a LOD of approximately 53 CFU mL-1 was reported in Das et al. (2022). The use of Prunus nepalensis fruit extract improved the catalytic efficiency of AuNPs, suitable for application in a colorimetric immunosensing device. Alternatively, Gilbride and coworkers developed a catalytic ferromagnetic immunoassay targeting MPT64, a secreted protein important for MTBC immunopathogenicity, allowing the detection and differentiation of MTB and M. bovis (Gilbride et al., 2021). Au-Fe3O4NP bioconjugates have also been employed as active elements in biosensing, and the LOD50% of the resulting immunosensor, i.e. the concentration where the probability of detection is 50%, was 147 and 682 CFU mL-1 for MTB and M. bovis, respectively. Another biosensor, based on a portable electrochemical aptamer-antibody assay was developed for MTB detection in sputum clinical samples (Azmi et al., 2021). In this strategy, the sandwich aptasensor detected CFP10:ESAT6 complex, an antigen secreted by MTB, with a detection limit of 1.5 ng mL-1, by using Fe3O4/Au NPs as a label and graphene/polyaniline (GP/PANI) nanocomposite as a signal amplification layer. Even though these biosensors present remarkable features, they still have few limitations as expensive lab-based readout equipment and high costs, which hinders their wide use by healthcare systems.
In this study, we present a proof-of-principle strategy to develop an impedimetric electrochemical immunosensor for the simple and effective detection and quantification of the CFP10:ESAT6 recombinant protein. The CFP10:ESAT6 complex is an antigen secreted by MTB exclusively during its early culture phase and demonstrates greater sensitivity for the detection of MTB compared with the isolated CFP10 and ESAT6 antigens (Lightbody et al., 2008), (He et al., 2016). Disposable indium tin oxide (ITO) electrodes were used as electrochemical transducers because they are suitable substrates for applications with biomolecules, given their low surface resistivity, chemical stability, and capacity for biochemical modification, as well as their wide electrochemical working window and stable electrochemical properties. A layer of 3-aminopropyltrimethoxysilane (APTES) was used to modify the ITO surface, resulting in an electrode surface with a high density of amino groups (ITO/APTES). These amino (-NH₂) groups were employed to covalently immobilize anti-CFP10 monoclonal antibodies through their reaction with the carboxyl groups of the antibodies, activated by EDC/NHS chemistry (Bart et al., 2009). The anti-CFP10 monoclonal antibody bioreceptor, immobilized on the transducer surface, recognizes the CFP10 protein of the CFP10:ESAT6 complex with high sensitivity and selectivity. This biorecognition event is direct, requiring neither a marker (label-free) nor a redox mediator, and can be detected by electrochemical impedance spectroscopy (EIS) (Cancelliere et al., 2024). The immunosensor construction steps were monitored by cyclic voltammetry (CV) and EIS, and the biorecognition event was detected by EIS. The optimized immunosensor (ITO/APTES/anti-CFP10) was successfully applied to detect CFP10:ESAT6 complex in concentrations ranging from 0.5 to 200 ng mL-1. The results of this proof-of-principle indicate that the proposed immunosensor is suitable and could serve as a rapid, sensitive, and reliable device for CFP10:ESAT6 complex detection in TB diagnosis.
2 Materials and methods
2.1 Materials
(3-Aminopropyl) triethoxysilane (APTES), potassium hexaferrocyanide (II) (K4 [Fe(CN)6]), ethanolamine (ETA), 1-ethyl-3-(3-dimethylaminopropyl)carbodiimide (EDC), N-hydroxysuccinimide (NHS) and potassium chloride (KCl) were purchased from Sigma-Aldrich Co., Ltd. (Brazil) and used without further purification. The antibodies anti-CFP10 and anti-ESAT-6 (monoclonal e polyclonal, respectively), recombinant protein CFP10:ESAT6 (pCFP10:ESAT6) and Dengue Virus NS1 Type 2 Recombinant Protein (NS1 DENV) were acquired from MyBioSource (United States). SARS-CoV-2 Spike Protein Recombinant Antigen was acquired from Sigma-Aldrich Co., Ltd. (Brazil). Propanone, isopropyl alcohol, and ethanol were obtained from Synth (Brazil). Indium tin oxide (ITO) coated glass slides, purchased from Delta Technologies, Loveland, CO, United States (surface resistivity = 8–12 Ω, working area = 0.5 cm2).
Stock solutions were prepared in phosphate buffer solution (PBS), using monosodium and disodium phosphate (10 mmol L-1, pH 7.4) (Sigma Aldrich, Brazil). Ultrapure water (18.2 MΩ cm) produced by Millipore Milli-Q system was used to prepare all the aqueous solutions herein employed.
2.2 Biosensors fabrication
ITO electrodes were cleaned with acetone, isopropyl alcohol, ethanol and ultrapure water, respectively, in an ultrasonic bath for 10 min each step. This cleaning procedure is imperative to avoid organic contamination, which could adsorb onto ITO surface and compromise the efficiency of modification.
The immunosensor construction was carried out in four different steps: i) silanization of ITO surface with an aminosilane, ii) antibody-immobilization, iii) blocking with ethanolamine and iv) protein detection, as depicted in Figure 1.

Figure 1. Schematic representation of TB immunosensor construction. (A) ITO surface modification with APTES (B) Monoclonal antibody immobilization (C) surface blocking with ETA (D) recognition of CFP10:ESAT6 protein and (E) Immunosensor after the biorecognition reaction.
The first step in the biosensor fabrication involved the functionalization of the ITO surface by immersing the electrodes in an ethanolic solution of APTES (2%, v/v) for 1 h (Figure 1A) to introduce −NH2 groups onto the ITO surface. Then, the electrodes were rinsed with ethanol and ultrapure water, followed by immersion in an EDC/NHS/anti-CFP10 solution (8 mmol L⁻1, 5 mmol L⁻1, and 10 μg mL⁻1, respectively, in PBS) for 90 min (Figure 1B) to activate the terminal carboxyl groups of the antibody and the NH₂ groups on the silanized ITO surface, according to Bart et al. (2009). The electrodes were rinsed with PBS buffer and water to remove unbound antibodies and then immersed in an ETA solution (100 mmol L⁻1 in PBS, 45 min) to block nonspecific binding sites and unreacted −NH₂ groups on the ITO surface (Figure 1C). After rinsing with PBS, the electrodes were immersed in a CFP10:ESAT6 protein solution (200 ng mL⁻1 in PBS) for 1 h (Figure 1D). All experiments were performed at 21°C. The electrodes were designated as ITO/APTES, ITO/APTES/anti-CFP10, and ITO/APTES/anti-CFP10/pCFP10:ESAT6, according to their respective modifications.
2.3 Electrochemical measurements
Cyclic voltammetry (CV) and electrochemical impedance spectroscopy (EIS) measurements were performed using an Autolab PGSTAT 302N, Potentiostat/Galvanostat from Metrohm Autolab controlled by GPES and FRA softwares (version 4.9, Netherlands). In CV measurements, the potential applied varied between 200 and 1,000 mV (2 cycles, scan rate 100 mV s-1). In EIS, a sinusoidal signal with 10 mV amplitude was applied over the open cell potential (OCP) in a frequency range between 10 kHz and 0.1 Hz. Results were expressed in terms of charge transfer resistances (Rct) with respect to the geometric area of the ITO, and the results were analyzed using ΔRct.
TB immunosensors with 0.5 cm2 of geometric area were used as working electrodes. All the electrochemical measurements were conducted in a conventional three-electrode cell, where a platinum plate (1 cm2) and Ag/AgCl electrode (saturated with 3 mol L-1 KCl) were used as counter and reference electrodes, respectively. Since TB immunosensor is an impedimetric sensor, without redox products, it was used 4 mmol L-1 of K4 [Fe(CN)6] as redox probe to characterize the modification and immobilization steps during the immunosensor construction and optimization.
2.4 Biosensors surface characterization
The morphologies and roughness of the TB immunosensor were evaluated via AFM by using a NanoSurf Flexa atomic force microscope (Nanosurf, Switzerland) in tapping mode with a resonant frequency of 190 KHz and vibration amplitude of 200 mV. The images were recorded in dynamic force under humidity control. The Gwyddion software was used for treatment of the images.
Raman spectroscopy was performed in an InViaTM Raman confocal microscope (Renishaw, UK) equipped with a 532 nm laser and using a grating of 1800 lines. mm–1. The acquisition time for each spectrum was 30 s, and an average of 10 accumulations was used to improve noise reduction in the measured data. Raman spectra were obtained from a few different regions of the electrodes. All measurements were carried out at room temperature. Data handling and processing proceeded with WiRE 5.4 software.
3 Results and discussion
3.1 TB immunosensor profile
The activation of the ITO electrodes was performed using CV technique, followed by EIS measurements after each modification step during electrode assembly, i.e., ITO/APTES, ITO/APTES/anti-CFP10 and ITO/APTES/anti-CFP10/pCFP10:ESAT6. The cyclic voltammograms and Nyquist plots (from CV and the EIS measurements, respectively) are shown on Figure 2.
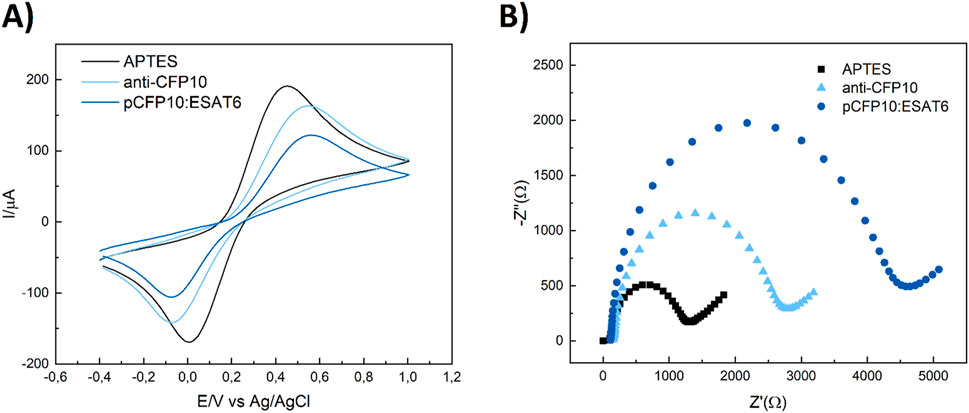
Figure 2. Electrochemical characterization of the main steps of pCP10:ESAT6 immunosensor construction. (A) Cyclic voltammograms (B) Electrochemical impedance spectra. (Black) ITO/APTES, (light-blue) ITO/APTES/anti-CFP10, (Blue) ITO/APTES/anti-CFP10/pCFP10:ESAT6. Cyclic voltammograms conditions: v = 100 mV/s, −400–1,000 mV vs. Ag/AgCl/3M KCl. Nyquist plots conditions: a = 10 mV, f = 10 kHz to 0.1 Hz, open circuit. Biorecognition with 10 μg mL-1 of anti-CFP10 and 200 ng mL-1 of pCFP10:ESAT6 for 45 min.
The analysis of film growth was primarily carried out through CV measurements (Figure 2A). As each construction step was performed, it was expected an increase of Fe [(CN)6]4- Rct and peak-to-peak difference (
Similarly, the charge transfer resistance (Rct) values, obtained through EIS technique, is interpreted as the interface ohmic resistance and expresses the resistance of a charge transfer between the electrode and the solution (Freitas et al., 2016). Based on the Randles circuit model, the Rct fitted from EIS was represented as the diameter of the semicircle in the Nyquist and used to characterize the adsorption of biomolecules onto the electrode surface, layer by layer (Figure 2B). After ITO surface functionalization with APTES, the electrode displayed
3.2 TB immunosensors optimization
To obtain the most favorable conditions for the electrochemical measurements of anti-CFP10 immobilization step and respective pCFP10:ESAT6 recognition, optimization studies were performed. For that end, analytical features such as concentration with ETA and blocking time, effects of antibody concentration and immobilization time, and protein-antibody conjugation time were analyzed. The results are shown in Supplementary Figure S1.
Initially, ITO-APTES platforms were immersed in a 100 mmol L-1 ETA solution for 15, 30, 45 and 60 min, to evaluate the effect of blocking time in protein-antibody conjugation, in pursuit of the lowest time. The charge transfer resistance of ITO surface before and after protein conjugation (ΔRct) increased from 358 Ω to 560 Ω, for 15 and 30 min, respectively (Supplementary Figure S1A). However, after 45 min of reaction time, ΔRct remained around 740 Ω, suggesting stabilization of blocking process. In sequence, ETA concentration in the blocking stage was evaluated. The electrodes were immersed in 50, 100, and 150 mmol L-1 ETA solutions, for 45 min (Supplementary Figure S1B). It was observed a two-fold increase in ΔRct from 659 Ω to 1,141 Ω, for 50 and 100 mmol L-1. Above this concentration, for 150 mmol L-1, the charge transfer resistance difference variation was not significant, increasing to 1,186 Ω. Thus, the concentration selected for further studies was 100 mmol L-1.
The immobilization time of anti-CFP10 on the ITO modified platforms was then tested. The electrodes were kept immersed in the antibody’s solution for 30, 45, 60, 90, and 120 min (Supplementary Figure S1C). Surprisingly, the highest value of ΔRct was obtained for the lowest immersion time, 1,279 Ω for 30 min. Then, it was observed a decrease, from 1,205 Ω to 327 Ω for 45 and 60 min, followed by an increase from 567 Ω to 787 Ω for 90 and 120 min, respectively. Higher values of ΔRct indicates higher sensitivity of the sensor for protein detection. Therefore, the immobilization time chosen was 30 min. Next, anti-CFP10 concentration was varied in 5, 10, 15 and 20 μg mL-1, maintaining the EDC/NHS concentration constant (Supplementary Figure S1D). The greatest value of ΔRct was observed for 10 μg mL-1, suggesting that the higher concentration of antibodies led to reduced available binding sites on the ITO electrodes and the formation of a packed film structure, which difficult the adequate antibody-protein interaction.
Finally, the ideal time for the interaction of the biosensor with pCFP10:ESAT6 was studied (Supplementary Figure S1E). The biosensor was immersed in a pCFP10:ESAT6 solution (200 ng mL-1) for 15, 30, 45, 60 and 90 min. The highest values of ΔRct were obtained after 60 min of immersion, which was the time chosen to continue the studies. Therefore, a complete assay for pCFP10:ESAT6 detection with optimal features had a total time of 4 h, including electrochemical measurements after each fabrication step.
3.3 TB immunosensors’ surface characterization
The TB immunosensor’s surface was characterized by Raman spectroscopy and AFM. Figure 3 shows the Raman spectra of the electrodes after each fabrication step. Bare ITO spectrum (green line) presented typical bands at 563 cm-1 and 1,096 cm-1 which are consistent with the literature (Chandrasekhar and Choy, 2001). After modification with APTES, the main vibrational modes characteristic of APTES are observed: the peak at 389 cm-1 is attributed to the bond-bending vibration of O–Si–O, the peak at 640 cm-1 is related to C–N skeletal stretching, the peak at 1,060 cm-1 comes from C–C stretching close to Si, the bond-bending vibration of Si–O–Si occurs at 1,130 cm-1, the peaks between 1,300 and 1,460 cm-1 are mainly related to vibrations of CH2 and CH2 bonded to Si, and the peak at 1,605 cm-1 can be assigned to NH2 bending vibration (Shimizu et al., 1997; Sun et al., 2017; Chiang et al., 1980). Peaks at 2,850, 2,880 and 3,250 cm-1, corresponding to CH2 symmetric stretching, stretching vibration of CH3 and NH groups, were also observed (Chiang et al., 1980; Krafft et al., 2005). The electrode spectra after anti-CFP10 immobilization presented peaks at 536, 874, 983 and 1,077 cm-1, corresponding to S-S disulfide stretching, C-C stretching, C-C stretching of β-sheets of the protein structure and C–C skeletal stretching, respectively (Movasaghi et al., 2007). Additionally, a strong peak between 2,750 and 3,750 cm-1, corresponding to asymmetric stretching vibration of CH3, OH and NH groups vibration of proteins was observed (Movasaghi et al., 2007), consistent with the antibody structures. The pCFP10:ESAT6 spectra was characterized by a C-C skeletal stretching (1,063 and 1,130 cm-1), CH2 deformation (1,297 and 1,442 cm-1) and a peak between 2,760 and 2,980 cm-1, corresponding to CH, OH and NH stretching vibration (Movasaghi et al., 2007). These spectral features are present in the mycobacterial Raman spectra, as reported in (Stöckel et al., 2017). The results showed that the methodology employed was successful in different stages of immunosensor manufacturing with adequate functionalization of the groups of interest.
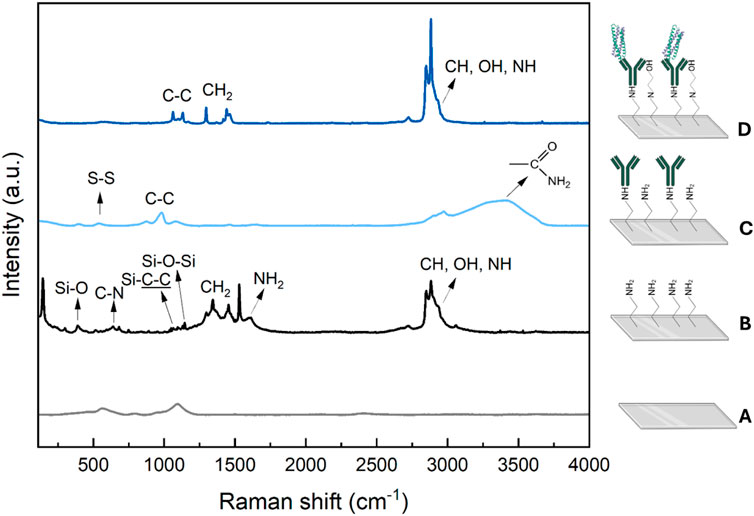
Figure 3. Raman spectra obtained for: (A) bare ITO (gray), (B) ITO/APTES (black), (C) ITO/APTES/anti-CFP10 (light-blue) and (D) ITO/APTES/anti-CFP10/pCFP10:ESAT6 (blue) immunosensor surfaces.
The morphologies of the electrodes were evaluated using AFM, as shown in Figure 4. The surface morphology of a bare ITO reveals the grainy structures of the electrode surface (Figure 4A). Figure 4B shows the surface of the electrode modified with APTES, different from the one shown in Figure 4A, indicating that the formation of a silane monolayer was accomplished, and it changed the topography of the electrode surface. As observed, APTES aggregates homogeneously spread over the surface, probably due to increasing siloxane film lateral polymerization and network formation (Weiping et al., 1999) Similarly, after antibody immobilization onto the ITO surface and protein recognition, changes were observed on the electrode surface. Furthermore, the root mean square (RMS) roughness increased after each stage, as presented in Supplementary Table S1, indicating the successful fabrication of the immunosensor.
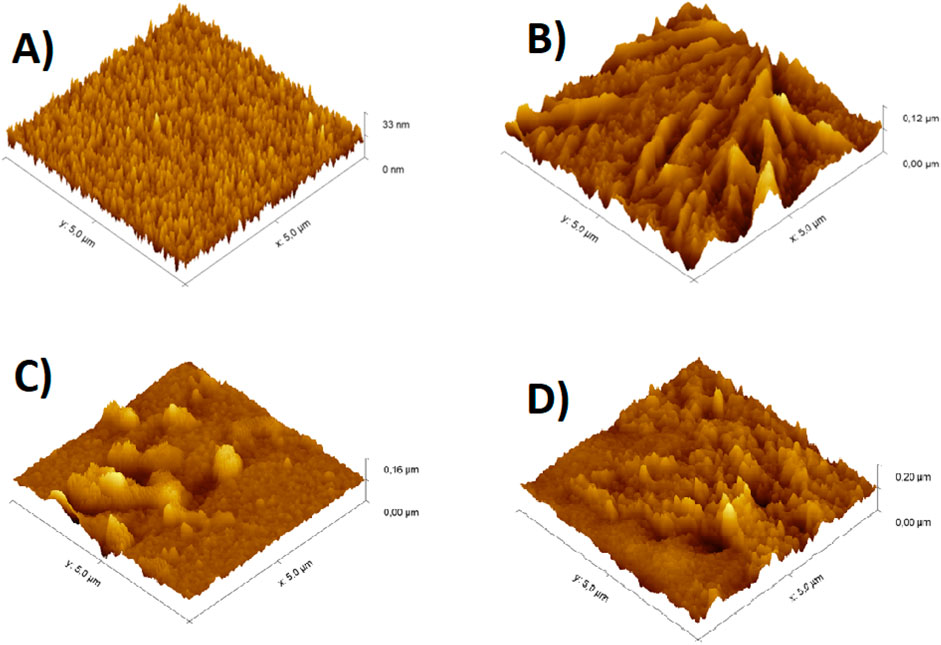
Figure 4. Topography images obtained from AFM in 3-D for: (A) bare ITO, (B) ITO/APTES, (C) ITO/APTES/anti-CFP10 and (D) ITO/APTES/anti-CFP10/pCFP10:ESAT6 immunosensor surfaces. Note that the scale is not the same in these images.
3.4 Analytical features of the TB immunosensor
3.4.1 Detection of the pCFP10:ESAT6 protein
The calibration curve was obtained by measuring the values of
Where
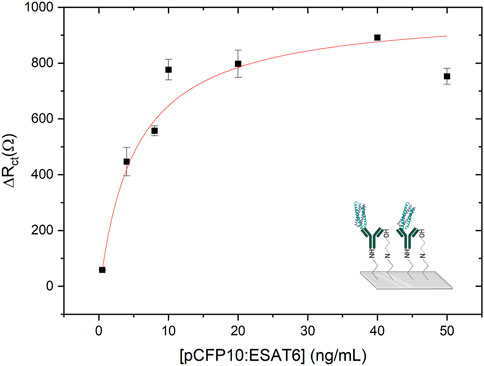
Figure 5. Calibration curve obtained by TB immunosensor from 0.5 ng mL-1–50 ng mL-1 of pCFP10:ESAT6. Before each EIS measurement the modified electrode was incubated with CFP10:ESAT6 protein concentration solutions for 1 h to the biorecognition. AC perturbation voltage of 0.01 V in the frequency range from 10 kHz to 0.1 Hz in a buffer solution (PBS, pH 7.4) containing 4 mmol L-1 [Fe(CN)6]4−.
The limits of detection (LOD) and quantification (LOQ) were calculated from the calibration plot using the following equations:
Where
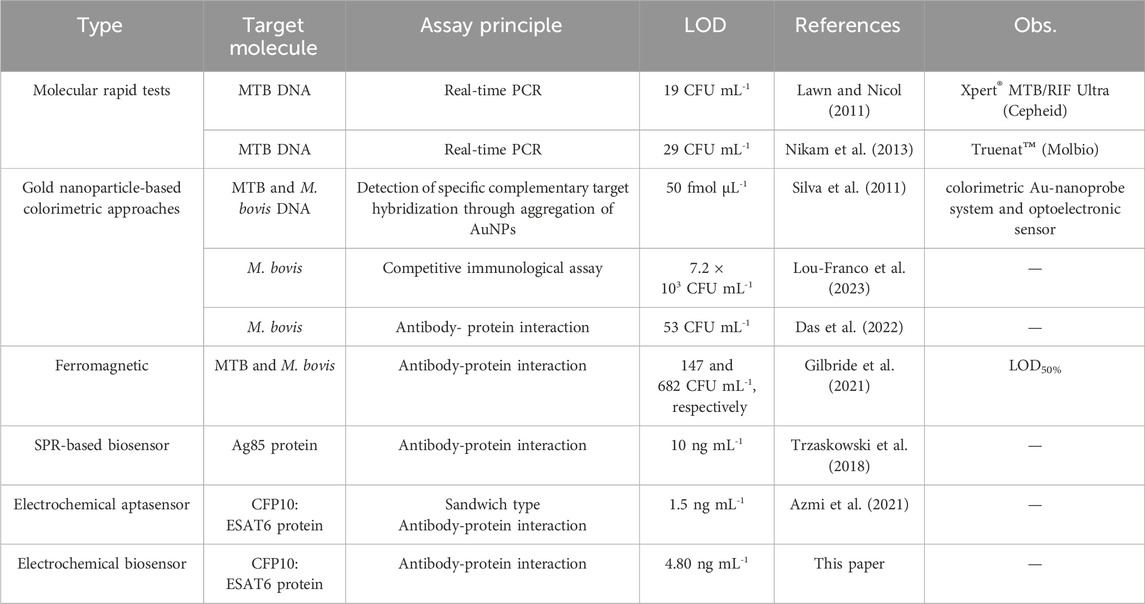
An immunosensor to detect M. tuberculosis based on a colorimetric Au-nanoprobe system and optoelectronic sensor was reported in Silva et al. (2011) and exhibited satisfactory linear responses in the detection of MTB and M. bovis DNA concentration range from 50 to 300 nmol L-1, with detection of limit of 50 fmol mL-1. Another interesting study was published by Lou-Franco et al. (2023), where a smartphone-based competitive immunosensor was able to detect M. bovis with a LOD of 7.2 × 10³ CFU mL-1 with linear responses between 104 and 106 CFU mL-1. Furthermore, Das et al. (2022) developed a biogenic AuNP conjugated with a monoclonal antibody specific to M. bovis (QUBMA-Bov) with LoD of approximately 53 CFU mL-1, by using P. nepalensis fruit extract to improve the catalytic efficiency of AuNPs, within a lower concentration range between 100 to 102 CFU mL-1. Alternatively, a catalytic ferromagnetic immunoassay was reported in Gilbride and coworkers (2021), targeting MPT64 protein, with LOD of 147 and 682 CFU mL-1 for MTB and M. bovis, respectively. A portable SPR device was designed and reported by Trzaskowski et al. (2018) to detect Ag85 protein in bacteria cultures and real samples in concentrations of 104 CFU mL-1 and higher, with a limit of detection of 10 ng mL-1. CFP10:ESAT6 protein detection was targeted by a sandwich aptasensor, by using Fe3O4/Au NPs as a label, and graphene/polyaniline (GP/PANI) nanocomposite as a signal amplification layer (Azmi et al., 2021). This electrochemical aptasensor exhibited good responses in a concentration range of 5–500 ng mL-1 and LOD of 1.5 ng mL-1 Table 1 presents a comparison between studies presented above, the molecular tests Xpert® MTB/RIF Ultra and Truenat™ (Molbio), recommended by the WHO, and the impedimetric immunosensor developed in this study. Although the reported biosensors exhibit excellent analytical characteristics, they still rely on expensive laboratory-based readout equipment and high costs, which hinder their widespread use.
Repeatability and reproducibility test measurements were conducted using 10 μg mL-1 of anti-CFP10 and 20 ng mL-1 of pCFP10:ESAT6. Repeatability tests were conducted on the same day using three different immunosensors. For each immunosensor, four measurements of the Rtc value were taken following interaction with the target protein. The mean, standard deviation, and relative standard deviation (RSD) of the Rtc values obtained are presented in Supplementary Table S2. It can be observed that the RSD values of 21%, 9%, and 13% for the immunosensors produced on the same day demonstrate repeatability in production. Furthermore, the sequential measurements confirm both repeatability and measurement stability. For the reproducibility tests, four immunosensors were produced, one per day, over four consecutive days. Measurements were taken immediately after the production of each immunosensor, and the Rct values were recorded both before and after interaction with the CFP10 protein. The values of ΔRct, mean, standard deviation, and relative standard deviation (RSD) are presented in Supplementary Table S3. Considering the ΔRct values for the four immunosensors, a very high RSD was observed. However, when the outlier value of 1732 Ω (which is 2.1 times greater than the mean) is excluded, the new mean ΔRct value becomes 501 Ω, with an RSD of 24%. For a proof-of-principle, we can consider that the immunosensor demonstrates good manufacturing reproducibility and interday measurement reproducibility.
3.4.2 Selectivity of the TB immunosensor biorecognition
To test the selectivity of CFP10:ESAT6 protein immunosensors, detection measurements were performed with NS1 DENV and SARS-CoV-2 Spike proteins with a concentration of 20 ng mL−1 which is a tenth of the pCFP10:ESAT6 concentration of optimization studies.
As shown in Figure 6, ∆Rct values of 509 ± 89 Ω and 376 ± 127 Ω were obtained for DENV NS1 and Spike proteins, respectively. Despite our impedimetric biosensor exhibiting some resistance response to both proteins, the signal for the CFP10:ESAT6 protein was approximately 80% higher, showing the selectivity capability identified by the immunosensor.
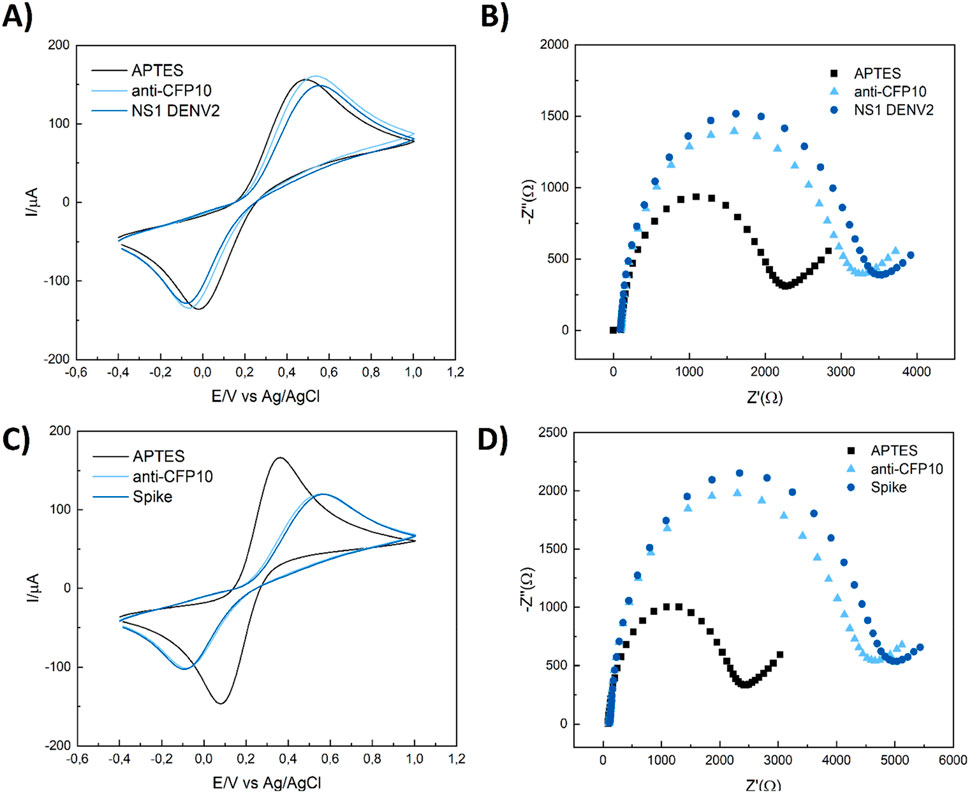
Figure 6. CV and EIS selectivity responses to TB immunosensor in the presence of 20 ng mL-1 of NS1 DENV (A, B) and SARS-CoV-2 spike protein (C, D) in the same conditions of previous studies. Cyclic voltammetry conditions: v = 100 mV/s, -0.40 to 1.00 mV vs. Ag/AgCl/3M KCl and EIS measurements conditions: a = 10 mV, f = 10 kHz to 10 mHz, open circuit.
4 Conclusion
In this work, we present a proof-of-principle for the use of an impedimetric immunosensor to detect the CFP10:ESAT6 protein, aiding in the diagnosis of tuberculosis. The immunosensor is based on indium tin oxide electrodes modified with APTES for the covalent immobilization of the monoclonal capture antibody, anti-CFP10. Protein biorecognition was achieved through protein-antibody conjugation. The CFP10:ESAT6 complex can be detected and quantified by the variation in charge transfer resistance caused by the conjugation reaction. The immunosensors detected the protein at concentrations as low as 0.5 ng mL⁻1, with a total assay time of 4 h, and LOD and LOQ values of 4.80 ng mL⁻1 and 15.97 ng mL⁻1, respectively. Our biosensor device exhibited good reproducibility and repeatability, demonstrating its suitability, accuracy, and selectivity for the detection of pCFP10:ESAT6 in the presence of DENV NS1 and SARS-CoV-2 Spike proteins. The small sample volume and short testing time (4 h) are excellent features for future point-of-care applications. We hope that the presented immunosensors will lead to more accessible and time-efficient tuberculosis testing.
Data availability statement
The original contributions presented in the study are included in the article/Supplementary Material, further inquiries can be directed to the corresponding author.
Author contributions
LR: Data curation, Formal Analysis, Investigation, Methodology, Software, Writing–original draft, Writing–review and editing. JC-B: Conceptualization, Data curation, Formal Analysis, Methodology, Project administration, Supervision, Writing–original draft, Writing–review and editing. CR: Formal Analysis, Methodology, Writing–review and editing. TM: Formal Analysis, Methodology, Software, Writing–review and editing. MT: Methodology, Software, Writing–review and editing. VZ: Conceptualization, Funding acquisition, Project administration, Resources, Supervision, Writing–original draft, Writing–review and editing.
Funding
The author(s) declare that financial support was received for the research, authorship, and/or publication of this article. The authors are grateful to CNPq/BRICS 440116/2020-1 for their financial assistance and LR special thanks CNPq for the scholarship granted process number 382371/2021-6.
Conflict of interest
The authors declare that the research was conducted in the absence of any commercial or financial relationships that could be construed as a potential conflict of interest.
The author(s) declared that they were an editorial board member of Frontiers, at the time of submission. This had no impact on the peer review process and the final decision.
Generative AI statement
The author(s) declare that no Generative AI was used in the creation of this manuscript.
Publisher’s note
All claims expressed in this article are solely those of the authors and do not necessarily represent those of their affiliated organizations, or those of the publisher, the editors and the reviewers. Any product that may be evaluated in this article, or claim that may be made by its manufacturer, is not guaranteed or endorsed by the publisher.
Supplementary material
The Supplementary Material for this article can be found online at: https://www.frontiersin.org/articles/10.3389/fsens.2024.1512936/full#supplementary-material
References
Acharya, B., Acharya, A., Gautam, S., Ghimire, S. P., Mishra, G., Parajuli, N., et al. (2020). Advances in diagnosis of Tuberculosis: an update into molecular diagnosis of Mycobacterium tuberculosis. Springer. doi:10.1007/s11033-020-05413-7
Azmi, U. Z. M., Yusof, N. A., Abdullah, J., Mohammad, F., Ahmad, S. A. A., Suraiya, S., et al. (2021). Aptasensor for the detection of mycobacterium tuberculosis in sputum utilising cfp10-esat6 protein as a selective biomarker. Nanomaterials 11, 2446–2460. doi:10.3390/nano11092446
Bart, J., Tiggelaar, R., Yang, M., Schlautmann, S., Zuilhof, H., and Gardeniers, H. (2009). Room-temperature intermediate layer bonding for microfluidic devices. Lab. Chip 9 (24), 3481–3488. doi:10.1039/b914270c
Boswell, C. A., Tesar, D. B., Mukhyala, K., Theil, F. P., Fielder, P. J., and Khawli, L. A. (2010). Effects of charge on antibody tissue distribution and pharmacokinetics. Am. Chem. Soc. 21, 2153–2163. doi:10.1021/bc100261d
Brazaca, L. C., Bramorski, C. B., Cancino-Bernardi, J., da Silveira Cruz-Machado, S., Markus, R. P., Janegitz, B. C., et al. (2018). An antibody-based platform for melatonin quantification. Colloids Surf. B Biointerfaces 171, 94–100. doi:10.1016/j.colsurfb.2018.07.006
Cancelliere, R., Paialunga, E., Grattagliano, A., and Micheli, L. (2024). Label-free electrochemical immunosensors: a practical guide. Elsevier B.V. doi:10.1016/j.trac.2024.117949
Chandrasekhar, R., and Choy, K. L. (2001). Innovative and cost-effective synthesis of indium tin oxide films. Thin Solid Films 398–399, 59–64. doi:10.1016/s0040-6090(01)01434-1
Chiang, C.-H., Ishida, H., and Koenig, J. L. (1980). The structure of γ-aminopropyltriethoxysilane on glass surfaces. J. Colloid Interface Sci. 74 (2), 396–404. doi:10.1016/0021-9797(80)90209-X
Daniel, T. M. (2006). The history of tuberculosis. Respir. Med. 100 (11), 1862–1870. doi:10.1016/j.rmed.2006.08.006
Das, B., Lou-Franco, J., Gilbride, B., Ellis, M. G., Stewart, L. D., Grant, I. R., et al. (2022). Peroxidase-mimicking activity of biogenic gold nanoparticles produced from Prunus nepalensis fruit extract: characterizations and application for the detection of Mycobacterium bovis. ACS Appl. Bio Mater 5, 2712–2725. doi:10.1021/acsabm.2c00180
Deming, S. N., Michotte, Y., Massart, D. L., Kaufman, L., and Vandeginste, B. G. M. (1988). Chemometrics. 1st ed. Elsevier Science.
Freitas, M., Correr, W., Cancino-Bernardi, J., Barroso, M. F., Delerue-Matos, C., and Zucolotto, V. (2016). Impedimetric immunosensors for the detection of Cry1Ab protein from genetically modified maize seeds. Sens. Actuators B Chem. 237, 702–709. doi:10.1016/j.snb.2016.06.149
Gilbride, B., Schmidt Garcia Moreira, G. M., Hust, M., Cao, C., and Stewart, L. (2021). Catalytic ferromagnetic gold nanoparticle immunoassay for the detection and differentiation of Mycobacterium tuberculosis and Mycobacterium bovis. Anal. Chim. Acta 1184, 339037. doi:10.1016/j.aca.2021.339037
He, F., Xiong, Y., Liu, J., Tong, F., and Yan, D. (2016). Construction of Au-IDE/CFP10-ESAT6 aptamer/DNA-AuNPs MSPQC for rapid detection of Mycobacterium tuberculosis. Biosens. Bioelectron. 77, 799–804. doi:10.1016/j.bios.2015.10.054
Krafft, C., Neudert, L., Simat, T., and Salzer, R. (2005). Near infrared Raman spectra of human brain lipids. Spectrochim. Acta A Mol. Biomol. Spectrosc. 61, 1529–1535. doi:10.1016/j.saa.2004.11.017
Lawn, S. D., and Nicol, M. P. (2011). Xpert ® MTB/RIF assay: development, evaluation and implementation of a new rapid molecular diagnostic for tuberculosis and rifampicin resistance. Future Microbiol. 6 (9), 1067–1082. doi:10.2217/fmb.11.84
Lightbody, K. L., Ilghari, D., Waters, L. C., Carey, G., Bailey, M. A., Williamson, R. A., et al. (2008). Molecular features governing the stability and specificity of functional complex formation by Mycobacterium tuberculosis CFP-10/ESAT-6 family proteins. J. Biol. Chem. 283 (25), 17681–17690. doi:10.1074/jbc.M800123200
Lou-Franco, J., Zhao, Y., Nelis, J. L., Stewart, L., Rafferty, K., Elliott, C., et al. (2023). Smartphone-based immunochemical sensor exploiting peroxidase-like activity of ligand-capped gold nanostars: a proof-of-concept detection of Mycobacterium bovis. Biosens. Bioelectron. 220, 114857. doi:10.1016/j.bios.2022.114857
Movasaghi, Z., Rehman, S., and Rehman, I. U. (2007). Raman spectroscopy of biological tissues. Appl. Spectrosc. Rev. 42, 493–541. doi:10.1080/05704920701551530
Nikam, C., Jagannath, M., Narayanan, M. M., Ramanabhiraman, V., Kazi, M., Shetty, A., et al. (2013). Rapid diagnosis of Mycobacterium tuberculosis with Truenat MTB: a near-care approach. PLoS One 8 (1), e51121. doi:10.1371/journal.pone.0051121
Shimizu, I., Okabayashi, H., Taga, K., and O’connor, C. J. (1997). Raman scattering study of polyaminopropylsiloxane and its compounds for characterization of 3-aminopropylsilane-modified silica gel. Utility of the CH2 rock and skeletal stretch modes. Colloid Polym. Sci. 275, 555–560. doi:10.1007/s003960050118
Silva, L. B., Veigas, B., Doria, G., Costa, P., Inácio, J., Martins, R., et al. (2011). Portable optoelectronic biosensing platform for identification of mycobacteria from the Mycobacterium tuberculosis complex. Biosens. Bioelectron. 26, 2012–2017. doi:10.1016/j.bios.2010.08.078
Stöckel, S., Meisel, S., Lorenz, B., Kloß, S., Henk, S., Dees, S., et al. (2017). Raman spectroscopic identification of Mycobacterium tuberculosis. J. Biophot. 10, 727–734. doi:10.1002/jbio.201600174
Sun, Y., Yanagisawa, M., Kunimoto, M., Nakamura, M., and Homma, T. (2017). Depth profiling of APTES self-assembled monolayers using surface-enhanced confocal Raman microspectroscopy. Spectrochim. Acta A Mol. Biomol. Spectrosc. 184, 1–6. doi:10.1016/j.saa.2017.04.036
Trzaskowski, M., Napiórkowska, A., Augustynowicz-Kopeć, E., and Ciach, T. (2018). Detection of tuberculosis in patients with the use of portable SPR device. Sens. Actuators B Chem. 260, 786–792. doi:10.1016/j.snb.2017.12.183
Weiping, Q., Bin, X., Lei, W., Chunxiao, W., Danfeng, Y., Fang, Y., et al. (1999). Controlled site-directed assembly of antibodies by their oligosaccharide moieties onto APTES derivatized surfaces. J. Colloid Interface Sci. 214, 16–19. doi:10.1006/jcis.1999.6151Available at: http://www.idealibrary.com.
WHO, W. H. O. (2023). Global tuberculosis report 2023. Geneva. Available at: https://iris.who.int/.
Keywords: Mycobacterium tuberculosis, immunosensors, electrochemical impedance spectroscopy, impedimetric biosensors, nanomedicine
Citation: Ribeiro LV, Cancino-Bernardi J, Razzino CdA, Machado TR, Tuesta MAM and Zucolotto V (2024) Exploring electrochemical impedance spectroscopy for the early diagnosis of Mycobacterium tuberculosis using CFP10:ESAT6 protein detection. Front. Sens. 5:1512936. doi: 10.3389/fsens.2024.1512936
Received: 17 October 2024; Accepted: 06 December 2024;
Published: 24 December 2024.
Edited by:
Rosaria Anna Picca, University of Bari Aldo Moro, ItalyReviewed by:
Burcu Özcan, Çanakkale Onsekiz Mart University, TürkiyeRocco Cancelliere, University of Rome Tor Vergata, Italy
Copyright © 2024 Ribeiro, Cancino-Bernardi, Razzino, Machado, Tuesta and Zucolotto. This is an open-access article distributed under the terms of the Creative Commons Attribution License (CC BY). The use, distribution or reproduction in other forums is permitted, provided the original author(s) and the copyright owner(s) are credited and that the original publication in this journal is cited, in accordance with accepted academic practice. No use, distribution or reproduction is permitted which does not comply with these terms.
*Correspondence: Juliana Cancino-Bernardi, anVjYW5jaW5vQHVzcC5icg==
 Luisa Vogado Ribeiro
 Juliana Cancino-Bernardi
 Claudia do Amaral Razzino
 Thales Rafael Machado
 Marco A. M. Tuesta1
 Valtencir Zucolotto