 Farhad Jalilian
 Caterina Valeo
 Angus Chu2
94% of researchers rate our articles as excellent or good
Learn more about the work of our research integrity team to safeguard the quality of each article we publish.
Find out more
ORIGINAL RESEARCH article
Front. Sens., 13 October 2023
Sec. Physical Sensors
Volume 4 - 2023 | https://doi.org/10.3389/fsens.2023.1242886
Impedance microbiology was explored to provide insights into how a sensor that can monitor the growth of bacteria in vegetated bioretention systems (rain gardens) may be designed for in situ, real-time use. The impedance properties of Pseudomonas Putida samples were monitored under AC signals of 100 mV peak-to-peak and sweeping frequencies of 20 Hz–300 kHz, to determine relationships between these properties and biomass in the laboratory. The capacitance of the samples was found to be the most sensitive impedance parameter, with average change in magnitude of 37% due to bacterial growth. For verification, optical density measurements were taken and calibrated by direct hemocytometry counts of similar samples, simultaneously with the impedance testing. The experiments revealed that exponential relationships enable a good estimate of the biomass available in the medium, based on the change in capacitance. The detection range of the proposed system (in the range of tested strain) is approximately ∼9.2 × 10⁶ cells/mL to ∼5 × 10⁸ cells/mL.
Stormwater runoff can lead to localized flooding as well as contamination of receiving waters from pollutants collected by the runoff. Modern stormwater management involves sustainable urban designs (SUDs) and low impact development options (LIDs) that integrate land use planning and engineering designs to manage stormwater runoff sustainably. Conserving the pre-developed characteristics of natural sites, reducing flooding and increasing water quality, are the main goals of LIDs. Bioretention cells, also referred to as bio-infiltration cells, vegetated biofilters, or rain gardens, are a popular type of LID that has been proven to decrease stormwater runoff quantity and increase stormwater quality from urban areas (Khan et al., 2012). The stormwater quality enhancement afforded by bioretention cells is achieved through the process of bioremediation. Bioremediation is a waste management method in which microorganisms play a key role in treating various pollutants in stormwater (LeFevre, et al., 2014). In the bioremediation process, biofilms provide the largest potential for decontamination by naturally converting contaminants into less harmful by-products. This has led to a field of research called biofilm-based treatment (Cunningham et al., 2008). In bioretention cells, biofilms emerge and develop on and around the vegetation root area and form part of what is referred to as the rhizosphere. Biofilms treats contaminated water by changing their own configuration, composition and gene expression to consume pollutants and organic materials as their food source. Biofilm can form as a result of the aggregation of millions, or of a single species of organic/inorganic compounds that can range from decomposing materials to microorganisms (Cunningham et al., 2008). According to Carpentier and Cerf (1993), a biofilm is a community of microbes implanted within an organic polymer matrix that adheres to a surface. Therefore, the three main components that are required for biofilm to form are microbes, an organic matrix, and a viable surface. Biofilm are the structure by which microbes adhere to the surface of almost every solid, such as river rocks, medical devices, etc. (O’Toole and Ghannoum, 2004). Bacterial biofilms have recently been gaining attention within a wide range of application areas, such as healthcare, environmental engineering and industrial biofouling.
Despite the extensive research on bioremediation through biofilms, there continues to be a lack of understanding of the bioremediation process in field applications of bioretention cells. Consequently, design guidelines optimizing bioremediation in rain gardens is lacking. This is also partly due to the fact, that there are few tools if any that can properly assess the bioremediative state of a rain garden. Being able to monitor the growth of bacterial biomass in these treatment systems could lead to improvements in treatment efficacy and design; but to the authors’ knowledge, there are no reliable methods for monitoring biofilm and biomass in rain gardens today. The literature contains various approaches to studying biofilm communities, and each method has advantages and drawbacks. According to Lewandowski and Beyenal (2003), monitoring biofilms helps us to gain a good understanding of biological processes within biofilm structure. However, clarity is needed on what parameters need to be measured and how these parameters can describe the biofilm system sufficiently for the end-user of that application.
Monitoring biofilm can be achieved using different methods depending on the environmental conditions of the host environment, and the chemical, biological, and physical properties of the biofilm under investigation. In general, the common fundamental concept behind these different monitoring methods is that they all function using a response signal acquired from the biofilm. These signals are a result of energy transfer, heat transfer, acoustic waves, electrical fields or electrical currents. The process of monitoring involves transmittance of input signals, modification of the input signals by the biofilm and its host environment, and detection of the output signals by the sensor. In fact, the biofilm leaves its characteristic footprints in the modified signal (output signal) (Janknecht and Melo, 2003).
Environmental conditions such as pH, temperature, and nutrient levels can control the attachment of bacterial cells to a surface and thus, these conditions can prevent or facilitate biofilm formation. Therefore, the ideal biofilm monitoring system is a system that can function in situ, non-destructively, continuously, online, and without intervention in the microbial community. Since biofilm formation starts with the adherence of planktonic cells to an inert surface that is followed by reproduction, biofilm monitoring tools are often designed to detect bacterial growth and proliferation in a growth media. Various methods have been developed for reliable biofilm monitoring or evaluation. Microscopic visualization techniques (Lawrence, et al., 1991) have been used in many studies (2D microscopy, for example, in de Carvalho and da Fonseca, 2007) including scanning electron microscopy (SEM), transmission electron microscopy (TEM) and confocal laser scanning microscopy (CLSM - Baum et al., 2009). Other techniques include piezoelectric (Nivens et al., 1993), optical and fiber optic sensing (Fischer et al., 2012; 2016), electrochemical (Cristiani et al., 2008), acoustic (Davis et al., 2010), and thermometric (Reyes-Romero, et al., 2014). Although many of these methods have proven to provide good results, their complexity and limitations have narrowed their applicability to just a few specific uses.
The requirements for the ideal monitoring system of interest for biofilm monitoring in bioretention cells should involve functionality that is real-time, non-invasive, non-destructive, online, quantitative, portable, autonomous with sufficiently long testing uptime and signal acquisition as well as large substrate surfaces, and affordable tracking. Many of these requirements such as rapid, portable or online monitoring of biofilm in the field prevent the use of microscopic methods. In addition, a system that can sense the bacteria population over a wide range of concentrations is desired. Thermal and piezoelectric sensors typically require the formation of biofilm layers in the order of tens of micrometers to show a response. This issue plus technical limitations inhibit their use particularly if early detection of bacterial biofilms is desired (Turolla, et al., 2019). Impedance microbiology (IM), however, is one of the more promising methods for being the basis of a viable sensor for use in bioretention cells in the field (Jalilian, 2020). Impedance sensing of biological samples has existed for a few decades but has recently gained increased attention due to advancements that provide fast, affordable, and automated testing in a wide variety of applications (Hardy et al., 1977; Sorrells, 1981; Gnan and Luedecke, 1982; Firstenbergeden and Klein, 1983; Strauss et al., 1984; Colquhoun, et al., 1995; Ntarlagiannis, et al., 2005; Davis et al., 2010; Pompei, et al., 2012; Tubía et al., 2018; Sammer et al., 2019). In the realm of impedimetric biological sensing, capacitance has also gained increasing interest leading to the emergence of capacitive biosensing that is a sub-category of impedance biosensing. According to Ertürk and Mattiasson (2017), the detection of various biological cells and components, such as proteins, nucleotides, microbial cells, pesticides, and herbicides, has become feasible with capacitive biosensors.
To the authors’ knowledge, there is no sensor that is commercially available that can be used both at an industrial scale, and in the field, for monitoring biofilm led bioremediation in rain gardens. The few available systems developed for monitoring such activity (ACEA Biosciences, which is now with Agilent Technologies Inc., and Applied Biophysics Inc. for examples) are compatible with lab-scale usage, but not field-scale use. Rodriguez-Mozaz et al. (2006) assert that in spite of the past improvements in biosensor technology, there still exists the challenge of developing devices that are more reliable. Unclear verification methods, sensitivity and detection thresholds are affecting further implementation and development of a well-calibrated biosensing system for bioretention cells. Following a review of methods for monitoring biofilm in the environment with attention to the factors required for such a feasible tool for rain gardens (Jalilian et al., 2023), impedance-based technology was the recommended method for a prototype design for monitoring biofilm activity in bioretention cells. The goal of this work is to provide insight into how an IM based, capacitive biomass sensor for use in bioretention cells could be developed. The objectives were to conceptualize, build and test a simple and inexpensive capacitive biosensor that could lead to a working prototype. The biosensor was tested on bacteria samples at laboratory scale, in order to identify basic impedance properties related to biomass extent. This serves as a first step to further development and testing in a micro-scale and eventually, a full-scale bioretention cell.
IM is based on electrochemical impedance spectroscopy of microorganisms, where changes in microbial metabolism induce changes in the electrical properties of the growth media. Living cells are composed of a closed, insulating membrane filled with liquid plasma that exhibits dielectric properties (Janknecht and Melo, 2003). Such a structure allows them to behave like electrical capacitors that are built to store electrical charge when an electric current is applied to them (Xu et al., 2016). When cells are exposed to an electrical field, the ions available in plasma tend to move towards the cell membrane creating a change in the electric field. This change can be measured by controlled signals transduced from a signal source through the electrodes in contact with the biofilm. As well, an extracellular contribution is added to the electron transport and therefore, to the resistance of the system under measurement (Yates, et al., 2018). Hence, other than capacitance, microbiota activity and proliferation are expected to be measurable through the tracking of the resistance. There is, however, no practical or theoretical evidence of microbial activity leading to the inductive properties of the system. Impedance-based sensing of biofilms involves the measurement of resistance R) and capacitance C) of the biological samples of interest via an alternating sinusoidal excitation of the samples. For AC signals, impedance Z) is given as:
with magnitude |Z| =
and
Figure 1A illustrates the basic components of any sensing system (Figliola and Beasley, 2014), which involves a transducer and a signal modification system that transforms the transducer output into a measurable form that is eventually logged by an indicator. Figure 1B shows the corresponding components for a possible IM based sensing system. Conceptually, the transducer forms the sensing component that would use IM technology leading to an observed, digital value that represents some measure of bacterial population change. This in turn would represent an estimate of microbial metabolism (the measurand) in this sensing system.
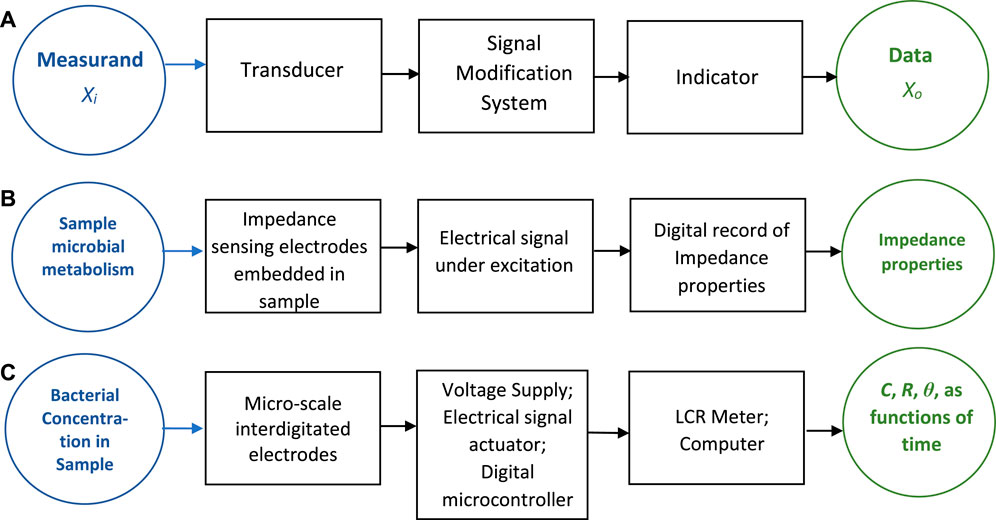
FIGURE 1. Block diagram for: (A) a generic sensor; (B) an impedance-based sensing system of bacterial population growth; and (C) the basis of the impedance-based sensor developed in this work.
Various factors must be considered in selecting an appropriate impedance testing platform for the application involved. Testing voltage and frequency range, the price of the device, the data and command inquiry, as well as communication capabilities are important factors. The frequency range needed for impedance microbiology is important because the wavelength of the excitation signals should be long enough to allow the bacterial metabolism to create a sensible impact on the overall impedance properties. The voltage level applied to the biological samples is important for two reasons: i) if it is too low, the measurement resolution of electrical properties of the sample would not be sufficient for an accurate measurement; and ii) if it is too high, it can lead to inaccurate measurements as well as potentially strong electrification of bacterial cells resulting in die-off. In fact, electrification from high voltage electrical impulses is a technique that has recently been used to remove or reduce the presence of bacterial biofilm colonies and facilitate wound healing. This technique is also called electroceutical treatment and could use voltages as high as 6V over a long period of time to eradicate biofilms (Dusane et al., 2019). In the current research, high-voltage electrification of samples should be avoided and the electrical measurements are conducted with the aim of providing a platform that monitors bacterial population as their growth takes place.
Design of the sensor requires finding an optimized frequency in terms of sensitivity to bacterial growth. Since this requires the measurements to be conducted at various frequencies, the impedance measurement device should be able to switch between frequencies and be configurable. While impedance analyzers and LCR meters both measure L (inductance), capacitance and resistance, the former are able to sweep the frequency over a range and graphically display these parameters. LCR meters are also capable of measuring these electrical properties but at different fixed frequencies of interest (and thus, the data require additional manipulation). This limitation in LCR meters, however, would not be critical to this study since multiple frequency set points can be configured in a set of measurements. Real and imaginary impedance (where there is no inductance) are representative of the pure resistance and the pure capacitance properties of the samples, respectively. The effect that microbial metabolism has on the electrical properties of the growth medium is typically comprised of an RC circuit combination. Based on the parameters measured by the LCR meter, the impedimetric parameters were calculated using Eqs 1, 2. Eq. 3 is used for calculating the variation (v) in parameter magnitude during the growth phase:
where
In summary, the device concept proposed in this work is designed and programmed to send low voltage (of the order of millivolts) AC signals to a series of electrodes. An excitation device sweeps from low to high frequencies to find the frequency at which the impedance is the most sensitive to growth. Changes in the electrical properties as a function of bacterial growth are quantified, studied, verified, and calibrated with microscopic hemocytometry and optical density spectroscopy.
The main strategy in choosing a bacterial strain on which to test the proposed sensor was to select a strain that can form biofilm structures. It is also important that the species can grow in a subsurface environment and within rhizospheric areas. Additionally, the IM sensing platform proposed is to be tested in the laboratory in this work, and thus, ease of growth of the bacteria is an important consideration. A few different strains were investigated as candidates such as Streptomyces Viridosporus (ATCC 39115) that is isolated from soil and is capable of biofilm formation. Other common biofilm formers are Pseudomonas Putida, Pseudomonas Fluorescens, Rhizobium Leguminosarum, Sinorhizobium Melitoti, Bacillus Subtilis, Sinorhizobium Meliloti (Ensifer Meliloti), and Pseudomonas Aeruginosa. Of these species, laboratory growth can be as easy as inoculation in Luria-Bertani (LB) broth (used for Pseudomonas Putida, for example,) or by using a composition of a few different growth nutrients such as yeast extract, mannitol, agar, or soil extract such as that for Rhizobium Leguminosarum. Considering the reasons mentioned above and the risk level of working with these strains, Pseudomonas Putida was chosen as the bacterial strain of interest for the experiments in this work. This risk level I strain can be grown in Luria-Bertani broth medium at 30 °C.
Isolated Pseudomonas Putida bacteria were grown on Petri dishes containing tryptic soy agar at 30 °C overnight. Once the colonies are formed on the agar medium, they are ready to be transferred to the liquid growth medium. A smear of the bacterial colonies formed on the agar plates were extracted using a sterilized inoculation loop and placed in sterilized LB broth. LB broth (Lennox), powder from Sigma Aldrich (ref: L32022-250G) was used for the preparation of bacterial solutions for testing. After 1 day, bacterial cells in the LB broth were grown resulting in a cloudy solution that was ready for serial dilution. As per the usual method of a stepwise dilution, 2 mL of the grown batch was diluted in 18 mL of fresh LB broth medium, and subsequently 2 mL of the newly diluted sample was extracted for dilution in another 18 mL of fresh LB broth. Six sample types offering a wide range of bacteria concentrations created by diluting 101, 102, 103, 104, 105, and 106 fold, were developed for impedance testing. Part of each sample was set aside for optical spectrophotometry measurements while 275 µL of each sample was decanted onto the wells of the E-plate (part of the transducer) for impedance measurements. Thus, as Figure 1C shows, the measurand observed by the sensing platform is bacterial concentration.
Bacterial detection and analysis using impedance-based techniques may be classified into two different approaches: faradaic and non-faradaic. In the faradaic approach, an interface is required for the transfer of charges from the species under the test to the electrodes, which in turn requires the employment of redox-active species (Daniels and Pourmand, 2007). Since there exists no redox species in the proposed setup, this study used a non-faradaic approach for impedance measurements. For non-faradaic impedance measurements there are several models that could be used to describe the impedance data. The models are comprised of hypothetical resistances and capacitances (an RC equivalent circuit) that are formed based on the conductivity of the medium and the electrodes (Brosel-Oliu, et al., 2015). The resistance and capacitance of the growth medium (electrolyte) as well as the resistance and capacitance of the bacterial biofilm are the main elements in most of the suggested models. With the occurrence of biochemical reactions at the surface of the transducer (electrode), a double-layer capacitance could be formed that is induced by the formation of ionic species due to microbial metabolism. As an existing element in an RC equivalent circuit, many researchers suggested using the double-layer capacitance (Kim et al., 2012; Paredes, et al., 2014a) approach. Resistance and capacitance of bacteria can be either in parallel or in series with the solution resistance.
Interdigitated arrays (IDA) are popular tools for monitoring bacteria in impedance sensing platforms. Whether or not there are immobilized antibodies on the electrodes, the key aspect is the size of the electrodes as this quality provides for the level of sensitivity to micro-scale changes in electron transport. IDAs, also known as IDEs (interdigitated electrodes), are structured as comb-like conductive lines of transducers, such as gold and platinum, that are typically comprised of a working electrode and a reference electrode and are coated on the surface of a glass, silicone, or hard plastic substrate. The two electrodes are fabricated in a way such that the parallel fingers of the combs of the two electrodes are interleaved from one finger to another but are not in contact. The IDAs have the advantage of providing low Ohmic drop making it easier to achieve a steady-state current response (Maruyama et al., 2006). When it comes to the optimization of the signal-to-noise ratio (S/N) based on the application of interest, the spacing between the fingers, the length and the width of the fingers, the height of the traces, and the overall active area of the electrodes, are among the most important parameters for IDEs (Min and Baeumner, 2004; Varshney and Li, 2009). As documented by van Gerwen et al. (1998), the smaller the spacing and the width, the higher the sensitivity to the electrochemical changes between the microbands of the electrodes. Using impedance sensing with an IDA microelectrode, Yang et al. (2004) provided successful evidence of the detection of Escherichia coli O157:H7 bacteria. In that study, an indium-tin oxide IDA was used, which had 25 pairs of fingers that were coated on glass substrate that were 15 µm wide (digit width) and 15 µm apart from each other (interdigit width). Kim et al. (2012) manufactured an IDA by depositing gold patterns of microbands on silicon wafers to achieve the rapid detection of bacterial attachment. The configuration of the microelectrodes used for that study was similar to the well-known comb-like structure with 50 pairs of microbands of 10 µm digit width and 10 µm interdigit width. In another study, MacKay et al. (2017), nanofabricated a set of microarrays of gold nanoparticles that had an interdigit width of only 2 µm while the microband width was 4 µm. Turolla et al. (2019) evaluated the possibility of using 10 µm-spaced coplanar microelectrodes in the impedance sensing of slime formation in pipes and tanks. What these studies show is that impedance spectroscopy with biological samples requires electrodes that have comparable dimensions to the cells in the samples. In the case of bacterial cells that are generally smaller than human cells, the width and spacing of the microelectrodes used in the literature are in the range of 1–20 µm (Varshney and Li, 2009).
As far as the sensing electrodes are concerned, after thorough evaluation of the possibility of manufacturing or using interdigitated electrodes on the market, 16-well E-Plates (E-Plate 16) made by ACEA Biosciences Inc., San Diego, CA (now with Agilent Technologies, Inc.) was chosen as the sensing microelectrode. This product is composed of well plates (16 wells in total) that have gold traces deposited in the bottom of each well. The dimensions of the electrodes are within the constraints of this study. Additionally, the fact that the well plates enable one to hold up to 16 different samples simultaneously is advantageous, although not all of the wells were used for testing in this study.
Previous research investigating impedance microbiology can provide useful information for the approximate properties of impedance when studying microbial activity. Grossi et al. (2010) were able to test and verify a portable sensor that detects bacteria at a frequency of 200 Hz and 10 mv peak-to-peak voltage in liquid and semi-liquid samples. This sensor detected the total bacterial concentration at a threshold of 107 CFU/mL within 3–12 h of inoculation and was successful in detecting the occasional and specific bacteria in ice-cream samples. Radke and Alocilja (2004) developed a biosensor using immobilized antibodies on a MEMS electrode using a frequency range of 100 Hz to 100 kHz and at 100 mV. Paredes et al. (2014a) performed impedance-based tests within a range of frequencies between 10 Hz and up to 100 kHz. Higher frequencies have short wavelengths that do not allow the microbial metabolism to cause alterations in the impedance phase and magnitude. Other researchers have suggested a similar frequency range (Davis et al., 2006). In a study on detecting bacterial cells in suspensions using electro-impedance spectroscopy (Yang, 2008), the authors used a frequency range of 1 Hz–100 kHz. Generally, impedance spectroscopy of bacterial cells does not require very high frequencies and can be achieved by using low frequency excitations. As well, operating the system at low excitation frequencies and voltages would minimize the power consumption of the testing unit, which is advantageous.
In addition, one of the most important criteria for a field-based sensor to be used in a rain garden is to be able to conduct automated measurements of several biological samples without the need of human intervention or supervision over the course of the measurements. Automated measurements, in this study, would briefly mean that the setup conducts impedance measurements of up to 8 different biological samples (by making use of 8 wells of the E-Plate), and sweep from low to high excitation frequencies when a certain channel is isolated for measurement. In other words, the experiments would require continuous measurement of the impedance of an array of channels under sequentially varying frequencies. Thus, it is necessary to build a platform that is capable of multiplexing and switching channels on a continuous and orderly basis. The working mechanism of the setup would be based on assigning specific tasks to each component and providing the means for proper communication between components to facilitate the integration of the system. Thus, the controls for switching channels and transducing AC signals as well as the controls of the measurement functions and data storage are a major element in the signal modification system.
ADG708 and the Evaluation Board (EVAL-16TSSOPEBZ) made by Analog Devices Inc (2019). were used in the circuit as the switching component. ADG708 is an 8:1 switching system-on-chip (SoC) that determines when to switch to one of the 8 outputs (S1 to S8) controlled by the 3-bit binary address codes (A0, A1, A2) that it receives [49]. This chip was chosen because of its low current leakage, low power consumption and its portability. GW Instek GPD-4303S power supply was used to provide power to the multiplexer. A microcontroller chip and its development kit (nRF52832 and nRF52-DK) both made by Nordic Semiconductors, Trondheim, Norway, were used as a controlling unit for the transmission of the digital signals required for the multiplexer to switch between channels. Using SEGGER Embedded Studio for ARM V4.10 as editor and compiler/linker/debugger, a code was developed in C programming language for the microcontroller to control the multiplexer.
Other than the frequency range and voltages that determine the choice of a proper impedance measurement device, the affordability of the device is important because it is always desirable to create a device that can be used widely by engineers and technicians working in municipal services. Devices such as potentiostats, dynamic signal analyzers and impedance analyzers have been used by many researchers for the purpose of impedance spectroscopy. However, in this study, the authors selected the much more affordable LCR meter and programmed it in such a way as to provide similar benefits to high-end potentiostats and impedance analyzers. After comparing many LCR meters in terms of the frequency range, the voltage range, the programmability, the basic accuracy, the measurement capabilities, and the price, Keysight E4980AL/032/201 made by Keysight Technologies, Santa Rosa, CA was selected.
The microcontroller is controlled by a series of codes that sequentially commands the change in the digital signals sent to the multiplexing switch. The multiplexer forwards several digital outputs into a single line. The command center for the testing setup is a laptop that is connected to the microcontroller and the LCR meter, and sends commands to both components through universal serial bus USB ports. A “master” software was therefore needed to help with the integration of the components into one coherent system and decrease the complexities in controlling the devices. This master code was implemented in Python using SCPI (Standard Commands for Programmable Instruments) commands to send measurement settings and inquiries to the LCR meter, to collect and save the test data, and to tell the microcontroller to switch to the next channel. The microcontroller receives a serial input from the laptop. Based on that, it creates a route between one of the inputs (S1 to S8) to a single output. This enables the Python program to exercise control between one of the wells and the LCR meter. A delay was incorporated in the code to yield enough time for the LCR meter to finish the measurements on the well before the microcontroller closes the next channel for measurement.
The function of the system starts with a command sent by the command center to the microcontroller, asking the multiplexer to switch to the first channel. When the channel is closed, the command center commands the LCR meter to start sweeping AC signals from low to high frequencies using values defined in the program and measure the R-X values of the sample under the test. The R-X values are the real and imaginary components of the impedance that are later used to calculate the resistance and capacitance properties of the sample as well as the phase shift between the applied and the measured signal. Figure 1C shows the final sensor components for the platform. Figure 2A is a schematic of the sensor system in terms of the main electrical components, while Figure 2B shows photographs of the complete system used in the laboratory.
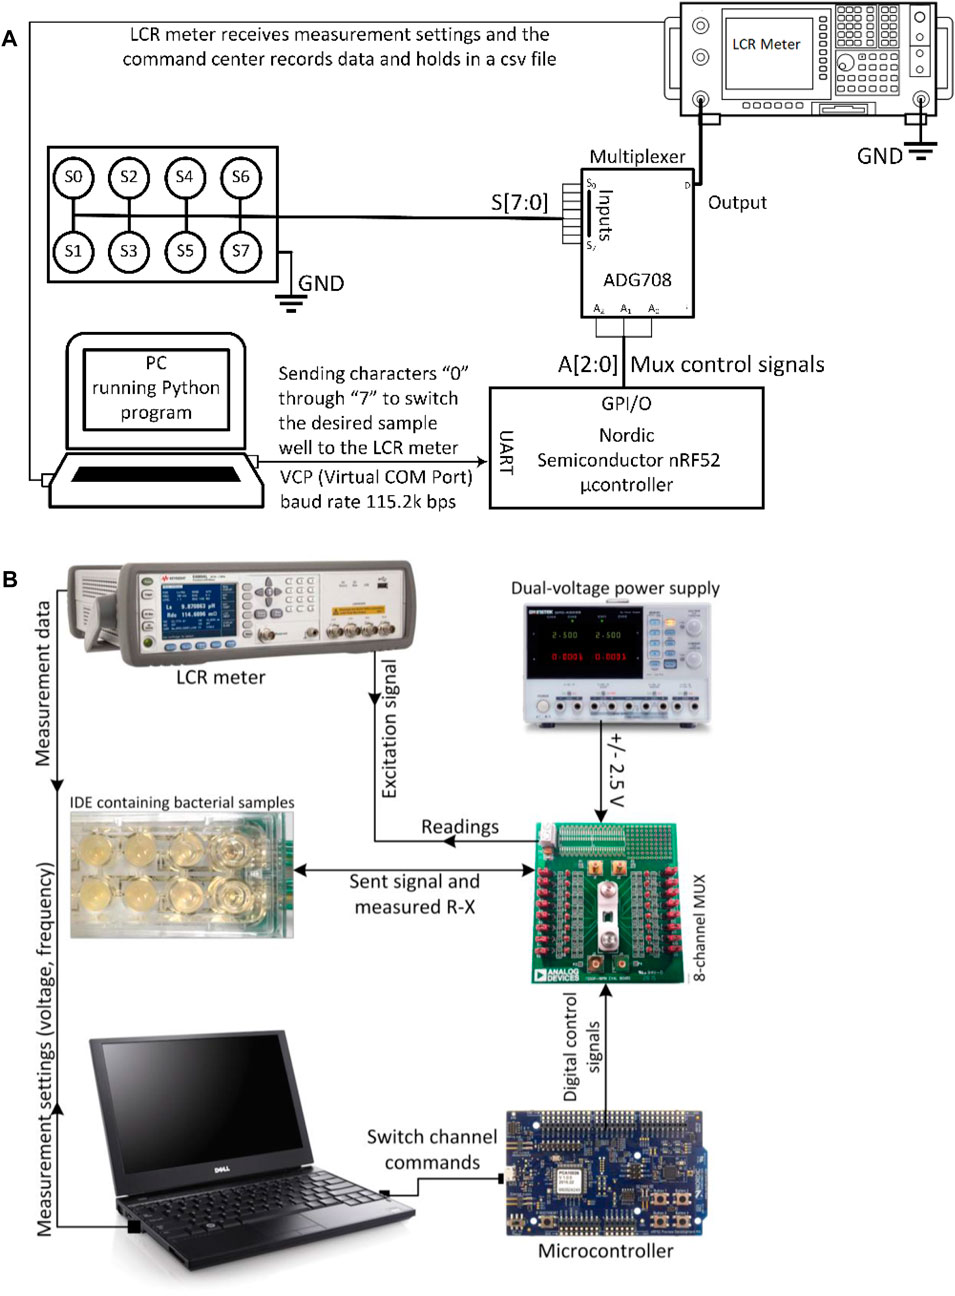
FIGURE 2. (A) Schematic of bacterial growth sensing system together with a summary of the communication mechanism between the different components; and (B) photographs of the actual set-up showing the IDE in the middle left.
The measurement by the LCR meter has two parameters, the voltage and the frequency. In order to have a better understanding of the impedance changes in the biological samples, the measurements were done at various frequencies as low as 20 Hz and up to as high as 300 kHz. The AC signal voltage is set to 100 mV peak to peak. One of the system’s channels was used to capture any glitches or disturbances in the system by maintaining a connection to the RC circuit element of known resistance and capacitance of 30 Ω and 474 nF, respectively. The magnitude of the RC element was chosen based on typical magnitudes of the resistance and capacitance observed in preliminary impedance analyses on the bacterial samples.
In-tandem verification of impedance sensing leading to the estimation of bacterial concentration is a necessary part of the proposed device’s proof of concept. Microscopical methods are commonly used as confirmation methods for impedance measurements in the literature, but these require expensive facilities. Pal et al. (2016) used optical density at 600 nm and surface plating techniques to substantiate their impedance sensing results. Optical density spectrophotometry at 600 nm is often used in applications involved with the growth of bacteria in culture (Matlock, 2019). Surface plating, however, is a time-consuming method and should be performed by trained personnel (Wang et al., 2015). Hemocytometry on the other hand, allows the direct count of the number of cells per known volume of sample. Spectrophotometry is an indirect measurement of bacterial concentration of a volume of sample and a much more rapid method than hemocytometry. Therefore, hemocytometry was used to calibrate optical absorbance measurements from spectrophotometry, on samples from similar batches as those under impedance testing. This would eliminate the need for conducting hemocytometry in every test, which is a labor-intensive and time-consuming task in the long-term. This affordable approach would help to estimate bacterial cell concentrations at a given time that may be correlated with impedance spectroscopy results.
Prior to the quantification of the optical absorbance, a set of bacterial samples were diluted step-wise by 50% to find a more accurate relationship between the proportional concentration (unknown count) and the optical absorbance. By assigning a concentration factor of 1 to the saturated (most concentrated) solution and factors of 2–1, 2–2, 2–3, 2–4, 2–5, and 2–6 to the diluted samples, the corresponding absorbances were measured. In order to quantify the absorbance measurements and correlate them to the concentrations by assigning values of cell counts, a set of hemocytometry tests was conducted on the samples with known optical absorbance. SMART® Spectro 2 spectrophotometer made by Lamotte, Chestertown, MD was utilized for all the optical density measurements. Petroff Hausser Counting Chamber (ref: 3,900) made by Hausser Scientific, Horsham, PA with a cell depth of only 10 microns was used for all hemocytometry measurements. In this way, the spectrophotometer measurements were calibrated and used to estimate the bacterial population in similar samples that were tested simultaneously under impedance sensing. Hence, the samples that were selected for spectrophotometry were based on their potential to represent varying amounts of growth and bacterial populations. This could also be a suitable testing strategy for validating the repetitiveness of the technique.
In addition, replicate experiments were conducted to further verify the results obtained from the 90% dilution samples (also known as 10-fold dilution). In these tests, the saturated bacterial solution, that was prepared by overnight culturing of bacteria in LB broth was serially diluted by a 1:10 ratio, ranging from 10 times more dilute to 107 more dilute bacterial samples. The samples were inoculated inside seven wells of the electrode plate, with the eighth channel intentionally left without a sample. This eighth channel served as a control and kept at a constant RC value to deal with external noise in the system. The test results shown in the Supplementary Material are effectively trials for duplicating the same experiment described above. Note that those results do not show any discrepancy with results or the conclusions arising from the main experiments described below.
The results of a test that was conducted on the six bacterial samples that were diluted serially are presented here in three different ways. First, the impedance results of different samples at a fixed frequency over time are compared. Secondly, the impedance results of different samples under the frequency sweep are explained. Lastly, the relative variations of impedance parameters will be interpreted as the biomass change to provide a clearer explanation of the capabilities of the proposed sensing system.
Measuring the impedance responses of bacterial samples demonstrated a sudden change in terms of real and imaginary impedances after a few hours of inoculation. The sudden changes occurred in all the samples one after another. The sample with the highest initial number of bacteria, approximately 2.444×10⁷ cells/mL, showed changes in impedance properties before every other sample. This sample was diluted 10-fold from the saturated batch and had an optical density absorbance value of 0.14 at the beginning of the experiment. Subsequently, other samples started to show impedance changes one after another in the sequence from the initial concentration that began the experiment. Therefore, the sample that started with the least number of bacteria (approximately 2.44×10² cells/mL) was the last one that showed any sudden changes in impedance as shown in Figure 3. This figure contains the changes in impedimetric parameters of samples over time. All the parameters are normalized over their initial values at time zero of the process of introducing bacterial cells to their growth medium. This eliminates the constant bias available in the measurement system.
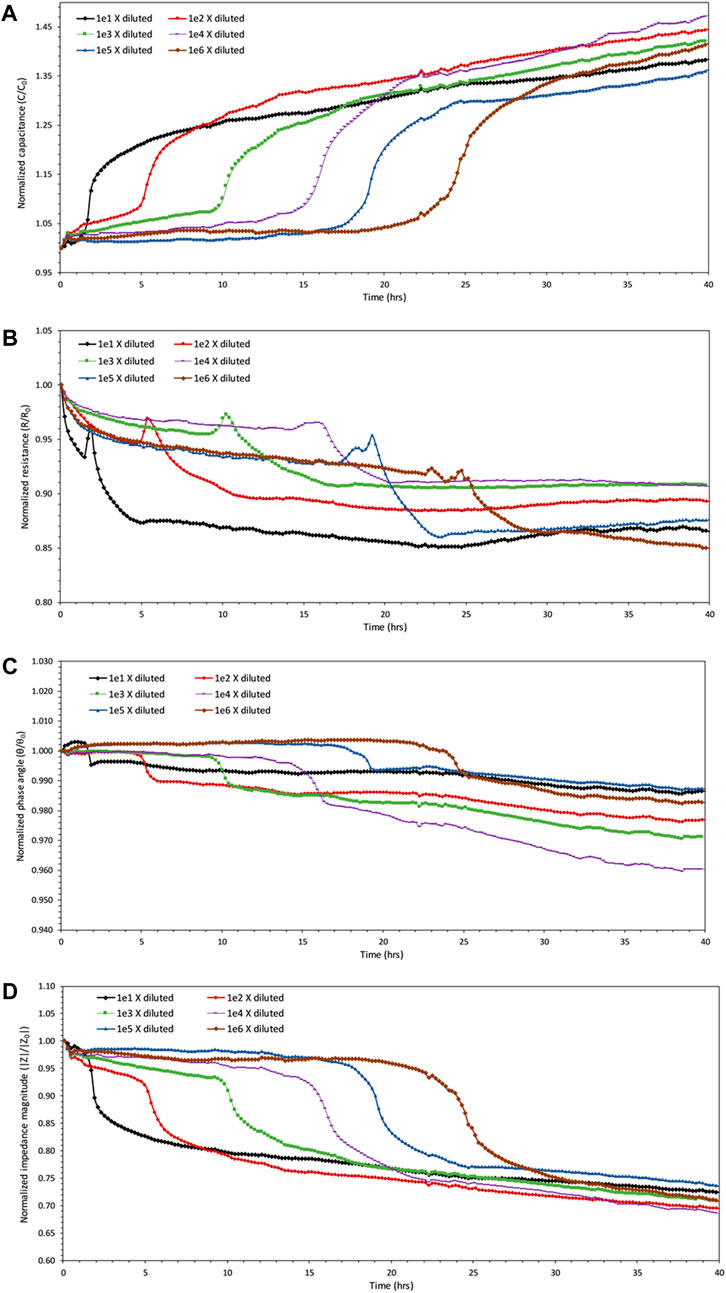
FIGURE 3. Monitoring of the impedance values over time for all six diluted samples at 1,000 Hz. (A) Capacitance of the samples start to increase rapidly one after another in the order of their dilution. Data points are obtained approximately every 12.2 min. (B) The resistances of the samples do not show as definitive a trend as capacitance changes, even though there is some decrease in resistance values of the samples simultaneously with increases in capacitance values. (C) Some increase occurs in the values of phase angle calculated for each sample, but by no more than 2% of their initial value. (D) The impedance magnitudes of the samples start to decrease sequentially in the order of their dilution.
As the impedance sensing was being conducted, both the measured resistance and reactance showed changes in their values during the logarithmic growth phase of bacterial samples, which is confirmed by simultaneous hemocytometry and optical density measurements. Changes in phase angle, capacitance and impedance magnitude are expected and thus, the overall impedance magnitude that encompasses both the resistance and capacitance changes may provide a more comprehensive understanding. These sudden changes were noticed at all frequencies, but the results are presented at a frequency of 1,000 Hz, that is low enough to reflect variations in impedances.
As bacteria start to proliferate, the impedance changes occur in a way that the resistance decreases slightly together with some irregularly trended variations, and the capacitance increases sharply at the same time as shown in Figures 3A,B. The overall impedance magnitude, that reflects and includes the changes in the magnitude of both real and imaginary impedance, also showed a sudden decrease in Figure 3D. As suggested by Wang et al. (2015), the decrease in resistance that occurred at the same time as the reproduction of bacteria is probably due to the formation of a bridge of bacterial clusters between the electrodes facilitating the electron transfer among them. Even though there exists a decrease in resistance during the growth phase, the existence of random spikes makes this parameter unreliable in representing and evaluating growth.
The measurements indicate that the normalized phase angle hovers in the range of 0.96–1 (Figure 3C), which also suggests the combinatory existence of both capacitive and resistive properties of the biological samples. Among all forms, the capacitance and impedance magnitude seem to provide the most definitive indicators of biomass change. To prove this theory, the variation from baseline was calculated for each parameter using Equation 2. Variations in impedimetric parameters for all samples before and after growth showed average values of 37.1%, 33.5%, 14.4%, and 1.6% for capacitance, impedance magnitude, resistance, and phase angle, respectively. This demonstrates that the capacitance is the most sensitive to the metabolic changes, even though impedance magnitude could provide a more inclusive value comprising of both resistance and capacitance. Capacitance, therefore, is considered the more potent parameter for monitoring of growth. In all cases, it can be observed that the impedimetric parameters for all samples start to plateau after the occurrence of changes in each sample, and no significant changes occur for any of the samples after that.
The results of the frequency sweeps from 20 Hz to 300 kHz for the sample that was diluted 1,000 times from the saturated batch are presented here. The results from the rest of the samples are added as error bars. The 1,000 times diluted sample was chosen because of its moderate representation of samples of lower and higher initial concentrations. The green, red, and the blue markers in Figure 4 a) to d) represent the values of impedimetric parameters at different times in the experiment normalized by their values at time zero. Therefore, green indicates when the proliferation has not started, red for when the proliferation has started, and blue indicates when the proliferation is finished. By comparing the results of frequency sweeps for a given sample, it is clear that the variations could be differentiated much more easily at lower frequencies than at higher frequencies. This is also in agreement with the results that were obtained by other researchers (Paredes et al., 2012; 2013; 2014a). Over time, the resistance of the sample decreases compared to when the exponential growth has not started, indicating that the growth of bacteria further facilitates the electron transport in the system. At the same time, however, the ability of the system to store the electrical charge applied by the excitation signal is increased. In Figure 4 a), it can be observed that the capacitance values over the progression of time and therefore bacterial growth, are much more distinguishable compared to other impedimetric parameters. In fact, for a given sample, capacitance is the only impedimetric property that shows distinction between the measurements at various states of time and across the whole frequency range as seen in Figure 4 a).
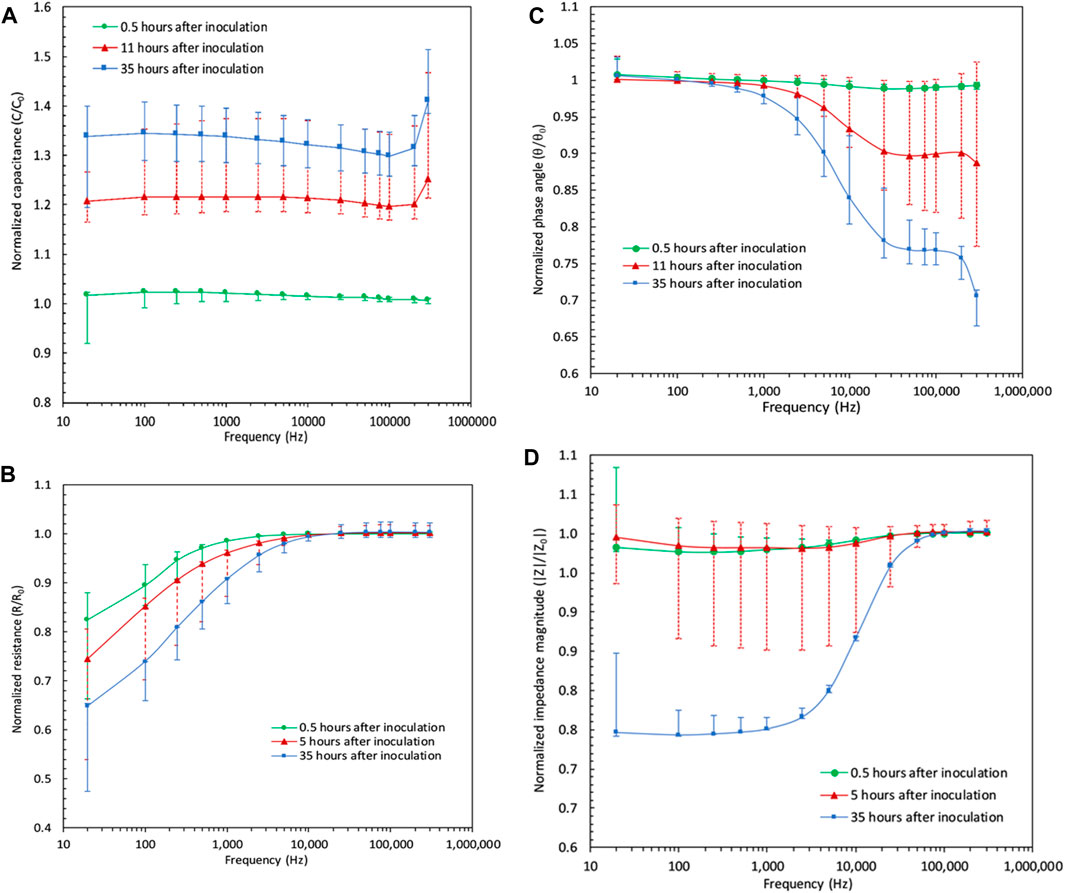
FIGURE 4. Magnitude of impedimetric parameters for the 1,000 times diluted sample over the frequency sweep of 20 Hz–300 kHz at before, during, and after bacterial reproduction. Results of other samples are plotted as error bars covering the minimum and maximum values of the parameters among samples at each frequency point. (A) Capacitance frequency sweep results: there exists a clear distinction between magnitudes of capacitive property of the sample over time in that values before, during and after the exponential growth show different magnitudes at all points, especially under low and mid-range frequencies. (B) Resistance frequency sweep results: slight change is noticeable in the resistive property of the sample from before the proliferation to after the proliferation. (C) Phase angle data under the sweep of frequency: the distinction between the magnitudes are noticeable only at lower frequencies. (D) Impedance frequency sweep data showing a decrease of impedance magnitude at low frequencies after the proliferation is finished.
Observations obtained from this portion of the research show that the concentration factor (CF) has a linear relationship with optical density absorbance (OD600) as shown in Eq. 4:
where
where in these experiments,
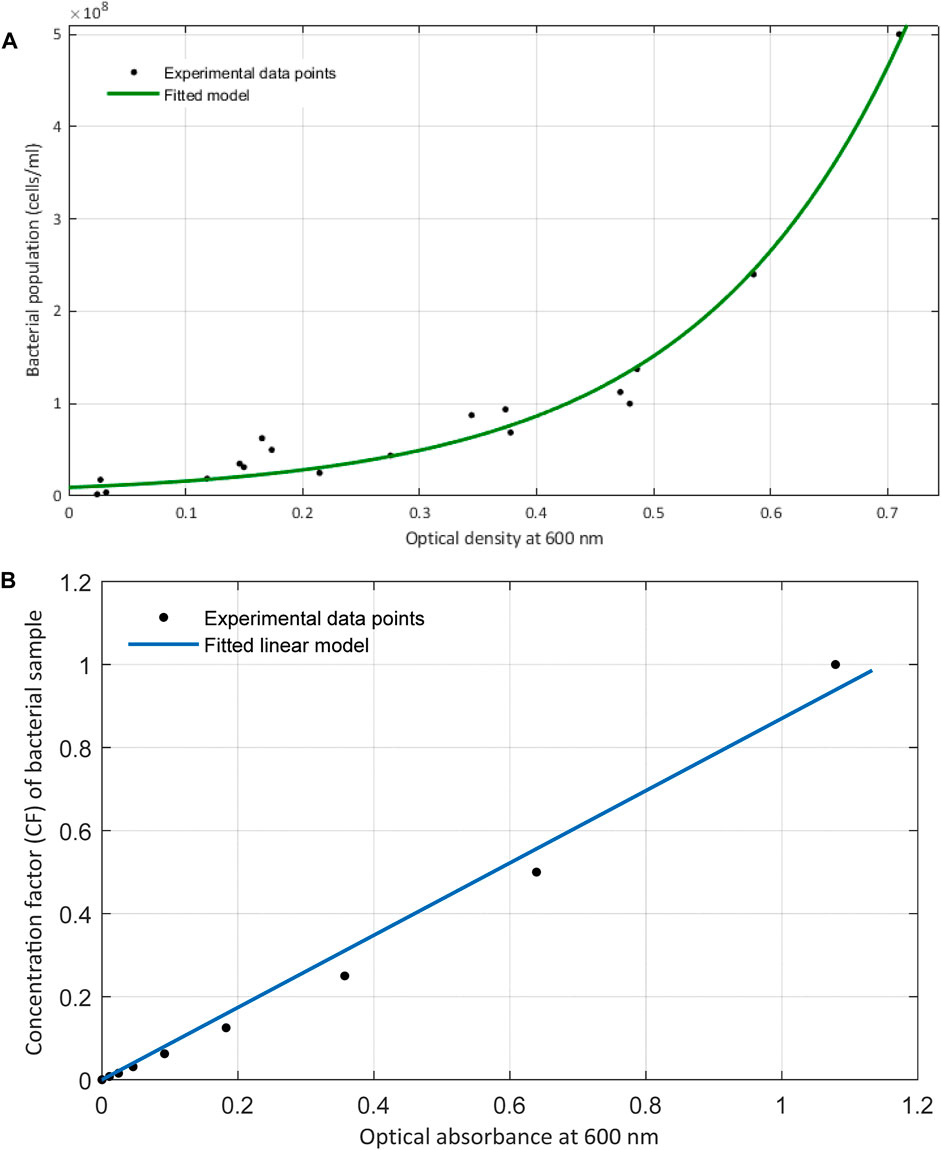
FIGURE 5. (A) Exponential relationship between the optical density measurements at 600 nm with the direct count of bacteria obtained from hemocytometry. (B) Plot includes the linear relationship of the optical density with the concentration factor or the proportionate bacterial density. These data are obtained at time zero of bacterial inoculation and right when they were serially diluted and introduced to their growth media.
The exponential increase in the number of viable cells growing over time rather than diluting is practically due to the smaller mass (volume)/cell ratio that occurs in the samples at higher optical densities. This behavior over the course of bacterial proliferation was also noticed by Sezonov et al. (2007) where they found that the mass per cell ratio declines at higher optical absorbances. Therefore, as bacterial cells start to reproduce and the number of cells increases, the mass/cell ratio decreases. Hence, the turbidity induced by a certain number of bacterial cells would be lower than expected. This further affirms why the proliferation of bacterial cells in the growth medium does not have a linear relationship with optical density, as opposed to when the samples are prepared by dilution.
Six models were evaluated to determine how well they fit the impedimetric experimental data. Python Zfit software was used to conduct data fitting of impedance measurements and to find the RC elements suggested by each model. The Nelder-Mead downhill simplex method was used to find the best fit by converging RC values to experimental data by keeping the squared-error minimized. Dellis and Carpentier (1993) also reported the high accuracy and capability of the Nelder Mead method in fitting their impedance spectroscopy data. The goodness of fit ξ) that was used to compare the models is the average percent difference of the impedance magnitude calculated by the suggested RC values from each model |Zmodel| and from the experimental model |Zexp| such that:
The intention here is to evaluate which model could best describe the data obtained from the samples. A model suggested by Liu et al. (2018) suggests that the adherence of bacterial cells to the surface of the microelectrodes and their existence in the growth medium induces an RC circuit consisting of double-layer capacitances (Cdl), solution resistance (Rs), bacterial resistance (RS) and capacitance (Cb). As proven by Kim et al. (2011), double-layer capacitance is a key existing element in explaining the impedance spectroscopy data of adhesion and maturation of bacterial biofilm. This theoretical model fits the data of the experiments conducted here with minimal error.
Theoretically, if we imagine a certain value for the double-layer capacitance at the beginning of the test and before the growth, the increase could be explained by a parallel capacitance model. In circuitry, the addition of a new capacitor to a circuit (in this case, capacitance of bacteria Cb) would only cause an increase to the overall capacitance if it were added in parallel to the existing capacitor(s) (in this case the capacitance of the solution Cdl). Other than the parallel arrangements of the bacteria and double-layer capacitors, the increase in capacitance could be justified by assuming the capacitance of the growth medium and capacitance of bacteria as a whole (CT), and that the bacterial growth enhances the total capacitance property of the sample. Table 1 contains a summary of equivalent circuit models and their potential for fitting the observations obtained in this work as well as the percent error obtained with Eq. 6.
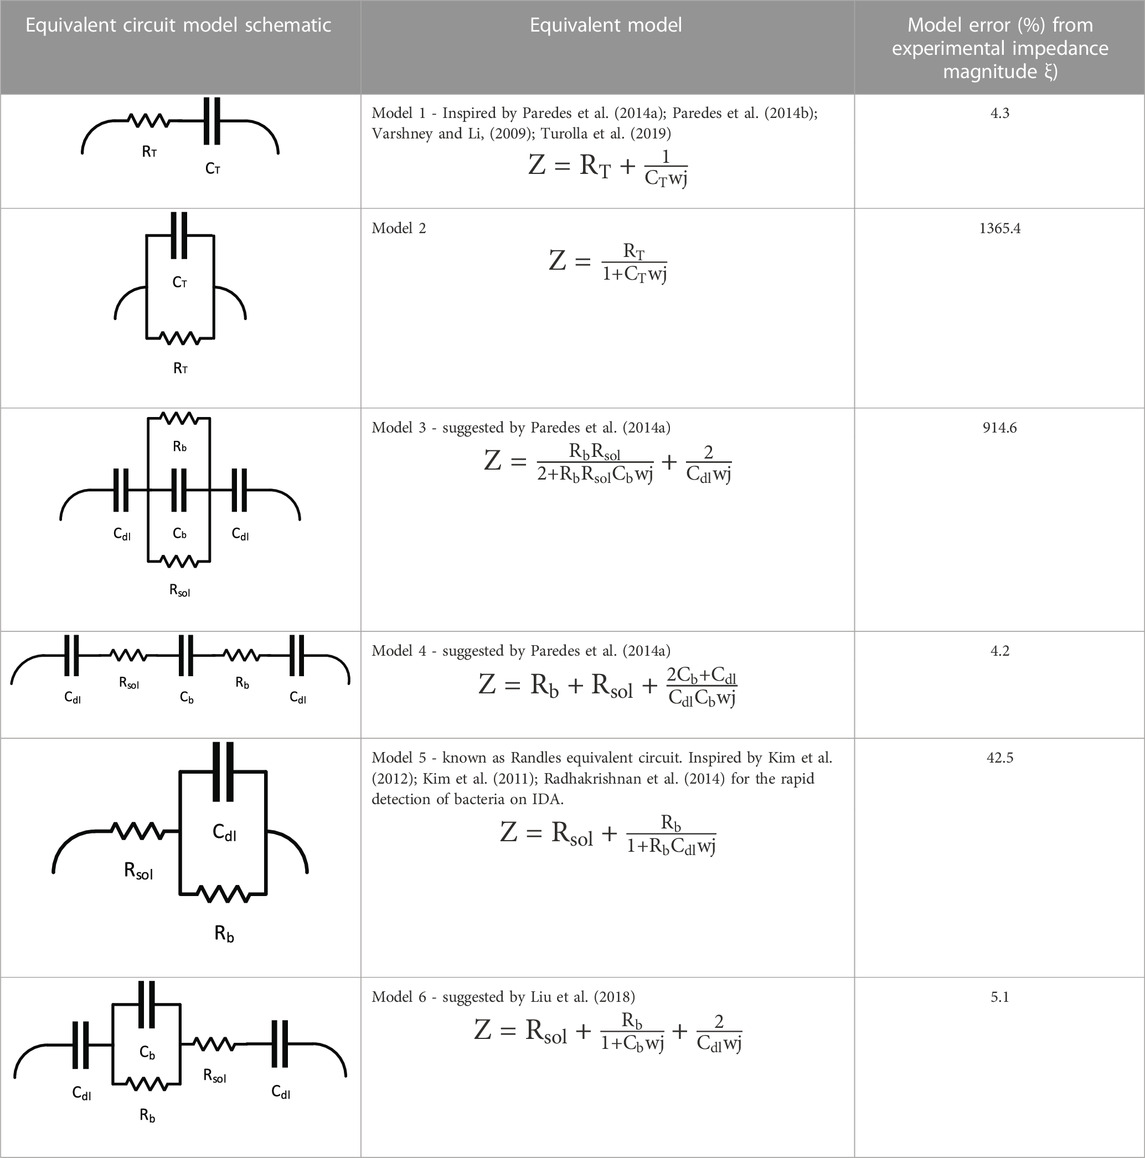
TABLE 1. Potential equivalent circuit models together with their schematic and their success in fitting the impedance data obtained by sweeping of frequency.
As summarized in Table 1, there is more than one model that provides a reasonable fit to the experimental data that estimates the impedance magnitude with an error of 5% or less. One could however, argue that the presence of microbial biofilm, which has a convoluted structure, could be of such high complexity in terms of equivalent electrical circuits at the micro-level that it could not be explained with any 1D, 2D, or even 3D equivalent models. The microbial metabolism contains such high randomness that a realistic equivalent RC circuit could be impacted by each and every bacterial colony that on its own interacts with other colonies and electrode areas. Thus, finding an absolute value for the resistance and capacitance of bacteria that is defined in a segregated way from the resistance and capacitance of the growth media and the overall system, may not be ideal. That is why the authors suggest that in non-faradaic studies, exploring different equivalent RC circuits would be more realistic if the resistance and capacitance of bacteria and growth media, whether serial or in parallel, are looked at as a whole (CT, RT), and the deviations are calculated accordingly. The impedance sensing data could not be fit to a parallel model, and therefore, a serried combination is presented.
In Table 2, the absolute values found by convergence of the Nelder Mead method on Model 1, are presented for all the samples. The resistance does not show a reliable variation. However, the capacitance of the system shows continuous sudden improvement as time progresses. Even though mathematically describing the growth of bacteria is valuable, what is considered more important in the context of this research is to be able to estimate the biomass in near real-time of the changes occurring with the capacitance magnitudes.
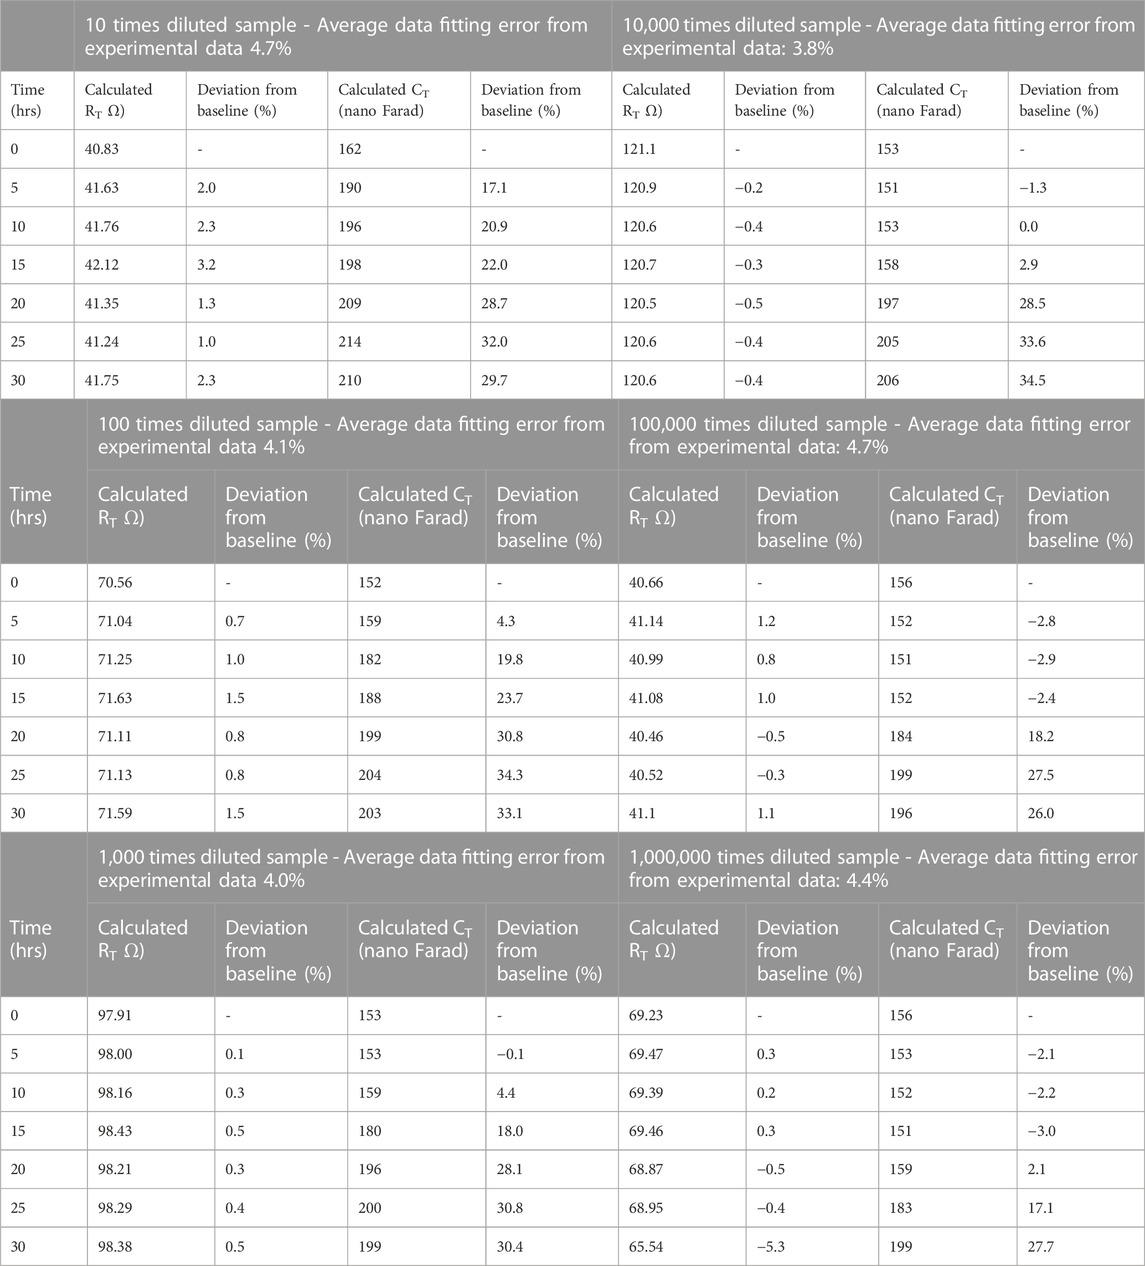
TABLE 2. Summary of values obtained by curve fitting using Model 1 (serried CT and RT).
To explore the frequencies where the models deviate from the observed data, a Nyquist plot was produced using Model 1 for the 1,000 times diluted sample and shown in the Supplementary Figure S1. Given the results in Table 2, a resistance RT of 98.3 Ω was selected and a CT of 200 nF with Model 1. This model was used because it was one of the three models that generated some of the lowest errors (Models 1, 4 and 6, which provided average errors of 4.3%, 4.2% and 5.1%, respectively), and it was the simplest circuit of the three models shown in Table 1. The values of RT and CT were selected because for Model 1 and the 1,000 times diluted sample, these values of resistance and capacitance led to the largest error at 25 h. Supplementary Figure S1 shows that the deviations from model predictions and observations are greatest at the larger and smaller frequencies (right and left side of the curves). According to Mei, et al. (2018), the central portion of the curve is related to the electrode and bulk sample resistance, while the outer region on the right is related to the capacitance in the system. The figure indicates that greater deviation between model and observed data occurs at the larger and smaller sweeping frequencies as shown in Table 2. Furthermore, the authors only considered models with resistors and capacitors. Future work should consider double-layer capacitance models as studied in Mei, et al. (2018) as they may yield better results that are more easily interpreted and greater information on the possible range of the sensor.
The results above indicate that the sensor design could provide real-time growth monitoring. Logarithmic growth of bacteria occurred in all samples and the optical density measurements that were carried out simultaneously to the impedance tracking, facilitated discovery of the absorbance of every sample at a point in time when the impedance sensing device started to see a logarithmic spike in capacitance. By populating the data of all the samples, it was possible to find a relationship between the change in capacitance (C′) and population of bacteria (P′) for all the samples. A lower limit of detection exists due to the limitation of the optical density in finding an absorbance value for samples with lower than 9.2×10⁶ cells/mL (Equation 6). The population estimate was achieved by using the optical density measurements and the pre-derived exponential equation of population against optical density as well as the measured capacitance values at 1,000 Hz over time. Through curve fitting, the model that could provide the smallest standard deviation from the experimental data was obtained. This model is an exponential relationship as shown in Equation 7:
The values of the fitting coefficients A and B, are summarized in Figure 6. Since the absolute capacitance values differ from channel to channel due for physical reasons, the change in capacitance C′ over the change in population of bacteria P′ was selected to find correlations between impedance measurements and bacterial concentrations, as shown in Figure 6. The change in capacitance and the change in population at any point in time, Ct and Pt, respectively, from their initial values C0 and P0, respectively, were used in Eqs 8, 9 to remove the bias in capacitance measurements arising from the inherent capacitance magnitude in different channels.
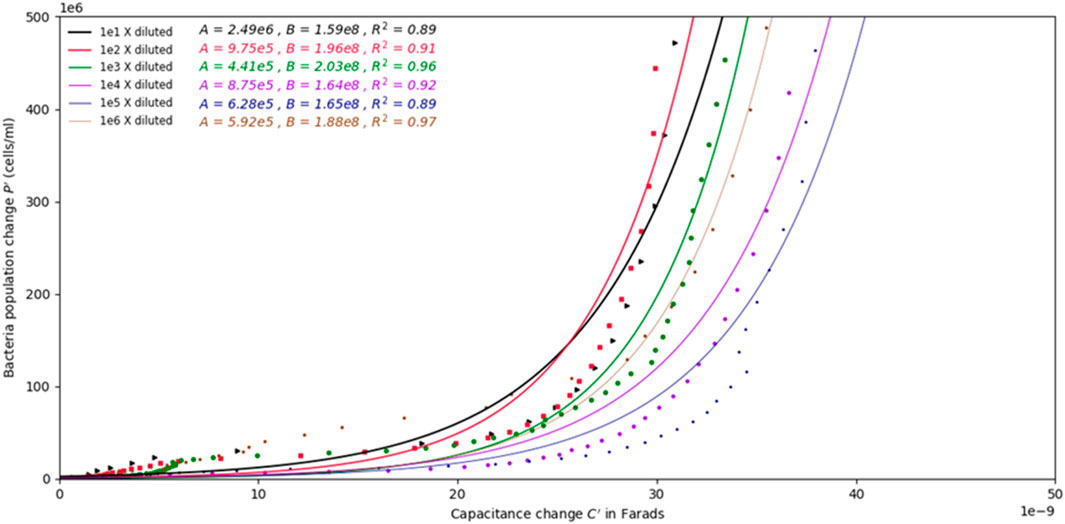
FIGURE 6. Graph depicting the change in population over the change in capacitance of the samples with different initial concentrations. Exponential models are fitted to the data for all samples. The change in population over change in capacitance does not show dependence on the initial concentration of bacteria.
By plotting C′ against P′ for all samples, exponential curves could be fit to the data to create population change models as a function of change in capacitance. Figure 6 shows the change in population over the change in capacitance for all the samples. The best fit exponential models are given in the plot along with the fitted coefficients (values A and B in Eq. 7), and their the resulting coefficients of determination.
In order to have a single relationship between the bacterial concentration and capacitance, the data from all samples were fit to an exponential model. This model is developed by calculating the mean of the population estimation curves of all samples. It is capable of estimating bacterial populations of up to 5×10⁸ cells/mL with an R2 value of 0.40. However, the estimation could be found with a better fit if lower concentrations of bacteria are of interest. This model is also governed by an exponential relationship between population change and capacity change, similar to Equation 7, and with A and B values of 106 and 1.79×10⁸, respectively. This model, plotted in Figure 7A, is a depiction of the proposed sensor’s potential range. Figure 7B is developed to show that a pre-derived relationship of population against optical density sets a lower detection limit of 9.2×10⁶ cells/mL, and the stoppage of the capacitance change sets an upper limit of 5×10⁸ cells/mL. The logarithmic growth phase occurs at the same time as the capacitance increase occurs. Figure 7A is intended to show the range of the proposed design with Figure 7B showing a general picture of the proposed sensor’s sensitivity. The figure illustrates that if using capacitance to measure changes, the sensor is only sensitive in the log phase and that this design could be used to monitor the change between lag and stationary phases for a particular system. The values provided by the expression are not absolute and should only be used to describe relative changes in biomass.
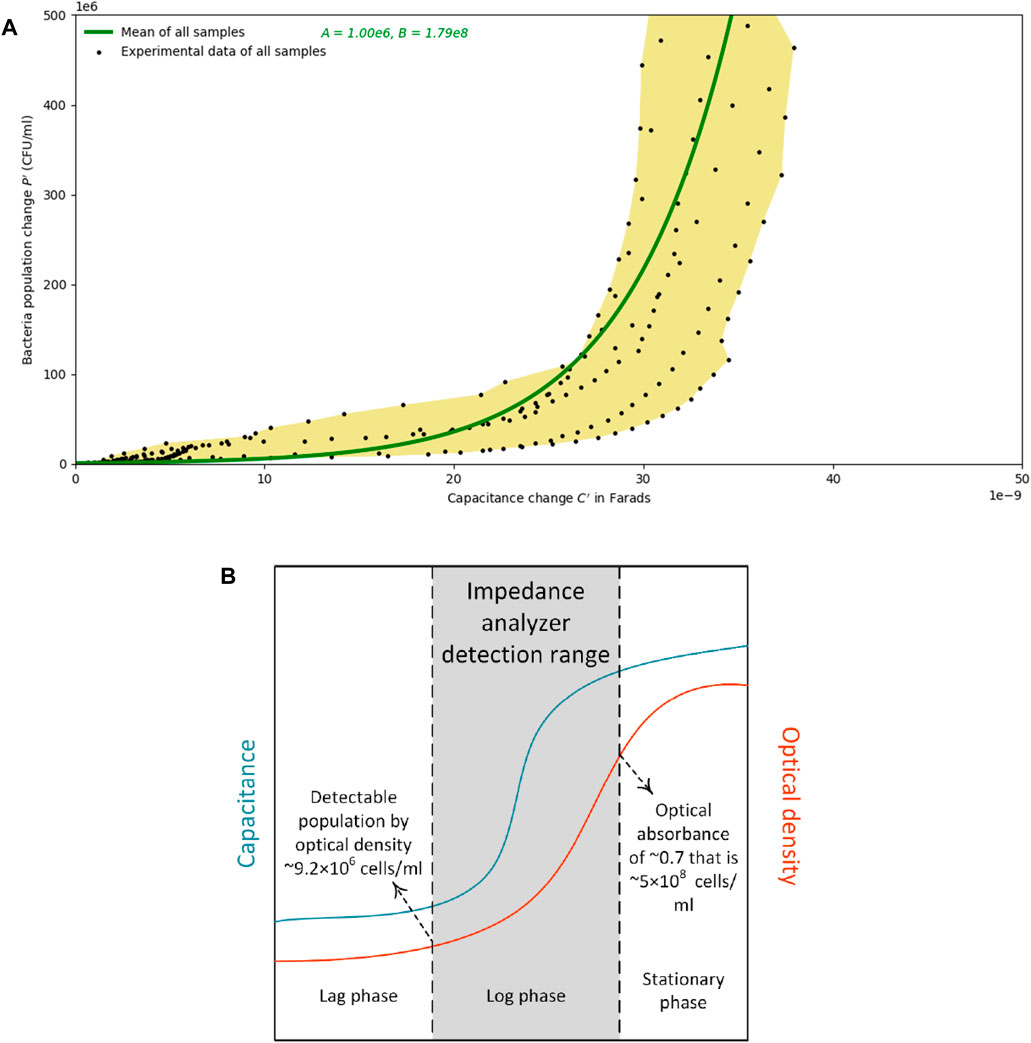
FIGURE 7. (A) Population change estimates versus the change in capacitance. The yellow area is the region of all the data points measured from samples that started the experiment with less than 9.2×10⁶ cells/mL. Calculating the mean of the exponential population estimation curves from all samples leads to the development of the generic model that is drawn by a green line. (B) A schematic plot of the capacitance and optical density change over time: the logarithmic growth phase occurs at the same time as the increase in capacitance occurs. The pre-derived relationship of population against optical density sets a lower detection limit of 9.2×10⁶ cells/mL, and the stoppage of the capacitance change sets an upper limit of 5×10⁸ cells/mL.
It is concluded that the fact that bacterial growth observed via optical density measurements are simultaneous to the spikes in capacitance values allows one to develop an estimation curve between the change of capacitance from an initial value and the change of bacterial population from a starting amount. However, as schematically shown in Figure 7B, the spike in capacitance occurs sometime prior to the exponential increase in the optical density measurements. One may surmise that due to the long-term monitoring of bacterial impedance, some evaporation may occur in the wells that might affect the results. To minimize this effect, during the experiments, lids and caps were used for the samples both in the wells for impedance monitoring, and on the samples in the cuvettes for optical absorbance monitoring, respectively. That being said, further evaluation of how evaporation can affect the impedimetric changes could be conducted.
The development of the setup introduced herein provided an inexpensive means of bacterial monitoring that is less than one-tenth the cost of similar products available on the market. ACEA Biosciences Inc (now with Agilent Technologies Inc.) and Applied Biophysics are among the few manufacturers and developers of bacterial monitoring sensors. Their products are impedance-based sensing setups that start from the order of several tens of thousands of dollar, whereas the benchtop setup in this work cost less than $10K. With further improvements, the cost could even be less than half this amount.
The current impedance monitoring setup has the capacity of becoming a portable measurement system. This can be achieved by replacing the current precision benchtop components with small evaluation and integrated circuit boards. For instance, instead of the current benchtop LCR meter, the AD5933 made by Analog Devices could be used. This is a high precision impedance converter system capable of conducting impedance spectroscopy tests of up to 100 kHz. This on-board frequency generator is also highly affordable and can save thousands of dollars in the overall cost of the system. Other components that could be considered for replacement by portable devices with equivalent capabilities include the power supply used to power the analog switch. These changes can move the system steps closer to in situ monitoring of biofilm.
Further testing could be done to collect more data and therefore, confidence in the calibration of the system. Using the same optical density protocols, there is a need for long-term manual monitoring of samples using a spectrophotometer. This requires more than one person during the testing days (usually a 2-day time span) to take the optical density measurements at the same time as the impedance testing is running, so that optical absorbance data points during the growth of samples are captured over long periods of time. More testing would not only improve the confidence of the system’s capability but might also lead to the amelioration of the detection range and limits. Other than optical absorbance, other methods could be explored as alternative calibration methods for higher accuracy. More hemocytometry of samples could result in improvements in the biomass estimation curves, especially if hemocytometry is accompanied by using an image processing software for the counting of more populated bacterial samples. The human eye can always be inaccurate. As well, biomass assessment methods can be used to calibrate the impedance measurements beyond 5×10⁸ cells/mL.
Given that biomes in rain gardens providing for bioremediation involve many different strains and species of bacteria, it is likely that the sensing platform proposed will yield different measures of direct capacitance. This work focused on changes in capacitance versus changes in bacteria population (estimated from optical density measurements), for a single strain of bacteria. Using differences as opposed to direct values is more likely to yield feasible measures for samples with multiple strains of bacteria such as that which would exist in the field. But future research should test samples with multiple bacterial strains to determine the range of optical density versus population growth, and population growth rates versus changes in capacitance. Thus, additional testing should include observations using various bacterial strains alone and together, to observe impedimetric changes arising from growth. Further investigation could also involve the testing of semi-liquid slimy environments to mimic real field conditions. Another aspect of the future developments can be the formulation of a chemically defined growth media with known resistance and capacitance and capable of providing enough nutrients to microorganisms. Such standard liquid media could help with the monitoring of solid samples such as soil samples, as it provides enough conductivity for the solid sample to be monitored. This can be helpful when field samples are extracted and an impedimetric baseline is required for comparison with the sample used in estimating its biomass availability.
For higher precision and maximum noise cancelling, it is best to conduct future testing in temperature-controlled environment. In an enclosed lab with HVAC units, the ambient temperature can be set to a specific set point to minimize temperature variances during the day and night. As well, a thermo-regulated chamber can be crafted to supply a temperature-controlled environment for the microelectrode wells by keeping their ambient temperature at a constant target level. Such chambers, that technically do a similar job as incubators, can also be integrated in a portable setup.
Nanofabricating e-plates or microelectrodes customized with respect to biomass size, is also recommended. The microelectrodes used for the testing of the system in this work showed good sensitivity to microbial metabolism. For future work, it may be a good idea to attempt the manufacturing of such microelectrodes in house using photolithography. This could help cut the cost down for future purposes. The E-plates from ACEA Biosciences however, are high quality products and though labelled as disposable, they can be used at least a couple of times by proper and gentle washing with water and soap. As the data indicated, they are well-engineered microelectrodes seeming to provide enough potential for biofilm monitoring. Another microelectrode manufacturer of multi-well microelectrodes that may be a potential supplier is Micrux Technologies in Spain.
A sensor for estimating bacterial growth that is relatively inexpensive is proposed for the purposes of real-time bacterial monitoring with potential deployment in bioretention cells (rain gardens). This research designed, manufactured, tested and verified a sensor that utilizes impedance spectroscopy in a laboratory setting. The growth of a strain of Pseudomonas Putida was evaluated with the device and the results show that the setup is capable of monitoring the growth of bacteria. Further analysis was executed to correlate impedance results to biomass concentration and availability.
The impedance-based monitoring system demonstrated potential for automated, real-time, easy-to-use, low cost, long-term measurements and promising capability because the monitored impedimetric properties showed relatively reasonable sensitivity to bacterial growth. This sensing ability was confirmed by using optical and microscopic methods on samples in tandem with the impedance measurements. Using manual direct counting of samples with known optical densities, relationships between the optical density and the count of cells in bacterial solutions was developed. Once the calibration of spectral absorbance was achieved by the help of direct counting of bacteria, the impedance measurements were interpreted in terms of bacterial concentration and biomass availability. By calibrating the optical spectrophotometry using hemocytometry, the cumbersome and time-consuming method of hemocytometry was effectively replaced by spectrophotometry to provide rapid measurements of bacterial concentration in samples similar to those being tested with impedance spectroscopy. This strategy led to the development of a relationship between the capacitance changes in the sample and the growth of bacteria in the sample under impedance testing.
Supplementary testing and evaluation could be conducted for the improvement of accuracy and robustness of the developed mathematical relationships. Novelties demonstrated in the present work in addition to the automation and affordability of the monitoring system involve optical density and population relationships as well as to establish relationships between population biomass growth and change in capacitance. These relationships were validated and the range of the sensor was provided. Other bacterial strains should potentially be tested with the same setup.
The crafted prototype of the impedance-based bacterial monitoring system is not ready for field or wide-scale use, but it has provided a valuable first step in reaching this ultimate objective. This system can be used in many different applications, such as biomass availability estimation in wastewater facilities. To date, no tool with a similar working principle has been used for such an application. Further work should be conducted to improve the portability of the system, such as using smaller sized impedance evaluation circuit boards and power supplies. The detection range of the system can also be improved if an optimization study is conducted on the size of the microelectrodes. As well, bacteria counting and biomass availability calibration could be improved by utilizing other sensitive methods.
The raw data supporting the conclusion of this article will be made available by the authors, without undue reservation.
FJ, CV, AC, and RB contributed to conception, and methodological design; FJ conducted the investigation, laboratory work and analysis; FJ prepared an initial draft; CV, AC, and RB wrote sections of the manuscript. All authors contributed to the article and approved the submitted version.
This research was funded by National Science and Engineering Research Council of Canada grant RGPIN-5096-2015 and was supported with equipment purchased by a Canadian Foundation for Innovation-JELF grant Project Number 32294.
The authors would like to thank Dr. Mohsen Akbari, Ms. Alecia LeBlanc and Mr. Jun Park of the Department of Mechanical Engineering at the University of Victoria for their assistance in preparing this manuscript. The authors would also like to thank the reviewers for their insightful reviews, which greatly improved the manuscript.
The author CV declared that they were an editorial board member of Frontiers at the time of submission. This had no impact on the peer review process and the final decision.
The remaining authors declare that the research was conducted in the absence of any commercial or financial relationships that could be construed as a potential conflict of interest.
All claims expressed in this article are solely those of the authors and do not necessarily represent those of their affiliated organizations, or those of the publisher, the editors and the reviewers. Any product that may be evaluated in this article, or claim that may be made by its manufacturer, is not guaranteed or endorsed by the publisher.
The Supplementary Material for this article can be found online at: https://www.frontiersin.org/articles/10.3389/fsens.2023.1242886/full#supplementary-material
Analog Devices Inc, A. D. (2019). ADG708/ADG709 Data sheet. Available online: https://www.analog.com/media/en/technical-documentation/data-sheets/ADG708_709.pdf.
Baum, M. M., Kainović, A., O'Keeffe, T., Pandita, R., McDonald, K., Wu, S., et al. (2009). Characterization of structures in biofilms formed by a Pseudomonas fluorescens isolated from soil. BMC Microbiol. 9 (1), 103. doi:10.1186/1471-2180-9-103
Brosel-Oliu, S., Uria, N., Abramova, N., and Bratov, A. (2015). “Impedimetric Sensors for Bacteria Detection,” in Biosensors micro and nanoscale applications. Editor T. Rinken
Carpentier, B., and Cerf, O. (1993). Biofilms and their consequences, with particular reference to hygiene in the food industry. J. Appl. Bacteriol. 75 (6), 499–511. doi:10.1111/j.1365-2672.1993.tb01587.x
Colquhoun, K., Timms, S., and Fricker, C. (1995). Detection of Escherichia coli in potable water using direct impedance technology. J. Appl. Bacteriol. 79 (6), 635–639. doi:10.1111/j.1365-2672.1995.tb00948.x
Cristiani, P., Franzetti, A., and Bestetti, G. (2008). Monitoring of electro-active biofilm in soil. Electrochimica acta 54 (1), 41–46. doi:10.1016/j.electacta.2008.01.107
Cunningham, A. B., Lennox, J. E., and Ross, R. J. (2008). Biofilms: the hypertextbook. https://www.cs.montana.edu/webworks/projects/stevesbook/index.html (Accessed October 8, 2019).
Daniels, J. S., and Pourmand, N. (2007). Label-free impedance biosensors: opportunities and challenges. Electroanal. An Int. J. Devoted Fundam. Pract. Aspects Electroanal. 19 (12), 1239–1257. doi:10.1002/elan.200603855
Davis, C. A., Atekwana, E., Atekwana, E., Slater, L. D., Rossbach, S., and Mormile, M. R. (2006). Microbial Growth and Biofilm Formation in Geologic Media Is Detected with Complex Conductivity Measurements. Geophys. Res. Lett. 33 (18). doi:10.1029/2006gl027312
Davis, C. A., Pyrak-Nolte, L. J., Atekwana, E. A., Werkema, D. D., and Haugen, M. E. (2010). Acoustic and electrical property changes due to microbial growth and biofilm formation in porous media. J. Geophys. Res. Biogeosciences 115 (G3), G00G06. doi:10.1029/2009jg001143
de Carvalho, C. C., and da Fonseca, M. M. R. (2007). Assessment of three-dimensional biofilm structure using an optical microscope. BioTechniques 42 (5), 616–620. doi:10.2144/000112403
Dellis, J., and Carpentier, J. (1993). Nelder and Mead algorithm in impedance spectra fitting. Solid state ionics 62 (1-2), 119–123. doi:10.1016/0167-2738(93)90259-6
Dusane, D. H., Lochab, V., Jones, T., Peters, C. W., Sindeldecker, D., Das, A., et al. (2019). Treatment of Pseudomonas aeruginosa biofilms. Sci. Rep. 9 (1), 2008. doi:10.1038/s41598-018-37891-y
Ertürk, G., and Mattiasson, B. (2017). Capacitive biosensors and molecularly imprinted electrodes. Sensors 17 (2), 390. doi:10.3390/s17020390
Figliola, R. S., and Beasley, D. E. (2014). Theory and design for mechanical measurements. 6th ed.”. USA: Wiley Press. 978-1-119-03170-3.
Firstenbergeden, R., and Klein, C. S. (1983). Evaluation of a rapid impedimetric procedure for the quantitative estimation of coliforms. J. food Sci. 48 (4), 1307–1311. doi:10.1111/j.1365-2621.1983.tb09217.x
Fischer, M., Triggs, G., and Krauss, T. F. (2016). Optical sensing of microbial life on surfaces. Appl. Environ. Microbiol. 82 (5), 1362–1371. doi:10.1128/aem.03001-15
Fischer, M., Wahl, M., and Friedrichs, G. (2012). Design and field application of a UV-LED based optical fiber biofilm sensor. Biosens. Bioelectron. 33 (1), 172–178. doi:10.1016/j.bios.2011.12.048
Gnan, S., and Luedecke, L. O. (1982). Impedance measurements in raw milk as an alternative to the standard plate count. J. food Prot. 45 (1), 4–7. doi:10.4315/0362-028x-45.1.4
Grossi, M., Lanzoni, M., Pompei, A., Lazzarini, R., Matteuzzi, D., and Riccò, B. (2010). An Embedded Portable Biosensor System for Bacterial Concentration Detection. Biosens. Bioelectron. 26 (3), 983–990. doi:10.1016/j.bios.2010.08.039
Hardy, D., Kraeger, S., Dufour, S., and Cady, P. (1977). Rapid detection of microbial contamination in frozen vegetables by automated impedance measurements. Appl. Environ. Microbiol. 34 (1), 14–17. doi:10.1128/aem.34.1.14-17.1977
Jalilian, F. (2020). Biofilm sensing tool development for environmental monitoring.” A thesis in fulfillment of the requirements for a masters of applied science, mechanical engineering. Victoria, British Columbia: University of Victoria, 158.
Jalilian, F., Valeo, C., Chu, A., and Bhiladvala, R. (2023). Sensors for Biomass Monitoring in Vegetated Green Infrastructure: A Review. Sensors 23, 6404. doi:10.3390/s23146404
Janknecht, P., and Melo, L. F. (2003). Online biofilm monitoring. Rev. Environ. Sci. Biotechnol. 2 (2-4), 269–283. doi:10.1023/b:resb.0000040461.69339.04
Khan, U. T., Valeo, C., Chu, A., and van Duin, B. (2012). Bioretention cell efficacy in cold climates: part 2 - water quality performance. Can. J. Civ. Eng. 39, 1222–1233. doi:10.1139/l2012-111
Kim, S., Yu, G., Kim, T., Shin, K., and Yoon, J. (2012). Rapid bacterial detection with an interdigitated array electrode by electrochemical impedance spectroscopy. Electrochimica Acta 82, 126–131. doi:10.1016/j.electacta.2012.05.131
Kim, T., Kang, J., Lee, J.-H., and Yoon, J. (2011). Influence of attached bacteria and biofilm on double-layer capacitance during biofilm monitoring by electrochemical impedance spectroscopy. Water Res. 45 (15), 4615–4622. doi:10.1016/j.watres.2011.06.010
Lawrence, J., Korber, D., Hoyle, B., Costerton, J. W., and Caldwell, D. (1991). Optical sectioning of microbial biofilms. J. Bacteriol. 173 (20), 6558–6567. doi:10.1128/jb.173.20.6558-6567.1991
LeFevre, G. H., Paus, K. H., Natarajan, P., Gulliver, J. S., Novak, P. J., and Hozalski, R. M. (2014). Review of dissolved pollutants in urban storm water and their removal and fate in bioretention cells. J. Environ. Eng. 141 (1), 04014050. doi:10.1061/(asce)ee.1943-7870.0000876
Lewandowski, Z., and Beyenal, H. (2003). Biofilm monitoring: a perfect solution in search of a problem. Water Sci. Technol. 47 (5), 9–18. doi:10.2166/wst.2003.0267
Liu, L., Xu, Y., Cui, F., Xia, Y., Chen, L., Mou, X., et al. (2018). Monitoring of bacteria biofilms forming process by in-situ impedimetric biosensor chip. Biosens. Bioelectron. 112, 86–92. doi:10.1016/j.bios.2018.04.019
MacKay, S., Abdelrasoul, G., Tamura, M., Lin, D., Yan, Z., and Chen, J. (2017). Using Impedance Measurements to Characterize Surface Modified with Gold Nanoparticles. Sensors 17 (9), 2141. doi:10.3390/s17092141
Maruyama, K., Ohkawa, H., Ogawa, S., Ueda, A., Niwa, O., and Suzuki, K. (2006). Fabrication and characterization of a nanometer-sized optical fiber electrode based on selective chemical etching for scanning electrochemical/optical microscopy. Anal. Chem. 78 (6), 1904–1912. doi:10.1021/ac0502549
Matlock, B. C. (2019). “Differences in bacterial optical density measurements between UV-Visible spectrophotometers,” in Technical note N. 52236, thermo Fisher scientific (Wilmington, DE USA. 4pp, TN52236-differences-bacterial-optical-density-uv-vis.pdf.
Mei, B.-A., Munteshari, O., Lau, J., Dunn, B., and Pilon, L. (2018). Physical Interpretations of Nyquist Plots for EDLC Electrodes and Devices. J. Phys. Chem. C 122 (1), 194–206. doi:10.1021/acs.jpcc.7b10582
Min, J., and Baeumner, A. J. (2004). Characterization and optimization of interdigitated ultramicroelectrode arrays as electrochemical biosensor transducers. Electroanal. An Int. J. Devoted Fundam. Pract. Aspects Electroanal. 16 (9), 724–729. doi:10.1002/elan.200302872
Nivens, D. E., Chambers, J. Q., Anderson, T. R., and White, D. C. (1993). Long-term, on-line monitoring of microbial biofilms using a quartz crystal microbalance. Anal. Chem. 65 (1), 65–69. doi:10.1021/ac00049a013
Ntarlagiannis, D., Yee, N., and Slater, L. (2005). On the low-frequency electrical polarization of bacterial cells in sands. Geophys. Res. Lett. 32 (24), L24402. doi:10.1029/2005gl024751
O'Toole, G. A., and Ghannoum, M. A. (2004). “Introduction to biofilms: conceptual themes,” in Microbial biofilms (American Society of Microbiology), 1–3.
Pal, N., Sharma, S., and Gupta, S. (2016). Sensitive and rapid detection of pathogenic bacteria in small volumes using impedance spectroscopy technique. Biosens. Bioelectron. 77, 270–276. doi:10.1016/j.bios.2015.09.037
Paredes, J., Becerro, S., and Arana, S. (2014b). Comparison of Real Time Impedance Monitoring of Bacterial Biofilm Cultures in Different Experimental Setups Mimicking Real Field Environments. Sensors Actuators B Chem. 195, 667–676. doi:10.1016/j.snb.2014.01.098
Paredes, J., Becerro, S., and Arana, S. (2014a). Label-free interdigitated microelectrode based biosensors for bacterial biofilm growth monitoring using Petri dishes. J. Microbiol. methods 100, 77–83. doi:10.1016/j.mimet.2014.02.022
Paredes, J., Becerro, S., Arizti, F., Aguinaga, A., Del Pozo, J., and Arana, S. (2012). Real time monitoring of the impedance characteristics of Staphylococcal bacterial biofilm cultures with a modified CDC reactor system. Biosens. Bioelectron. 38 (1), 226–232. doi:10.1016/j.bios.2012.05.027
Paredes, J., Becerro, S., Arizti, F., Aguinaga, A., Del Pozo, J., and Arana, S. (2013). Interdigitated microelectrode biosensor for bacterial biofilm growth monitoring by impedance spectroscopy technique in 96-well microtiter plates. Sensors Actuators B Chem. 178, 663–670. doi:10.1016/j.snb.2013.01.027
Pompei, A., Grossi, M., Lanzoni, M., Perretti, G., Lazzarini, R., Riccò, B., et al. (2012). Feasibility of lactobacilli concentration detection in beer by automated impedance technique. MBAA Tech. Q. 49 (1), 11–18.
Radhakrishnan, R., Suni, I. I., Bever, C. S., and Hammock, B. D. (2014). Impedance biosensors: applications to sustainability and remaining technical challenges. ACS Sustain. Chem. Eng. 2 (7), 1649–1655. doi:10.1021/sc500106y
Radke, S. M., and Alocilja, E. C. (2004). Design and fabrication of a microimpedance biosensor for bacterial detection. IEEE sensors J. 4 (4), 434–440. doi:10.1109/jsen.2004.830300
Reyes-Romero, D., Behrmann, O., Dame, G., and Urban, G. (2014). Dynamic thermal sensor for biofilm monitoring. Sensors Actuators A Phys. 213, 43–51. doi:10.1016/j.sna.2014.03.032
Rodriguez-Mozaz, S., Lopez de Alda, M. J., and Barceló, D. (2006). Biosensors as Useful Tools for Environmental Analysis and Monitoring. Anal. Bioanal. Chem. 386 (4), 1025–1041. doi:10.1007/s00216-006-0574-3
Sammer, M., Laarhoven, B., Mejias, E., Yntema, D., Fuchs, E. C., Holler, G., et al. (2019). Biomass measurement of living Lumbriculus variegatus with impedance spectroscopy. J. Electr. Bioimpedance 5 (1), 92–98. doi:10.5617/jeb.934
Sezonov, G., Joseleau-Petit, D., and D'Ari, R. (2007). Escherichia coli Physiology in Luria-Bertani Broth. J. Bacteriol. 189 (23), 8746–8749. doi:10.1128/jb.01368-07
Sorrells, K. M. (1981). Rapid Detection of Bacterial Content in Cereal Grain Products by Automated Impedance Measurements. J. Food Prot. 44 (11), 832–835. doi:10.4315/0362-028x-44.11.832
Strauss, W., Malaney, G., and Tanner, R. (1984). The impedance method for monitoring total coliforms in wastewaters. Folia Microbiol. 29 (2), 162–169. doi:10.1007/bf02872933
Tubía, I., Paredes, J., Pérez-Lorenzo, E., and Arana, S. (2018). Antibody biosensors for spoilage yeast detection based on impedance spectroscopy. Biosens. Bioelectron. 102, 432–438. doi:10.1016/j.bios.2017.11.057
Turolla, A., Di Mauro, M., Mezzera, L., Antonelli, M., and Carminati, M. (2019). Development of a Miniaturized and Selective Impedance Sensor for Real-Time Slime Monitoring in Pipes and Tanks. Sensors Actuators B Chem. 281, 288–295. doi:10.1016/j.snb.2018.10.107
van Gerwen, P., Laureyn, W., Laureys, W., Huyberechts, G., De Beeck, M. O., Baert, K., et al. (1998). Nanoscaled interdigitated electrode arrays for biochemical sensors. Sensors Actuators B Chem. 49 (1-2), 73–80. doi:10.1016/s0925-4005(98)00128-2
Varshney, M., and Li, Y. (2009). Interdigitated array microelectrodes based impedance biosensors for detection of bacterial cells. Biosens. Bioelectron. 24 (10), 2951–2960. doi:10.1016/j.bios.2008.10.001
Wang, R., Lum, J., Callaway, Z., Lin, J., Bottje, W., and Li, Y. (2015). A label-free impedance immunosensor using screen-printed interdigitated electrodes and magnetic nanobeads for the detection of E. coli O157: H7. Biosensors 5 (4), 791–803. doi:10.3390/bios5040791
Xu, Y., Xie, X., Duan, Y., Wang, L., Cheng, Z., and Cheng, J. (2016). A Review of Impedance Measurements of Whole Cells. Biosens. Bioelectron. 77, 824–836. doi:10.1016/j.bios.2015.10.027
Yang, L. (2008). Electrical impedance spectroscopy for detection of bacterial cells in suspensions using interdigitated microelectrodes. Talanta 74 (5), 1621–1629. doi:10.1016/j.talanta.2007.10.018
Yang, L., Li, Y., and Erf, G. F. (2004). Interdigitated array microelectrode-based electrochemical impedance immunosensor for detection of Escherichia c oli O157: H7. Anal. Chem. 76 (4), 1107–1113. doi:10.1021/ac0352575
Keywords: bacterial biomass, bioretention cells, bioremediation, impedance microbiology, optical density, spectrophotometry
Citation: Jalilian F, Valeo C, Chu A and Bhiladvala R (2023) Impedance properties of biomass in support of practical mensuration in rain gardens. Front. Sens. 4:1242886. doi: 10.3389/fsens.2023.1242886
Received: 19 June 2023; Accepted: 29 September 2023;
Published: 13 October 2023.
Edited by:
Dinesh Maddipatla, Western Michigan University, United StatesReviewed by:
Marco Grossi, University of Bologna, ItalyCopyright © 2023 Jalilian, Valeo, Chu and Bhiladvala. This is an open-access article distributed under the terms of the Creative Commons Attribution License (CC BY). The use, distribution or reproduction in other forums is permitted, provided the original author(s) and the copyright owner(s) are credited and that the original publication in this journal is cited, in accordance with accepted academic practice. No use, distribution or reproduction is permitted which does not comply with these terms.
*Correspondence: Caterina Valeo, dmFsZW9AdXZpYy5jYQ==
Disclaimer: All claims expressed in this article are solely those of the authors and do not necessarily represent those of their affiliated organizations, or those of the publisher, the editors and the reviewers. Any product that may be evaluated in this article or claim that may be made by its manufacturer is not guaranteed or endorsed by the publisher.
Research integrity at Frontiers
Learn more about the work of our research integrity team to safeguard the quality of each article we publish.