 Omolola E. Fayemi
 Saheed E. Elugoke
 Oluwole Dina
 Mulunda Mwanza3
 Peter O. Fayemi
- 1Department of Chemistry, Faculty of Natural and Agricultural Science, North-West University (Mafikeng Campus), Mmabatho, South Africa
- 2Material Science Innovation and Modelling (MaSIM) Research Focus Area, Faculty of Natural and Agricultural Science, North-West University (Mafikeng Campus), Mmabatho, South Africa
- 3Department of Animal Health, School of Agriculture, Faculty of Agriculture, Science, and Technology, North-West University (Mafikeng Campus), Mmabatho, South Africa
- 4βeta-Letters AgriNextiomics, Mahikeng, South Africa
Nano-scale detection and characterization of neurotransmitters from real samples is a novel analytical technique with multiple applications in the field of nano-biotechnology. This in-situ electrochemical sensing tool has growing advantages of high reproducibility, rapid response, superior sensitivity, selectivity, accuracy, and miniaturization. A screen-printed iron oxide (Fe3O4) modified electrode was harnessed in this study for detecting epinephrine (EP), a chemical messenger or signalling neuro transmitting molecule, from two breeds of chickens. The fabricated sensor was used for the analysis of EP in the real and unspiked samples. UV-visible spectroscopy, Fourier-Transform infrared spectroscopy (FT-IR), Transmission Electron Microscopy (TEM), and Scanning Electron Microscopy (SEM) were used for characterizing the surface of nanoparticles prior to modification of screen-printed silver electrode (SPSE). The XRD diffractogram of Fe3O4 nanoparticles showed peaks at 30.1°, 35.7°, 43.3°, 53.9°, 57.5°, and 63.0°, corresponding to Miller indices of 220, 311, 400, 422, 511, and 440, respectively. This diffraction pattern indicates that the Fe3O4 nanoparticles have a spinel structure. Simultaneous detection of EP in the presence of ascorbic acid was obtained from Fe3O4 electrode. Further result shows a corresponding rise in oxidation peak current (Ipa) of EP with an increase in its concentration and scan rate of 25–400 mVs−1 confirming catalytic properties of the modified electrode towards EP. Our findings demonstrate that the fabricated sensor used for detecting EP in blood serum, breast muscle, and visceral organs of both chicken breeds produced better recovery.
Introduction
Domesticated chickens (Gallus gallus domesticus) are homeothermic species from the Galliformes order commonly raised for meat and egg production in the poultry industry. Over the years, a wide range of genetically and phenotypically diverse strains of chickens have been bred and grouped into many classification models based on origin, evolutionary links, pleiotropic effect, and purpose of use as the American, Asiatic, Continental, English, or Mediterranean game, egg-type, meat-type, dual-purpose and ornamental or “decorative” breeds (Nangsuay et al., 2011; Larkina et al., 2021). Routinely and periodically, neurohormonal systems are activated in response to those dynamics and cascade of stressful conditions, which consequently influence hypothalamic-pituitary-adrenal-axis and body homeostasis (Ottinger and Abdelnabi, 1997; Fallahsharoudi et al., 2017). So far, potential stressors have been identified in the poultry sector for appropriate characterization under free-ranging or captive environments at various stages of domestication and reproduction cycles. Notable among those stressors is the discomfort caused by frightening predator attacks, cannibalistic behavior, overcrowding, irritation from parasitic and infectious agents (Blas, 2015; Archer, 2019; Mohamed et al., 2020).
When the stress level is triggered either exogenously or endogenously and found to exceed tolerable limits, it affects the neuroendocrine system, the messenger network with feedback loops of hormones released by the adrenal glands in response to stress body metabolism physiologic changes in target organs. The sympathoadrenal system and hypothalamic-pituitary-adrenal axis are regulators of stress response in the adrenal glands of domesticated birds (Herman et al., 2016; Fallahsharoudi et al., 2017). Adrenaline, otherwise known as epinephrine with IUPAC name: 4-[(1R)-1-hydroxy-2-(methylamino) ethyl] benzene-1,2-diol is a catecholamine secreted by the adrenal gland and neurons in the brain where it acts as a neurotransmitter mobilizing energy stores as glucose and free fatty acids in preparation for physical activity or recovery from hypoglycaemia (Peet, 2012; Moawad and Randa, 2017). Epinephrine (C9H13NO3) is a naturally occurring monoamine neurotransmitter and sympathomimetic catecholamine in the chromaffin cells of adrenal medulla secretory cellular machinery. It has four functional groups: two catechol OH, an N-CH3 group, and a β-OH group (Ebert, 2013) (Scheme 1). Epinephrine is a sympathomimetic catecholamine with potent α-and β-adrenergic stimulating properties for enhancing systemic systolic-diastolic blood pressures and pulmonary vascular resistance (Gangadharan et al., 2019). It exerts positive chronotropic and inotropic effects on alpha and beta-adrenergic receptors in the sympathetic nervous system using a G-protein-linked second messenger system vis-a-vis the cardiac output, myocardial oxygen consumption, cardiac efficiency, and regulating visceral functions (Peet, 2012; Nestler et al., 2015). It is a prototype of a non-selective adrenergic agonist (adrenaline) with a greater affinity for β-adrenergic receptors beta receptors in small doses. A fight or flight hormone regulates vascular tone in animal models and evokes cardiac sensitization in response to emotional arousals such as fear, stress, and anxiety tendencies (Papich, 2021). It is often administered upon detection of anaphylaxis to maintain homeostasis against stress response and abate induction of morbidity or loss of consciousness (Brown et al., 2020; Boswell et al., 2021).

SCHEME 1. Chemical structure of epinephrine.
The connection between the avian endocrine system, hormonal stress modulatory pathways, and adrenal gland that regulates vital physical activity and physiological functions calls for susceptible electrochemical sensors for detection. Given its multiple in vivo roles, numerous analytical techniques have been used for detecting epinephrine in real samples. Examples include the use of quantitative trait loci (QTL) mapping, QTL underlying stress-induced corticosterone, high-performance liquid chromatography, fluorimetry, and spectrophotometry (Fallahsharoudi et al., 2017; Fang et al., 2018; Yadav et al., 2019). Most of these analytical methods have shortcomings, such as elaborate sample treatment, high cost of analysis, and the need for the highly skilled analyst(s). Fortuitously, the electrochemical method of analysis has novel characteristics that can solve these problems (Tezerjani et al., 2017; Dehdashti and Babaei, 2020). On the other hand, hybrid techniques such as electrochemiluminescence do not possess the simplicity of pure electrochemical methods.
Therefore, this study reports a successful detection of epinephrine in vital organs of two domestic avian species of chicken at iron oxide screen-printed modified electrode sensor. The choice of iron oxide nanoparticles (Fe3O4 NPs) as screen-printed electrode (SPE) modifiers is based on nanomaterials’ comparative advantages and applications. Specifically, Fe3O4 nanoparticles have been reported to have a large surface area, high conductivity, and excellent electrocatalytic activity towards biogenic amines’ oxidation (Thamilselvan et al., 2019; Tomé and Brett, 2019). Notably, EP detection was achieved at silica-Fe3O4/graphene oxide core-shell nanostructure modified SPE with a very low detection limit (Safaei et al., 2018). Similarly, electrochemical EP detection at the micro-molar level was reported by Mphuthi et al., 2017 by using GCE with a ternary composite containing a phthalocyanine, multi-walled carbon nanotube (MWCNTs), and Fe3O4 NPs (). Poly (brilliant cresyl blue)/Fe2O3 composite modified glassy carbon electrode (GCE) was successfully applied for EP detection (Tomé and Brett, 2019). The electronic conductivity and the large surface area of the iron oxide nanoparticles in these sensors played a significant role in EP sensing. The present study is one of few instances where Fe3O4 NPs have been deployed for EP detection. This novel sensor (SPSE/Fe3O4) grossly benefitted from the excellent electrocatalytic activity and the large surface area of Fe3O4 for EP detection. Real sample analysis reported so far for EP detection at previous iron oxide modified electrodes and modified SPE was in EP injection or blood serum (Mphuthi et al., 2017; Safaei et al., 2018; Tomé and Brett, 2019). The current study offered important analytical data on the real sample analysis of EP in various parts of two different breeds of chicken. The analytical data recorded for EP analysis in the animal spleen, blood serum, breast muscle, kidney, and liver at SPSE/Fe3O4 is the first attempt at elaborate electrochemical EP detection in biological samples.
Materials and Methods
Experimental Materials
The materials used for the study were of analytical grade. Epinephrine hydrochloride, iron II sulphate heptahydrate (99% FeSO4·7H2O), and iron III chloride hexahydrate (99% FeCl3.6H2O) were purchased from Sigma Aldrich. Ammonium hydroxide (25% NH4OH), zinc chloride (99% ZnCl2), nitric acid (70% HNO3), sodium hydroxide (99% NaOH), hydrochloric acid (38% HCl), sodium dihydrogen phosphate (99% NaH2PO4), disodium hydrogen phosphate (99% Na2HPO4), dimethylformamide (99% DMF) from Sigma Aldrich Chemical, South Africa. The screen-printed silver electrodes (SPSE) were from Metrohm, South Africa. The spleen, blood serum, breast muscle, kidney, and liver of Buff Orpington Rooster and Rhodes Island White Broiler used for real sample analysis were collected from a local butchery immediately after slaughter. Ethical practices were adhered to in all the sample collection, processing, and analysis procedures.
Methods
Synthesis of Fe3O4 Nanoparticles
The magnetic iron oxide nanoparticles (Fe3O4 NPs) were synthesized using a technique previously adopted by Gorospe et al. (Gorospe et al., 2019) with slight modification. The FeCl3·6H2O and FeSO4·7H2O precursors were dispersed into a conical flask containing nitrogen gas and purged distilled water at a respective molar ratio of 2:1. This mixture was then subjected to vigorous stirring on a magnetic stirrer. Approximately 5 ml of ammonium hydroxide was transferred into a burette and discharged in drops into the flask containing a mixture of the iron salts. The resultant black suspension was immediately covered and subjected to stirring for almost 10 min. The magnetic nanoparticles were separated using a bar magnet and dispersed in distilled water. These nanoparticles were washed with sufficient distilled water for 6-times and subsequently with ethanol 4-times. The black nanoparticles obtained were dried under vacuum at room temperature.
Preparation of SPSE/Fe3O4
The drop-dry technique was used to fabricate the Fe3O4 NPs modified SPSE (SPSE/Fe3O4). The as-synthesized Fe3O4 NPs was dispersed in DMF and sonicated for 24 h to obtain a homogenous paste. About 8 μl of this paste was dropped on the screen printed silver working electrode and allowed to dry at room temperature. Scheme 2 shows the schematic representation of the synthesis of Fe3O4 NPs and subsequent modification of SPSE with the as-synthesized Fe3O4 NPs. The modified electrode (SPSE/Fe3O4) was applied for the electroanalysis of epinephrine.
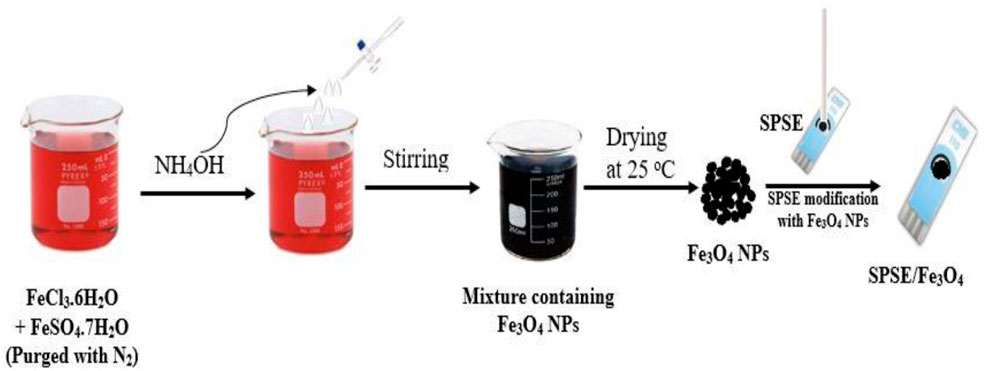
SCHEME 2. Schematic representation of Fe3O4 NPs preparation and SPSE/Fe3O4 fabrication.
Preparation of Real Samples for Analysis
The OR and RIWB blood samples were collected in vials and kept in ice to prevent coagulation. The sample pre-treatment was done according to a method presented by Zhao et al. (Zhao et al., 2015) with minor modification. About 0.05 ml concentrated nitric acid (70% HNO3) was added to the blood sample in a centrifuge tube and allowed to stand for 2 h. Neutralization of the mixture was carried out with 0.05 ml of 1 M sodium hydroxide. The resultant solution was centrifuged for 20 min at 4,000 rpm. The clear serum solution at the top was separated by decantation and stored at 4°C for further analysis. The treated OR and RIWB blood samples were labelled Serum 1 and Serum 2, respectively. The sample preparation for the breast muscle, spleen, kidney and liver from both chicken species (OR and RIWB), were collected similarly to the blood samples before electrochemical analysis followed a method by Kahlouche et al. (Kahlouche et al., 2018) with slight modification. A reasonable amount of 0.1 M PBS (pH 7) was added to the samples before pulverization to a homogeneous paste. The resultant paste was dispersed in a solution of 1 M ZnCl2 and allowed to stand for 30 min. Afterwards, this solution was centrifuged at 4,000 rpm for 15 min. The supernatant was separated from the lower solid masses and stored at 4°C for analysis. The treated kidney samples obtained from RIWB and OR were labelled RIWKID and ORKID, respectively. While the liver samples from RIWB and OR were tagged RIWLIV and ORLIV, respectively. RIWB and OR breast muscle extracts were coded RIWBM and ORBM, respectively. RIWBBS represents the spleen extract from the spleen of RIWB.
Characterization of Fe3O4 Nanoparticles
Fourier transform infrared (FT-IR) Opus Alpha-P spectrophotometer supplied by Brucker Corporation, United States, UV-visible, and X-ray diffraction (XRD) spectroscopy were used to characterize Fe3O4 NPs. The XRD and UV-visible data were collected using the Rontgen X’Pert Pro diffractometer and Uviline 9400 spectrophotometer (Germany). Microscopic characterization of nanoparticles was achieved with the scanning electron microscope (Quanta FEG 250 supplied by ThermoFisher Scientific, United States) and transmission electron microscope. The scanning electron microscopy (SEM) and transmission electron microscopy (TEM) images obtained with this equipment provided details about the morphology and ultrastructure of nanoparticles. All electrochemical analyses were done using portable DropSens potentiostat (MetrohmR) connected to a personal computer for data processing. This workstation includes a screen-printed silver electrode (SPSE) with embedded working, counter, and reference electrodes. The supporting electrolyte used for all electroanalyses (0.1 M phosphate buffer solution, PBS) was prepared using the appropriate concentration of Na2HPO4 and NaH2PO4.
Results and Discussion
XRD Analysis
The XRD diffractogram of Fe3O4 NPs (Figure 1) showed peaks at 30.1°, 35.7°, 43.3°, 53.9°, 57.5°, and 63.0°, corresponding to Miller indices of 220, 311, 400, 422, 511, and 440, respectively. This diffraction pattern suggests that the Fe3O4 NPs have a spinel structure (according to JCPDS No. 19-629) (Pîslaru-Dănescu et al., 2017). A similar diffraction pattern has been reported for Fe3O4 NPs in various studies on Fe3O4 NPs (Loh et al., 2008; Shagholani et al., 2015; Pîslaru-Dănescu et al., 2017). Using the Scherrer equation (Eq. 1), the crystallite particle size using the peak at 35.7° (311) was found to be 10.91 nm.

FIGURE 1. X-ray diffractogram of Fe3O4 nanoparticles.
D,
FT-IR Analysis
The FT-IR spectrum of Fe3O4 NPs (Figure 2) shows peaks at 565, 1,048, 1,348, 1,571, and 3,174 cm−1. The peak at 565 cm−1 suggests the presence of Fe-O bond in Fe3O4. Also, the absorption band at 565 cm−1 confirms the magnetite phase in the Fe3O4 NPs (Zavareh et al., 2017). The absorption band at about the same wavenumber has been reported for Fe-O in previously synthesized Fe3O4 NPs (Bertolucci et al., 2015; Pham et al., 2016; Zavareh et al., 2017). The absorption band at 3,174 cm−1 is probably due to the–OH stretching vibration from the water adsorbed on the surface of the Fe3O4 NPs (Pham et al., 2016). The absorption bands at 1,571 cm−1 is due to the–NH bending vibration of the–NH bond in the residual unreacted ammonia.
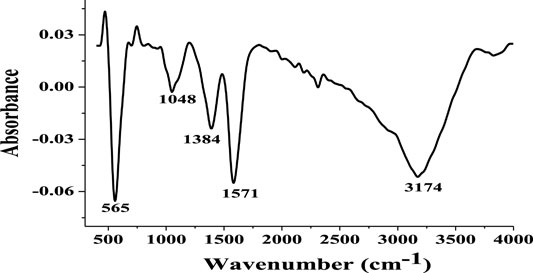
FIGURE 2. FT-IR spectrum of Fe3O4 nanoparticles.
UV-Visible Analysis
The UV-visible spectra of the Fe3O4 precursors depicted in Figure 3A show two peaks at 292 and 738 nm for FeCl3·6H2O and a single peak at the visible region (738 nm) for FeSO4·7H2O. The UV-visible spectrum of the Fe3O4 NPs presented in Figure 3B showed two strong absorptions at 386 and 634 nm. Although these absorption bands (in Fe3O4 NPs) are similar to FeCl3·6H2O, they emerged at different wavelengths (Figures 3A,B). The significant difference in the absorption wavelengths of the precursors and the Fe3O4 NPs suggests the successful synthesis of the nanoparticles. Noteworthy, the emergence of strong absorptions at the ultraviolet and the visible region has been reported for Fe3O4 NPs (Cao et al., 2015). Also, absorption peaks at about 386 nm have been reported for Fe3O4 NPs prepared using various precursors (Hu et al., 2014; Cao et al., 2015; Taka et al., 2019). The absorption band at 634 nm represents the plasmon resonance band.
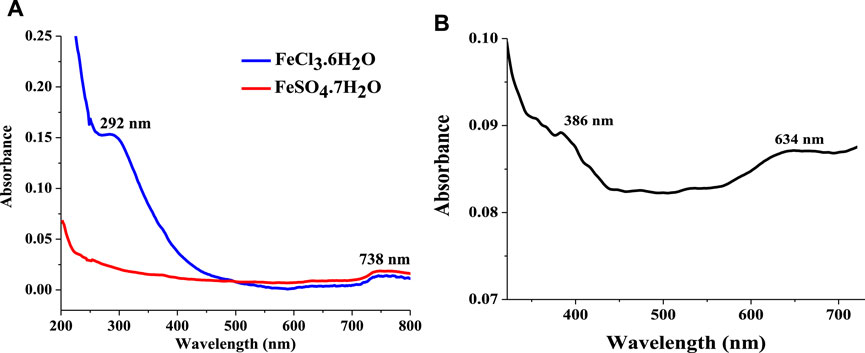
FIGURE 3. UV-visible spectrum of (A) Fe3O4 NPs precursors (FeCl3·6H2O and FeSO4·7H2O) (in distilled water) and (B) Fe3O4 nanoparticles (in DMF).
SEM and TEM Analysis
Figures 4A,B shows the SEM image of the Fe3O4 NPs obtained at two different magnifications. The images obtained at high magnification (100, 000 X) (Figure 4A) show that the Fe3O4 particles are made of aggregates of spherical masses. At lower magnification (×20,000) (Figure 4B), the spherical particles appeared to form aggregates that give the entire Fe3O4 NPs a collective rough surface morphology. Interestingly, magnetic nanoparticles of similar surface morphology have been reported (Pîslaru-Dănescu et al., 2017). Using the SEM image obtained at higher magnification, an average particle size of 63.6 nm was calculated for the Fe3O4 NPs. The internal structure of the Fe3O4 NPs depicted on the TEM micrograph of these nanoparticles (Figure 4C) also confirmed the spherical nature of the individual particles and the aggregation of the Fe3O4 NPs. The average particle size of the nanoparticles obtained from the analysis of the TEM image (Figure 4D) is 11.8 nm. This value is close to the average crystallite particle size calculated from the X-ray diffractogram. The disparity between the particle sizes obtained from SEM and TEM is due to the difference in resolution of the microscopes used for both techniques.
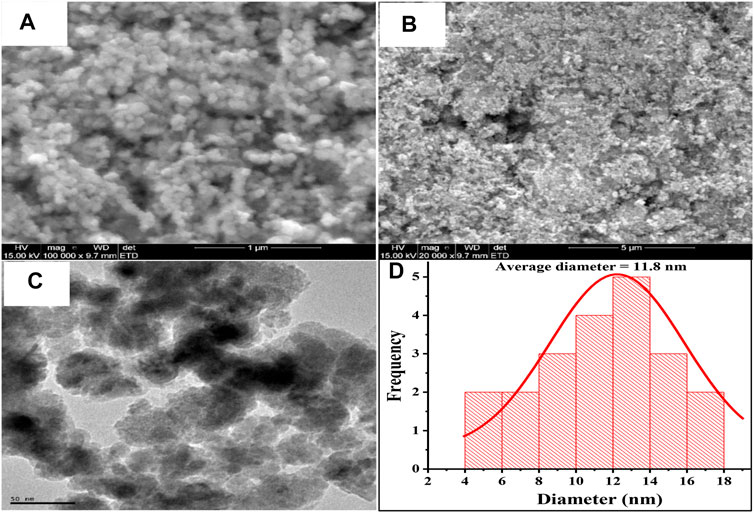
FIGURE 4. SEM micrograph of Fe3O4 nanoparticles at (A) low magnification (×20,000) and (B) high magnification (×100,000). (C) TEM micrograph of Fe3O4 NPs and (D) Size distribution chart of Fe3O4 NPs in the TEM image.
Electrochemical Impedance Spectroscopy
Electrochemical characterization of the bare SPSE and SPSE/Fe3O4 was done using these electrodes for EIS studies in the presence of 1 mM EP (pH 7). Figure 5A shows the Nyquist plot of the bare and modified electrode in EP. Figure 5B depicts the equivalent circuit for fitting the EIS data. The values of the solution resistance (Rs), charge transfer resistance (Rct), constant phase element (CPE), and the Warburg impedance (W) used for the EIS circuit fitting have been itemized in Table 1. The Rct of the bare SPSE (8,005 Ω) dropped drastically after modification with Fe3O4 (145 Ω), suggesting an improvement in the ability of the electrode to support charge transfer after surface modification. This indicates that the Fe3O4 in SPSE/Fe3O4 improved the conductivity of the bare electrode, resulting in the better electrocatalytic activity of SPSE/Fe3O4 towards EP oxidation. A similar decrease in Rct and the attendant increase in the conductivity of electrodes after modification with nanoparticles has been reported in several studies (Zangeneh Kamali et al., 2014; Arani et al., 2019). The difference in Rct values of the electrodes also confirms the superior EP current response recorded at SPSE/Fe3O4 (with CV) relative to that of the bare electrode (Figure 6B). Also, the Warburg impedance (W) obtained at the low frequency end of the EIS spectra of the bare and modified electrode suggests a diffusive behavior around the electrodes (Vedalakshmi et al., 2009). Noteworthy, Yo and N in Table 1 represent the magnitude of the CPE and exponent of the CPE, respectively.
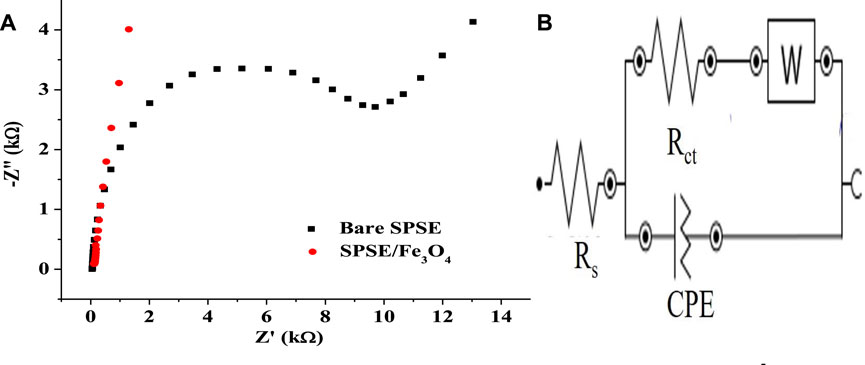
FIGURE 5. (A) EIS spectra of Bare SPSE and SPSE/Fe3O4 in 1 mM EP (pH 7, 10–1–105 Hz frequency range, 10 mV amplitude). (B) Equivalent circuit for fitting the EIS data in (A).

TABLE 1. EIS parameters of bare SPSE and SPSE/Fe3O4.
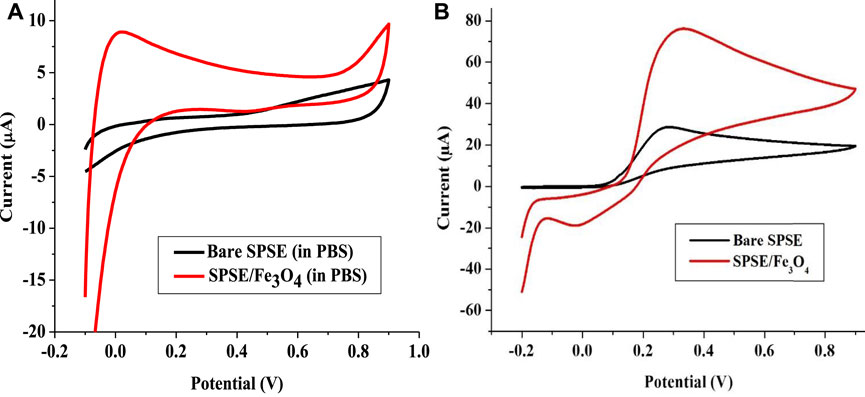
FIGURE 6. Cyclic voltammogram of Bare SPSE and SPSE/Fe3O4 in (A) 0.1 M PBS (pH 7), and (B) 1 mM EP (pH 7) (scan rate 25 mV s−1).
The electron transfer rate constant (ks) was calculated using Eq. 2 (Adekunle et al., 2010). R, T, n, A, and F in Eq. 2 represent molar gas constant (J mol−1 K−1), absolute temperature (K), number of electrons Figure 6B transferred, electrode surface area and Faraday’s constant (C mol−1), respectively. The ks values for bare and SPSE and SPSE/Fe3O4 were calculated as 1.01 and 21.28 s−1. This implies that the modification of bare SPSE with Fe3O4 drastically raised the electron transfer rate constant, resulting in the significantly higher current response recorded at SPSE/Fe3O4 relative to bare SPSE (Figure 6B).
Electroanalysis of Epinephrine
The electrochemical analysis of EP was done with bare SPSE and Fe3O4 NPs modified SPSE (SPSE/Fe3O4) in 0.1 M PBS (pH 7) at a scan rate of 25 mVs−1. Figure 6A shows the cyclic voltammogram of 0.1 M PBS (pH 7) at the bare and modified electrodes. These voltammograms revealed that no peak emerged after the analysis of the blank solution. In the presence of EP, the bare electrode showed only the anodic peak at 0.3 V. On the other hand, the modified electrode showed a prominent anodic peak at 0.32 V and a weak cathodic peak at −0.12 V (Figure 6B). The anodic peak current (Iap) obtained with bare and modified electrodes were 30 and 79 μA, respectively. The electroactive surface area of the bare and modified electrodes calculated from Randle Sevcik equation (Eq. 3) were 0.79 and 2.08 cm2, respectively. D, C, n, v, A, and i in Eq. 3 represent diffusion coefficient (cm2 s−1), concentration of EP (mol cm−3), number of electrons, scan rate (Vs−1), electrode surface area (cm2) and peak current (A), respectively. D was taken as 1.01 × 10⁻⁵ cm2 s−1 for EP in 0.1 M PBS (pH 7) and n = 2 as earlier reported (Wang et al., 2006). Noteworthy, the current response recorded at SPSE/Fe3O4 is about 2.6 times higher than that of the bare electrode. This significant increase in Iap at SPSE/Fe3O4 could be because the magnetic Fe3O4 nanoparticles increased the electroactive surface area of SPSE (as evident in the values of A for both electrodes). Such improved current response of screen-printed electrodes in the presence of neurotransmitters after modification with nanomaterials have been reported (Valentini et al., 2014; Jahani and Beitollahi, 2016; Beitollahi et al., 2018; Samie and Arvand, 2019). The increase in ks value of the electrode after modification with Fe3O4 NPs could have also contributed to the drastic increase in EP oxidation peak current at SPSE/Fe3O4 relative to bare SPSE.
Also, the CV of the electrodes in EP showed that a redox process was recorded at the modified electrode while only the oxidation of EP was achieved with the bare electrode (Figure 6B). This confirms that the magnetic nanoparticles on the bare SPSE offered a catalytic effect that supports both the EP’s oxidation and the reduction. The ratio of Iap and the cathodic peak current (Icp) recorded at the modified electrode gave a value of 3.43, which suggest a quasi-reversible redox process (since Icp is 23 μA).
The mechanism of EP redox process involves the two electrons and protons process depicted in Scheme 3. The quasi-reversible process in Figure 6B shows the formation of epinephrine quinone after the loss of two protons and electrons by the EP molecule for the oxidation reaction while the reverse occurs for the reduction process (Scheme 3).

SCHEME 3. Redox reaction of epinephrine.
Effect of Scan Rate
The effect of scan rate on the EP current response at SPSE/Fe3O4 was investigated using cyclic voltammetry at a scan rate range of 25–400 mV s−1 at a pH of 7. There was an increase in Iap and Icp with every increase in scan rate (Figure 7A). In addition, the anodic peak potential (Eap) increases with the increase in scan rate (at lower scan rate) while the Eap slightly changes at higher scan rates (Figure 7C). Instead, the cathodic peak potential (Ecp) was almost constant with an increase in scan rate except for a few changes at lower scan rates. This peak potential and scan rate relationship is entirely different from the steady increase in Eap with an increase in scan rate reported in various studies (Valentini et al., 2014; Beitollahi et al., 2018). A linear relationship represented as Iap = −50.2933 + 16.4391 v1/2 was observed between the square root of the scan rate and the anodic peak current (Iap) (Figure 7B). The fact that this linear fit was obtained, especially at a higher scan rate (>200 mV s−1) suggests that the redox process at the modified electrode is a diffusion-controlled process. A similar mechanism has been reported for EP oxidation at modified electrodes (Wierzbicka and Sulka, 2016).
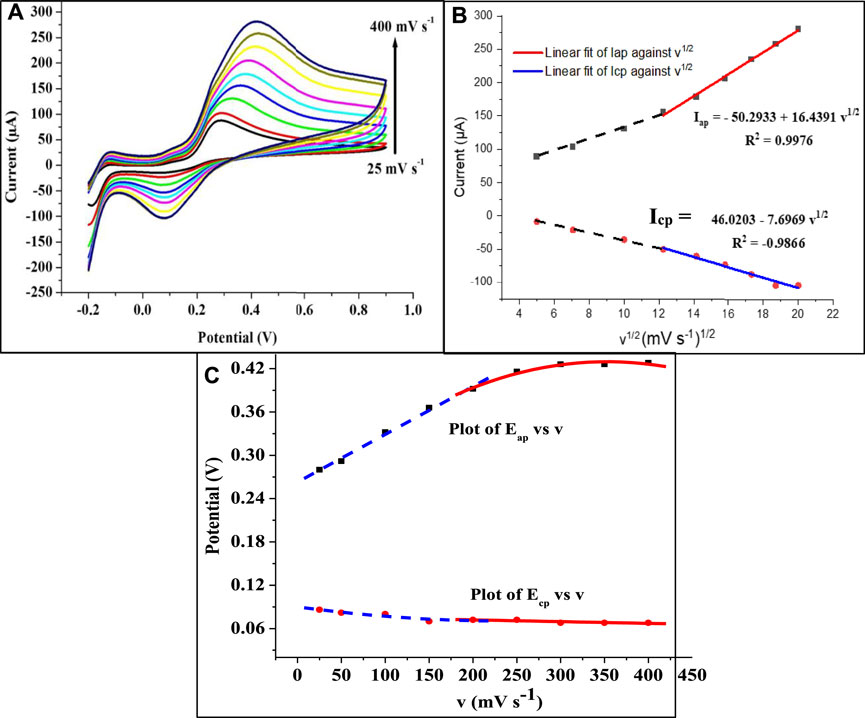
FIGURE 7. (A) Cyclic voltammograms showing the effect of scan rate (v) on EP oxidation at SPSE/Fe3O4 (1 mM EP at scan rate of 25–400 mV s−1, pH 7). (B) Plot of peak current against the square root of v and (C) Plot of potential against v.
Effect of Concentration
The effect of EP concentration on current response recorded at the modified electrode was investigated using SPSE/Fe3O4 for the analysis of EP with the square wave voltammetry (SWV) techniques at a pH of 7 (scan rate of 25 mV s−1). The SWV parameters used for this analysis include a potential step of 10 mV, 10 mV amplitude, and a frequency of 10 Hz. The voltammogram in Figure 8A represent the response of the modified electrode to change in EP concentration. The current response increased with an increase in concentration over a range of 9.99–83.8 μM (Figure 8B). The relationship between (I) and [EP] was linear over a range of 9.99–60.9 μM (Figure 8B). The regression equation representing the linear relationship between current (I) and [EP] using SWV is I = 17.4612 + 0.1376 [EP].
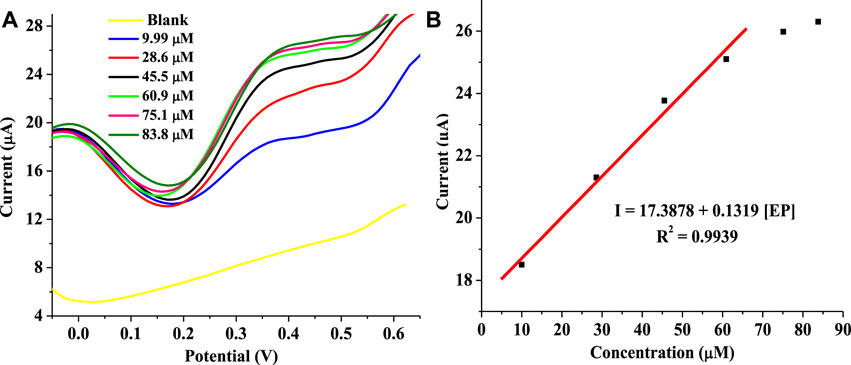
FIGURE 8. (A) Square wave voltammogram of EP redox process with EP concentration changes (9.99–83.8 μM) at 10 mV potential step, 10 mV amplitude, 10 Hz frequency, pH 7, and scan rate of 25 mV s−1. (B) Plot of current against [EP].
The detection limit obtained with the modified electrode is 19.3 μM. This detection limit is comparable to sensors previously fabricated for EP detection (Table 2). Specifically, the detection limit of the sensor is lower than the value reported for a sensor fabricated through the modification of GCE with poly ferulic acid and MWCNTs composite (da Silva et al., 2017). On the other hand, this sensor gave a wider linear range than some sensors earlier fabricated (Mphuthi et al., 2017). Noteworthy, the detection limit of the sensor was calculated using the formula 3.3 ɛ/m where ɛ and m represent the standard deviation of the intercept, and the slope of the regression equation, respectively.
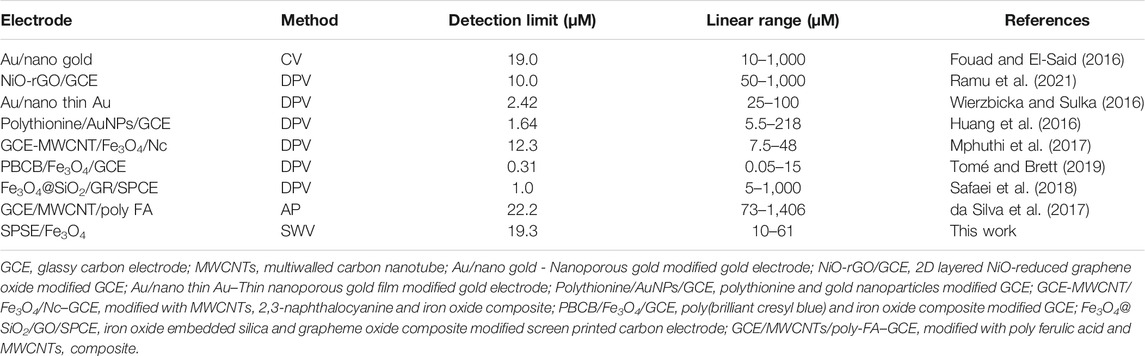
TABLE 2. Figures of merit of previous and present EP electrochemical sensors.
Simultaneous Detection of Epinephrine and Ascorbic Acid
The ability of the fabricated SPSE/Fe3O4 sensor to simultaneously detect epinephrine and ascorbic acid (AA) in a solution containing a mixture of these biomolecules was investigated. Essentially, the presence of AA in extracellular fluids (where EP can equally be found) is several orders of magnitude higher in concentration than EP. As a result, a mixture containing 1 mM AA and 0.4 mM EP at a pH of 7 was subjected to electroanalysis by the fabricated sensor using SWV (potential step of 10 mV, 10 mV amplitude, and a frequency of 10 Hz). The sensor was applied for the electroanalysis of AA to identify its oxidation potential. A peak representing AA was detected at 0.189 V. The analysis of the mixture of AA and EP showed peaks at 0.167 and 0.446 V, respectively (Figure 9). The peak separation between the peak potentials of these analytes (0.279 V) is wider than the value reported for some previously fabricated sensors (Salimi et al., 2004; Ren et al., 2006; Ghanbari and Hajian, 2017). This outcome suggests that the sensor is capable of discriminatory EP detection in the presence of AA.
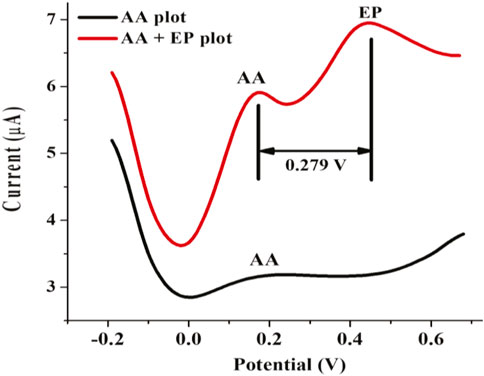
FIGURE 9. Square wave voltammogram of 0.1 mM AA and a mixture of 0.1 mM AA and 0.4 mM EP at SPSE/Fe3O4 (10 mV potential step, 10 mV amplitude, 10 Hz frequency and pH 7).
Real Sample Analysis
The analysis of EP in chicken blood serum, breast muscle, spleen, kidney, and liver from chickens was done using the standard addition method. About 0.4 ml of the real sample was diluted with 15 ml of PBS. The EP in this unspiked sample and real sample solution was analyzed using the fabricated sensor. The data obtained (in triplicates) from the analysis of all real samples was highlighted in Table 3. The percentage recovery obtained (n = 3) for the Serum 1 (OR), Serum 2 (RIWB), ORBM, ORKID, ORLIV, RIWKID, RIWBM, RIWLIV and RIWBBS were 102.13, 100.38, 102.15, 107.10, 101.71, 108.09, 100.48, 106.79 and 98.33%, respectively. The % RSD for each recovery has been itemized in Table 3. Generally, the % RSD obtained from the analysis of the real samples is satisfactorily low. The data obtained from the real sample analysis also revealed that the fabricated sensor could be applied to detect EP in the blood serum and body fluid of an animal. The data from this analysis also confirm that the portable SPSE/Fe3O4 sensor can be used for EP real time point-of-care analysis. In addition, this sensor has the potential of serving as a reliable tool for EP detection in various extracellular fluids without elaborate sample preparation.
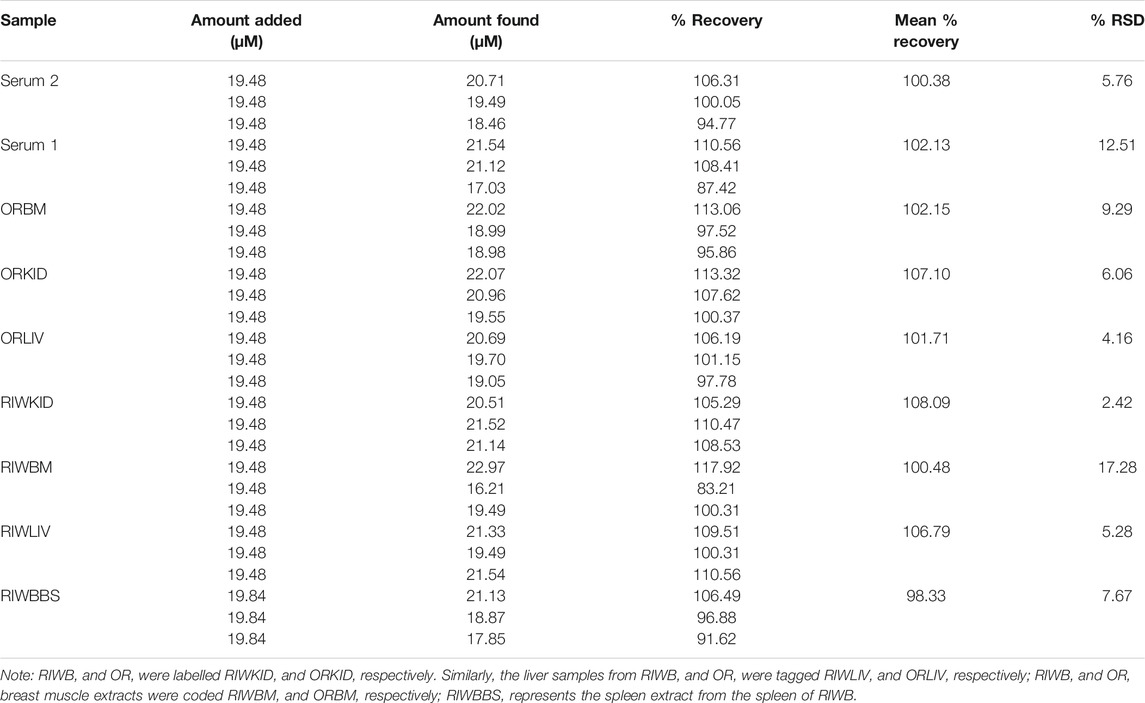
TABLE 3. Real sample analysis data (n = 3).
Stability and Repeatability
The stability of SPSE/Fe3O4 in the presence of EP was investigated using 1 mM EP in PBS (pH 7) at 25 mV s−1. Figure 10 A depicts the current response of the modified electrode recorded after 16 cyclic voltammetry scans. The % RSD of the peak currents recorded for the 16 scans is 22.88%. The analysis of the voltammogram (Figure 10A) also shows that the electrode retained only 47.8% of its initial current after 16 scans. Compared to some other sensors that lost much smaller percentage of their initial current response after higher CV scans (Taleb et al., 2018; Immanuel and Sivasubramanian, 2020), this electrode is considered unstable. The repeatability of the sensor’s output was investigated by independent analysis of EP with the modified electrode (under the same condition deployed for the stability study) in three separate EP solutions (1 mM, pH 7). The electrode shows a high level of repeatability after the second attempt. This evident in the closeness of the current response recorded for the second and third attempt (Figure 10B) as well as the low % RSD recorded (11.9%) for the anodic current obtained after the three attempts.
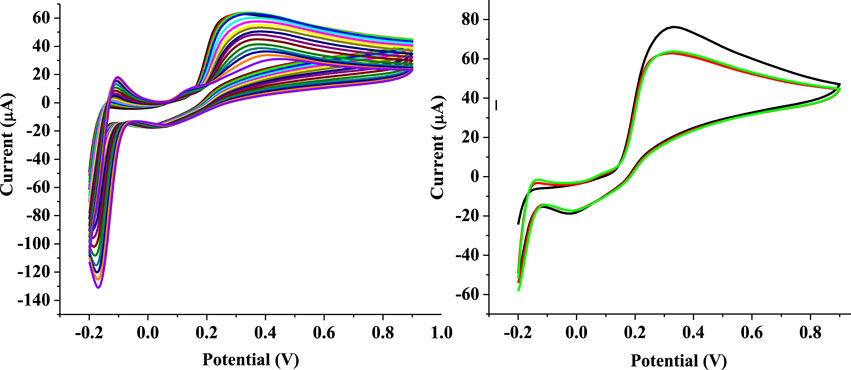
FIGURE 10. (A) Cyclic voltammogram of 1 mM EP at SPSE/Fe3O4 over 16 scans (scan rate 25 mV s−1, pH 7) (B) Cyclic voltammogram of 1 mM EP at SPSE/Fe3O4 at three different attempts.
Conclusion
Facile fabrication of an electrochemical sensor through the modification of SPSE with Fe3O4 NPs (SPSE/Fe3O4) to detect EP in the chicken blood and extracellular fluid extracted from breast muscle, spleen, liver, and kidney of the chickens was conducted. The sensor gave a low detection limit and demonstrated suitability for EP detection in the presence of ascorbic acid. The high EP recovery from the real samples shows that the sensor can be applied for real-time analysis of EP in real-life samples. The wide difference between EP and AA peak potentials strongly indicates that the analysis of the two samples with this sensor can proceed without significant interference of one peak with the other. Therefore, this sensor could be considered for AA detection in future studies.
Data Availability Statement
The original contributions presented in the study are included in the article/Supplementary Material, further inquiries can be directed to the corresponding author.
Ethics Statement
The animal study was reviewed and approved by North-West University.
Author Contributions
OF conceptualized and designed the work and was part of the manuscript write-up. OD, SE, and PF were involved in the data and sample analysis, also in the manuscript preparation. All the authors OF, SE, OD, PF, and MM agreed to the publication.
Funding
This research was funded by National Research Foundation of South Africa for Thuthuka funding for Researchers (UID: 117709). The APC was funded by Higher Degree of North-West University, South Africa.
Conflict of Interest
PF was employed by βeta-Letters AgriNextiomics.
The remaining authors declare that the research was conducted in the absence of any commercial or financial relationships that could be construed as a potential conflict of interest.
Publisher’s Note
All claims expressed in this article are solely those of the authors and do not necessarily represent those of their affiliated organizations, or those of the publisher, the editors and the reviewers. Any product that may be evaluated in this article, or claim that may be made by its manufacturer, is not guaranteed or endorsed by the publisher.
Acknowledgments
OF, SE, OD, and MM thank the North-West University and MaSIM for their financial support and research facilities. OF acknowledges the FRC of North-West University and the National Research Foundation of South Africa Researcher grant.
References
Adekunle, A. S., Agboola, B. O., Pillay, J., and Ozoemena, K. I. (2010). Electrocatalytic Detection of Dopamine at Single-Walled Carbon Nanotubes-Iron (III) Oxide Nanoparticles Platform. Sens. Actuators B: Chem. 148 (1), 93–102. doi:10.1016/j.snb.2010.03.088
Arani, N. H., Ghoreishi, S. M., and Khoobi, A. (2019). Increasing the Electrochemical System Performance Using a Magnetic Nanostructured Sensor for Simultaneous Determination Ofl-Tyrosine and Epinephrine. Anal. Methods 11 (9), 1192–1198. doi:10.1039/c8ay02701c
Archer, G. S. (2019). How Does Red Light Affect Layer Production, Fear, and Stress? Poult. Sci. 98 (1), 3–8. doi:10.3382/ps/pey302
Beitollahi, H., Dourandish, Z., Tajik, S., Ganjali, M. R., Norouzi, P., and Faridbod, F. (2018). Application of Graphite Screen Printed Electrode Modified with Dysprosium Tungstate Nanoparticles in Voltammetric Determination of Epinephrine in the Presence of Acetylcholine. J. Rare Earths 36 (7), 750–757. doi:10.1016/j.jre.2018.01.010
Bertolucci, E., Galletti, A. M. R., Antonetti, C., Marracci, M., Tellini, B., Piccinelli, F., et al. (2015). “Chemical and Magnetic Properties Characterization of Magnetic Nanoparticles,” in 2015 IEEE International Instrumentation and Measurement Technology Conference (I2MTC) Proceedings, Pisa, Italy, May 11–14, 2015, 1492–1496. doi:10.1109/i2mtc.2015.7151498
Blas, J. (2015). “Stress in Birds,” in Sturkie's Avian Physiology (Elsevier), 769–810. doi:10.1016/b978-0-12-407160-5.00033-6
Boswell, B., Rudders, S. A., and Brown, J. C. (2021). Emerging Therapies in Anaphylaxis: Alternatives to Intramuscular Administration of Epinephrine. Curr. Allergy Asthma Rep. 21 (3), 1–9. doi:10.1007/s11882-021-00994-0
Brown, J. C., Simons, E., and Rudders, S. A. (2020). Epinephrine in the Management of Anaphylaxis. J. Allergy Clin. Immunol. Pract. 8 (4), 1186–1195. doi:10.1016/j.jaip.2019.12.015
Cao, Y., Li, C., Li, J., Li, Q., and Yang, J. (2015). Magnetically Separable Fe3O4/AgBr Hybrid Materials: Highly Efficient Photocatalytic Activity and Good Stability. Nanoscale Res. Lett. 10 (1), 952. doi:10.1186/s11671-015-0952-x
da Silva, L. V., Lopes, C. B., da Silva, W. C., de Paiva, Y. G., Silva, F. d. A. d. S., Lima, P. R., et al. (2017). Electropolymerization of Ferulic Acid on Multi-Walled Carbon Nanotubes Modified Glassy Carbon Electrode as a Versatile Platform for NADH, Dopamine and Epinephrine Separate Detection. Microchem. J. 133, 460–467. doi:10.1016/j.microc.2017.04.014
Dehdashti, A., and Babaei, A. (2020). Designing and Characterization of a Novel Sensing Platform Based on Pt Doped NiO/MWCNTs Nanocomposite for Enhanced Electrochemical Determination of Epinephrine and Tramadol Simultaneously. J. Electroanal. Chem. 862, 113949. doi:10.1016/j.jelechem.2020.113949
Ebert, T. J. (2013). “Autonomic Nervous System Pharmacology,” in Pharmacology and Physiology for Anesthesia (Philadelphia: Saunders), 218–234. doi:10.1016/b978-1-4377-1679-5.00013-2
Fallahsharoudi, A., de Kock, N., Johnsson, M., Bektic, L., Ubhayasekera, S. J. K. A., Bergquist, J., et al. (2017). QTL Mapping of Stress Related Gene Expression in a Cross between Domesticated Chickens and Ancestral Red Junglefowl. Mol. Cell. Endocrinol. 446, 52–58. doi:10.1016/j.mce.2017.02.010
Fang, W.-L., Xia, L.-J., Huang, X., Guo, X.-F., Ding, J., Wang, H., et al. (2018). Highly Sensitive Determination for Catecholamines Using Boronate Affinity Polymer Monolith Microextraction with In-Situ Derivatization and HPLC Fluorescence Detection. Chromatographia 81 (10), 1381–1389. doi:10.1007/s10337-018-3592-3
Fouad, D. M., and El-Said, W. A. (2016). Selective Electrochemical Detection of Epinephrine Using Gold Nanoporous Film. J. Nanomater. 2016, 1–8. doi:10.1155/2016/6194230
Gangadharan, S., Nawathe, P., and Schleien, C. L. (2019). “Cardiopulmonary Resuscitation,” in A Practice of Anesthesia for Infants and Children (Elsevier), 908–920. e904. doi:10.1016/b978-0-323-42974-0.00040-9
Ghanbari, K., and Hajian, A. (2017). Electrochemical Characterization of Au/ZnO/PPy/RGO Nanocomposite and its Application for Simultaneous Determination of Ascorbic Acid, Epinephrine, and Uric Acid. J. Electroanal. Chem. 801, 466–479. doi:10.1016/j.jelechem.2017.07.024
Gorospe, A., Buenviaje, S., Edañol, Y., Cervera, R., and Payawan, L. (2019). “One-Step Co-precipitation Synthesis of Water-Stable Poly (Ethylene Glycol)-Coated Magnetite Nanoparticles,” in Journal of Physics: Conference Series (Temple Circus Temple Way, Bristol: IOP Publishing), 012059.
Herman, J. P., McKlveen, J. M., Ghosal, S., Kopp, B., Wulsin, A., Makinson, R., et al. (2016). Regulation of the Hypothalamic‐Pituitary‐Adrenocortical Stress Response. Compr. Physiol. 6 (2), 603–621. doi:10.1002/cphy.c150015
Hu, F., Lin, H., Zhang, Z., Liao, F., Shao, M., Lifshitz, Y., et al. (2014). Smart Liquid SERS Substrates Based on Fe3O4/Au Nanoparticles with Reversibly Tunable Enhancement Factor for Practical Quantitative Detection. Sci. Rep. 4, 7204. doi:10.1038/srep07204
Huang, J., Xu, W., Gong, Y., Weng, S., and Lin, X. (2016). Selective and Reliable Electrochemical Sensor Based on polythionine/AuNPs Composites for Epinephrine Detection in Serum. Int. J. Electrochem. Sci. 11, 8193–8203. doi:10.20964/2016.10.56
Immanuel, S., and Sivasubramanian, R. (2020). Fabrication of Two-Dimensional Chemically Reduced Graphene Oxide Nanosheets for the Electrochemical Determination of Epinephrine. Bull. Mater. Sci. 43 (1), 1–11. doi:10.1007/s12034-019-2034-7
Jahani, S., and Beitollahi, H. (2016). Selective Detection of Dopamine in the Presence of Uric Acid Using NiO Nanoparticles Decorated on Graphene Nanosheets Modified Screen-Printed Electrodes. Electroanalysis 28 (9), 2022–2028. doi:10.1002/elan.201501136
Kahlouche, K., Jijie, R., Hosu, I., Barras, A., Gharbi, T., Yahiaoui, R., et al. (2018). Controlled Modification of Electrochemical Microsystems with Polyethylenimine/reduced Graphene Oxide Using Electrophoretic Deposition: Sensing of Dopamine Levels in Meat Samples. Talanta 178, 432–440. doi:10.1016/j.talanta.2017.09.065
Larkina, T. A., Barkova, O. Y., Peglivanyan, G. K., Mitrofanova, O. V., Dementieva, N. V., Stanishevskaya, O. I., et al. (2021). Evolutionary Subdivision of Domestic Chickens: Implications for Local Breeds as Assessed by Phenotype and Genotype in Comparison to Commercial and Fancy Breeds. Agriculture 11 (10), 914. doi:10.3390/agriculture11100914
Loh, K.-S., Lee, Y., Musa, A., Salmah, A., and Zamri, I. (2008). Use of Fe3O4 Nanoparticles for Enhancement of Biosensor Response to the Herbicide 2,4-Dichlorophenoxyacetic Acid. Sensors 8 (9), 5775–5791. doi:10.3390/s8095775
Moawad, U. K., and Randa, M. H. (2017). Histocytological and Histochemical Features of the Adrenal Gland of Adult Egyptian Native Breeds of Chicken (Gallus Gallus domesticus). Beni-Suef Univ. J. Basic Appl. Sci. 6 (2), 199–208. doi:10.1016/j.bjbas.2017.04.001
Mohamed, R., Abou-Elnaga, A., Ghazy, E., Mohammed, H., Shukry, M., Farrag, F., et al. (2020). Effect of Different Monochromatic LED Light Colour and Intensity on Growth Performance, Physiological Response and Fear Reactions in Broiler Chicken. Ital. J. Anim. Sci. 19 (1), 1099–1107. doi:10.1080/1828051X.2020.1821802
Mphuthi, N. G., Adekunle, A. S., Fayemi, O. E., Olasunkanmi, L. O., and Ebenso, E. E. (2017). Phthalocyanine Doped Metal Oxide Nanoparticles on Multiwalled Carbon Nanotubes Platform for the Detection of Dopamine. Sci. Rep. 7 (1), 43181. doi:10.1038/srep43181
Nangsuay, A., Ruangpanit, Y., Meijerhof, R., and Attamangkune, S. (2011). Yolk Absorption and Embryo Development of Small and Large Eggs Originating from Young and Old Breeder Hens. Poult. Sci. 90 (11), 2648–2655. doi:10.3382/ps.2011-01415
Nestler, E. J., Hyman, S. E., Holtzman, D. M., and Malenka, R. C. (2015). “Widely Projecting Systems: Monoamines, Acetylcholine, and Orexin,” in Molecular Neuropharmacology: A Foundation for Clinical Neuroscience. 3e. (New York, NY: McGraw-Hill Education).
Ottinger, M. A., and Abdelnabii, M. A. (1997). Neuroendocrine Systems and Avian Sexual Differentiation. Am. Zool 37 (6), 514–523. doi:10.1093/icb/37.6.514
Papich, M. G. (2021). “Epinephrine,” in Papich Handbook of Veterinary Drugs. Editor M. G. Papich. Fifth Edition (St. Louis (MO): W.B. Saunders), 329–331. doi:10.1016/b978-0-323-70957-6.00194-1
Peet, A. (2012). Marks' Basic Medical Biochemistry. Philadelphia, PA: Lippincott Williams & Wilkins.
Pham, X. N., Nguyen, T. P., Pham, T. N., Tran, T. T. N., and Tran, T. V. T. (2016). Synthesis and Characterization of Chitosan-Coated Magnetite Nanoparticles and Their Application in Curcumin Drug Delivery. Adv. Nat. Sci. Nanosci. Nanotechnol. 7 (4), 045010. doi:10.1088/2043-6262/7/4/045010
Pîslaru-Dănescu, L., Telipan, G., Stoian, F. D., Holotescu, S., Marinică, O. M., and Kandelousi, M. (2017). Nanofluid with Colloidal Magnetic Fe3O4 Nanoparticles and its Applications in Electrical Engineering. Nanofluid Heat Mass. Transfer Eng. Probl., 163–197. doi:10.5772/65556
Ramu, A. G., Umar, A., Ibrahim, A. A., Algadi, H., Ibrahim, Y. S. A., Wang, Y., et al. (2021). Synthesis of Porous 2D Layered Nickel Oxide-Reduced Graphene Oxide (NiO-rGO) Hybrid Composite for the Efficient Electrochemical Detection of Epinephrine in Biological Fluid. Environ. Res. 200, 111366. doi:10.1016/j.envres.2021.111366
Ren, W., Luo, H. Q., and Li, N. B. (2006). Simultaneous Voltammetric Measurement of Ascorbic Acid, Epinephrine and Uric Acid at a Glassy Carbon Electrode Modified with Caffeic Acid. Biosens. Bioelectron. 21 (7), 1086–1092. doi:10.1016/j.bios.2005.04.002
Safaei, M., Beitollahi, H., and Shishehbore, M. R. (2018). Simultaneous Determination of Epinephrine and Folic Acid Using the Fe3O4@SiO2/GR Nanocomposite Modified Graphite. Russ. J. Electrochem. 54 (11), 851–859. doi:10.1134/s1023193518130402
Salimi, A., Banks, C. E., and Compton, R. G. (2004). Abrasive Immobilization of Carbon Nanotubes on a Basal Plane Pyrolytic Graphite Electrode: Application to the Detection of Epinephrine. Analyst 129 (3), 225–228. doi:10.1039/b315877b
Asadi Samie, H., and Arvand, M. (2019). RuO2 Nanowires on Electrospun CeO2-Au Nanofibers/functionalized Carbon Nanotubes/graphite Oxide Nanocomposite Modified Screen-Printed Carbon Electrode for Simultaneous Determination of Serotonin, Dopamine and Ascorbic Acid. J. Alloys Compd. 782, 824–836. doi:10.1016/j.jallcom.2018.12.253
Shagholani, H., Ghoreishi, S. M., and Mousazadeh, M. (2015). Improvement of Interaction between PVA and Chitosan via Magnetite Nanoparticles for Drug Delivery Application. Int. J. Biol. Macromol. 78, 130–136. doi:10.1016/j.ijbiomac.2015.02.042
Taka, Z. I., Mohd Kamarulzaki, M., Khairunnadim, A. S., and Saliza, A. (2019). Ultrasonic Assisted Preparation and Characterization of Conductive Polyaniline-Modified Magnetite Nanocomposites (PAni/Fe3O4 Nanocomposites). Perlis, Malaysia: Universiti Malaysia.
Taleb, M., Ivanov, R., Bereznev, S., Kazemi, S. H., and Hussainova, I. (2018). Alumina/graphene/Cu Hybrids as Highly Selective Sensor for Simultaneous Determination of Epinephrine, Acetaminophen and Tryptophan in Human Urine. J. Electroanal. Chem. 823, 184–192. doi:10.1016/j.jelechem.2018.06.013
Tezerjani, M. D., Benvidi, A., Dehghani Firouzabadi, A., Mazloum-Ardakani, M., and Akbari, A. (2017). Epinephrine Electrochemical Sensor Based on a Carbon Paste Electrode Modified with Hydroquinone Derivative and Graphene Oxide Nano-Sheets: Simultaneous Determination of Epinephrine, Acetaminophen and Dopamine. Measurement 101, 183–189. doi:10.1016/j.measurement.2017.01.029
Thamilselvan, A., Manivel, P., Rajagopal, V., Nesakumar, N., and Suryanarayanan, V. (2019). Improved Electrocatalytic Activity of Au@Fe3O4 Magnetic Nanoparticles for Sensitive Dopamine Detection. Colloids Surf. B: Biointerfaces 180, 1–8. doi:10.1016/j.colsurfb.2019.04.034
Tomé, L. I., and Brett, C. M. (2019). Polymer/iron Oxide Nanoparticle Modified Glassy Carbon Electrodes for the Enhanced Detection of Epinephrine. Electroanalysis 31 (4), 704–710. doi:10.1002/elan.201800816
Valentini, F., Ciambella, E., Conte, V., Sabatini, L., Ditaranto, N., Cataldo, F., et al. (2014). Highly Selective Detection of Epinephrine at Oxidized Single-wall Carbon Nanohorns Modified Screen Printed Electrodes (SPEs). Biosens. Bioelectron. 59, 94–98. doi:10.1016/j.bios.2014.02.065
Vedalakshmi, R., Saraswathy, V., Song, H.-W., and Palaniswamy, N. (2009). Determination of Diffusion Coefficient of Chloride in concrete Using Warburg Diffusion Coefficient. Corrosion Sci. 51 (6), 1299–1307. doi:10.1016/j.corsci.2009.03.017
Wang, L., Bai, J., Huang, P., Wang, H., Zhang, L., and Zhao, Y. (2006). Electrochemical Behavior and Determination of Epinephrine at a Penicillamine Self-Assembled Gold Electrode. Int. J. Electrochem. Sci. 1, 238–249.
Wierzbicka, E., and Sulka, G. D. (2016). Fabrication of Highly Ordered Nanoporous Thin Au Films and Their Application for Electrochemical Determination of Epinephrine. Sens. Actuators B: Chem. 222, 270–279. doi:10.1016/j.snb.2015.08.066
Yadav, T., Sahu, R. K., and Mukherjee, V. (2019). Molecular Modeling and Spectroscopic Investigation of a Neurotransmitter: Epinephrine. J. Mol. Struct. 1176, 94–109. doi:10.1016/j.molstruc.2018.08.077
Zangeneh Kamali, K., Alagarsamy, P., Huang, N. M., Ong, B. H., and Lim, H. N. (2014). Hematite Nanoparticles-Modified Electrode Based Electrochemical Sensing Platform for Dopamine. Sci. World J. 2014, 1–13. doi:10.1155/2014/396135
Zavareh, S., Behrouzi, Z., and Avanes, A. (2017). Cu (II) Binded chitosan/Fe3O4 Nanocomomposite as a New Biosorbent for Efficient and Selective Removal of Phosphate. Int. J. Biol. Macromol. 101, 40–50. doi:10.1016/j.ijbiomac.2017.03.074
Keywords: epinephrine, chicken, Fe3O4, screen-print electrode, square wave voltammetry
Citation: Fayemi OE, Elugoke SE, Dina O, Mwanza M and Fayemi PO (2022) Harnessing Fe3O4 Screen-Printed Modified Electrode Sensor for Detecting Epinephrine in Buff Orpington Rooster and Rhodes Island White Broiler. Front. Sens. 3:850316. doi: 10.3389/fsens.2022.850316
Received: 07 January 2022; Accepted: 21 February 2022;
Published: 28 March 2022.
Edited by:
Nonhlangabezo Mabuba, University of Johannesburg, South AfricaReviewed by:
Orawon Chailapakul, Chulalongkorn University, ThailandRajasekhar Chokkareddy, Durban University of Technology, South Africa
Copyright © 2022 Fayemi, Elugoke, Dina, Mwanza and Fayemi. This is an open-access article distributed under the terms of the Creative Commons Attribution License (CC BY). The use, distribution or reproduction in other forums is permitted, provided the original author(s) and the copyright owner(s) are credited and that the original publication in this journal is cited, in accordance with accepted academic practice. No use, distribution or reproduction is permitted which does not comply with these terms.
*Correspondence: Omolola E. Fayemi, T21vbG9sYS5GYXllbWlAbnd1LmFjLnph