
95% of researchers rate our articles as excellent or good
Learn more about the work of our research integrity team to safeguard the quality of each article we publish.
Find out more
ORIGINAL RESEARCH article
Front. Sens. , 02 November 2022
Sec. Biosensors
Volume 3 - 2022 | https://doi.org/10.3389/fsens.2022.1015223
 Likun Zhang1,2†
 Zhengyang Lei1,2†Chufan Xiao1,2†Zhicheng Du1,2
 Chenyao Jiang1,2Xi Yuan1,2Qiuyue Hu1,2Shiyao Zhai1,2Lulu Xu1,2Changyue Liu1,2Xiaoyun Zhong1,2Haifei Guan1,2
 Muhammad Hassan1,2
 Ijaz Gul1,2Vijay Pandey1,2Xinhui Xing1,2Can Yang Zhang1,2*
 Qian He1,2*
 Peiwu Qin1,2*
Integrating artificial intelligence with SARS-CoV-2 diagnostics can help in the timely execution of pandemic control and monitoring plans. To improve the efficiency of the diagnostic process, this study aims to classify fluorescent images via traditional machine learning and deep learning-based transfer learning. A previous study reported a CRISPR-Cas13a system combined with total internal reflection fluorescence microscopy (TIRFM) to detect the existence and concentrations of SARS-CoV-2 by fluorescent images. However, the lack of professional software and excessive manual labor hinder the practicability of the system. Here, we construct a fluorescent image dataset and develop an AI-boosted CRISPR-Cas13a and total internal reflection fluorescence microscopy system for the rapid diagnosis of SARS-CoV-2. Our study proposes Fluorescent Images Classification Transfer learning based on DenseNet-121 (FICTransDense), an approach that uses TIRF images (before and after sample introduction, respectively) for preprocessing, including outlier exclusion and setting and division preprocessing (i.e., SDP). Classification results indicate that the FICTransDense and Decision Tree algorithms outperform other approaches on the SDP dataset. Most of the algorithms benefit from the proposed SDP technique in terms of Accuracy, Recall, F1 Score, and Precision. The use of AI-boosted CRISPR-Cas13a and TIRFM systems facilitates rapid monitoring and diagnosis of SARS-CoV-2.
1) Rapid and reliable detection of AI-Boosted SARS-CoV-2 via CRISPR-Cas13a and fluorescence imaging-based total internal reflection fluorescence microscopy (TIRFM).
2) We propose an effective SDP technique that merges two fluorescent images into one image, which enhances the virus concentration classification accuracy.
3) We propose the FICTransDense model with high prediction accuracy for virus concentration estimation.
SARS-CoV-2 is a positive-sense single-stranded RNA (ssRNA) virus that causes severe and life-threatening respiratory disorders as well as lung injuries (V’kovski et al., 2021). Rapid and accurate detection of SARS-CoV-2 plays an important role in pandemic surveillance (Alexandersen et al., 2020). CRISPR-based diagnostics have been reported to have great potential for accurate and timely detection of various types of viruses, including Zika virus, human immunodeficiency virus, hepatitis C virus, Frog virus 3, and Ebola virus (Asboe et al., 2012; Pardee et al., 2016; Qin et al., 2019; Kham-Kjing et al., 2022; Lei et al., 2022). The CRISPR/Cas system is an innate bacterial adaptive immune system capable of degrading foreign nucleic acids that enter the host cell (Horvath and Barrangou 2010; Terns and Terns 2011). The Cas13a-crRNA complex binds the target RNA and induces a conformational change to activate nonspecific RNA degradation, up to ∼104 turnovers for LbuCas13a, releasing cleaved RNA with fluorophores (RNA reporters) for RNA detection (East-Seletsky et al., 2016; Shan et al., 2019; Díaz-Galicia et al., 2022). Fluorescent signals can be acquired in a fluorometer or microscope where fluorescent probes are immobilized on a surface for image acquisition and accurate quantitation (Kaminski et al., 2021). We previously combined the CRISPR (clustered regularly interspaced short palindromic repeats)-Cas (CRISPR-associate) system with total internal reflection fluorescence microscopy (TIRFM), which holds great promise for amplification-free SARS-CoV-2 RNA detection (He et al., 2021). Manual quantification of the difference in fluorescence intensity between two fluorescent images before and after collateral cleavage of the CRISPR system reached a detection limit of 100 aM (60.2 copies/μL) (He et al., 2021). However, detecting the existence and concentration of viruses by manually processing the fluorescent images is very time-consuming.
Efforts have been made to detect SARS-CoV-2 using histological features employed by artificial intelligence (AI). Traditional machine learning models such as logistic regression, multilayer perception (Roberts et al., 2021), Support Vector Machine (SVM) (Rendon-Gonzalez and Ponomaryov 2016), K-Nearest Neighbors (KNN) (Nugroho et al., 2021), Decision Tree (DT) (Das et al., 2019), and Deep Neural Networks such as AlexNet, VGGNet16, ResNet50, DenseNet (Hasan et al., 2021), and SqueezeNet are prevalently used for analysis of chest computed tomography images with high accuracy (0.76–0.98 for traditional machine learning models and 0.88–0.99 for deep learning models) on public datasets (Bao et al., 2020; Islam et al., 2021). The involvement of AI facilitates the diagnosis of diseases by reducing the time and effort of manual (radiologist) examinations. Furthermore, deep learning models can effectively aid in the diagnosis of diseases, including stroke (Xie et al., 2021), leukemia (Zhang et al., 2022), etc.
Aside from detecting viral infections via histology, AI has made significant contributions to fluorescent image analysis. Gou et al. (Gou et al., 2019) developed an image processing method that uses a two-step strategy for each fluorescent image to exclude auto-fluorescence or dust. Ioannidis et al. (Ioannidis et al., 2021) reported a normalized preprocessing protocol for processing heterogeneous fluorescence images in terms of image magnification. Zhang et al. (Zhang and Zhao 2019) applied preprocessing methods such as size adjustment and data expansion to each fluorescence dataset and then used CapsNet to classify the subcellular localization of proteins with an accuracy of 93.08%. (Korfhage et al., 2020). developed a deep learning approach for cell detection and segmentation, which accepts two fluorescent images (a nucleus image and a cytoplasm image) as input. The nucleus channel is used to improve the quality of cell detection and segmentation. (Shiaelis et al., 2020). demonstrated that single-particle fluorescence microscopy combined with deep learning can rapidly detect and classify different concentrations of viruses with a limit of detection of 6 × 10⁴ plaque-forming units/mL. Although current preprocessing methods and models have achieved excellent performance on both medical and fluorescent images, no preprocessing techniques that deal with two TIRF images and simultaneously detect virus concentration by AI algorithms have been reported. Besides, the large datasets in our study are not available. Transfer learning is beneficial to circumvent the need for large amounts of labelled data due to the abundance of knowledge gained in the pre-training phase from huge datasets (Han et al., 2021) [e.g., ImageNet (Deng et al., 2009)]. Specifically, the parameters of well-trained Convolutional Neural Network (CNN) models on non-medical ImageNet data [e.g., AlexNet (Krizhevsky et al., 2017), VGGNet and ResNet (Krizhevsky et al., 2017; Simonyan and Zisserman 2014; He et al., 2016)] can be transferred to solve a fluorescent image classification task.
The goal of this study is to create an effective preprocessing technique for merging two fluorescent images into one image and then identifying the presence and concentration of SARS-CoV-2 RNA fragments by fluorescent images. To deal with the intensity or number of puncta changes in the fluorescent images caused by pathogenic sample loading, we propose an effective preprocessing technique (SDP). Therefore, based on the SDP-processed dataset, we provide pre-trained DenseNet-121 as Fluorescent Images Classification Transfer learning based on DenseNet-121 (FICTransDense) to achieve a fast, accurate, and reliable AI-Boosted CRISPR-Cas13a and TIRFM system for SARS-CoV-2 detection.
A schematic diagram of the CRISPR-Cas13a and TIRFM AI System for SARS-CoV-2 detection is depicted in Figure 1. LwaCas13a protein is purified in accordance with previous protocols. 150 µL of 20 nM LwaCas13a, 16.7 nM crRNA, 2 units of murine RNase inhibitor (New England Biolabs), reaction buffer (40 mM Tris-HCl, 60 mM NaCl, 6 mM MgCl2, pH 7.3), and 120 nM RNA reporters are mixed with 100 pM (6.02×10⁷ copies/μL), 1 nM (6.02×10⁸ copies/μL) target RNA, or 1 nM negative RNA. Reactions proceed at room temperature for 5–20 min (He et al., 2021). The sequences of crRNA, target RNA, negative control RNA, and RNA reporter are listed in Supplementary Tables S1–S4. TIRFM is calibrated with fluorescent microspheres to check the illumination pattern. The slides and coverslips are treated in a similar manner for different batches and imaging conditions, such as laser intensity and exposure time. TIRF image datasets are obtained on the same day for samples with 100 pM, 1 nM RNA of SARS-CoV-2 as the positive group, and 1 nM RNA of Middle East Respiratory Syndrome (MERS) virus as the negative control. The effectiveness of the dataset is validated by performing qPCR to determine target concentrations and showing the correlation between qPCR and CRISPR measurements (data not shown) (He et al., 2021). qPCR is the gold standard for RNA detection, which cross-validates the detected concentration derived from fluorescent images before and after CRISPR reactions. For each concentration, we create three channels and assayed them in triplicate on one slide, imaging each sample about 50 times before (namely BeIn) and after (namely AfIn) sample introduction, respectively. For the same channel, we sort the images in ascending order based on the fluorescence intensity of the BeIn and AfIn slides, respectively. A total of 455 pairs of images are collected, including 156 pairs of negatives, 151 pairs of 100 pM SARS-CoV-2, and 148 pairs of 1 nM SARS-CoV-2. The image dimensions can be represented in a matrix shape of 2044 × 2048 × 3, representing height, width, and color channels, respectively.
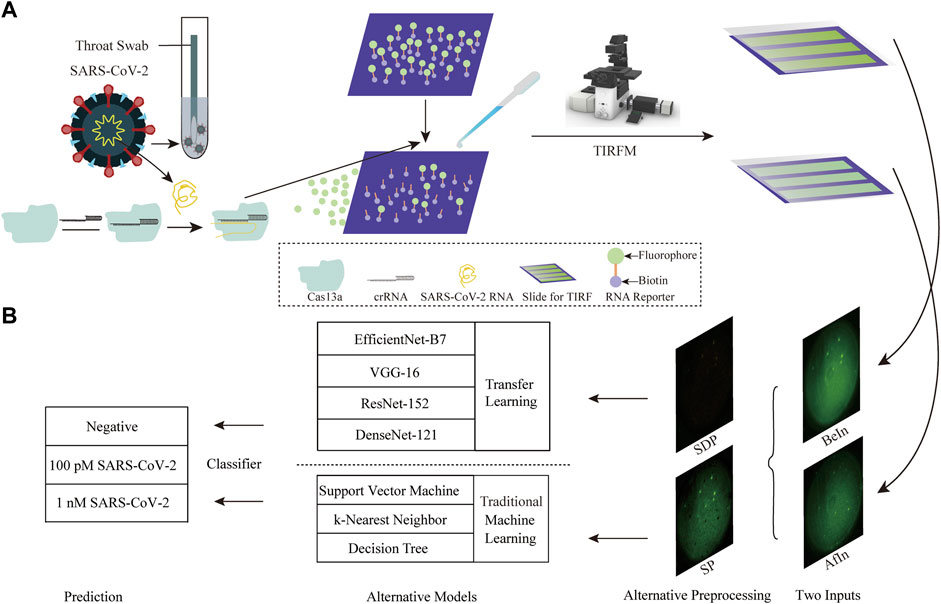
Figure 1. Schematic diagram of the CRISPR-Cas13a and TIRFM AI Systems for SARS-CoV-2 detection. (A) Illustration of the CRISPR-Cas13a and TIRFM systems. CRISPR-Cas13a utilizes bound crRNA to specifically target viral RNA by base pairing. Biotin-coupled RNA reporters are then immobilized on the slide surface and collaterally cleaved after sample introduction. Fluorescent images were captured before and after sample introduction. (B) Changes in fluorescence signal intensity are indicated by preprocessing operations such as SP and SDP. Traditional machine learning and transfer learning based on deep learning models are then initiated to confirm the feasibility and accuracy of FICTransDense.
Data quality affects algorithm performance. The imbalance and bias in the data distribution could weaken the capability of algorithms (Roccetti et al., 2019; Roccetti et al., 2021; Strickland 2022). Effective image preprocessing methods should be developed to improve image quality and ensure the reliability of the dataset. The preprocessing procedures consist of three steps: exclusion of outliers, fluorescent images merging, and data augmentation. As the concentration of SARS-CoV-2 increases, the fluorescence signal on the slide gradually decreases after sample introduction due to collateral cleavage of fluorescent probes immobilized on the slide surface (Wang et al., 2022). The change in fluorescence intensity between BeIn and AfIn is stronger for virus identification. However, during wet experiments, some fluorescent molecules do not bind to biotin, forming complexes that still float above the surface of the slide in BeIn, while part of them can be washed out in AfIn. Consequently, the fluorescence intensity difference will be higher than the actual value. On the other hand, any impurities and substances with autofluorescence (Duong and Han 2013) will induce fluorescence in AfIn, accompanied by reduced fluorescence intensity differences. Therefore, the exclusion of outliers is necessary for the models to achieve better classification performance. For each experiment, the average pixel intensity of the images before or after sample introduction is calculated. The threshold range can then be calculated using Eq. 1, which is determined by the median and standard deviation (SD) of the fluorescence intensity within an image list. The images in a list whose fluorescent intensities are outside the threshold range are considered outliers and are excluded.
Eventually, 154 image pairs of negative control, 111 image pairs of 100 pM SARS-CoV-2, and 100 image pairs of 1 nM SARS-CoV-2 are retained.
The difference between BeIn and AfIn is highlighted and visualized by the merging of fluorescent images via the following three preprocessing methods:
1) Subtraction Preprocessing (SP) refers to the subtraction operation of the pixel values of the two corresponding fluorescent images between BeIn and AfIn using the cv2 toolkit.
2) Division Preprocessing (DP) refers to dividing each pixel value of BeIn by the pixel value of AfIn between a pair of images using the cv2 toolkit.
3) Setting and Division Preprocessing (SDP) is proposed to improve the DP method. If there is a pixel value of zero in AfIn, the result of division is equal to 0 using the cv2 toolkit. To retrieve the difference value, we set the pixel value to one in AfIn if the original value is 0 and then continue to perform the DP operation between image pairs.
Finally, image augmentation techniques such as random rotation, horizontal flipping, and vertical flipping are used to avoid model overfitting. These geometric transformations are intended to make the algorithms invariant to changes in position and orientation (Taylor and Nitschke 2018). The end-to-end classification process consists of random dataset splitting (80% for training and 20% for test), feature extraction, traditional machine learning, and transfer learning initiated by a deep learning-based model.
Prior to classification, we process the input images via feature extraction. To relieve the computational burden, images are resized to 256 × 256 × 3. In image processing, histograms are used to depict frequency distributions of these intensity values. The histogram is a graphical representation of the data where pixel values are grouped into continuous bins, with each range corresponding to the distribution frequency (Prasetio et al., 2018). The histogram contains image features in the blue, green, and red channels of negative control, 100 pM or 1 nM SARS-CoV-2 samples generated by the cv2 toolkit. Different approaches including SVM, KNN, and DT models are initialized to process the histogram features and generate classification results.
For transfer learning, we combine both feature extracting and fine-tuning methods, followed by a classification of negative control, 100 pM or 1 nM SARS-CoV-2. Prior to the dataset feeding, the images are resized to 224 × 224 × 3. The whole training process consists of two procedures (Figure 2). In the first training stage, feature extraction layers are fixed, while the parameters of classifier layers are updated. Then, based on the first training results, all parameters of the feature extraction layer and the classifier layer are updated in the fine-tunning stage (i.e., second training stage). VGG-16, ResNet-152, DenseNet-121, and EfficientNet-B7 are chosen for our transfer learning task.
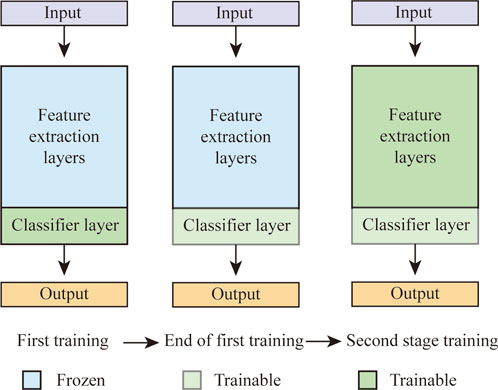
Figure 2. Transfer learning training strategies, where the last layer has been modified for three types of classification tasks. The first training process freezes the feature extraction layers and updates only the classification layer. The accompanying second training process updates all parameters in the CNN layers.
During the training and backpropagation processes, an optimization strategy is utilized to rapidly minimize the loss. Gradient descent is used to update the learnable parameters of networks while minimizing the loss. Gradient descent provided that the cost function has the maximum growth rate and the direction in which each learnable parameter is updated (Ruder 2016). While Adam optimizer is an efficient method that computes individual adaptive learning rates for different parameters based on estimates of the first-order moments and second-order moments of the gradient (Kingma and Ba 2014). The initial learning rate is set to 0.01 and drops by 10% every seven epochs. For both the first and second training, the training epoch is set to 20.
To provide an elaborate evaluation of the seven models involved in our study, various evaluation metrics including Accuracy, Precision, Recall, F1 Score (GC et al., 2021), Inference Time, and Confusion Matrix (Sultan et al., 2019)are employed to evaluate the underlying models. Considering the slight imbalance between the numbers of each class, we calculate the weighted average value of each metric.
The F1 Score is used to quantify the ability of a classifier with respect to accuracy, and is defined as in Eq. 2:
Precision is intuitively the ability of the classifier not to label positive samples as negative, and is defined as in Eq. 3:
Recall is intuitively the ability of the classifier to find all positive samples for each class, and is defined as in Eq. 4:
Accuracy metrics determine whether an image of an SP or SDP belongs to a sample with negative, 100 pM or 1 nM SARS-CoV-2 nucleic acid, as defined by Eq. 5:
Where TP is the number of predicted positive cases that are indeed positive, FP is the number of predicted positive cases that are indeed negative, FN is the number of predicted negative cases that are indeed positive, and TN is the number of predicted negative cases that are indeed negative (Mehrotra et al., 2020).
Inference Time is an instant indicator showing the time cost of using a pre-trained model to output a test prediction result. Confusion Matrix is a visual tool for supervised learning, which reflects the prediction results compared to the ground truth on test datasets and demonstrates the ability of the classifier to perform multi-classification (Sultan et al., 2019).
Gradient-weighted Class Activation Mapping (Grad-CAM) (Selvaraju et al., 2017) uses the gradients of the label flowing into the final convolutional layer to produce a coarse localization map, which highlights important regions that contribute to the output. Grad-CAM is one of the effective techniques for producing visual explanations of classifications from CNN models, and we use Grad-CAM to generate visualizations of explainable regions of the results output by deep learning-based transfer learning.
In this study, we implement seven models to achieve classification of fluorescent images obtained from samples of negative control, 100 pM, and 1 nM SARS-CoV-2 RNA fragments. All models demonstrate acceptable performance (80.25%–100.00% of F1 Score) on both SP and SDP test datasets (Table 1). The DT and Densenet-121 models achieve excellent performance with 100% Accuracy, Precision, Recall, and F1 Score on the test dataset. Besides, DT spends a minimum time of 0.10 ms to infer the prediction, while FICTransDense spends 36.07 ms on an SDP image. Except for VGG-16, all algorithms show great performance on all evaluation metrics for the given SDP test dataset compared to the SP test dataset. Furthermore, considering the decent performance of transfer learning based on DenseNet-121 shown on the SDP dataset, we propose the pre-trained DenseNet-121 as FICTransDense.
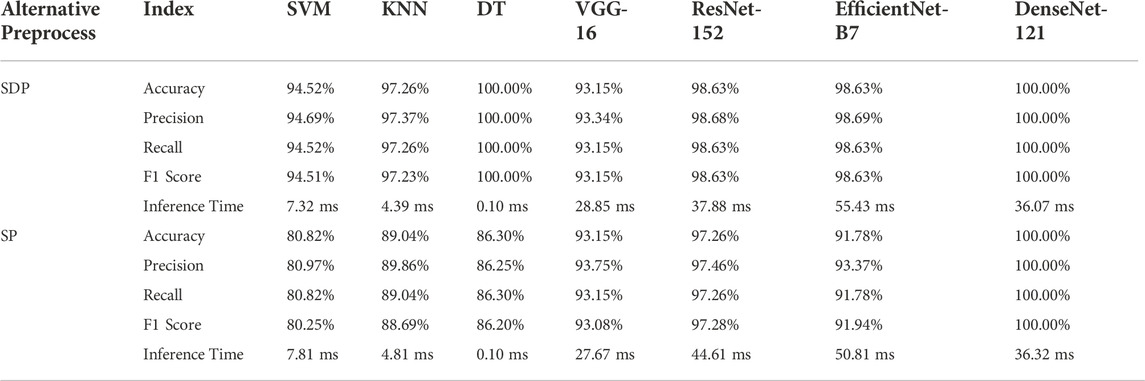
Table 1. Comparative results of the underlying models.
To compare the performance of DenseNet-121 with other algorithms, we use a Confusion Matrix to summarize the classification performance. In the test dataset, there are 26 images for the negative control, 25 images for the 100 pM, and 22 images for the 1 nM SARS-CoV-2 RNA fragments. The results of the confusion matrix for Densenet-121 on the SDP and SP test datasets and the DT on the SDP test dataset are consistent with the results in Table 1 (Figure 3).
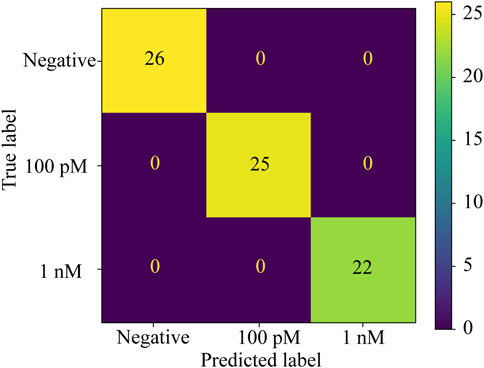
Figure 3. Confusion matrix of DT on the SDP test dataset, Dense Net-121 on the SDP, and DenseNet-121 on the SP test dataset. All test samples were correctly predicted as true labels.
Each panel contains blue, green and red channels (Figure 4). The distribution of grayscale values in the red channel is similar to that of the green channel (Figure 4A). Besides, the distribution of grayscale values in the red channel among the different groups is not significantly different from that of the green and blue channels (Figure 4D). On the contrary, the distribution of grayscale values in both green and blue channels is distinct in the negative control, 100 pM and 1 nM SARS-CoV-2 (Figures 4A–D). Thus, the grayscale values in the green and blue channels are chosen as features for traditional machine learning.
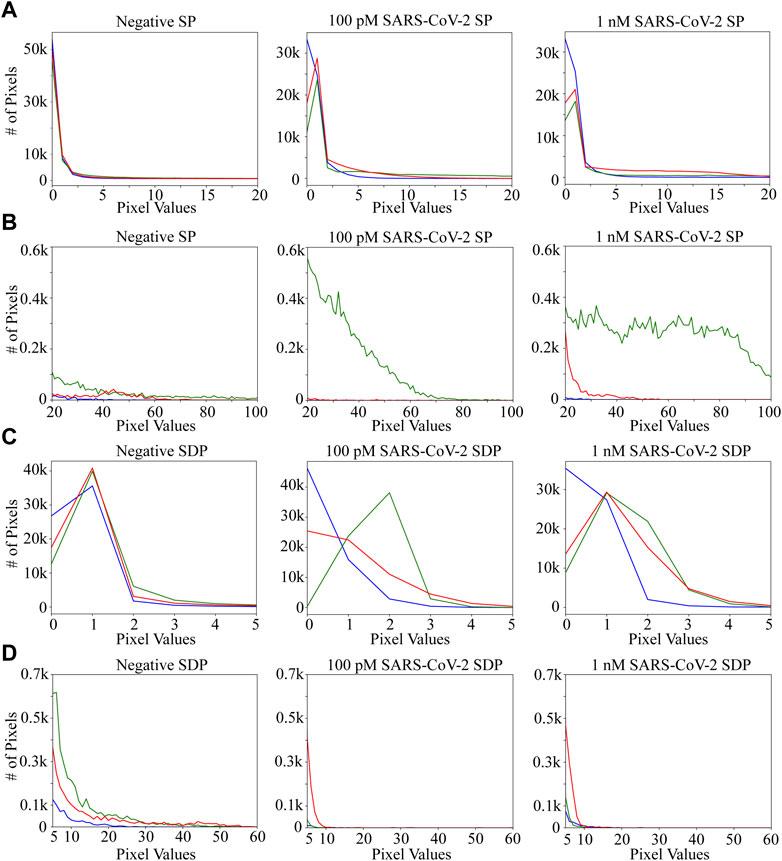
Figure 4. RGB (Red, Green, and Blue) histograms of SP and SDP images among different groups (negative, 100 pM SARS-CoV-2 and 1 nM SARS-CoV-2). The horizontal axis represents the pixel values, and the vertical axis represents the count of a specific pixel value. The number of pixels with values greater than 100 (in the SP-processed image) and 60 (in the SDP-processed image) is nearly zero. (A) RGB histograms between different groups of a SP-processed image, with pixel values between 0 and 20. (B) RGB histograms between different groups of a SP-processed image, with pixel values between 20 and 100. (C) RGB histograms between different groups of an SDP-processed image, with pixel values between 0 and 5. (D) RGB histograms between different groups of an SDP-processed image, with pixel values between 5 and 60.
For the dataset processed by SP or SDP, the test accuracy and loss curves reach a plateau when using the feature extraction and fine-tunning method, indicating the absence of overfitting for the SD and SDP datasets (Figures 5A–D). For both feature extraction and fine-tunning methods, the DenseNet-121-based transfer learning performs equally well, while the VGG-16-based transfer learning shows decrease in accuracy and an increase in loss error on both SP and SDP test datasets during the second stage of training (Supplementary Figures S3A–D).
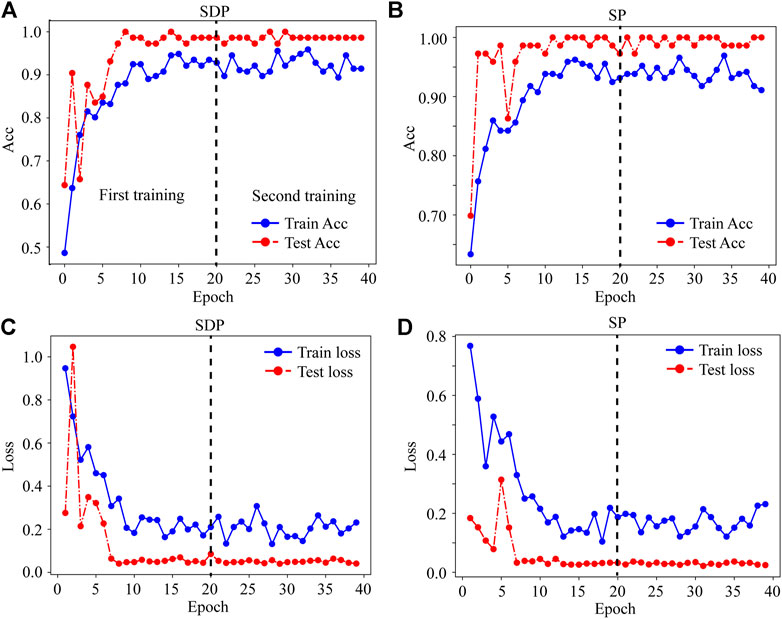
Figure 5. Plotting the feature extraction and fine-tuning methods in transfer learning based on DenseNet-121 with SDP or SP datasets. (A) Classification accuracy performance on SDP dataset. (B) Classification accuracy performance on SP dataset. (C) Classification loss on SDP dataset. (D) Classification loss on SP dataset. Acc, Accuracy.
Images processed by SP are fed to generate Grad-CAM. Grad-CAM map correctly highlights the fluorescence-determining area for samples with negative, 100 pM and 1 nM SARS-CoV-2 nucleic acid. The distribution and area of fluorescence intensity corresponding to the different groups differ, which is consistent with the original images processed by SP (Figure 6). Besides, with the increasing fluorescence intensity of negative, 100 pM and 1 nM SARS-CoV-2, the red region in Grad-CAM becomes wider and deeper, which is consistent with the concentration change. In contrast, the Grad-CAM results of SDP image fail to distinguish the fluorescence regions between the different groups.
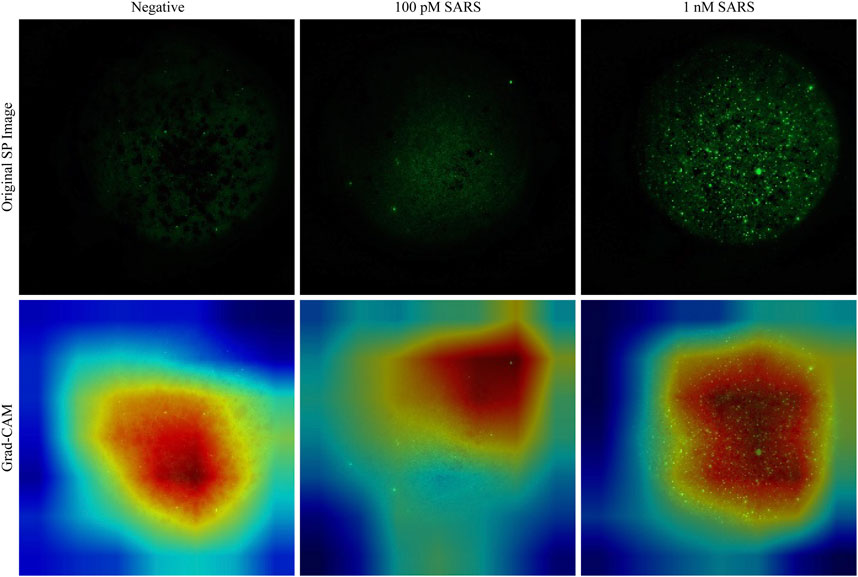
Figure 6. Interpretation of image focusing by Densenet-121 on SP test dataset. The red region represents the important region contributing to the label. As the concentration increases, the red regions in Grad-CAM become wider and deeper, showing a high degree of overlap with the fluorescence regions in the original SP image.
Two kinds of preprocessing techniques are used to assist the model in classifying negative, 100 pM, or 1 nM SARS-CoV-2. First, the data cleaning technique is designed to exclude outlier images as defined in Eq. 1. Second, the intensity is adjusted to one when the pixel value equals 0 and the pixel values are divided using the fluorescence images before and after sample introduction. Among the results, the comparison results of the preprocessing effect on the model performance are shown in Tables 2, 3. Table 2 shows the effect of excluding outliers on the model output. The performance of Densenet-121 on SDP and SP datasets improved from 97.80% to 100% accuracy, respectively. Similarly, DT shows a sharp increase of about 6.59%, demonstrating the sensitivity to outlier exclusion (Table 2). Table 3 demonstrates how much of an impact the SDP technique has on model capacity compared to the DP control. With the exception of SVM, using the SDP technique, the F1 scores of DenseNet-121 and DT increased to 100% from 97.22% and 95.92%, respectively. The other deep learning-based models for transfer learning grow differently, while the F1 score of VGG-16 booms sharply from 79.28% to 93.15% (Table 3). SDP can effectively enhance the performance of the model.
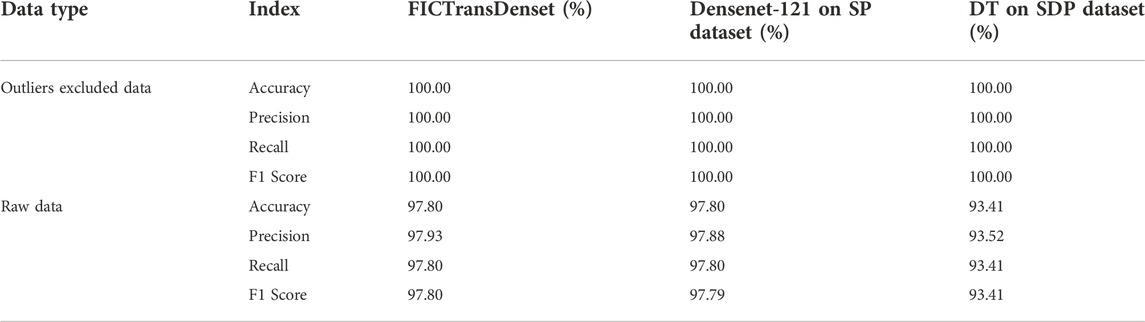
Table 2. Performance variations for different dataset types.
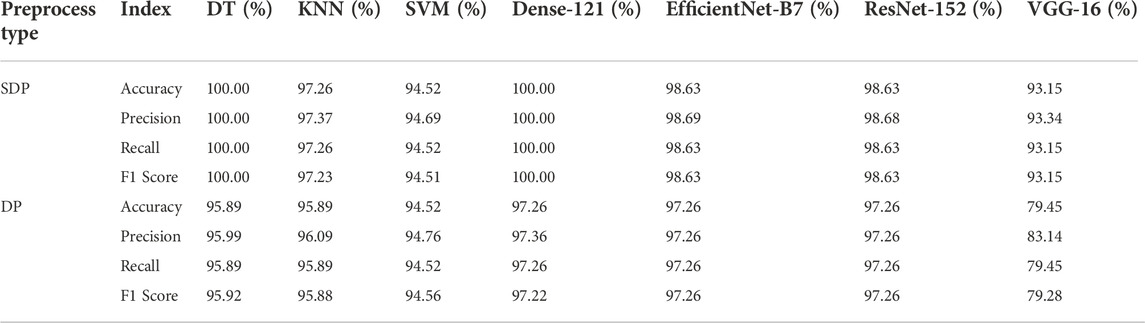
Table 3. Performance variations between SDP and DP dataset of traditional machine learning and transfer learning based on deep learning.
In this work, we investigate seven algorithms for classifying TIRF images into negative, 100 pM or 1 nM SARS-CoV-2 samples using an effective image preprocessing method. Data quality can be ensured by keeping consistent experimental conditions and excluding outliers in the datasets. Both traditional machine learning (SVM, KNN, DT) and deep learning-based transfer learning (DenseNet-121, EfficientNet-B7, VGG-16, ResNet-152) algorithms achieve an excellent performance of at least 93.15% on all metrics (in terms of F1 Score, Accuracy, and Recall) after SDP treatment. FICTransDense and DT reveal the highest precise classification of 100.00%. Using the pre-trained models, FICTransDense requires about 36.07 ms to give the predicted classification results without time delay or additional tedious labor and effort. Meanwhile, the proposed SDP technique is shown to be effective in improving the performance of most traditional machine learning algorithms and transfer learning based on VGG-16, DenseNet-121, EfiicientNet-B7, and ResNet-152 models (Table 3). However, we are unable to visually explain the SDP technique in negative control, 100 pM and 1 nM SARS-CoV-2 fluorescent images using Grad-CAM. The majority of pixel values in all types of SDP images are less than 10 (Figures 4C,D), with most of them being less than 3 (Figure 4C), which means that the majority of the images are nearly black. In this case, we speculate that the differences between the different groups are not restricted to fluorescence localization but are more related to the values of the total pixel intensity or distribution, and that Grad-CAM is capable of identifying the parts of the input image that can significantly affect the classification score. On the contrary, the distribution of grayscale values between 20 and 100 in the green channel (Figure 4B) should correspond to the fluorescence region, indicating consistency with the visualization results of the SP by Grad-CAM (Figure 6). Overall, the proposed FICTransDense demonstrates the best performance in estimating SARS-CoV-2 RNA fragment concentrations after multi-category classification of images collected via TIRFM and CRISPR-Cas13a techniques. In view of the limitation that our study only deals with the issue of classifying SARS-CoV-2 RNA segments at three concentrations, the performance of FICTransDense on more classes of SARS-CoV-2 RNA remains to be validated.
In the future, FICTransDense could be integrated with commercially available image processing software, such as ImageJ, for rapid analysis of SARS-CoV-2 virus concentration in the context of a given fluorescent image. Besides, similar research dilemmas, such as distinguishing between two images before and after a specific treatment, could benefit from this work. Furthermore, considering the programmability of crRNA, FICTransDense holds great potential for accurate and instantaneous detection of various pathogenic RNAs using images collected via TIRFM and CRISPR-Cas13a techniques.
The data analyzed in this study is subject to the following licenses/restrictions: All relevant data are available from the authors upon reasonable request. Requests to access these datasets should be directed to LZ, zlk21@mails.tsinghua.edu.cn.
QHe conceptualized the original idea, QHe, LZ, ZL, and CX designed the study, performed the experiments and analyzed the data; QHe, LZ, and ZL investigated research information; PQ and CZ supervised the whole research; LZ and CX wrote the original draft; VP wrote, reviewed and edited the manuscript, QHe, LZ, ZL, HG, MH, QHu, IG, ZD, CJ, XY, SZ, XZ, LX, CL, XX, and PQ critically reviewed and revised the manuscript.
This work was supported by grants from National Natural Science Foundation of China (31970752), Science, Technology, Innovation Commission of Shenzhen Municipality (JCYJ20190809180003689, JSGG20200225150707332, WDZC20200820173710001, and JSGG20191129110812708), and Shenzhen Bay Laboratory Open Funding (SZBL2020090501004).
The authors declare that the research was conducted in the absence of any commercial or financial relationships that could be construed as a potential conflict of interest.
All claims expressed in this article are solely those of the authors and do not necessarily represent those of their affiliated organizations, or those of the publisher, the editors and the reviewers. Any product that may be evaluated in this article, or claim that may be made by its manufacturer, is not guaranteed or endorsed by the publisher.
The Supplementary Material for this article can be found online at: https://www.frontiersin.org/articles/10.3389/fsens.2022.1015223/full#supplementary-material
Alexandersen, S., Chamings, A., and Bhatta, T. R. (2020). "SARS-CoV-2 genomic and subgenomic RNAs in diagnostic samples are not an indicator of active replication.". Nat. Commun. 11 (1), 6059–6113. doi:10.1038/s41467-020-19883-7
Asboe, D., Aitken, C., Boffito, M., Booth, C., Cane, P., Fakoya, A., et al. (2012). "British HIV Association guidelines for the routine investigation and monitoring of adult HIV-1-infected individuals 2011.". HIV Med. 13 (1), 1–44. doi:10.1111/j.1468-1293.2011.00971.x
Bao, C., Liu, X., Zhang, H., Li, Y., and Liu, J. (2020). Coronavirus disease 2019 (COVID-19) CT findings: A systematic review and meta-analysis. J. Am. Coll. radiology 17 (6), 701–709. doi:10.1016/j.jacr.2020.03.006
Das, A., Das, P., Panda, S., and Sabut, S. (2019). "Detection of liver cancer using modified fuzzy clustering and decision tree classifier in CT images.". Pattern Recognit. Image Anal. 29 (2), 201–211. doi:10.1134/s1054661819020056
Deng, J., Dong, W., Socher, R., Li, L. J., Kai, L., and Li, F.-F. (2009). “ImageNet: A large-scale hierarchical image database,” in 2009 IEEE Conference on Computer Vision and Pattern Recognition, Miami, FL, USA, 20-25 June 2009.
Díaz-Galicia, E., Grünberg, R., and Arold, S. T. (2022). How to find the right RNA-sensing CRISPR-cas system for an in vitro application. Biosensors 12 (2), 53. doi:10.3390/bios12020053
Duong, H., and Han, M. (2013). A multispectral LED array for the reduction of background autofluorescence in brain tissue. J. Neurosci. methods 220 (1), 46–54. doi:10.1016/j.jneumeth.2013.08.018
East-Seletsky, A., O’Connell, M. R., Knight, S. C., Burstein, D., Cate, J. H. D., Tjian, R., et al. (2016). "Two distinct RNase activities of CRISPR-C2c2 enable guide-RNA processing and RNA detection.". Nature 538 (7624), 270–273. doi:10.1038/nature19802
Gc, S., Saidul Md, B., Zhang, Y., Reed, D., Ahsan, M., Berg, E., et al. (2021). Using deep learning neural network in artificial intelligence technology to classify beef cuts. Front. Sens. (Lausanne). 2, 654357. doi:10.3389/fsens.2021.654357 "
Gou, T., Hu, J., Zhou, S., Wu, W., Fang, W., Sun, J., et al. (2019). A new method using machine learning for automated image analysis applied to chip-based digital assays. Analyst 144 (10), 3274–3281. doi:10.1039/c9an00149b
Han, X., Zhang, Z., Ding, N., Gu, Y., Liu, X., Huo, Y., et al. (2021). Pre-trained models: Past, present and future. AI Open 2, 225–250. doi:10.1016/j.aiopen.2021.08.002
Hasan, N., Bao, Y., Shawon, A., and Huang, Y. (2021). "DenseNet convolutional neural networks application for predicting COVID-19 using CT image.". SN Comput. Sci. 2 (5), 389–411. doi:10.1007/s42979-021-00782-7
He, K., Zhang, X., Ren, S., and Sun, J. (2016). “Deep residual learning for image recognition,” in Proceedings of the IEEE conference on computer vision and pattern recognition, Las Vegas, NV, USA, 27-30 June 2016.
He, Q., Chen, Q., Li, F., Yuan, X., Wang, C., Liu, C., et al. (2021). Amplification-free detection of viral RNA by super resolution imaging-based CRISPR/Cas13a System. bioRxiv.
Horvath, P., and Barrangou, R. (2010). "CRISPR/Cas, the immune system of bacteria and archaea.". Science 327 (5962), 167–170. doi:10.1126/science.1179555
Ioannidis, G. S., Trivizakis, E., Metzakis, I., Papagiannakis, S., Lagoudaki, E., and Marias, K. (2021). Pathomics and deep learning classification of a heterogeneous fluorescence histology image dataset. Appl. Sci. 11 (9), 3796. doi:10.3390/app11093796
Islam, M. M., Karray, F., Alhajj, R., and Zeng, J. (2021). A review on deep learning techniques for the diagnosis of novel coronavirus (COVID-19).". IEEE Access 9, 30551–30572. doi:10.1109/access.2021.3058537
Kaminski, M. M., Abudayyeh, O. O., Gootenberg, J. S., Zhang, F., and Collins, J. J. (2021). "CRISPR-based diagnostics.". Nat. Biomed. Eng. 5 (7), 643–656. doi:10.1038/s41551-021-00760-7
Kham-Kjing, N., Ngo-Giang-Huong, N., Tragoolpua, K., Khamduang, W., and Hongjaisee, S. (2022). "Highly specific and rapid detection of hepatitis C virus using RT-LAMP-coupled CRISPR-cas12 assay." Diagnostics 12(7).1524. doi:10.3390/diagnostics12071524
Kingma, D. P., and Ba, J. (2014). Adam: A method for stochastic optimization. arXiv preprint arXiv:1412.6980.
Korfhage, N., Mühling, M., Ringshandl, S., Becker, A., Schmeck, B., and Freisleben, B. (2020). "Detection and segmentation of morphologically complex eukaryotic cells in fluorescence microscopy images via feature pyramid fusion.". PLoS Comput. Biol. 16 (9), e1008179. doi:10.1371/journal.pcbi.1008179
Krizhevsky, A., Sutskever, I., and Hinton, G. E. (2017). Imagenet classification with deep convolutional neural networks. Commun. ACM 60 (6), 84–90.
Lei, Z., Lian, L., Zhang, L., Wei, J., Liu, C., Liu, H., et al. (2022). Detection of Frog virus 3 via the system integrating RPA-CRISPR/Cas12a-SPM with deep learning. bioRxiv. doi:10.1101/2022.08.22.504785
Mehrotra, R., Ansari, M., Agrawal, R., and Anand, R. (2020). A transfer learning approach for AI-based classification of brain tumors.". Mach. Learn. Appl. 2, 100003. doi:10.1016/j.mlwa.2020.100003
Nugroho, R. A., Nugraha, A. S., Al Rasyid, A., and Rahayu, F. W. (2021). "Improvement on KNN using genetic algorithm and combined feature extraction to identify COVID-19 sufferers based on CT scan image." TELKOMNIKA Telecommun. Comput. Electron. Control) 19 (5), 1581–1587. doi:10.12928/telkomnika.v19i5.18535
Pardee, K., Green, A. A., Takahashi, M. K., Braff, D., Lambert, G., Lee, J. W., et al. (2016). "Rapid, low-cost detection of Zika virus using programmable biomolecular components.". Cell 165 (5), 1255–1266. doi:10.1016/j.cell.2016.04.059
Prasetio, B., Tamura, H., and Tanno, K. (2018). “The facial stress recognition based on multi-histogram features and convolutional neural network.” in 2018 IEEE International Conference on Systems, Man, and Cybernetics (SMC), Miyazaki, Japan, 07-10 October 2018.
Qin, P., Park, M., Alfson, K. J., Tamhankar, M., Carrion, R., Patterson, J. L., et al. (2019). "Rapid and fully microfluidic Ebola virus detection with CRISPR-Cas13a.". ACS Sens. 4 (4), 1048–1054. doi:10.1021/acssensors.9b00239
Rendon-Gonzalez, E., and Ponomaryov, V. (2016). “Automatic Lung nodule segmentation and classification in CT images based on SVM,” in 2016 9th International Kharkiv Symposium on Physics and Engineering of Microwaves, Millimeter and Submillimeter Waves (MSMW), Kharkiv, Ukraine, 20-24 June 2016 (IEEE).
Roberts, M., Driggs, D., Thorpe, M., Gilbey, J., Yeung, M., Ursprung, S., et al. (2021). "Common pitfalls and recommendations for using machine learning to detect and prognosticate for COVID-19 using chest radiographs and CT scans.". Nat. Mach. Intell. 3 (3), 199–217. doi:10.1038/s42256-021-00307-0
Roccetti, M., Delnevo, G., Casini, L., and Cappiello, G. (2019). Is bigger always better? A controversial journey to the center of machine learning design, with uses and misuses of big data for predicting water meter failures.". J. Big Data 6 (1), 70. doi:10.1186/s40537-019-0235-y
Roccetti, M., Delnevo, G., Casini, L., and Mirri, S. (2021). An alternative approach to dimension reduction for pareto distributed data: A case study. J. Big Data 8 (1), 39. doi:10.1186/s40537-021-00428-8
Ruder, S. (2016). An overview of gradient descent optimization algorithms. arXiv preprint. arXiv:1609.04747.
Selvaraju, R. R., Cogswell, M., Das, A., Vedantam, R., Parikh, D., and Batra, D. (2017). “Grad-cam: Visual explanations from deep networks via gradient-based localization,” in Proceedings of the IEEE international conference on computer vision, Venice, Italy, 22-29 October 2017.
Shan, Y., Zhou, X., Huang, R., and Xing, D. (2019). "High-Fidelity and rapid quantification of miRNA combining crRNA programmability and CRISPR/Cas13a trans-cleavage activity.". Anal. Chem. 91 (8), 5278–5285. doi:10.1021/acs.analchem.9b00073
Shiaelis, N., Tometzki, A., Peto, L., McMahon, A., Hepp, C., Bickerton, E., et al. (2020). Virus detection and identification in minutes using single-particle imaging and deep learning. MedRxiv.
Simonyan, K., and Zisserman, A. (2014). “Two-stream convolutional networks for action recognition in videos,” in Advances in neural information processing systems 27.
Strickland, E. (2022). Andrew ng, AI minimalist: The machine-learning pioneer says small is the new big.". IEEE Spectr. 59 (4), 22–50. doi:10.1109/mspec.2022.9754503
Sultan, H. H., Salem, N. M., and Al-Atabany, W. (2019). "Multi-classification of brain tumor images using deep neural network.". IEEE access 7, 69215–69225. doi:10.1109/access.2019.2919122
Taylor, L., and Nitschke, G. (2018). “Improving deep learning with generic data augmentation,” in 2018 IEEE Symposium Series on Computational Intelligence (SSCI), Bangalore, India, 18-21 November 2018 (IEEE).
Terns, M. P., and Terns, R. M. (2011). CRISPR-based adaptive immune systems. Curr. Opin. Microbiol. 14 (3), 321–327. doi:10.1016/j.mib.2011.03.005
V’kovski, P., Kratzel, A., Steiner, S., Stalder, H., and Thiel, V. (2021). Coronavirus biology and replication: Implications for SARS-CoV-2. Nat. Rev. Microbiol. 19 (3), 155–170. doi:10.1038/s41579-020-00468-6
Wang, Y., Xue, T., Wang, M., Ledesma-Amaro, R., Lu, Y., Hu, X., et al. (2022). CRISPR-Cas13a cascade-based viral RNA assay for detecting SARS-CoV-2 and its mutations in clinical samples. Sensors Actuators B Chem. 362, 131765. doi:10.1016/j.snb.2022.131765
Xie, Y., Yang, H., Yuan, X., He, Q., Zhang, R., Zhu, Q., et al. (2021). "Stroke prediction from electrocardiograms by deep neural network.". Multimed. Tools Appl. 80 (11), 17291–17297. doi:10.1007/s11042-020-10043-z
Zhang, R., Han, X., Lei, Z., Jiang, C., Gul, I., Hu, Q., et al. (2022). RCMNet: A deep learning model assists CAR-T therapy for leukemia. Comput. Biol. Med. 150, 106084. doi:10.1016/j.compbiomed.2022.106084
Keywords: CRISPR-Cas13a, TIRFM, machine learning, transfer learning, Densenet-121, SARS-CoV-2
Citation: Zhang L, Lei Z, Xiao C, Du Z, Jiang C, Yuan X, Hu Q, Zhai S, Xu L, Liu C, Zhong X, Guan H, Hassan M, Gul I, Pandey V, Xing X, Zhang CY, He Q and Qin P (2022) AI-boosted CRISPR-Cas13a and total internal reflection fluorescence microscopy system for SARS-CoV-2 detection. Front. Sens. 3:1015223. doi: 10.3389/fsens.2022.1015223
Received: 09 August 2022; Accepted: 10 October 2022;
Published: 02 November 2022.
Edited by:
Aida Martin, Quantitative BioSciences, Inc., United StatesReviewed by:
Marco Roccetti, University of Bologna, ItalyCopyright © 2022 Zhang, Lei, Xiao, Du, Jiang, Yuan, Hu, Zhai, Xu, Liu, Zhong, Guan, Hassan, Gul, Pandey, Xing, Zhang, He and Qin. This is an open-access article distributed under the terms of the Creative Commons Attribution License (CC BY). The use, distribution or reproduction in other forums is permitted, provided the original author(s) and the copyright owner(s) are credited and that the original publication in this journal is cited, in accordance with accepted academic practice. No use, distribution or reproduction is permitted which does not comply with these terms.
*Correspondence: Peiwu Qin, cHdxaW5Ac3oudHNpbmdodWEuZWR1LmNu; Qian He, aGUucWlhbkBzei50c2luZ2h1YS5lZHUuY24=; Can Yang Zhang, emhhbmcuY3lAc3oudHNpbmdodWEuZWR1LmNu
†These authors have contributed equally to this work
Disclaimer: All claims expressed in this article are solely those of the authors and do not necessarily represent those of their affiliated organizations, or those of the publisher, the editors and the reviewers. Any product that may be evaluated in this article or claim that may be made by its manufacturer is not guaranteed or endorsed by the publisher.
Research integrity at Frontiers
Learn more about the work of our research integrity team to safeguard the quality of each article we publish.