
95% of researchers rate our articles as excellent or good
Learn more about the work of our research integrity team to safeguard the quality of each article we publish.
Find out more
REVIEW article
Front. Sens. , 14 January 2022
Sec. Physical Sensors
Volume 2 - 2021 | https://doi.org/10.3389/fsens.2021.796789
This article is part of the Research Topic Emerging Technologies and Applications in Distributed Optical Fiber Sensors View all 4 articles
Accurate acquisition of the moisture field distribution in in situ soil is of great significance to prevent geological disasters and protect the soil ecological environment. In recent years, rapidly developed fiber-optic sensing technology has shown outstanding advantages, such as distributed measurement, long-distance monitoring, and good durability, which provides a new technical means for soil moisture field monitoring. After several years of technical research, the authors’ group has made a number of new achievements in the development of fiber-optic sensing technology for the soil moisture field, that is, two new fiber-optic sensing technologies for soil moisture content, including the actively heated fiber Bragg grating (AH-FBG) technology and the actively heated distributed temperature sensing (AH-DTS) technology, and a new fiber-optic sensing technology for soil pore gas humidity are developed. This paper systematically summarizes the three fiber-optic sensing technologies for soil moisture field, including sensing principle, sensor development and calibration test. Moreover, the practical application cases of three fiber-optic sensing technologies are introduced. Finally, the development trend of fiber-optic sensing technology for soil moisture field in the future is summarized and prospected.
The distribution of the soil moisture field is an important factor affecting soil stability (Bittelli et al., 2008; Heitman et al., 2008). Geological disasters, such as landslide, debris flow, collapse, and land settlement, as well as geotechnical problems, such as foundation pit instability, retaining wall collapse, and tunnel leakage, are closely related to the soil moisture field. Therefore, the monitoring of soil moisture field is of great significance for mastering the engineering properties of soil, predicting geological disasters, and solving various geotechnical problems.
The quantitative indexes reflecting the soil moisture field are soil water content and pore gas humidity. Traditional methods for soil water content measurement mainly include the oven-drying method (Zhao et al., 2019; He et al., 2020), the resistivity method (Gunn et al., 2015; Ma et al., 2019), and the time domain reflectometry (TDR) method (Watanabe and Wake, 2009; Pastuszka et al., 2014; Zhou et al., 2014). Oven-drying is the most common and simple method to measure the soil water content; however, this method destroys the original structure of in situ soil and cannot realize remote monitoring. The resistivity method determines the soil water content by measuring the resistivity between two electrodes embedded in the soil, so it is difficult to meet the requirements of distributed monitoring of soil water content. TDR can obtain the soil dielectric constant by measuring the electromagnetic wave between the probes inserted into the soil to determine the soil water content. At present, TDR is a common method for in situ soil water content monitoring. However, it is difficult to realize the water content measurement in deep soil and meet the requirements of long-distance and distributed monitoring.
In recent years, the actively heated fiber-optic (AHFO) method developed on the basis of distributed temperature sensing (DTS), referred to as the AH-DTS method, provides a technical basis for soil water content measurement, which has attracted extensive attention because of its advantages of small size, anti-electromagnetic interference, distributed measurement, and potentially low cost (Selker et al., 2006; Read et al., 2013). Sayde et al. (2010) first proposed a DTS fiber-optic cable heated by stainless steel and inferred the soil water content through the heat loss speed in the surrounding soil. Since then, some scholars have tried to apply the AHFO method to a large number of laboratory tests (Ciocca et al., 2012; Gil-Rodríguez et al., 2013; Wu et al., 2017, 2020) and some field applications (Striegl and Loheide, 2012; Sayde et al., 2014; Benítez-Buelga et al., 2016), and all achieved satisfactory results. However, the AHFO method is far from becoming a mature technology according to the internationally reported results of AHFO, which is reflected in the lack of AHFO sensor products, corresponding AHFO monitoring software, and standardized commercial monitoring equipment. Also, most studies focus on soil water content monitoring in the agricultural irrigation fields. The relevant results are mainly for research purposes and have not been popularized and applied in engineering practice. In addition, it is worth noting that the pore gas humidity in the soil is an important parameter that directly determines soil suction and indirectly reflects soil moisture content (Gens and Alonso, 1992). Therefore, the development of the corresponding fiber-optic humidity sensing technology is also an important means to obtain the soil moisture field.
To this end, the authors’ group has developed two AHFO sensing technologies and related equipment for soil water content (Cao D. et al., 2018b; Cao et al., 2018a; Cao et al., 2018c; Sun et al., 2020; Sun et al., 2021) as well as a fiber-optic monitoring technology for soil pore gas humidity and related equipment (Guo et al., 2021a; Guo et al., 2021b) through several years of technical research, which have been fully industrialized and put on the market. This paper focus on two types of soil water content monitoring technologies, namely, actively heated fiber Bragg grating (AH-FBG) technology and the actively heated distributed temperature sensing (AH-DTS) technology, and one soil pore gas humidity monitoring technology. The sensing principle, sensor development, calibration tests and practical applications of these three technologies are presented.
The AHFO-based water content measurement method uses a fiber-optic sensor with the active heating function as a thermal probe. The fiber-optic sensor buried in the soil is both a heat source and a thermometer. The soil water content distribution along the sensor is calculated by measuring the temperature distribution along the sensor. The fiber-optic sensor buried in the soil can be regarded as an infinitely long cylindrical heat source. During the heating process, the temperature change of the infinite sensor is as follows (Ciocca et al., 2012):
where Tt is the rise in temperature (C) or the temperature characteristic value, T(t) is the temperature of the heat source (C) corresponding to the heating time t, T0 is the initial soil temperature (C), Q is the heating power per unit length (W m−1), λ is the soil thermal conductivity (W m−1 K−1), R is the thermal resistance per unit length (m K W−1) between the fiber-optic sensor and the soil wall, K is the thermal diffusivity (m2 s−1) of the soil, a is the outer diameter (m) of the sensor, and c = 1.7811 = exp (γ) where γ is the Euler–Mascheroni constant (γ = 0.5772).
According to the research of Sun et al. (2020), when the fiber-optic sensor is in close contact with the soil, after heating for a certain time, Eq. 1 can be approximated as
where
The mineral composition and dry density of in situ soil can be considered as fixed values, so the λ is only related to the soil volumetric water content (θ), and there is the only corresponding functional relationship between λ and θ, namely,
The following relationship can be obtained by combining Eqs 2, 3:
As can be seen from Eq. 4, θ can be calculated by measuring Tt on the basis of the Tt–θ relationship obtained by the calibration test. Therefore, based on the Côté and Konrad thermal conductivity calculation model and a large number of experimental analyses, the authors’ group proposes a calibration model describing the Tt–θ relationship, which is expressed as
where
Humidity sensing can be realized by coating the moisture-sensitive material on the optical fiber with a specific process. When the ambient humidity increases, the moisture-sensitive material absorbs water molecules from the air under the action of humidity difference, and the volume of the material becomes larger, resulting in a tensile strain of the optical fiber. On the contrary, when the ambient humidity decreases, the moisture-sensitive material discharges the internal water molecules, and the volume of the material shrinks, which, in turn, produces compressive strains of the optical fiber. At present, the authors’ group selects moisture-sensitive materials with linear hygroscopicity, polyimide (PI) and inorganic–organic hybrid polymer (ORMOCER®) to coat the FBG, and develop the corresponding soil pore gas humidity sensor. The PI/ORMOCER®-coated FBG (PI/OR-FBG) humidity sensor includes two FBGs. One is coated with moisture-sensitive material (FBG1) for humidity sensing, and the other is an uncoated FBG (FBG2) for temperature compensation in the humidity measurement process. The developed humidity sensor can measure humidity and temperature simultaneously (Guo et al., 2021a):
where KT1 and KT2 are the temperature sensitivity coefficients (°C/nm) of FBG1 and FBG2, respectively; KRH is the humidity sensitivity coefficient of FBG1 (%RH/nm); and Δλ1 and Δλ2 are the Bragg wavelength variations (nm) of FBG1 and FBG2, respectively.
When FBG temperature measurement technology is used to monitor the quasi-distribution of soil water content, the AH-FBG sensor is the most basic sensing element. The authors’ group, together with NanZee Sensing Technology Co., Ltd., China, designed and developed two kinds of AH-FBG sensors, namely, the carbon fiber heated sensor (CFHS) (Cao et al., 2018c) and the alundum-tube packed heated sensor (APHS) (Cao et al., 2018b; Sun et al., 2021). The structures of CFHS and APHS are shown in Figure 1.
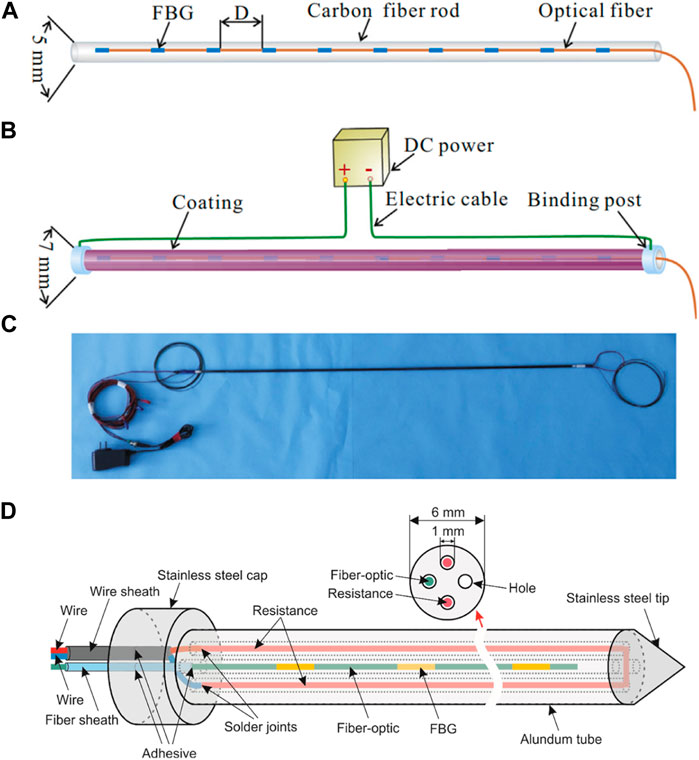
FIGURE 1. Schematic diagram of CFHS and APHS. (A) Internal structure of the CFHS. (B) External structure of the CFHS. (C) Photo of the CFHS. (D) Internal structure of the APHS (Cao et al., 2018c; Sun et al., 2021).
CFHS consists of a 5-mm-diameter carbon fiber rod, FBGs on a fiber optic coating, two binding posts, and electric cables. The carbon fiber rod is not only the skeleton of the CFHS, but also a heat source. When it is powered on, it generates heat to raise the temperature of the CFHS. The voltage at both ends of the carbon fiber rod is set according to its length, and the heating power per unit length of CFHS is constant during heating. FBG on an optical fiber is pasted on the surface of the carbon fiber rod with special packaging adhesive and connected to the FBG demodulator through a conductive fiber-optic. Note that the distance between adjacent FBGs can be set as required. Then, a layer of coating is added to the surface of the carbon fiber rod pasted with FBGs to prevent the CFHS from being damaged when it is installed in the soil and to prevent the electric leakage after the carbon fiber rod is powered on. Finally, two binding posts are installed at both ends of the carbon fiber rod to connect the electric cables.
APHS consists of a four-hole alundum tube, FBGs on an optical fiber, fiber sheath, resistance, and electric cables. The main component of the alundum tube is aluminum oxide, which is an insulating material and also has the advantages of strong corrosion resistance, good durability, and high strength. The alundum tube is not only a heat transfer material, but also a sheath material to protect the internal FBGs and resist physical damage. The diameter and number of internal holes of alundum tube can be customized as required. Generally, the four-hole alundum tube with a diameter of 4 mm, hole diameter of 1 mm, and hole spacing of 1 mm can be selected as the sensor packaging tube. Among the four holes of the alundum tube, one hole is used to install the FBGs and the two nonadjacent holes are used to lay the resistance.
Both CFHS and APHS are quasi-distributed sensors, which have the advantages of light weight, small volume, easy to carry, strong anti-interference ability, short response time, and high spatial resolution, but the application scope of the two is different. CFHS has low strength and is easily damaged during installation, so it is very suitable for soil water content monitoring in laboratory tests. AHPS has high strength, and its alundum tube is easy to be made into a probe to test the soil water content through insertion. Therefore, AHPS is very suitable for in situ soil water content measurement.
By connecting multiple CFHSs or APHSs in series or parallel and using time, wavelength, and space division multiplexing technologies, one-, two-, and three-dimensional quasi-distributed monitoring of soil water content can be realized. Figure 2 is the schematic diagram of FBG quasi-distributed monitoring of soil water content.
The performance of the heated fiber-optic cable is very important to the AH-DTS technology. The authors’ group, together with NanZee Sensing Technology Co., Ltd., China, designed and developed two kinds of AH-DTS sensors: carbon fiber heated cable (CFHC) and the metal net heated cable (MNHC). Their structures are shown in Figure 3.
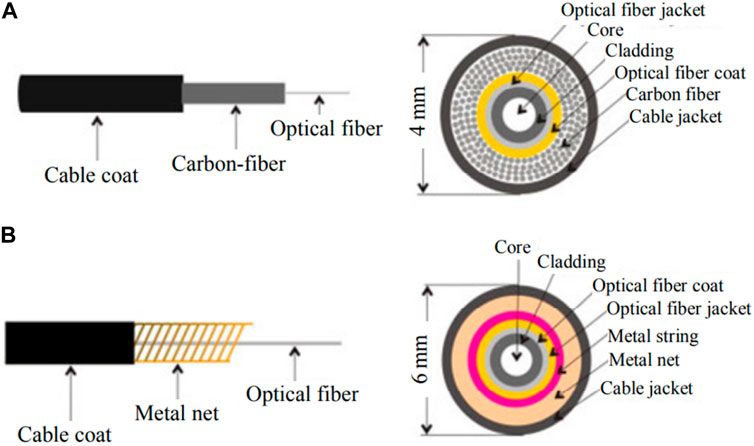
FIGURE 3. Structures of CFHC and MNHC. (A) CFHC. (B) MNHC (Shi et al., 2021).
CFHC is composed of fiber-optic cable, carbon fiber, and a cable jacket. Among them, the fiber-optic cable is composed of a fiber core, cladding, coating, and optical fiber coat; the carbon fiber is wrapped around the fiber-optic cable in filaments. The structure of MNHC is similar to that of CFHC. The difference is that the MNHC is electrically heated by the metal net, which has low resistance. Therefore, if CFHC and MNHC are required to achieve the same heating power per unit length (Q), MNHC requires less voltage. Due to the limited voltage supply on site, MNHC is more suitable for long-distance measurement than CFHC. See Table 1 for the comparison of physical properties between CFHC and MNHC.
In summary, CFHC has large resistance, high required voltage, and strong corrosion resistance. It is suitable for short-distance (<500 m) soil water content monitoring, whereas MNHC with small resistance is more suitable for long-distance and large-scale soil water content monitoring.
The spatial resolution of DTS technology is 1 m, which limits the refined measurement of soil water content. To realize soil water content monitoring with a high spatial resolution, the heated fiber-optic cable can be wrapped around the tube or rod to form a heated sensing tube. Figure 4 shows the schematic diagram of the carbon fiber heated sensing tube (CFHST).
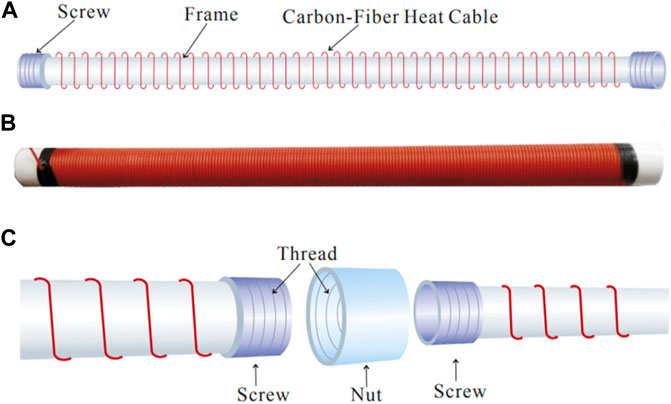
FIGURE 4. Schematic diagram of CFHST. (A) CFHST structure. (B) Photo of the CFHST. (C) Screwed-on connection of the CFHST (Cao et al., 2018a).
The CFHST is composed of three parts: the inner pipe, CFHC, and screw. The inner pipe can be made of different materials, usually PVC pipe with a diameter of 5 cm. The length of the CFHST can be determined according to the actual needs, which is generally 4 m. The two adjacent CFHSTs are connected through screws and a nut as shown in Figure 4C. The CFHC is tightly wound on the inner pipe so that the influence radius of the CFHST after heating is much larger than that of a single CFHC, which greatly improves the measurement accuracy of CFHST. More importantly, CFHST greatly improves the spatial resolution of the DTS cable. The improvement rate of spatial resolution can be calculated by Eqs 7, 8:
where M is the spatial resolution of CFHST (m), N is the improvement rate of spatial resolution, d is the diameter (m) of CFHC or MNHC, D is the diameter of CFHST (m), and S is the spatial resolution of DTS (m). For example, if a CFHC is tightly wound on the inner tube, according to Eqs 7, 8, the calculated spatial resolution of CFHST is increased to 2.5 cm, and the improvement rate is about 40.
Whether the quasi-distributed AH-FBG soil water content test or the fully distributed AH-DTS soil water content test are used, the soil needs to be calibrated before the test. The aim of calibration tests is to establish the Tt–θ relationship of the soil. The calibration device can be a standardized device equipped with the test system, or it can be built temporarily according to the actual situation. Figure 5A is a calibration device made of PVC pipe. The top side of the PVC pipe is a movable plate, which can be removed during soil loading or excavation. Moreover, sealing plugs are installed at both ends of the PVC pipe to prevent water loss in the soil during the calibration process.
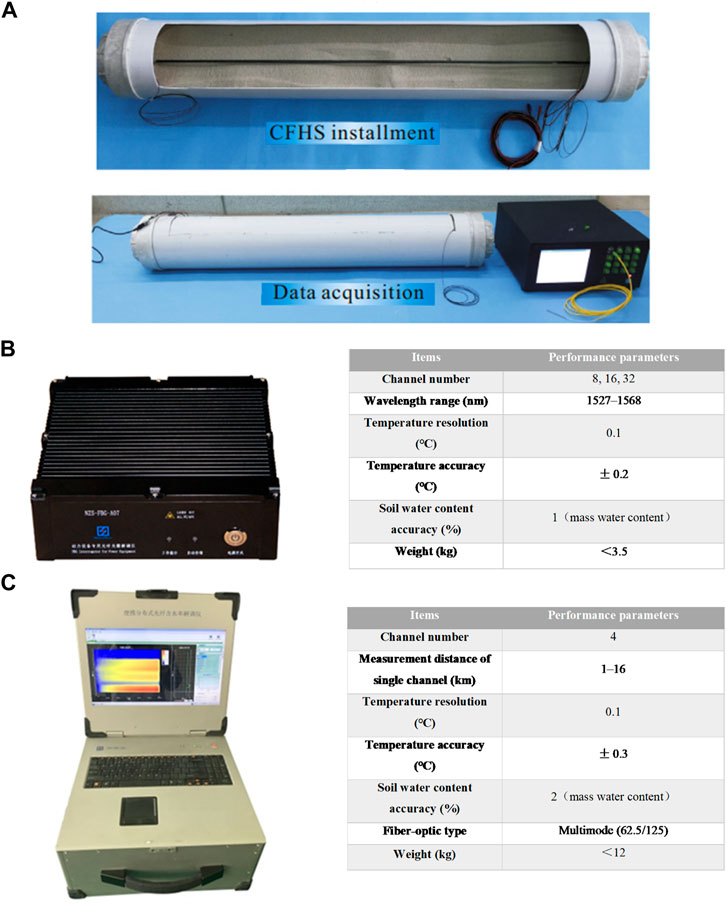
FIGURE 5. Calibration device and demodulators. (A) Calibration device made of PVC pipe (Cao et al., 2018c). (B) NZS-FBG-A07 demodulator used for AH-FBG sensors and its technical parameters. (C) NZS-DMS-A03 demodulator used for AH-DTS sensors and its technical parameters.
During the calibration test, the density of the soil sample in the calibration device should be the same as that of the tested in situ soil as much as possible to reduce the influence of density on the test results. The soil water content gravimetrically determined by oven-drying is used as the real value. Soil samples with different water contents were first prepared, and the calibrated sensor was embedded into the soil sample. Next, the temperature change curves with time were obtained under different soil water contents by the FBG or DTS temperature measurement system and the corresponding temperature characteristic value (Tt) was determined. Finally, the Tt–θ calibration curve can be obtained, and the calibration coefficients in Eq. 5 can be determined. It should be noted that the optimal heating power of AHFO sensors is 10–35 W/m. If the heating power is too small and the sensitivity of Tt to θ is low, it is difficult to reflect subtle θ change. On the contrary, if the heating power is too large, it causes water migration of the surrounding soil. Therefore, it is suggested that the specific heating power should be selected according to site conditions.
During calibration tests or field monitoring, the corresponding FBG/DTS demodulator needs to be used to obtain the data measured by the sensor. Figure 5B shows the NZS-FBG-A07 demodulator used for AH-FBG sensors and its technical parameters. Figure 5C shows the NZS-DMS-A03 demodulator used for AH-DTS sensors and its technical parameters. Note that the two demodulators are produced by NanZee Sensing Technology Co. Ltd., China.
The fiber-optic sensing technology for soil water content has been verified in engineering practice and well applied in the monitoring of loess ground, slopes, foundation pit, and landslides.
Figure 6A shows the layout scheme of APHS on a loess slope. Ten APHSs are arranged along the loess slope. It is worth noting that there is a 4-m-high scarp between sensors six and seven. Moreover, there is a corresponding neutron probe used for soil water content measurement near each APHS. Figures 6B–G shows the installation steps of the APHS. First, drill a hole with a diameter slightly smaller than that of APHS by using a soil extractor. Then, insert the APHS into the soil slowly to ensure that the APHS is in close contact with the surrounding soil, and finally, protect the APHS with a fence. Ten electric cables and 10 fiber-optic cables of APHS are routed from underground to the monitoring station through pre-excavated trenches, of which 10 electric cables and 10 optical fibers are connected to the relay and the FBG demodulator, respectively, in the monitoring station. The AH-FBG in situ monitoring system can realize quasi-distributed, remote, wireless, and in situ monitoring of soil water content.
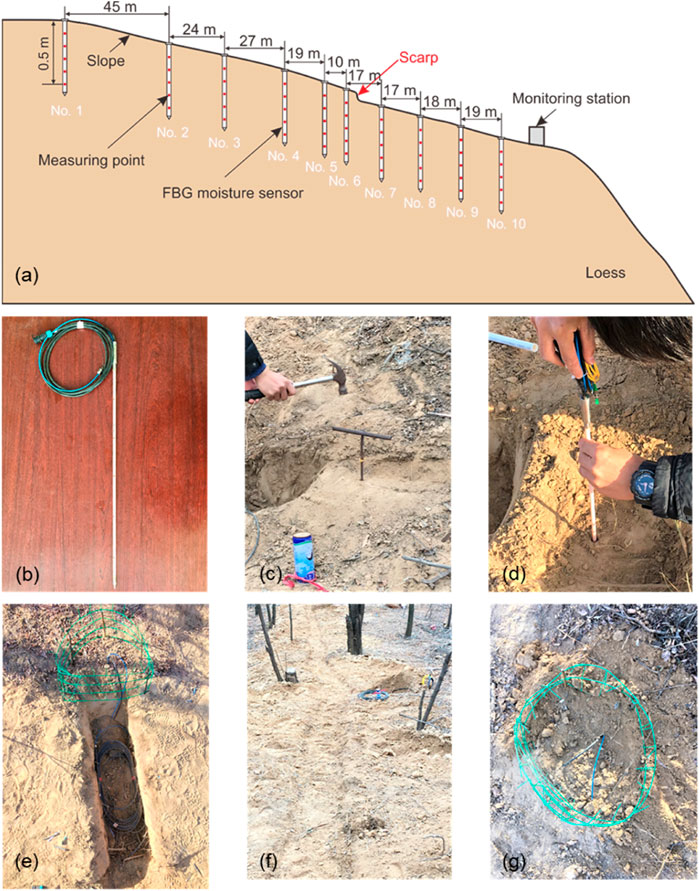
FIGURE 6. Layout scheme and installation steps of 10 APHSs. (A) Layout scheme. (B) Close-up view of APHS sensor. (C) Boring with a soil extractor. (D) APHS installation. (E) Trench excavation, (F) Trench backfilling. (G) Fence protection (Sun et al., 2021).
Figure 7 shows the soil water content distribution of the slope in different months. It can be seen that, in any month, the soil water content near the scarp (No. 5–7) is high, and that at the top (No. 1–4) and bottom of the slope (No. 8–10) is low. The 4-m-high scarp results in water retention at the top of the scarp. At the same time, the retained water is difficult to flow into the bottom of the slope; thus, the water content near the scarp is relatively high. The soil water content distribution in each month in Figure 7 illustrates that the water content of shallow soil changes obviously with seasons. The soil water content is low in winter (December to February) and high in autumn (November) and spring (March to April), which indicates that evaporation in winter enhances the spatial distribution difference of soil water content, whereas rainfall infiltration in summer reduces the spatial distribution difference of soil water content.
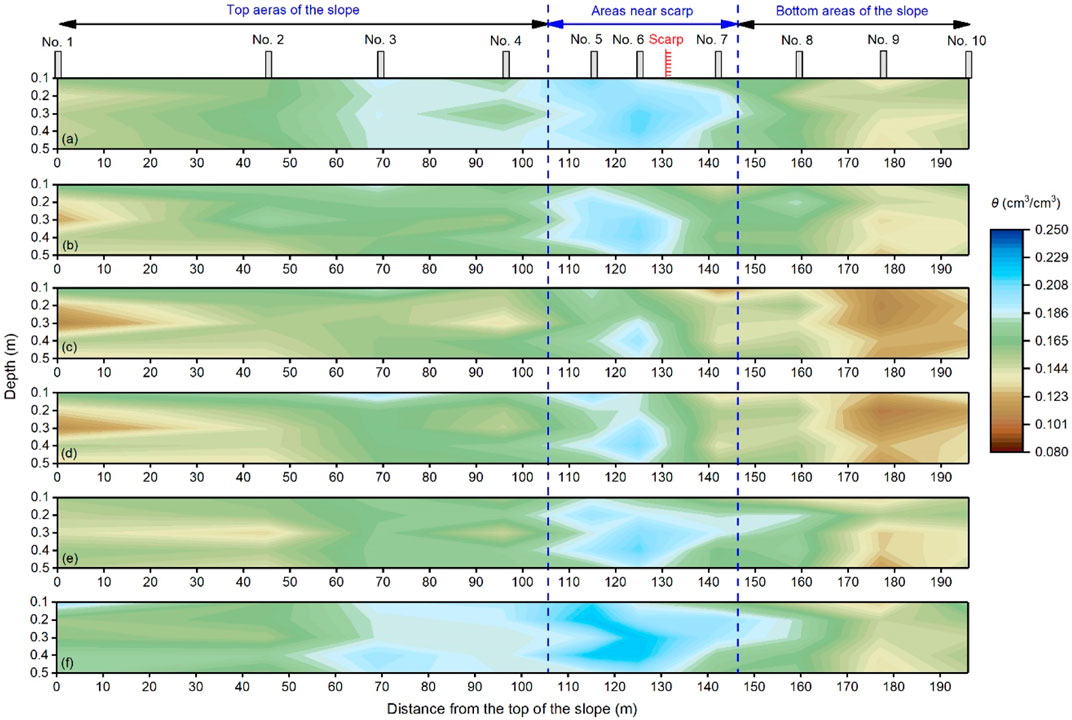
FIGURE 7. Soil water content distribution of the slope in different months. (A) 2019/11/10. (B) 2019/12/10. (C) 2020/1/10. (D) 2020/2/10. (E) 2020/3/10. (F) 2020/4/10 (Sun et al., 2021).
Figure 8 shows the comparison results of soil water content measured by APHS and neutron probe on January 6, 2020. It can be seen that the soil water contents measured by the two sensors are very consistent, and the root mean square error (RMSE) is only 0.014 cm3/cm3, which indicates that the APHS has good accuracy and further proves the feasibility and effectiveness of AH-FBG technology.
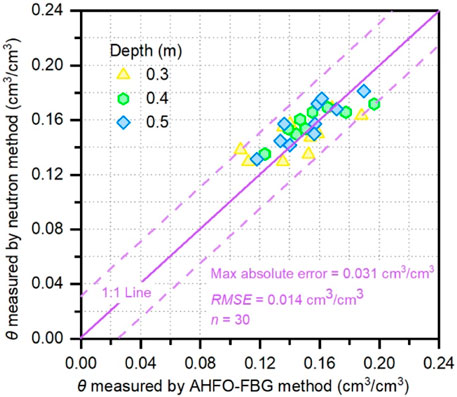
FIGURE 8. Comparison results of soil water content measured by APHS and neutron probe on January 6, 2020 (Sun et al., 2021).
Figure 9 is the schematic diagram of the CFHST used for soil water content monitoring of a foundation pit in Changzhou, China. The stratum of the foundation pit is composed of clay, silt, and clay from top to bottom. In the field test, the diameter of the selected CFHST is 7 cm with a 5-cm-diameter inner tube, and the total length is 20 m. It is formed by connecting five sensing tubes. Note that the production of CFHST is done indoors, and the CFHST is directly assembled in the field.
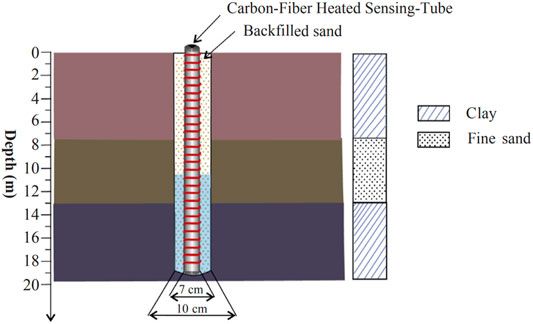
FIGURE 9. Schematic diagram of CFHST used for soil water content monitoring of a foundation pit in Changzhou (Cao et al., 2018a).
CFHST is arranged by drilling and embedding. After the CFHST is lowered into the borehole, it is necessary to backfill soil into the borehole to ensure good contact between CFHST and surrounding soil. After installation, the fiber-optic cables are connected to the DTS demodulator in the monitoring station, and at the same time, all the electric cables on the CFHST are connected to the voltage stabilizer with wires. The voltage stabilizer provides voltage to the CFHST to ensure constant power in the heating process. During the test, the heating time was 20 min, and monitoring data were recorded by the DTS demodulator every 30 s. Note that the Tt–θ calibration formulas of two types of soil are determined through indoor calibration tests. Therefore, the θ can be calculated by the measured Tt.
Figure 10A is the spatiotemporal distribution of soil water content measured by CFHST during the foundation pit dewatering process. It can be seen that the groundwater level decreases continuously during the whole test process from 9.81 m at the beginning to 14.08 m at the end. The soil water content of the topsoil layer is obviously affected by the weather, and the influence depth is about 4 m. Before the test, 38 groups of soil samples were drilled and collected, and their water contents were determined by oven drying. The soil water contents obtained by CFHST were compared with the results of the oven-drying method as shown in Figure 10B. It can be seen that, within the test depth range, the soil water contents measured by the two methods are highly consistent with each other.
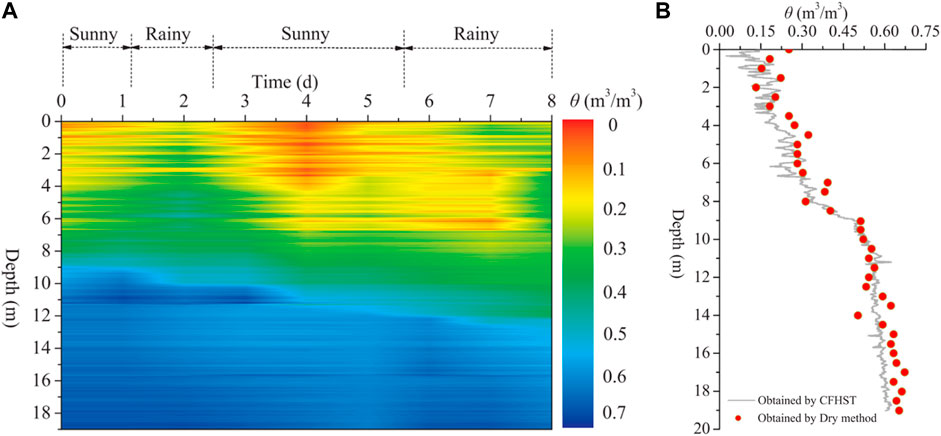
FIGURE 10. Test results measured by CFHST. (A) Spatiotemporal distribution of soil water content measured by CFHST during the foundation pit dewatering process. (B) Comparison of soil water contents measured by CFHST and the oven-dry method (Cao et al., 2018a).
Figure 11 shows the error between the soil water content measured by CFHST and the oven-drying method. It can be seen that the test data of the two methods are very close to the 1:1 line, the R2 of sand and clay are 0.941 and 0.934, respectively, and the RMSE of sand and clay are 0.018 m3/m3 and 0.053 m3/m3, respectively. The overall RMSE (0.046 m3/m3) is very close to the RMSE (0.048 m3/m3) obtained by Sayde et al. (2010). In summary, the soil water contents obtained by CFHST are very consistent with that measured by the oven-drying method, which proves the feasibility and effectiveness of the AH-DTS technology.

FIGURE 11. Error analysis for the soil water content obtained by CFHST in field site. (A) Error of the overall soil samples. (B) Error of fine sand. (C) Error of clay (Cao et al., 2018a).
To investigate the performance of AH-FBG in monitoring seasonally frozen soil, a field monitoring station was built in Huining, Gansu Province, China. Prior to field monitoring, a laboratory study was conducted to explore the feasibility of extending the monitoring scope of AH-FBG to seasonally frozen soils, and the empirical relationship between ice contents and temperature changes is established (Wu et al., 2021; Zhu et al., 2021). Through long-term field monitoring, the total water content, unfrozen water content, and ice content of the ground soil at a depth of 0–100 mm were obtained. This synchronization intuitively reflects the freezing–thawing process of soil. More details about the field monitoring test can be found in the literature of Cao et al. (2021).
Figure 12A shows the encapsulated PI-FBG humidity sensor that can be used for soil pore gas humidity measurement. There is a PI-coated FBG and an uncoated FBG inside the sensor. Two FBGs are passed through the two small holes reserved on the stainless-steel thread. Then, the top ends of two FBGs are fixed on the stainless-steel bracket with UV-curable adhesive, which ensures the influence of strain on FBGs is eliminated. Note that the two gratings should be placed at the same height to improve the accuracy of temperature compensation. Next, the two FBGs fixed on the stainless-steel bracket are protected with a 12-mm-diameter powder-sinter. The connection between stainless-steel probe and thread is fixed and sealed with epoxy resin adhesive to prevent water. On the one hand, the stainless-steel probe can protect the FBGs from damage in harsh environments and prevent water and fine soil particles from entering the probe. On the other hand, this structure can play a role in air permeability and water resistance without affecting the exchange of air humidity. Afterward, the two optical fibers are respectively sheathed with a 0.9 mm-diameter fiber casing and passed through a black polyethylene fiber casing with a diameter of 2 mm. There is a stainless-steel spiral armoring tube in the black polyethylene fiber casing to protect the optical fibers from physical damage. Finally, the stainless steel is sealed with a green rubber cap to prevent external water from penetrating.
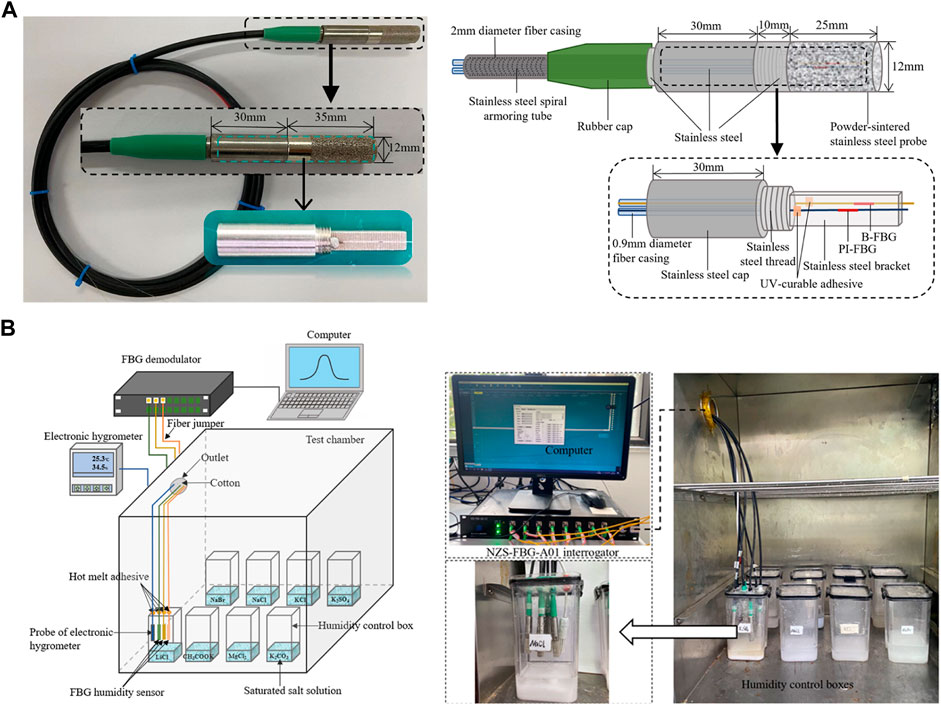
FIGURE 12. PI-FBG humidity sensor and calibration test device. (A) Inner structure of PI-FBG humidity sensor. (B) Calibration test device (Guo et al., 2021a; Guo et al., 2021b).
The structure of the OR-FBG humidity sensor is the same as that of the PI-FBG humidity sensor except that the FBG used for humidity sensing is coated with ORMOCER®. The performance comparison of the two humidity sensors is shown in Table 2. It can be seen from Table 2 that the humidity sensitivity of the PI-FBG humidity sensor is higher than that of the OR-FBG humidity sensor; and its response time is only half of that of the OR-FBG humidity sensor. It is worth noting that the humidity sensing characteristics of the PI-FBG humidity sensor are basically unchanged before and after immersion, and it can be used in high humidity or even with condensed water. However, the hysteresis and repeatability errors of the PI-FBG humidity sensor are higher than those of the OR-FBG humidity sensor. Therefore, it is recommended to select the type of humidity sensor according to site conditions. Moreover, the performance comparison of the proposed sensors with other optical sensing techniques can be found in the literature of Guo et al. (2021b).

TABLE 2. Performance comparison of the two humidity sensors (Guo et al., 2021a).
Figure 12B shows the calibration test device of the FBG humidity sensor. The saturated salt solution method is used to control the ambient relative humidity, and eight kinds of salts, such as LiCl, CH3COOK, MgCl2, K2CO3, NaBr, NaCl, KCl, and K2SO4, were selected to control different ambient humidity. The saturated salt solution should be fully stirred with a glass rod. Moreover, the supersaturated salt should be controlled to one third of the height of the salt solution to keep a supersaturated state no matter what the temperature is. Then, the prepared saturated salt solutions were sealed in the humidity control boxes, respectively. Next, the humidity control boxes were put into a test chamber with a temperature control accuracy of ±0.1°C. Subsequently, the FBG humidity sensors to be calibrated and an electronic hygrometer were introduced into the humidity control box and then were fixed and sealed at the top of the boxes with hot melt adhesive. The optical fibers were led out of the test chamber, and the outlet was sealed with cotton. In the end, the optical fibers were connected to the FBG demodulator (NanZee Sensing Technology Co. Ltd., China), and the Bragg wavelength data was recorded by the computer.
During the calibration test, the temperature was kept at 25°C first. After the wavelengths of the FBG humidity sensor were stable, the data of the FBG humidity sensor and electronic hygrometer in each humidity control box were recorded. Thus, the KRH in Eq. 7 can be obtained by taking the humidity data measured by the electronic hygrometer as the real value and combining the wavelength data measured by the FBG humidity sensor. Then, the humidity was kept unchanged, and the temperature was varied from 10°C to 60°C with steps of 10°C. At each temperature, the stable wavelengths of the FBG humidity sensor were recorded. Thus, the KT1 and KT2 in Eq. 7 can be obtained by fitting the relationship between wavelength and temperature.
Figure 13A shows the test device of the PI-FBG humidity sensor used in the unsaturated soil. Ten types of soil samples with different sand–kaolin mixing ratios were configured, and each type of soil sample was configured with different water content. Each soil sample was put into the test box in turn, and its dry density remained constant. The FBG humidity sensor embedded in soil was used to measure the pore gas humidity of each soil sample, and the tests were carried out at a constant temperature. An electronic hygrometer is placed around the soil sample to record the ambient temperature and humidity. During the humidity tests, the FBG demodulator (NanZee Sensing Technology Co. Ltd., China) recorded the wavelengths of the FBG humidity sensor after the temperature and humidity in each soil sample. Then, the soil pore gas humidity can be obtained according to the calibration results. After the test of each soil sample, three soil samples were taken around the humidity sensor to measure its real water content by the oven-drying method, and the average value was taken as the final water content.
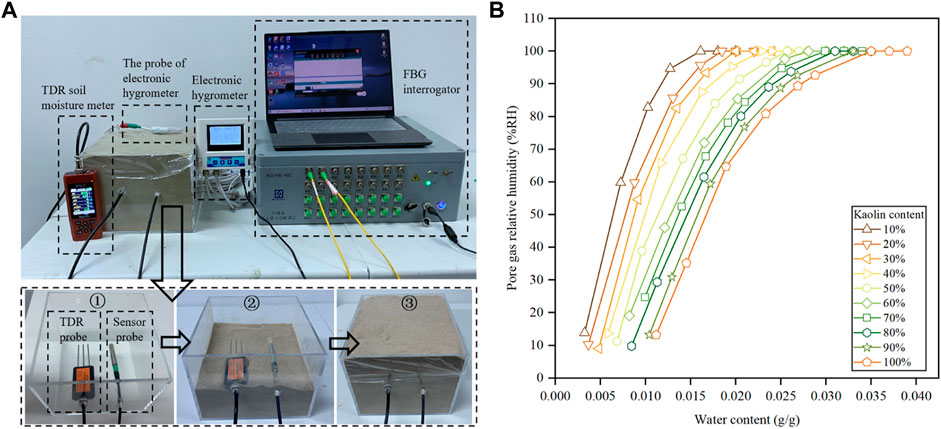
FIGURE 13. Test device and results of PI-FBG humidity sensor used in the unsaturated soil. (A) Test device. (B) Relationships between pore gas humidity and water content of ten sand-kaolin mixtures (Guo et al., 2021b).
Figure 13B shows the relationships between pore gas humidity and water content of 10 sand–kaolin mixtures. The pore gas humidity in different sand–kaolin mixtures shows the same trend with the change of water content, which can be divided into two stages: when the water content is low, the pore gas humidity is very sensitive to the water content, and it increases linearly with the increase of water content; when the water content becomes higher with the further increase of water content, the pore gas humidity increases slowly and keeps stable after reaching 100 %RH. The minimum soil water content corresponding to the humidity of 100 %RH is defined as w100%RH. The occurrence of w100%RH indicates that the pore gas humidity in the soil has reached saturation. It is worth noting that, under the same water content, the higher the kaolin content, the smaller the humidity in the soil and the greater the w100%RH. This is because clay has better water-holding capacity than sand. Therefore, the higher the kaolin content, the less free water in the soil pores and the lower the pore gas humidity. The laboratory test verifies the feasibility and applicability of the FBG humidity sensor for pore gas humidity measurement in unsaturated soil.
This paper systematically summarizes the innovative research work carried out by the authors’ group in the fiber-optic sensing technology for soil moisture field, including the AH-FBG and AH-DTS sensing technology for soil water content and a PI/OR-FBG sensing technology for soil pore gas humidity. These three technologies can realize large-scale, high-precision, distributed, and in situ monitoring of the soil water field, provide new technical means for the relevant research fields about the soil moisture (such as geotechnical engineering, soil, geology, environment, and hydrology), and promote further development of related research fields. Achieving large-scale and refined in situ monitoring is the highest goal of all measurement technologies. It is foreseeable that the fiber-optic sensing technology for soil moisture field will be further developed in the direction of integration, intelligence, networking, and miniaturization in the future.
For the fiber-optic sensing technology for soil water content, both the quasi-distributed AH-FBG sensing technology and the fully distributed AH-DTS sensing technology can realize the in situ monitoring of soil water content. Among them, the AH-FBG sensing technology has realized not only in situ but also remote and wireless monitoring of moisture content. However, the packaging materials (carbon fiber rod and corundum tube) used in the current AH-FBG sensors (CFHS and APHS) have poor shear resistance and are difficult to penetrate into deep soil, which limits the application of the two technologies in deep drill holes. Therefore, it is very necessary to develop a new fiber-optic sensor suitable for the soil water content measurement in drill holes. In the future, AHFO-FBG cables can be further developed because they do not have the problem of spatial resolution and are easy to deform concordantly with the soil. Moreover, AHFO-FBG cables can not only be installed in deep boreholes, but also be well coupled with the surrounding soil. The AH-DTS sensing technology has the special advantage of distributed and continuous measurement, however, it cannot realize remote and wireless monitoring at present. In the future, the development of the AHFO-DTS remote in situ monitoring system will be the focus of research.
As far as fiber-optic sensing technology for soil pore gas humidity is concerned, the feasibility has only been verified by laboratory tests. In the future, this technology will be further improved in the following two aspects. On the one hand, the PI/OR-FBG humidity sensors should be applied to the field tests to further verify their applicability for in situ soil pore gas humidity monitoring and be used to study the interaction between the in situ soil moisture field and the atmosphere. On the other hand, the theoretical and experimental verification of the PI/OR-FBG humidity sensor used in the suction measurement of unsaturated soils will be further improved so as to understand the soil moisture field from the perspective of soil suction.
M-YS and BS planned and conceptualized the work, drafted the manuscript. J-YG and H-HZ checked the manuscript. H-TJ and JL prepared the figures. G-QW and XZ provided support with referencing preparation.
This work was supported by the National Natural Science Foundation of China (42030701, 42177135), the Postgraduate Research and Practice Innovation Program of Jiangsu Province (KYCX21_0057) and the China Scholarship Council (202006190259). The authors also acknowledge the funding support from the Key Laboratory of Earth Fissures Geological Disaster, Ministry of Land and Resources (Geological Survey of Jiangsu Province).
G-QW was employed by the company Nanzee Sensing Technology Co., Ltd.
The remaining authors declare that the research was conducted in the absence of any commercial or financial relationships that could be construed as a potential conflict of interest.
All claims expressed in this article are solely those of the authors and do not necessarily represent those of their affiliated organizations, or those of the publisher, the editors and the reviewers. Any product that may be evaluated in this article, or claim that may be made by its manufacturer, is not guaranteed or endorsed by the publisher.
Benítez‐Buelga, J., Rodríguez‐Sinobas, L., Calvo, R. S., Gil‐Rodríguez, M., Sayde, C., and Selker, J. S. (2016). Calibration of Soil Moisture Sensing with Subsurface Heated Fiber Optics Using Numerical Simulation. Water Resour. Res. 52, 2985–2995. doi:10.1002/2015WR017897
Bittelli, M., Ventura, F., Campbell, G. S., Snyder, R. L., Gallegati, F., and Pisa, P. R. (2008). Coupling of Heat, Water Vapor, and Liquid Water Fluxes to Compute Evaporation in Bare Soils. J. Hydrol. 362, 191–205. doi:10.1016/j.jhydrol.2008.08.014
Cao, D.-F., Shi, B., Wei, G.-Q., Chen, S.-E., and Zhu, H.-H. (2018a). An Improved Distributed Sensing Method for Monitoring Soil Moisture Profile Using Heated Carbon Fibers. Measurement 123, 175–184. doi:10.1016/j.measurement.2018.03.052
Cao, D.-f., Shi, B., Zhu, H.-h., Inyang, H. I., Wei, G.-q., and Duan, C.-z. (2018c). A Soil Moisture Estimation Method Using Actively Heated Fiber Bragg Grating Sensors. Eng. Geology. 242, 142–149. doi:10.1016/j.enggeo.2018.05.024
Cao, D.-F., Zhu, H.-H., Wu, B., Wang, J.-C., and Shukla, S. K. (2021). Investigating Temperature and Moisture Profiles of Seasonally Frozen Soil under Different Land Covers Using Actively Heated Fiber Bragg Grating Sensors. Eng. Geology. 290, 106197. doi:10.1016/j.enggeo.2021.106197
Cao, D., Fang, H., Wang, F., Zhu, H., and Sun, M. (2018b). A Fiber Bragg-Grating-Based Miniature Sensor for the Fast Detection of Soil Moisture Profiles in Highway Slopes and Subgrades. Sensors 18, 4431. doi:10.3390/s18124431
Ciocca, F., Lunati, I., Van de Giesen, N., and Parlange, M. B. (2012). Heated Optical Fiber for Distributed Soil-Moisture Measurements: A Lysimeter experiment. Vadose Zo. J. 11 (4), 2344. doi:10.2136/vzj2011.0199
Gens, A., and Alonso, E. E. (1992). A Framework for the Behaviour of Unsaturated Expansive Clays. Can. Geotech. J. 29, 1013–1032. doi:10.1139/t92-120
Gil-Rodríguez, M., Rodríguez-Sinobas, L., Benítez-Buelga, J., and Sánchez-Calvo, R. (2013). Application of Active Heat Pulse Method with Fiber Optic Temperature Sensing for Estimation of Wetting Bulbs and Water Distribution in Drip Emitters. Agric. Water Manag. 120, 72–78. doi:10.1016/j.agwat.2012.10.012
Gunn, D. A., Chambers, J. E., Uhlemann, S., Wilkinson, P. B., Meldrum, P. I., Dijkstra, T. A., et al. (2015). Moisture Monitoring in clay Embankments Using Electrical Resistivity Tomography. Construction Building Mater. 92, 82–94. doi:10.1016/j.conbuildmat.2014.06.007
Guo, J.-Y., Shi, B., Sun, M.-Y., Cheng, W., Zhang, C.-C., Wei, G.-Q., et al. (2021b). Application of PI-FBG Sensor for Humidity Measurement in Unsaturated Soils. Measurement, 2021, 110415. doi:10.1016/j.measurement.2021.110415
Guo, J.-Y., Shi, B., Sun, M.-Y., Zhang, C.-C., Wei, G.-Q., and Liu, J. (2021a). Characterization of an ORMOCER-Coated FBG Sensor for Relative Humidity Sensing. Measurement 171, 108851. doi:10.1016/j.measurement.2020.108851
He, M., Wang, Y., Tong, Y., Zhao, Y., Qiang, X., Song, Y., et al. (2020). Evaluation of the Environmental Effects of Intensive Land Consolidation: A Field-Based Case Study of the Chinese Loess Plateau. Land use policy 94, 104523. doi:10.1016/j.landusepol.2020.104523
Heitman, J. L., Xiao, X., Horton, R., and Sauer, T. J. (2008). Sensible Heat Measurements Indicating Depth and Magnitude of Subsurface Soil Water Evaporation. Water Resour. Res. 44, W00D05. doi:10.1029/2008WR006961
Ma, P., Ke, H., Lan, J., Chen, Y., and He, H. (2019). Field Measurement of Pore Pressures and Liquid-Gas Distribution Using Drilling and ERT in a High Food Waste Content MSW Landfill in Guangzhou, China. Eng. Geology. 250, 21–33. doi:10.1016/j.enggeo.2019.01.004
Pastuszka, T., Krzyszczak, J., Sławiński, C., and Lamorski, K. (2014). Effect of Time-Domain Reflectometry Probe Location on Soil Moisture Measurement during Wetting and Drying Processes. Measurement 49, 182–186. doi:10.1016/j.measurement.2013.11.051
Read, T., Bour, O., Bense, V., Le Borgne, T., Goderniaux, P., Klepikova, M. V., et al. (2013). Characterizing Groundwater Flow and Heat Transport in Fractured Rock Using Fiber-Optic Distributed Temperature Sensing. Geophys. Res. Lett. 40, 2055–2059. doi:10.1002/grl.50397
Sayde, C., Buelga, J. B., Rodriguez-Sinobas, L., El Khoury, L., English, M., van de Giesen, N., et al. (2014). Mapping Variability of Soil Water Content and Flux across 1-1000 M Scales Using the Actively Heated Fiber Optic Method. Water Resour. Res. 50, 7302–7317. doi:10.1002/2013wr014983
Sayde, C., Gregory, C., Gilrodriguez, M., Tufillaro, N., Tyler, S., Giesen, N. Van. De., et al. (2010). Feasibility of Soil Moisture Monitoring with Heated Fiber Optics. Water Resour. Res. 46, 2840–2849. doi:10.1029/2009wr007846
Selker, J. S., Thévenaz, L., Huwald, H., Mallet, A., Luxemburg, W., van de Giesen, N., et al. (2006). Distributed Fiber-Optic Temperature Sensing for Hydrologic Systems. Water Resour. Res. 42, W12202. doi:10.1029/2006WR005326
Shi, B., Zhang, D., Zhu, H., Zhang, C., Gu, K., Sang, H., et al. (2021). DFOS Applications to Geo-Engineering Monitoring. Photonic Sens 11, 158–186. doi:10.1007/s13320-021-0620-y
Striegl, A. M., and Loheide, S. P. (2012). Heated Distributed Temperature Sensing for Field Scale Soil Moisture Monitoring. Groundwater 50, 340–347. doi:10.1111/j.1745-6584.2012.00928.x
Sun, M.-Y., Shi, B., Zhang, C.-C., Zheng, X., Guo, J.-Y., Wang, Y.-Q., et al. (2021). Quasi-distributed Fiber-Optic In-Situ Monitoring Technology for Large-Scale Measurement of Soil Water Content and its Application. Eng. Geology. 294, 106373. doi:10.1016/j.enggeo.2021.106373
Sun, M.-Y., Shi, B., Zhang, D., Liu, J., Guo, J.-Y., Wei, G.-Q., et al. (2020). Study on Calibration Model of Soil Water Content Based on Actively Heated Fiber-Optic FBG Method in the In-Situ Test. Measurement 165, 108176. doi:10.1016/j.measurement.2020.108176
Watanabe, K., and Wake, T. (2009). Measurement of Unfrozen Water Content and Relative Permittivity of Frozen Unsaturated Soil Using NMR and TDR. Cold Regions Sci. Technology 59, 34–41. doi:10.1016/j.coldregions.2009.05.011
Wu, B., Zhu, H.-H., Cao, D., Xu, L., and Shi, B. (2021). Feasibility Study on Ice Content Measurement of Frozen Soil Using Actively Heated FBG Sensors. Cold Regions Sci. Technology 189, 103332. doi:10.1016/j.coldregions.2021.103332
Wu, J.-h., Shi, B., Cao, D.-f., Jiang, H.-t., Wang, X.-f., and Gu, K. (2017). Model Test of Soil Deformation Response to Draining-Recharging Conditions Based on DFOS. Eng. Geology. 226, 107–121. doi:10.1016/j.enggeo.2017.04.025
Wu, R., Martin, V., McKenzie, J., Broda, S., Bussière, B., Aubertin, M., et al. (2020). Laboratory-scale Assessment of a Capillary Barrier Using Fibre Optic Distributed Temperature Sensing (FO-DTS). Can. Geotech. J. 57, 115–126. doi:10.1139/cgj-2018-0283
Zhao, Y., Wang, Y., Wang, L., Zhang, X., Yu, Y., Jin, Z., et al. (2019). Exploring the Role of Land Restoration in the Spatial Patterns of Deep Soil Water at Watershed Scales. CATENA 172, 387–396. doi:10.1016/j.catena.2018.09.004
Zhou, X., Zhou, J., Kinzelbach, W., and Stauffer, F. (2014). Simultaneous Measurement of Unfrozen Water Content and Ice Content in Frozen Soil Using Gamma ray Attenuation and TDR. Water Resour. Res. 50, 9630–9655. doi:10.1002/2014WR015640
Zhu, H.-H., Wu, B., Cao, D.-F., Zhang, C.-X., and Shi, B. (2021). Monitoring of Soil Moisture and Temperature Distributions in Seasonally Frozen Ground with Fiber Optic Sensors. Proc. 11th Conf. Asian Rock Mech. Soc. Old Reg. Sci. Technol IOP Conf. Ser.: Earth Environ. Sci. 861, 042042. doi:10.1088/1755-1315/861/4/042042
Keywords: soil moisture field, soil water content, soil pore gas humidity, fiber-optic sensing technology, sensor development, application
Citation: Sun M-Y, Shi B, Guo J-Y, Zhu H-H, Jiang H-T, Liu J, Wei G-Q and Zheng X (2022) Development and Application of Fiber-Optic Sensing Technology for Monitoring Soil Moisture Field. Front. Sens. 2:796789. doi: 10.3389/fsens.2021.796789
Received: 17 October 2021; Accepted: 18 November 2021;
Published: 14 January 2022.
Edited by:
Luca Schenato, National Research Council (CNR), ItalyReviewed by:
Asrul Izam Azmi, University Technology Malaysia, MalaysiaCopyright © 2022 Sun, Shi, Guo, Zhu, Jiang, Liu, Wei and Zheng. This is an open-access article distributed under the terms of the Creative Commons Attribution License (CC BY). The use, distribution or reproduction in other forums is permitted, provided the original author(s) and the copyright owner(s) are credited and that the original publication in this journal is cited, in accordance with accepted academic practice. No use, distribution or reproduction is permitted which does not comply with these terms.
*Correspondence: Bin Shi, c2hpYmluQG5qdS5lZHUuY24=
Disclaimer: All claims expressed in this article are solely those of the authors and do not necessarily represent those of their affiliated organizations, or those of the publisher, the editors and the reviewers. Any product that may be evaluated in this article or claim that may be made by its manufacturer is not guaranteed or endorsed by the publisher.
Research integrity at Frontiers

Learn more about the work of our research integrity team to safeguard the quality of each article we publish.