- 1Insight Centre for Data Analytics, National Centre for Sensor Research, School of Chemical Sciences, Dublin City University, Dublin 9, Ireland
- 2Institute for the Study of Anthropic Impacts and Sustainability in the Marine Environment, National Research Council, Oristano, Italy
A portable sensing platform for the detection of nutrients (PO43−, NO2−, NO3−) in natural waters has been realized through the use of rapid prototyping techniques, colorimetric chemistries, electronics, and LED-based optical detection. The sensing platform is modular in design incorporating interchangeable optical detection units, with a component cost per unit of ca. €300, and small form factor (20 cm × 6 cm x 3.5 cm). Laboratory testing and validation of the platform was performed prior to deployment at the CNR Dirigibile Italia Arctic Research Station, Ny-Aselund (79°N, 12°E). Results obtained showed excellent linear response, with a limit of detection of 0.05 μM (NO2−, NO3−), and 0.03 μM (PO43−). On the June 22, 2016 a field campaign took place within Kongsfjorden, Ny-Aselund (78.5–79°N, 11.6–12.6°E), during which 55 water samples were acquired using 10 L Niskin bottles on board the MS Teisten research vessel. 23 hydrological casts were also performed using a Seabird 19plus V2 SeaCAT Profiler CTD probe with turbidity and dissolved oxygen sensors. Water samples were subsequently analyzed for PO43−, NO2−, NO3− at the CNR Dirigibile Italia Arctic Research Station Laboratory using the adaptive sensing platform. Nutrient concentrations were compared to hydrological data to assess the processes that influence the nutrient concentrations within the Fjord. This research highlights the potential use of the adaptive sensing platform in remote locations as a stand-alone platform and/or for the validation of deployable environmental sensor networks.
Introduction
Nutrients such as phosphate (PO43−), nitrite (NO2−), and nitrate (NO3−) are central in many environmental processes within the marine environment (Wurtsbaugh et al., 2019) (McCaul et al., 2016), including several critically important microbial, plant and animal metabolic processes as highlighted by the Global Ocean Observing System (GOOS), who have identified nutrients as an Essential Ocean Variable (EOV) (Muller-Karger et al., 2018). Within the Arctic region, the GOOS increasingly supports monitoring of primary nutrient production, as a result of the melting of sea ice (Aliani et al., 2016). Cantoni et al. (2020) reported that the concentration of nutrients in seawater in a fjord can be strongly related to the amount of the run-off from tide water glaciers. As tidewater glaciers are the main source of meltwater discharge, the highest nutrient concentration should be found at their leading edge (Bazzano et al., 2017). Therefore the concentration and extent of nutrients in the water masses inside the fjord can also be attributed to direct influences on key characteristics within the fjord system, similar to suspended particulate matter concentrations, which include: 1) the extent of the euphotic zone and its consequence for primary production; 2) heat exchange with the atmosphere and mixing of water masses; 3) flocculation of colloids and aggregation of particles (influence on carbon flux); 4) direct impact on organisms living in the water column; 5) physical–chemical and geotechnical properties of the sea floor (Cloern, 2001).
The measurement of nutrients in the marine environment is more complicated than tracking physical parameters (e.g., temperature, salinity, pH), but despite this, they have been amongst the major observational variables in several international global ocean expeditions since the 1970s (Becker et al., 2020). Currently, most marine nutrient measurements are determined using manual sampling with transport and subsequent laboratory-based analysis. This often occurs in remote locations, which can lead to prolonged storage and transport, and associated loss of sample integrity and measurement uncertainties. This has undoubtedly encouraged interest in autonomous, in-situ sensing as this in principle offers a route to lower cost measurements with enhanced analytical relevance. (Bindoff et al., 2007). However considerable work is still required before current technologies are able to operate for long periods of time in remote and extreme conditions. The development of portable, low maintenance, cost-effective instrumentation for nutrient analysis capable of operation in these locations provides an opportunity to enhance our understanding of global nutrient distribution (Ribotti et al., 2015); (Donohoe et al., 2018; Hering et al., 2010). In order to support the implementation of European Union marine policies such as the Marine Strategy Framework Directive (MSFD) and the Common Fisheries Policy (CFP) the European FP7 project COMMON SENSE aimed to develop cost-effective, easy to use, sensitive sensors for environmental monitoring (Ribotti et al., 2015). One of the core research goals was to develop cost-effective sensors to increase the availability of standardised data on eutrophication (Padedda et al., 2019) in European marine regions and sub-regions.
Herein, we present a cost-effective, reliable bench top sensing platform for the measurements of key nutrients within the marine and freshwater environments which was developed through the COMMONSENSE project. The sensing platform was developed through the use of rapid prototyping such as FDM (Fused deposition modelling) and laser ablation, colorimetric reagent chemistries, LED (Light Emitting Diode) based optical detection. Samples were acquired in June 2016 in the Kongsfjorden, an inlet on the west coast of the Norwegian Spitsbergen Island, part of the Svalbard archipelago in the Arctic Ocean and measured on the benchtop platform at the Dirigibile Italia Arctic Research Station in Ny-Alesund.
Materials and Methods
Sample Site and Oceanography
Kongsfjorden (78.5–79°N, 11.6–12.6°E) is a fjord located in the north western part of the of the Norwegian Svalbard archipelago (Figure 1). It is approximately 20 km long, elongated northwest-southeast with a width varying from 4 to 10 km at its outer mouth. The bathymetry within the fjord varies from <100 m in the inner fjord east of the Lovénøyane and >400 m at its outer part. Glacier ablation, ice calving, snowmelt, and summer rainfall are the main sources for freshwater run-off (Svendsen et al., 2002). Within the Fjord there are strong influences of the subglacial meltwater from the four tidewater glaciers: Kronebreen, Kongsvegen at its head, Conwaybreen and Blomstrandbreen on its northern coast. These tidewater glaciers are also reported to be the main source of sedimentation (Svendsen et al., 2002). The circulation of the freshwater runoff, once it has reached the Kongsfjorden basin, is influenced by a number of factors such as tidal variation, meteorological conditions, subsurface currents and surface winds. Offshore circulation interacts with the hydrology inside the fjord and is constituted by the warm and salty Atlantic Water (AW, Ɵ > 3°C, SA > 34.65 g/kg and σθ < 27.92 kg/m3) that is carried along the coast of Spitsbergen by the West Spitsbergen Current (WSC).
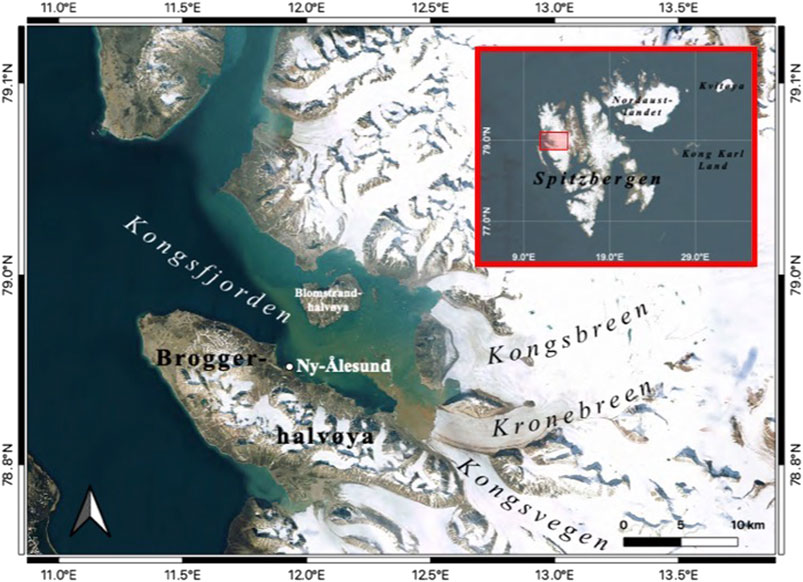
FIGURE 1. Detail of the north western part of the of the Norwegian Svalbard archipelago (inset) showing the locations of Kongsfjorden (78.5–79°N, 11.6–12.6°E) fjord, and the Kongsbreen, Kronebreen and Kongsvegen glaciers.
In summer it is mixed with Arctic water masses on the West Spitsbergen shelf and then advected inside the fjord as Transformed Atlantic Water (TAW), with characteristics and volume that significantly vary from year-to-year (TAW, Θ = 1.0–3.0°C, SA > 34.65 g/kg and σθ < 27.92 kg/m3; (Stefano Aliani et al., 2016; Svendsen et al., 2002); (Hodal et al., 2012; Bazzano et al., 2017). In a simple two-layer system inside the fjord, TAW is close to the bottom with relatively cold, less salty water of polar origin above (Cottier et al., 2005). In the inner fjord and in the deep and bottom layer, two other waters masses are described by (Svendsen et al., 2002): the very cold and low saline Local Water (LW, Θ < 1.0°C) originated inside the fjord in autumn/winter due to conventional processes that sink water passing in front of glaciers; the Winter Cooled Water mass (WCW; T < −0.5°C, S > 34.56 g/kg) then sinks, filling the depressions on the bottom in front of glaciers. WCW is the result of a deep convection on very cold and dense water due to winter cooling and sea ice formation (Svendsen et al., 2002). Cottier et al. (2005) identified two additional water masses named Surface Water (SW, Θ > 1.0°C, SA < 34.00 g/kg) and Intermediate Water (IW, Θ > 1.0°C, SA = 34.00–34.65 g/kg). The SW spreads over the LW and is produced by glacial melting. This several metres-thick layer decreases as it moves from the inner part of the fjord to its mouth. The drivers of circulation in the inner Kongsfjorden are wind, basin oscillations due to changes in pycnocline and glacier discharge that creates a very stable stratification, but also fronts and small-scale turbulent eddies a few meters in diameter and vortex filaments in front of glaciers (Svendsen et al., 2002). Winds mainly act on the sea surface. In case of cross-shore winds there is an induced tilt in the free surface and the strong pycnocline, that separates the circulation of upper layers from deeper ones, but the total volume of water in the fjord remains constant. On the contrary, with alongshore winds the free surface at the mouth of the fjord drives either a baroclinic outflow (i.e., toward the fjord mouth) of waters or an inflow (i.e. toward the glacier front) (Stefano Aliani et al., 2016; S. Aliani et al., 2004). In summer and in a relatively ice-free environment, the general circulation of the water masses inside the fjord is anticlockwise with warm and salty mainly TAW and less AW entering from the outer fjord, reaching the tidewater glaciers Kronebreen-Kongsvegen. Then they move cooler and less salty north-westward along the coast east of the Lovénøyane shoals and exit in the outer fjord between the Blømstrand island and the northern coast, constrained by topography, with velocities less than 8–10 cm/s (Aliani et al., 2016; Svendsen et al., 2002; Aliani et al., 2004). Nutrient availability is one of the most direct mechanisms by which glacial discharge affects primary productivity of phytoplankton in polar regions (Hodal et al., 2012). Within Arctic regions most glacial discharge enters the ocean through fjord systems and as such these marine settings are heavily influenced by glacial runoff, and that is set to increase in the near future due to climate change. Consequently, there is a pressing need to generate robust in-situ analytical measurements on a continual basis at multiple locations to provide data on the ever-changing chemistries not only in Arctic waters but also on a global scale. Sample locations within the fjord are shown in Figure 2, water samples were acquired using 10 L Niskin bottles on board the MS Teisten research vessel, hydrological casts were also performed using a Seabird 19plus V2 SeaCAT Profiler CTD probe with turbidity and dissolved oxygen sensor (Figure 3).
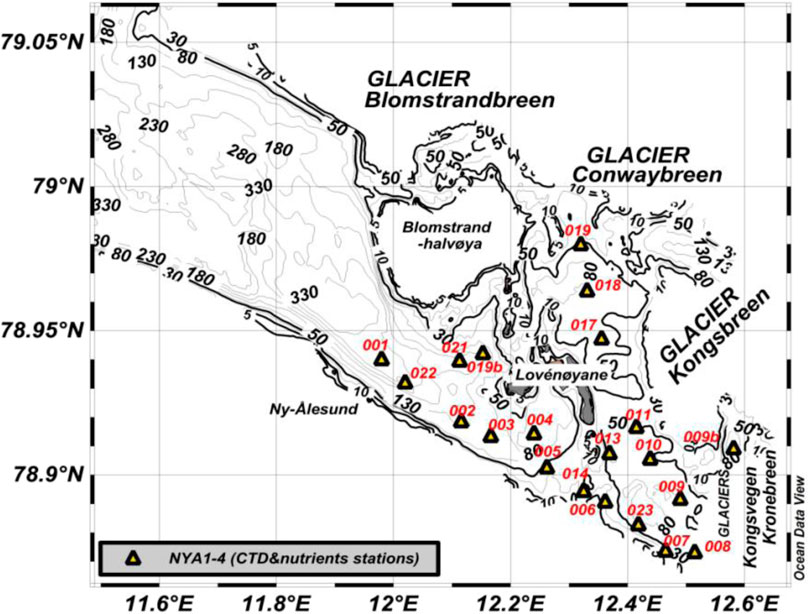
FIGURE 2. Map of Kongsfjorden showing each sampling point, depths (m) and glacier locations within the fjord generated using Ocean Data View Software.
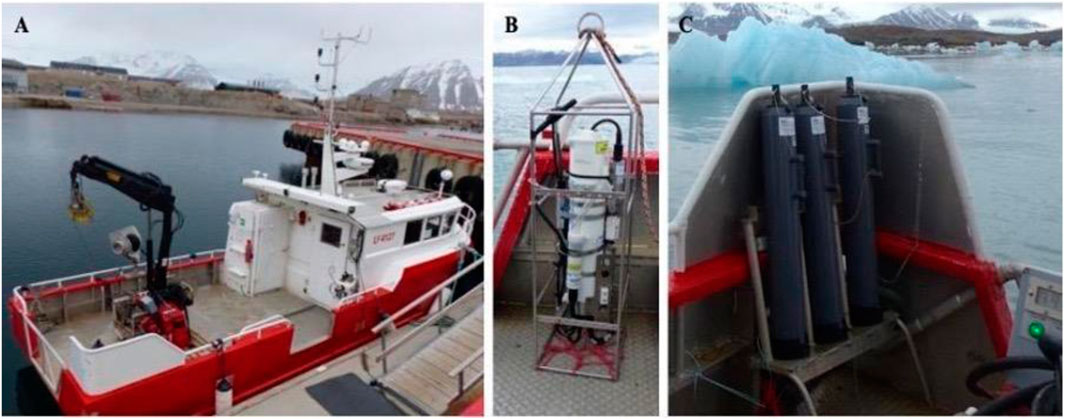
FIGURE 3. Images of (A) the MS Teisten, (B) SBE19 Plus Probe (ISMAR, Bologna, Italy) used for conductivity, temperature, depth and turbidity analysis, (C) Niskin bottles used for water collection.
Platform Design and Fabrication
Electronic Control was achieved via an Arduino Mega 2,560 microcontroller board (Radionics, Ireland). Raw data in BIT values were displayed on an LCD (Radionics, Ireland) while an 8 GB SD card was connected via a Data Logger. The LED intensity within the platform was controlled using a PWM (Pulse Width Modulation) driver, which enabled the intensity of the LED for the chosen colorimetric method to be optimised. The benchtop sensing platform shown in Figure 4 was developed as a low-cost sensing platform for the detection of NO2−, NO3− and PO43− in natural waters. The platform was fabricated using 4 mm thick black polymethylmethacrylate (PMMA) panels which were laser cut using an Epilog Zing Laser cutter and PMMA was solvent bonded together using 1,2-Dichloroethane (Sigma Aldrich). The sensing platform (20 cm × 6 cm x 3.5 cm) comprised of four detection chambers: chamber one and two for the detection of PO43− and chamber three and four for detection of NO2− and NO3−. LEDs were selected based on the lambda max (λmax) specific for each colorimetric chemistry (Donohoe et al., 2018; García-Robledo et al., 2014), optical detection within each chamber was achieved using a 375 nm LED (Roithner, Wien, Austria) for PO43− and 540 nm LED (Roithner, Wien, Austria) for both NO2− and NO3−. The photodiode (PD) (Roithner, Wien, Austria) was used for absorbance detection in all chambers.
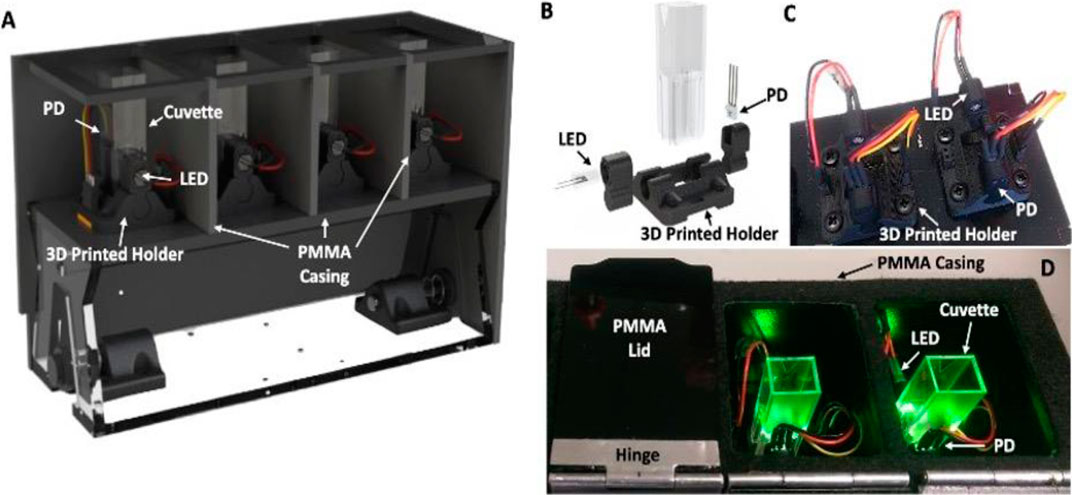
FIGURE 4. (A) Rendered image of the sensing platform, the front and side have been removed to show internal details, the platform houses four chambers: chambers one and two for the detection of PO43- and chambers three and four for the detection of NO2− and NO3−, (B) Exploded view of the detection cell showing the microcuvette, the 3D printed holder, the LED and Photodiode (PD), (C) Image of the 3D printed holder, with the LED and photodiode, (D) Image of the platform showing the PMMA lid and two chambers for NO2− and NO3− detection (540 nm).
The alignment of the LED and photodiode was achieved through a 3D printed (Stratasys Objet260 Connex1) custom designed holder, through which the LED photodiode was easily removed and replaced while maintaining alignment (Figures 4C,D). This improved detector stability, while also reducing unit cost and simplifying servicing of the detection unit which is critical during field deployments in remote locations.
Analytical Methods
The analytical performance of the sensing platform was evaluated using test solutions of known concentrations of NO2−, NO3− and PO43− (0–20 μM). All reagents and test solutions were prepared using ultra high purity (UHP) water (MilliQ, Millipore, Burlington, MA, United States) and analytical grade chemicals (Sigma Aldrich, St. Louis, MO, United States). For NO2− analysis, 900 μL of sample and test solutions were transferred to 1.5 ml Eppendorf vials. 50 μL of Griess reagent was then added to the vials and the sample was mixed and the resulting solution was left at room temperature (approx. 20°C) for 20 min. For the determination of NO3−, 100 μL of VCl3 (García-Robledo et al., 2014) was added to 900 μL of sample and test solutions. The resulting solutions were then incubated at 60°C for 20 min. PO43− analysis was performed using equal volumes (1:1) of yellow reagent (Donohoe et al., 2018) samples and test standard solutions. For each test solution measurements, an associated blank measurement was obtained all samples were transferred to micro cuvettes with a 1 cm path length and measured on the benchtop platform. The resulting data was converted to absorbance using the Beer-Lambert equation:
where A is absorbance, Io the blank intensity, and I is the standard intensity.
Results
Analytical Performance
Figure 5 presents the linear calibrations generated from the validation of the colorimetric chemistries in each chamber of the sensing platform. These results demonstrate that the benchtop sensing platform achieved excellent correlations for all linear calibrations within each chamber; chamber one and two; 0.0–20 μM PO43− (R2 = 0.999), chamber three; 0–10 μM NO2− (R2 = 0.999), chamber four; 0–10 μM NO3− (R2 = 0.999), the tightness of the error bars in all cases indicates the excellent precision of each method. The limit of detection (LOD) of the sensing platform was estimated using three times the standard deviation (n = 10) of the lowest concentration test solution, corrected with the blank measurement and was found to be 0.05 μM for NO2− and NO3−, and 0.03 μM for PO43−.
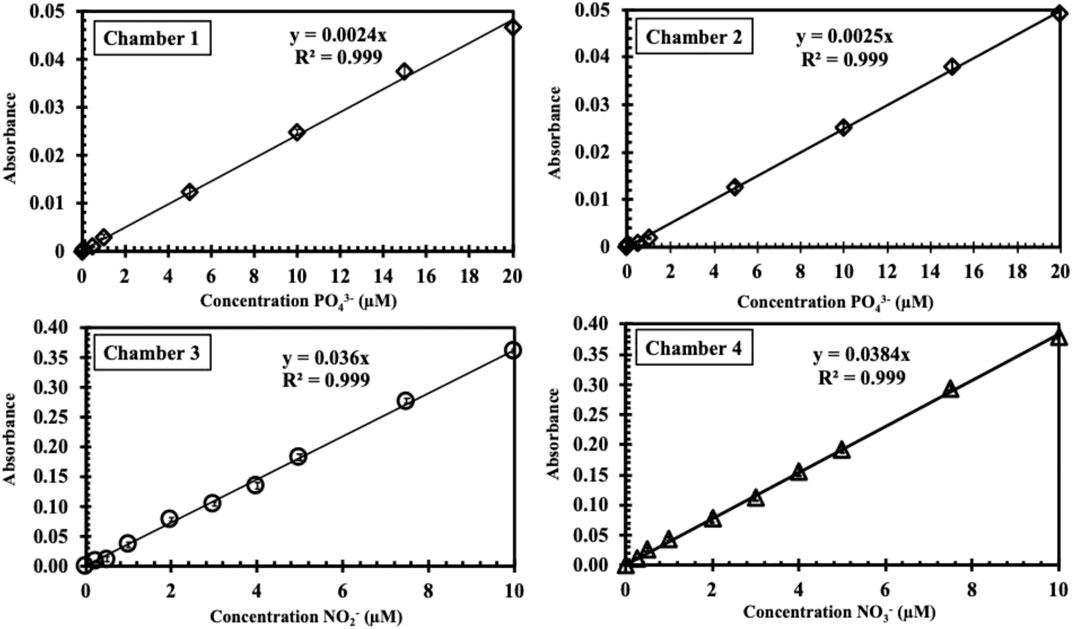
FIGURE 5. Linear calibration curves for the detection of PO43− (0-20 μM) on the benchtop sensing platform in chamber one and chamber two and for the detection of NO2−, NO3− (0-10 μM) in chamber three and chamber.
In-situ Data Acquisition
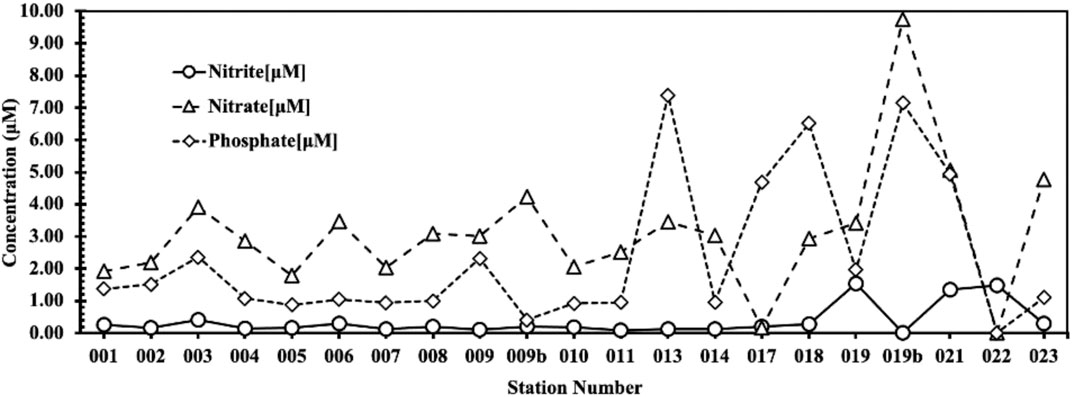
During a cruise in Kongsfjorden on the June 22, 2016 a total of 55 water samples (10 ml aliquots) were acquired for nutrient analysis using 10 L Niskin bottles. Water samples were acquired from the surface <1 m, middle and bottom depths depending on the sample station. A total of 23 hydrological casts were performed using a Seabird 19plus V2 SeaCAT Profiler CTD probe with turbidity and dissolved oxygen sensors. Using the Seabird 19plus V2 SeaCAT vertical profiles were performed with a frequency of 1 Hz, from the surface to the bottom and the data was download at the end of the cruise. Nutrient concentrations found in surface samples (<0.5 m) are shown in Figure 6). Nutrient concentrations varied throughout the fjord depending on the depth and influences (e.g, Atlantic waters, glacial melt, suspended solids) associated with location of the sampling station. In surface samples (<0.5 m), elevated nutrient values were observed south and east of Blomstrand Island (019; 9.74 μM NO3−, 7.14 μM PO43−, 018; 6.54 μM PO43−, 013; 7.39 μM PO43−).
At the southern-most part of the fjord, nearest the Kronebreen-Kongsvegen glacial fronts at station 009b (see Figure 7), NO3− concentrations increased with depth in samples analysed from the <0.5 m (4.23 μM NO3−) to 50.0 m (9.54 μM NO3−) and 101.1 m (9.94 μM NO3−). At the time of sampling cast 009b was located in front of the Kongsbreen glacier inside a depression of a semi-closed bay with a maximum depth of 105 m . When compared to the hydrological data, the NO3− concentrations recorded coincided with high turbidity values (22.29 NTU), low potential temperature and high absolute salinity (Θ = 0.19°C, SA < 34.83 g/kg) that is associated with the WCW (Figure 7). These elevated turbidity values could possibly be attributed to the sinking of suspended solids of glacier origin from the surface as a turbidity value of 22.29 NTU was recorded at a depth of 2 m at the same station, where a water mass was physically identifiable from the ΘS as SW (Figure 7).
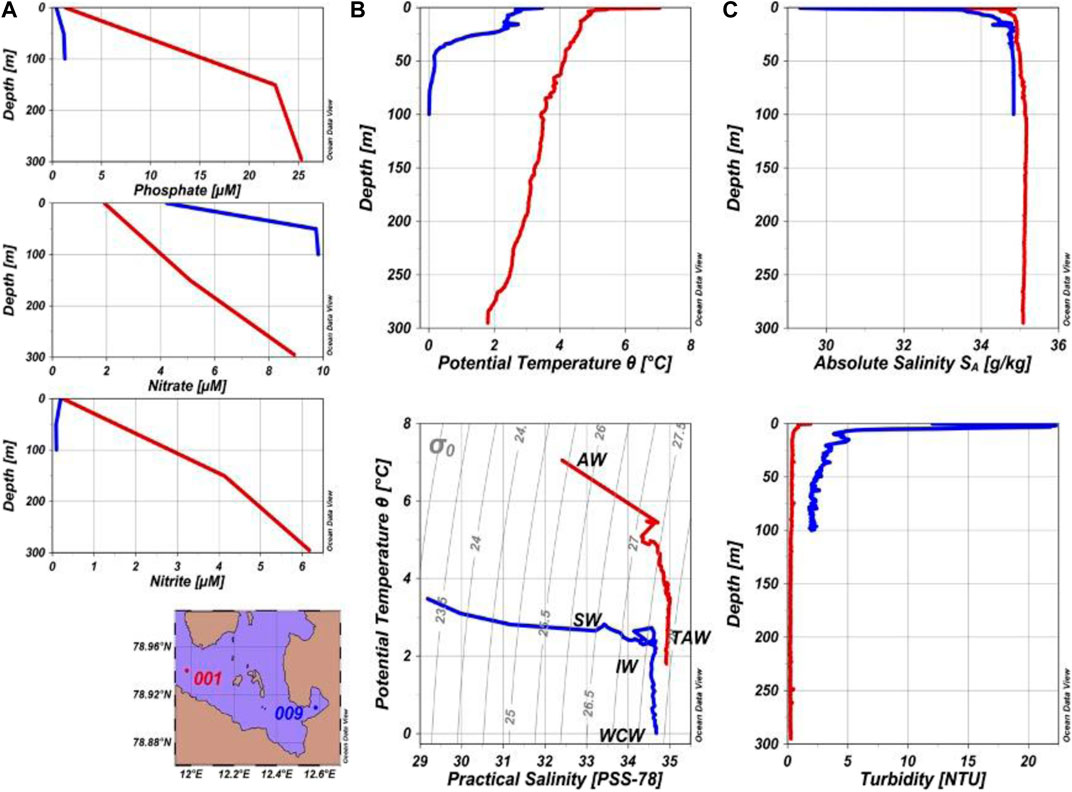
FIGURE 7. Nutrient profiles (A) and hydrological profiles (B), (C) of the two casts 001 (red) and 009b (blue) during the sampling campaign on June 22, 2016.
In the outer region of the fjord at the station 001, samples also show an increase in NO2−, NO3− and PO43− concentrations with increasing depth from <0.5 m (4.14 μM NO2–, 0.17 NO3− μM, 1.37 μM PO43−) to 150.83 m (4.14 μM NO2−, 5.10 NO3− μM, 22.63 μM PO43−) and 290 m (6.43 μM NO2−, 8.48 NO3− μM, 25.83 μM PO43−) (Figure 7). To further investigate the change in nutrient concentration and hydrological data with depth, Figure 8 shows a transect along the coast from the outer fjord (001) to the inner fjord (008). ODV maps show that waters close to the Kronebreen-Kongsvegen glaciers are characterized by lower temperature and salinity, as would be expected. Towards the outer section of the fjord, increasing salinity is most likely due to the influence of Atlantic waters. As depth increases, so does NO3− concentration, with maximum values occurring close to the bottom from the inner to the outer fjord, while temperature decreases. Concentrations of NO2− and PO43− do not follow the same trend and show a uniform distribution in the fjord except for station 001 where both concentrations were significantly elevated (22.63 μM PO43− compared to the average of all the other stations of 2.68 μM; and 4.14 μM NO2− compared to the average of 0.36 μM). This increase of phosphate and nitrites at 001 may arise from the anticlockwise summer circulation described by (Svendsen et al., 2002; Aliani et al., 2016; Poll et al., 2021).
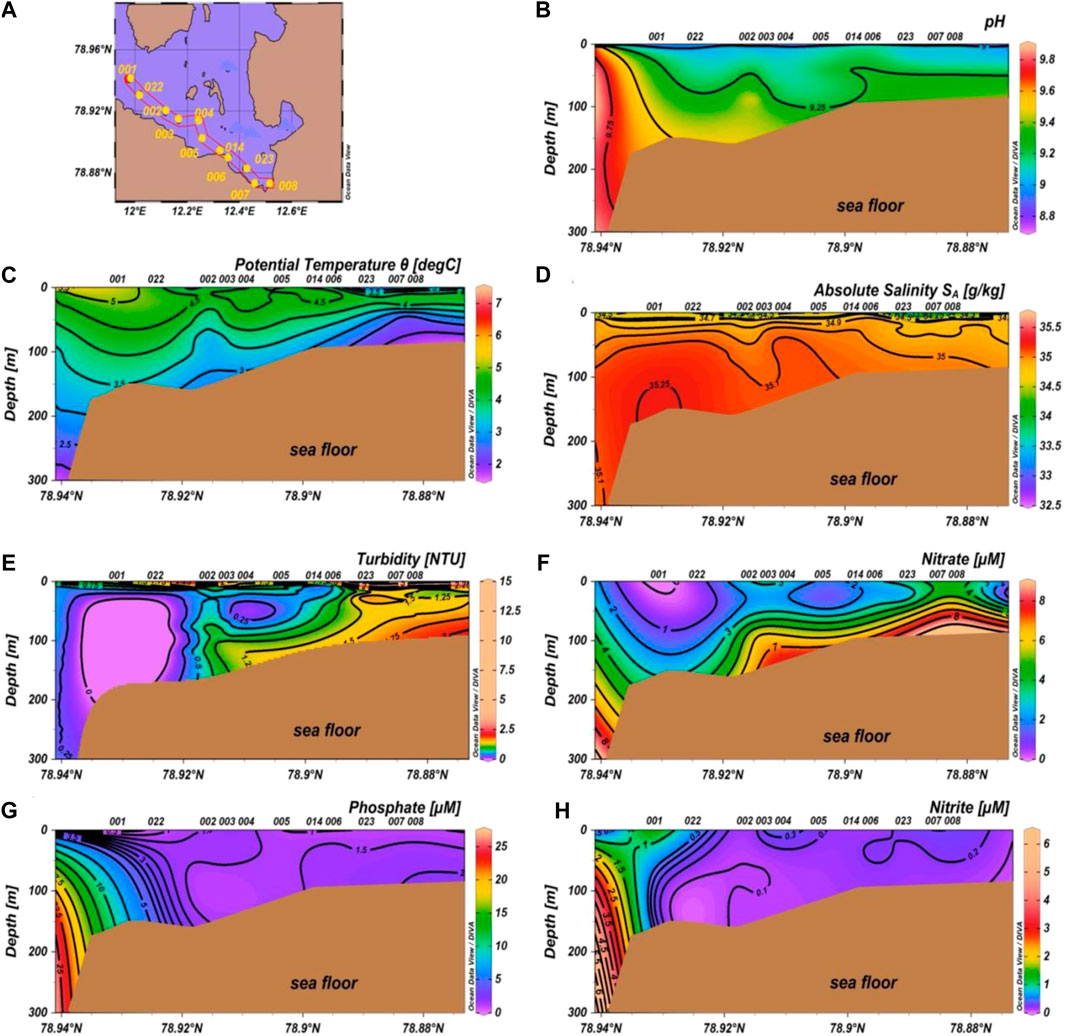
FIGURE 8. Maps showing nutrient and hydrological data obtained at different depths along a transect from the sampling station 001 to 008.
Discussion
Characterising the distribution of nutrients is essential for understanding and protecting marine habitats. Nutrient availability is one of the most direct mechanisms by which glacial discharge affects marine primary productivity in polar environments (Hopwood et al., 2020) In the Arctic and Sub-Antarctic most, glacial discharge enters the ocean through fjord systems. As such, these marine settings are heavily influenced by glacial runoff, a process which is expected to continue increasing due to rising global temperatures (Cantoni et al., 2020). Eventually, the marine terminating glaciers Kronebreen and Kongsvegen within Kongsfjorden, are expected to become land-terminating, further altering the nutrient balance in this ecosystem (Halbach et al., 2019) This necessitates the ability to routinely provide robust measurements of water quality parameters on an almost constant basis. Traditional instrumentation for the analysis of nutrients like NO2−, NO3− and PO4− are expensive to purchase and transport to remote locations. The ability to analysis the samples onsite removes the need to treat and store the samples for subsequent analysis which can impact the sample integrity (Kalkhajeh et al., 2019; Bowden and Diamond 2003; García-Robledo, 2014; Gordon et al., 1993). The low-cost sensing platform presented in this study enables highly accurate and sensitive analytical measurements for nutrients to be made simply and rapidly. The platforms analytical performance combined with its robustness and portability make the transport and use in remote locations with complex logistics a reality. The modular design incorporates easily interchangeable optical detection units, which will allow for detection of most colorimetric reagent-based assays as the LEDs and PD can be easily replaced, the 3D printed holder ensures continued alignment and eliminate movement artifacts. 56 water samples acquired during sampling campaign on June 22nd, 2016, were analysed using the platform and combined with hydrological data acquired during the same sampling campaign. The combined results showed an increased in nutrient concentrations with turbidity at glacial fronts in surface measurements at the inner Fjord and in the outer Fjord with an increase in depth (Figures 7, 8). The results were obtained were during a sampling campaign and represent only a snapshot of the processes within the fjord, more detailed sampling campaign similar to that performed by Cantoni et al. (2020) is necessary to further elucidate the highly variable nature of nutrient distribution within the Fjord. While the ultimate objective is to provide fully autonomous cost-effective sensors, the technology presented in this study is an important step towards the development and validation of autonomous sensing networks. Reliable in situ operation of autonomous sensors depends on effective continuous functioning of each component within the platform used to generate the analytical response. Since completing this study, we have utilized and adapted the sensing platform presented in this study to test and validate optical components, 3D printed structures, and fluidics which have been integrated into fully autonomous sensing platforms. Through the European HOLIFAB project (H2020-NMBP-PILOTS-2017) we have incorporated emerging fabrication technologies to enhance the analytical performance, reduce costs and advance the development of in-situ chemical sensors that are analytically reliable and work autonomously for a period of weeks/months.
Data Availability Statement
The original contributions presented in the study are included in the article/Supplementary Material; further inquiries can be directed to the corresponding author.
Author Contributions
MM: Project management, platform development, data analysis, fieldwork, manuscript preparation. AR: Field Scientific Co-ordinator, in-situ hydrological data acquisition, data analysis, and manuscript preparation. AS: technical instruments preparation, fieldwork, manuscript verification. SJ: Sensor testing, validation, data analysis, fieldwork, and manuscript preparation. DD: COMMON SENSE project DCU P.I. manuscript preparation. PM: COMMON SENSE project CNR P.I. manuscript preparation. EM Nutrient sensor development and validation.
Funding
This work was carried out with substantial contributions of the EU-funded FP7 project COMMON SENSE (Grant agreement No 614155), the availability of the CNR Dirigibile Italia Arctic Station and its laboratory managed by the Italian National Research Council (CNR) and the facilities of the international scientific base in Ny-Ålesund (Svalbard, Norway). 3D printing was carried out at the Nano Research Facility in Dublin City University, which was funded under the Programme for Research in Third Level Institutions (PRTLI) Cycle 5. Insight (INSIGHT Centre, Grant number SFI/12/RC/2289).
Conflict of Interest
The authors declare that the research was conducted in the absence of any commercial or financial relationships that could be construed as a potential conflict of interest.
Publisher’s Note
All claims expressed in this article are solely those of the authors and do not necessarily represent those of their affiliated organizations, or those of the publisher, the editors and the reviewers. Any product that may be evaluated in this article, or claim that may be made by its manufacturer, is not guaranteed or endorsed by the publisher.
References
Aliani, S., Bartholini, G., Degl'innocenti, F., Delfanti, R., Galli, C., Lazzoni, E., et al. (2004). Multidisciplinary Investigations in the Marine Environment of the Inner Kongsfiord, Svalbard Islands (September 2000 and 2001). Chem. Ecol. 20 (Suppl. 1), S19–S28. doi:10.1080/02757540410001655396
Aliani, S., Sciascia, R., Conese, I., D’Angelo, A., Del Bianco, F., Giglio, F., et al. (2016). Characterization of Seawater Properties and Ocean Heat Content in Kongsfjorden, Svalbard Archipelago. Rend. Fis. Acc. Lincei 27 (S1), 155–162. doi:10.1007/s12210-016-0544-4
Bazzano, A., Ardini, F., Terol, A., Rivaro, P., Soggia, F., and Grotti, M. (2017). Effects of the Atlantic Water and Glacial Run-Off on the Spatial Distribution of Particulate Trace Elements in the Kongsfjorden. Mar. Chem. 191, 16–23. doi:10.1016/j.marchem.2017.02.007
Becker, S., Aoyama, M., Woodward, E. M. S., Bakker, K., Coverly, S., Mahaffey, C., et al. (2020). GO-SHIP Repeat Hydrography Nutrient Manual: The Precise and Accurate Determination of Dissolved Inorganic Nutrients in Seawater, Using Continuous Flow Analysis Methods. Front. Mar. Sci. 7, 581790. doi:10.3389/fmars.2020.581790
Bindoff, N. L., Willebrand, J., Artale, V., Cazenave, A., Gregory, J. M., Gulev, S., et al. (2007). “Observations: Oceanic Climate Change and Sea Level,” in Climate Change 2007: The Physical Science Basis. Editors L. Labeyrie, and D. Wratt. Cambridge University Press 48, 385–432.
Bowden, M., and Diamond, D. (2003). The Determination of Phosphorus in a Microfluidic Manifold Demonstrating Long-Term Reagent Lifetime and Chemical Stability Utilising a Colorimetric Method. Sensors Actuators B: Chem. 90 (1–3), 170–174. doi:10.1016/S0925-4005(03)00024-8
Cantoni, C., Hopwood, M. J., Clarke, J. S., Chiggiato, J., Achterberg, E. P., and Cozzi, S. (2020). Glacial Drivers of Marine Biogeochemistry Indicate a Future Shift to More Corrosive Conditions in an Arctic Fjord. J. Geophys. Res. Biogeosci. 125 (11). doi:10.1029/2020JG005633
Cloern, J. (2001). Our Evolving Conceptual Model of the Coastal Eutrophication Problem. Mar. Ecol. Prog. Ser. 210, 223–253. doi:10.3354/meps210223
Cottier, F., Tverberg, V., Inall, M., Svendsen, H., Nilsen, F., and Griffiths, C. (2005). Water Mass Modification in an Arctic Fjord through Cross-Shelf Exchange: The Seasonal Hydrography of Kongsfjorden, Svalbard. J. Geophys. Res. 110 (C12), C12005. doi:10.1029/2004JC002757
Donohoe, A., Lacour, G., McCluskey, P., Diamond, D., and McCaul, M. (2018). Development of a Cost-Effective Sensing Platform for Monitoring Phosphate in Natural Waters. Chemosensors 6 (4), 57. doi:10.3390/chemosensors6040057
García-Robledo, E., Corzo, A., and Papaspyrou, S. (2014). A Fast and Direct Spectrophotometric Method for the Sequential Determination of Nitrate and Nitrite at Low Concentrations in Small Volumes. Mar. Chem. 162, 30–36. doi:10.1016/j.marchem.2014.03.002
Gordon, L. I., Jennings, J. C., Ross, A. A., and JamesKrest., M. (1993). A Suggested Protocol for Continuous Flow Automated Analysis of Seawater Nutrients (Phosphate, Nitrate, Nitrite and Silicic Acid) in the WOCE Hydrographic Program and the Joint Global Ocean Fluxes Study, 55.
Halbach, L., Vihtakari, M., Duarte, P., Everett, A., Granskog, M. A., Hop, H., et al. (2019). Tidewater Glaciers and Bedrock Characteristics Control the Phytoplankton Growth Environment in a Fjord in the Arctic. Front. Mar. Sci. 6, 254. doi:10.3389/fmars.2019.00254
Hering, D., Borja, A., Carstensen, J., Carvalho, L., Elliott, M., Feld, C. K., et al. (2010). The European Water Framework Directive at the Age of 10: A Critical Review of the Achievements with Recommendations for the Future. Sci. Total Environ. 408 (19), 4007–4019. doi:10.1016/j.scitotenv.2010.05.031
Hodal, H., Falk-Petersen, S., Hop, H., Kristiansen, S., and Reigstad, M. (2012). Spring Bloom Dynamics in Kongsfjorden, Svalbard: Nutrients, Phytoplankton, Protozoans and Primary Production. Polar Biol. 35 (2), 191–203. doi:10.1007/s00300-011-1053-7
Hopwood, M. J., Carroll, D., Dunse, T., Hodson, A., Holding, J. M., Iriarte, J. L., et al. (2020). Review Article: How Does Glacier Discharge Affect Marine Biogeochemistry and Primary Production in the Arctic? The Cryosphere 14 (4), 1347–1383. doi:10.5194/tc-14-1347-2020
Kalkhajeh, Y. K., Jabbarian Amiri, B., Huang, B., Henareh Khalyani, A., Hu, W., Gao, H., et al. (2019). Methods for Sample Collection, Storage, and Analysis of Freshwater Phosphorus. Water 11 (9), 1889. doi:10.3390/w11091889
McCaul, M., Barland, J., Cleary, J., Cahalane, C., McCarthy, T., and Diamond, D. (2016). Combining Remote Temperature Sensing with In-Situ Sensing to Track Marine/Freshwater Mixing Dynamics. Sensors 16 (9), 1402. doi:10.3390/s16091402
Muller-Karger, F. E., Miloslavich, P., Bax, N. J., Simmons, S., Costello, M. J., Sousa Pinto, I., et al. (2018). Advancing Marine Biological Observations and Data Requirements of the Complementary Essential Ocean Variables (EOVs) and Essential Biodiversity Variables (EBVs) Frameworks. Front. Mar. Sci. 5, 211. doi:10.3389/fmars.2018.00211
Padedda, B. M., Pulina, S., Satta, C. T., Lugliè, A., and Magni, P. (2019). “Eutrophication and Nutrient Fluxes in Mediterranean Coastal Lagoons,” in Encyclopedia of Water. Editor P Maurice (Hoboken, NJ, USA: John Wiley & Sons), 1–16. doi:10.1002/9781119300762.wsts0161
Poll, W. H., Maat, D. S., Fischer, P., Visser, R. J. W., Brussaard, C. P. D., and Buma, A. G. J. (2021). Solar Radiation and Solar Radiation Driven Cycles in Warming and Freshwater Discharge Control Seasonal and Inter‐annual Phytoplankton Chlorophyll a and Taxonomic Composition in a High Arctic Fjord (Kongsfjorden, Spitsbergen). Limnol. Oceanogr. 66 (4), 1221–1236. doi:10.1002/lno.11677
Ribotti, A., Magni, P., Mireno, B., Schroeder, K., Barton, J., McCaul, M., and Diamond, D. (2015). “New Cost-Effective, Interoperable Sensors Tested on Existing Ocean Observing Platforms in Application of European Directives: The COMMON SENSE European Project,” in OCEANS 2015 - Genova, Genova, Italy, 18-21 May 2015 (IEEE), 1–9. doi:10.1109/OCEANS-Genova.2015.7271340
Svendsen, H., Beszczynska-Møller, A., Hagen, J. O., Lefauconnier, B., Tverberg, V., Gerland, S., et al. (2002). The Physical Environment of Kongsfjorden?Krossfjorden, an Arctic Fjord System in Svalbard. Polar Res. 21 (1), 133–166. doi:10.1111/j.1751-8369.2002.tb00072.x
Keywords: nutrients, sensors, water quality, arctic, kongsfjorden, sensing
Citation: McCaul M, Magni P, Jordan SF, McNamara E, Satta A, Diamond D and Ribotti A (2021) Nutrient Analysis in Arctic Waters Using a Portable Sensing Platform. Front. Sens. 2:711592. doi: 10.3389/fsens.2021.711592
Received: 18 May 2021; Accepted: 28 June 2021;
Published: 02 September 2021.
Edited by:
SungWoo Nam, University of Illinois at Urbana-Champaign, United StatesReviewed by:
Juyoung Leem, Stanford University, United StatesAli Ashraf, Rutgers, The State University of New Jersey, United States
Copyright © 2021 McCaul, Magni, Jordan, McNamara, Satta, Diamond and Ribotti. This is an open-access article distributed under the terms of the Creative Commons Attribution License (CC BY). The use, distribution or reproduction in other forums is permitted, provided the original author(s) and the copyright owner(s) are credited and that the original publication in this journal is cited, in accordance with accepted academic practice. No use, distribution or reproduction is permitted which does not comply with these terms.
*Correspondence: Margaret McCaul, TWFyZ2FyZXQubWNjYXVsQGRjdS5pZQ==
 Margaret McCaul
 Paolo Magni
 Sean F Jordan
 Eoghan McNamara1
 Dermot Diamond
 Alberto Ribotti