 Guillem Domènech-Gil
 Isabel Gràcia4
94% of researchers rate our articles as excellent or good
Learn more about the work of our research integrity team to safeguard the quality of each article we publish.
Find out more
ORIGINAL RESEARCH article
Front. Sens., 26 April 2021
Sec. Sensor Devices
Volume 2 - 2021 | https://doi.org/10.3389/fsens.2021.672516
This article is part of the Research TopicSensors for Air Quality Monitoring: Indoor and OutdoorView all 5 articles
We report the growth of micrometer-sized In2O3 octahedral structures, which are next aligned in chains using dielectrophoresis on top of microhotplates with prepatterned electrodes and integrated heater to work as chemoresistive gas sensors. The devices are relatively fast (180 s), highly sensitive (response up to ~256%), and selective toward NO2 in humid environments, showing little response to O2 and ethanol, and being completely insensitive to CO and CH4. The here-presented fabrication method can be easily extended as a cost-effective post-process in CMOS-compatible microhotplate fabrication and, thus, represents a promising candidate for indoor and outdoor air quality monitoring devices.
The use of metal oxide (MOx) semiconductor micro and nanostructured materials in the field of chemoresistive gas sensors has gained importance over the last decades due to their stability, large-scale production potential, cost effectiveness, and high surface-to-volume ratio that attributes them higher sensitivity and faster response and recovery times when compared to thin films (Brunet et al., 2012; Xu et al., 2015; Chowdhury and Bhowmik, 2021), i.e., high performance. The major drawback of these gas sensing materials is their lack of selectivity.
An important factor to consider when fabricating a MOx-based gas sensor with micro or nanostructures is the amount and distribution of these structures, since both determine the gas sensing performance. On the one hand, multi-micro or nanostructured networks present high effective gas response due to the adsorption effects of multiple junctions, as in the case of meshes of nanowires (Choi et al., 2008; Samà et al., 2017). On the other, individual structure-based gas sensors show fast response due to lack of electrical potential barriers between the structures (Lupan et al., 2010; Samà et al., 2019; Chowdhury and Bhowmik, 2021). So, a compromise between both solutions is a smart approach to obtain fast and, simultaneously, effective responses.
In this work we propose the use of individual chains of few indium oxide (In2O3) octahedral structures as main sensing element of gas sensors. Using this architecture, achieved through dielectrophoretic alignment, the current is forced to flow through a small number of junctions, presenting reasonably fast and, at the same time, effective gas sensing behavior. These gas sensors present strong selectivity to NO2 in the presence of different amounts of relative humidity. Additionally, the sensor fabrication method used is fast and cost effective, i.e., can help in the implementation as fabrication post-process in production site. Therefore, the presented methodology and material used open an interesting path for large-scale production of high-performance gas sensors.
To fabricate the sensing material, monocrystalline In2O3 octahedral structures were synthetized by means of a vapor-solid deposition mechanism, utilizing a chemical vapor deposition (CVD) furnace connected to a gas injection system. The experiments were carried out using 0.25 g of pure In2O3 (99.99%) powder mixed with graphite powder as precursor in a 4:1 wt proportion. The graphite was used to promote a carbothermal reduction of the In2O3 powder when the source was heated, and, therefore, decreasing the evaporation temperature. The substrates were 0.5 × 0.5 cm2 slabs cut from a 4-inch Si wafer, with a 0.5 μm thick thermal SiO2 layer. Some substrates were Au sputter-covered for 20 s, which gave rise to a nanometric and non-continuous Au layer of few nm. The substrates were positioned from 2 to 31 cm from the evaporation source, as detailed elsewhere (Domènech-Gil et al., 2017).
To start the synthesis process, a vacuum level of approximately 30 mTorr was produced inside the CVD furnace. Next, the temperature was increased for 30 min, while a flow of 100 ml/min of pure argon gas (5N quality) was kept until atmospheric pressure was reached. Then, the evaporating source and substrates were maintained at 950 and 800°C, respectively, for 1 h. The indium (In) and indium sub-oxide (InxO) gases, arisen from the evaporation of the precursor powder mixture, were transported to the substrates by means of a 100 ml/min flow of pure argon (5N) which contained of 2.5% of pure oxygen (5N). The In2O3 octahedral structures formed in the gas phase and were subsequently deposited, owing to weight, on top of the substrates. The weight hypothesis was confirmed by a series of experiments in which the substrates were placed upside-down and no octahedral structure was found on their surface. Finally, the furnace was allowed to naturally cool down for about 6 h.
To study the results of the synthesis experiments, size of the material, and its crystalline nature, the In2O3 octahedral structures were inspected using a Jeol J7100F Field Emission Scanning Electron Microscope (FESEM), a Siemens D-500 X-Ray Diffractometer (XRD), and a Jeol J2100 Transmission Electron Microscope (TEM).
To perform the TEM characterization, the substrates containing In2O3 octahedra were immersed in a vial with pure (99.5%) analysis ethanol, and, by applying sonication for 2 min, the structures were detached from the substrates. Next, droplets of the solution were deposited onto TEM holey carbon grids for their inspection. The same solution was used to fabricate gas sensors as well, via dielectrophoretic (DEP) alignment (Seo et al., 2006) of octahedra chains.
Bulk micromachined Si substrates were employed to fabricate gas sensors. These substrates are chips containing three suspended microhotplates each (micro-sized thin structures that contain a buried heater and surface pre-patterned electrodes). Thanks to their reduced dimensions, temperatures of hundreds of °C can be achieved with power consumptions in the range of few mW while keeping the rest of the substrate cold, e.g., 350°C with a power consumption of 6 mW. Each microhotplate is a free-standing structure supported by thin arms that isolate it thermally from the rest of the substrate, a thicker bulk. The thickness of the microhotplates used in this work is 1.1 μm. Each microhotplate contains a meander-shaped micro-heater made of Pt embedded in a dielectric layer of 300 nm of Si3N4 covered with a layer of 800 nm of SiO2, both together acting as electrical isolation. Interdigitated electrodes of Ti/Pt with a nominal thickness of 25/250 nm, and with 10 μm distances between finger electrodes, are defined on top of each microhotplate by a lift-off process. These electrodes were used to apply the alternating electric field for DEP alignment, and to provide electrical contact to the sensing material, i.e., the In2O3 octahedra. The detailed description of similar sensing platforms is described in literature (Puigcorbé et al., 2003).
For the sensor fabrication, the solution containing In2O3 octahedral structures was diluted to adjust the octahedra concentrations. The first step for the octahedra integration in the microhotplates and subsequent alignment between pre-patterned electrodes was to apply an AC square signal of 10 V peak-to-peak in two of the four top electrodes. The force dragging the octahedra toward the electrodes was produced by a function generator TTi TG200. Next, one or more droplets of the solution were drop casted on top of the microhotplates. The frequency of the AC signal and solvent were optimized to promoted assemblies of octahedra chains between the pre-patterned electrodes. The optimal conditions that promoted the formation of octahedra chains were a frequency of 4 MHz, using pure ethanol as solvent. After the deposition and alignment of the octahedra structures between the electrodes, the fabricated devices were soft baked at 90°C for 20 min to facilitate the full evaporation of solvent residues. The resulting devices were inspected using SEM. To test their functionality as gas sensors, the chips were glued on top of a standard TO-8 holder, and their electrodes bonded using ultrasonic wire bonding to TO-8 holder pins.
Before starting the gas measurement, the sensors mounted on TO-8 holders, were aged for 8 h at 400°C under synthetic air flow to ensure no microstructural change during the measurements.
For gas measurements the sensors were tested in a self-constructed stainless-steel gas chamber of 8.6 ml of volume where a constant flow of 200 ml/min was kept. The gas flow mixtures were managed using a home-developed labview software that commands four Bronkhorst Mass-Flow Controllers (MFC). The same software was used to perform the electrical measurements with a Keithley 2602A dual Source Measurement Unit (SMU), applying a DC current of 10–100 nA. These values were low enough to avoid the well-known self-heating effect (Prades et al., 2008) and the sensors' temperature were only varied due to the electrical power applied to the heater. The SMU allows to simultaneously apply a constant current, monitor the resistance evolution of the fabricated gas sensors, and control the power for heating the microhotplates.
To study the gas sensing behavior of In2O3 octahedra-based gas sensors the resistance evolution was monitored between room temperature and 275°C toward different concentrations of oxygen (O2), relative humidity (RH), nitrogen dioxide (NO2), carbon monoxide (CO), ethanol (EtOH), and methane (CH4) diluted either in synthetic air (SA) or nitrogen (N2) atmospheres. The gas measurements consist in the repetition of sequences of 1–2 h of stabilization under SA or N2, followed by 30- or 60-min exposures at different concentrations of the gases of interest. The exposure and stabilization times in the measurements were adapted specifically for every studied gas to be long enough to recover the steady state and baseline resistance value, respectively. Water vapor was added by deviating a part of the SA flow through a bubbler. To avoid the possibility of unnoticed poisoning of the sensors if a sequence of increasing gas concentration pulses was used, the gas pulse concentration sequence always followed a random pattern.
In order to understand properly the behavior of In2O3 octahedra toward O2 and RH (ranging from 20 to 80%), the fabricated gas sensors were exposed to pure N2 (5N) atmospheres enough time to promote O2 desorption and by exposing the sensors to SA (21% O2) afterwards. To extend the gas sensing characterization to relevant gases for air quality monitoring, the sensors were exposed from 0.25 to 1.5 ppm NO2. The later range, due to system limitations, is slightly higher than the upper time-weighted average (TWA) exposure limit defined by the World Health Organization (WHO) and the European Environmental Agency for 1 h exposure (European Environment Agency, 2006) (0.1 ppm). However, in some specific indoor environments such as ice arenas, underground parking areas, or pools, the concentrations of this gas can reach higher values (Glorennec et al., 2008). In the same way, the behavior of the sensors when exposed to 2.5–25 ppm to CO was studied. These values are lower than the 30.2 ppm for 1 h exposure TWA and cover the legal limit of 8.6 ppm for an 8-h exposure TWA (World Health Organization, 2010) defined by the WHO. As a volatile organic compound (VOC), 2.5–25 ppm EtOH, was included in this study. Finally, to test a non-VOC but organic gas molecule, CH4 exposures, ranging from 0.25 to 1% were performed. In this way, the basic characterization toward O2 and RH, and the response to a complete variety of gases (oxidizing, reducing, VOC, and organic), was performed. To finish the gas sensing characterization by mimicking real-world scenarios, crossed effects between CO, CH4, NO2, or EtOH and different concentrations of RH were studied.
The response of the sensors (S) toward the different gases studied is defined in this work as the relative change of resistance divided by the resistance value in SA, which is expressed as:
for reducing and oxidizing gases, irrespective. The response time is defined as the time required to evolve from the 10% to the 90% of the difference between the base and the steady state resistance value. The recovery time is the time span, after the end of the studied gas pulse, in which the resistance develops from the 90 to the 10% of the steady state to base resistance difference.
When the fabricated sensors were studied and exposed toward different gas species, the resistance value of each device varied according to the different percolation paths and grain boundaries present in each octahedra chain. The baseline variation observed among different devices has a mean value of ~60%. However, the trends in relative responses and response times presented in the results were maintained with small variations among devices (<5% and <20 s), indicating that the sensors behavior can be seen as a result of the sensing material. The results shown in the following section correspond to different sensors.
When In2O3 octahedra-based gas sensors were tested toward different concentrations of CO and CH4, in dry synthetic air and in humid conditions (20 and 40% of RH) from 200 to 275°C, no observable response was measured in any case.
The fabricated sensors were tested for 1 year, with no visible change in their behavior, drift, or deterioration. Between measurements, the sensors were stored in room conditions. No effect on the adherence of the sensing material was observed during the gas measurements, the temperature changes, the manipulation, or the transportation of the sensors.
In2O3 octahedral structures were successfully synthetized using the above-mentioned synthesis conditions and showing no difference when the substrates used were Au-covered or not. Thus, the structures were formed in the gas phase, independently of the substrate. The In2O3 octahedral structures presented decreasing size and density the farther from the evaporation source. No other structure formation, e.g., nanowires, were observed in any sample. The size of the obtained octahedra was (2 ± 1) μm. Figures 1A,B show In2O3 octahedral structures found in the closest and farthest samples from the evaporating source, respectively. In some experiments, defective octahedra were found in samples located from 2 to 5 cm from the evaporation source, as shown in Figure 1C.
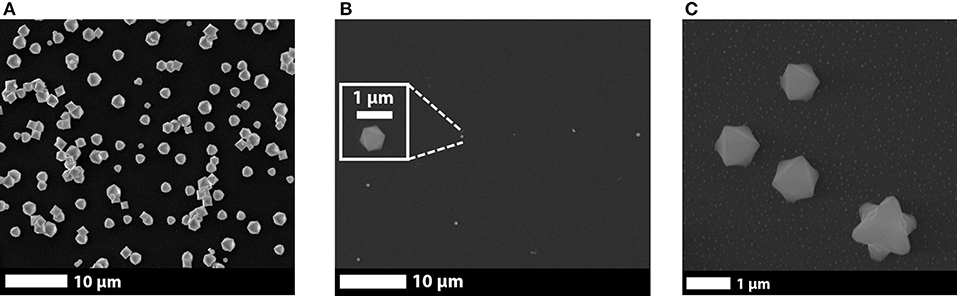
Figure 1. Scanning Electron Microscopy images showing details of indium oxide octahedral structures grown at (A) 2 and (B) 31 cm from the evaporating source; and (C) defective octahedra found at 2 cm from the evaporating source.
The synthetized In2O3 octahedra were analyzed by XRD in grazing incidence configuration to study their crystallographic structure. The obtained patterns, shown in Figure 2, are consistent with the pattern of an In2O3 cubic structure corresponding to the space group Ia3 (JCPDS #06-0416) with lattice parameter a = 1.0118 nm. This result is also consistent with the ones reported in literature (Hao et al., 2005; Kumar et al., 2009). The reduced intensity of the peaks in the pattern in comparison to the (222) peak denotes a notably preferential orientation and suggests that the synthetized structures stand against the surface mainly by their {111} facets. All the mentioned results and observations confirm that the synthesized structures are crystalline In2O3 cubic structures.
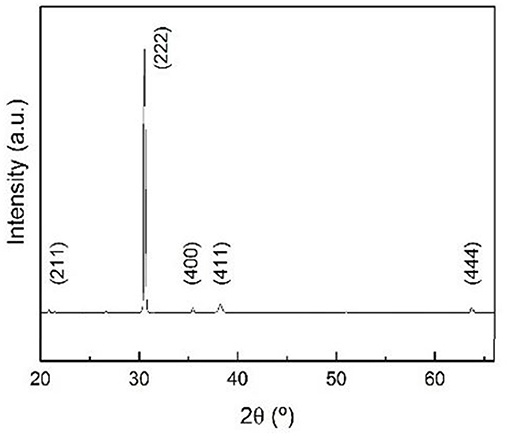
Figure 2. X-ray diffraction pattern for indium oxide octahedral structures with reflections matching with the reference for cubic indium oxide JCPDS #06-0416 card. The contribution for the amorphous silicon oxide corresponding to the background has been subtracted.
TEM analysis was carried out to inspect the growth directions of the In2O3 octahedra and to complete the characterization. The growth planes and indexes were successfully identified by selected area electron diffraction (SAED) pattern and fitted properly with the expected labeling, also reported in literature (Hao et al., 2005; Kumar et al., 2009). Figures 3A–C show TEM images of the octahedral structures with various orientations when the electron beam was entering along the <111>, <110>, and close to <100> crystalline directions, respectively. The shown morphologies further demonstrate the octahedral shape of the synthetized structures and their smooth surfaces. Additionally, high-resolution TEM allowed to measure the lattice plane spacings, shown in Figures 4A,B, which are also in perfect agreement with the expected structure of the synthetized material (Wang, 2000). In Figure 4B, the lattice fringes are not easily observed since the octahedral structure, from this perspective, is thick. These results are in good agreement with theoretical and experimental values reported in literature (Hao et al., 2005; Kumar et al., 2009) and confirm experimentally that growth rates and planes of the characterized material match exactly with the In2O3 cubic structure following the theoretical relationship.
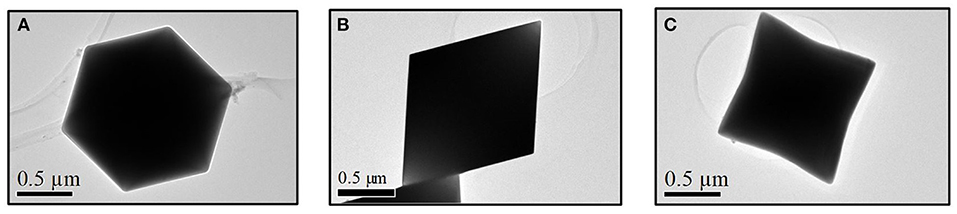
Figure 3. Indium oxide octahedral structures observed by means of transmission electron microscope along the (A) <111>, (B) <110>, and (C) close to <100> zone axis.
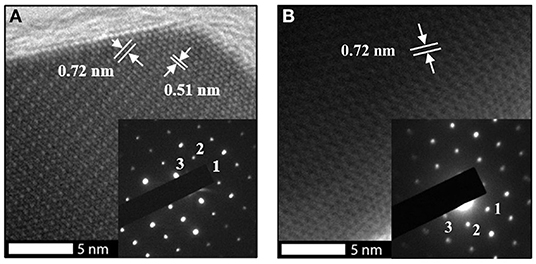
Figure 4. High resolution Transmission Electron Microscopy images of an indium oxide octahedral structure observed along the (A) <110> zone axis and its selected area diffraction pattern, with spots labeled as 1-3 corresponding to , and , respectively; and to (B) <111> zone axis and its selected area diffraction pattern with spots labeled as 1–3 corresponding to , , and , respectively.
As mentioned in the Experimental section, the sensor fabrication method consisted in four steps: (i) transfer the synthetized In2O3 octahedra to a liquid solution, (ii) applying an AC signal between two of the top electrodes of a microhotplate, (iii) drop casting the octahedra solution on top of the microhotplates, and (iv) soft baking the fabricated device. The third step, that is the most relevant for the sensor fabrication, was controlled by optical microscopy. All the steps are suitable to be implemented as microfabrication post-process in production site.
The properties (composition, dimensions, and polar nature) and morphology of the material of interest, i.e., In2O3 octahedra, determine the optimum sonication time, solvent, and AC signal parameters (Pethig, 2010) to achieve the suitable conditions to promote the positioning of the structures between the electrodes. The sonication time was increased when the In2O3 octahedra concentration in the solution was not high enough, with no impact in the quality and stability of the octahedra. Different solvents with different viscosities, such as hexane, ethanol, and deionized water, were tested. More facile chain formation was observed when ethanol was used as solvent. As a rule of thumb, minimizing the number of droplets during the integration process improved the rate of success since a new droplet can remove the octahedra already located in the desired position. As a second rule of thumb, concentrations in the order of 50 octahedra/μl were appropriate to obtain successful results in our experiments.
Figure 5 shows one of the fabricated sensors with a chain of In2O3 octahedra connecting the two lower electrodes. According to the In2O3 octahedra size (2 ± 1) μm, and their positioning, between 5 and 15 octahedral structures produced a bridge between electrodes. The octahedra chain was always aligned parallel to the direction of the local electrical field and concentrated in the regions with highest field strengths, i.e., the tip of the electrodes. The AC signal promoting the DEP force was always applied to horizontal or vertical pairs of electrodes, not to diagonal ones, to facilitate the chain formation thanks to their shorter distance and, thus, higher electrical field. Apart, additional groups of In2O3 octahedral structures were adhered along the electrodes to which the AC signal was applied, as can be seen as well in Figure 5. It is worth mentioning that the process of octahedra alignment in a different set up should be optimized and customized, in agreement with extensive literature (Pethig, 2010; Guilera et al., 2015; Chmela et al., 2017).
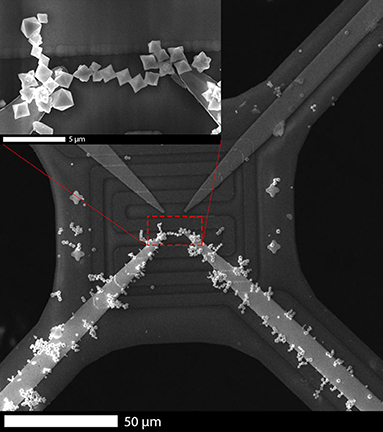
Figure 5. Scanning Electron Microscopy image of indium oxide octahedra chain contacting two lower platinum electrodes on top of a microhotplate.
As mentioned in the experimental section, no sensor showed a measurable response toward CO or CH4, neither in dry nor humid conditions. Therefore, the results shown in this section refer only to the responses observed toward O2, RH, NO2, and EtOH.
The resistance of the In2O3 octahedra-based gas sensors was studied from room temperature to 275°C in dry SA atmosphere and dry N2 atmosphere. The measured resistance decreased for increasing temperature in both atmospheres, as shown in Figure 6A. The resistance value was always lower in N2 atmosphere than in SA atmosphere.
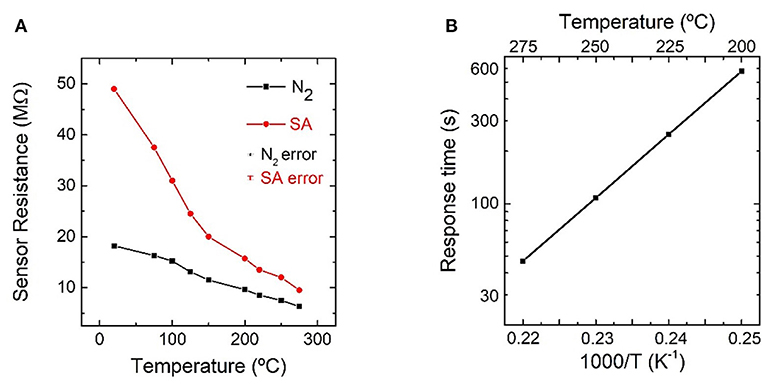
Figure 6. (A) Resistance of indium oxide octahedra-based sensor as a function of temperature in nitrogen and dry synthetic air atmospheres; (B) Arrhenius plot of the response time for exposures of 21% oxygen from 200 to 275°C.
To determine the activation energy for O2 adsorption, the sensors were exposed to alternate pulses of pure N2 and 21% O2 (SA) from 200 to 275°C. The resistance evolution for one of these measurements, carried out at 275°C, is shown in Supplementary Figure 1. The adsorption and desorption times were faster for increasing temperatures, lasting from 45 to ~600 s in the case of adsorption, while the desorption process always being slower. For this reason, the N2 exposure time was adjusted for each temperature to allow a complete O2 desorption. The response time for O2 adsorption at different temperatures allowed to calculate the activation energy of this process. Figure 6B shows an Arrhenius plot of the sensor response time as a function of temperature. The calculated activation energy for the In2O3 octahedra toward O2 is (0.86 ± 0.32) eV.
The resistance of the fabricated devices decreased for increasing temperatures and RH concentrations from room temperature to 300°C, as shown in Figure 7A. To understand if the response toward water vapor (H2O) was controlled by the pre-adsorbed oxygen () or the oxygen atoms in lattice positions (Olat), measurements with increasing concentrations of RH at 275°C, were carried out in N2 atmosphere and repeated under SA. In both cases, the presence of RH promotes a decrease in resistance, as can be observed in Supplementary Figure 2A, but considerably smaller in N2 atmosphere, in terms of relative change of its previous baseline.
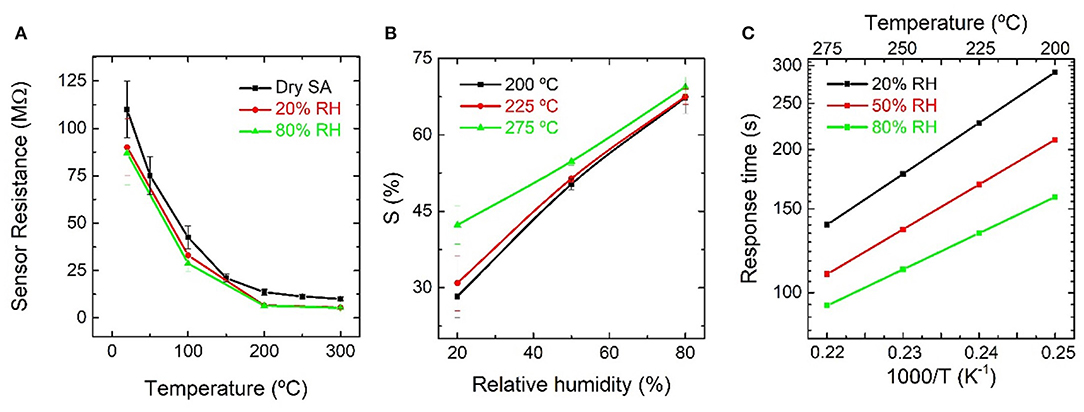
Figure 7. (A) Resistance of an indium oxide octahedra-based sensor as function of temperature in dry synthetic air, and synthetic air with 20 and 80% relative humidity; (B) response summary of relative responses in (A) as function of relative humidity; (C) Arrhenius plot of the response time for exposures of water vapor from 200 to 275°C.
To find the activation energy for different RH concentrations, the sensors were tested toward pulses of RH diluted in SA from 200 to 275°C, as shown in Supplementary Figure 2B. The response increased for increasing RH as well as for increasing temperature. Maximum values of ~70% for 80% RH at 275°C were observed, accompanied by a fast response time of 90 s. Figure 7B shows the summary of relative responses, where it can also be observed that no saturation was reached. Figure 7C presents an Arrhenius plot of the response time as a function of temperature. The calculated activation energy for the In2O3 octahedra toward H2O is (0.22 ± 0.09) eV.
The In2O3 octahedra-based gas sensors showed a resistance increase when exposed to NO2, as can be observed in Figure 8A. This measurement was repeated including different concentrations of RH. The RH was included as background gas from the beginning of the measurement, and, therefore, the baseline of the sensor was different for each specific RH concentration despite being at the same temperature, 275°C. As shown in Figure 8B, the relative response increased for increasing concentrations of NO2, as well as for increasing RH concentrations. For NO2 concentrations higher than 1 ppm the slope of the relative response trend is lower when compared to lower concentrations but does not reach saturation. However, saturation of the resistance as a function of NO2 was reached for RH above concentrations of 20%. The highest response value was observed for 1.5 ppm NO2 with values of ~237 and ~256% under dry SA and at 80% RH, respectively. The response time, summarized in Figure 8C, increased with NO2 concentrations and decreased for increasing concentrations of RH. The fastest response time, ~3 min, was measured for 0.25 ppm NO2 in humid conditions (80% RH).
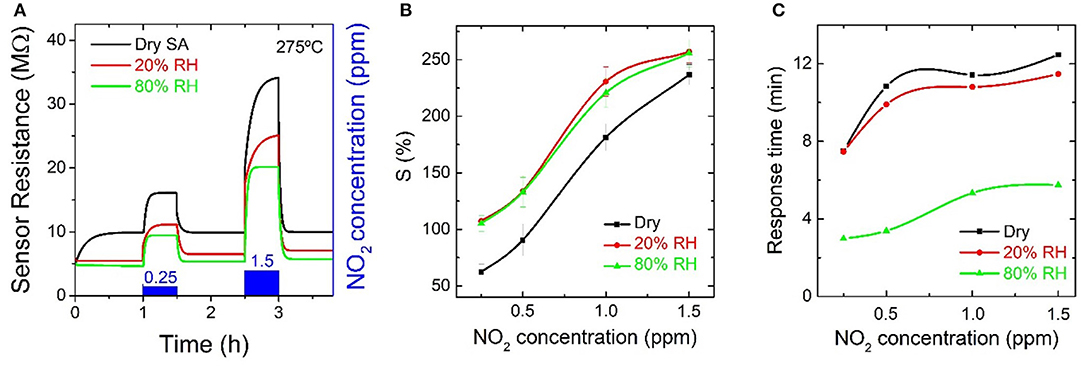
Figure 8. (A) Resistance evolution of an indium oxide octahedra-based gas sensor at 275°C toward different concentrations of nitrogen dioxide diluted in dry synthetic air and in humid conditions (20 to 80% RH); (B) relative response summary and (C) response time summary for the measurements toward nitrogen dioxide.
The measured response times are comparable to the ones from commercially available gas sensors based on metal oxides (Hsu et al., 2007), and lower or similar than other In2O3 octahedra-based gas sensors found in literature (Gonzalez et al., 2016).
Figure 9A shows the resistance evolution at 275°C of an In2O3 octahedra-based gas sensor exposed toward different concentrations of EtOH in dry and humid conditions (5 and 10% RH). The response of the sensor increased for increasing temperatures and for increasing EtOH concentrations, as shown in Figure 9B. Maximum responses of 32% were observed at 275°C when the sensors were exposed to 25 ppm EtOH in dry SA. When RH was added as background gas, the resistance baseline and the response toward all the studied concentrations of EtOH decreased. The relative response completely vanished at values above 20% RH. This tendency can be observed in Figures 9A,C. The response time decreased with increasing RH, reaching values as fast as 30 s for exposures to 25 ppm EtOH with 10% RH.
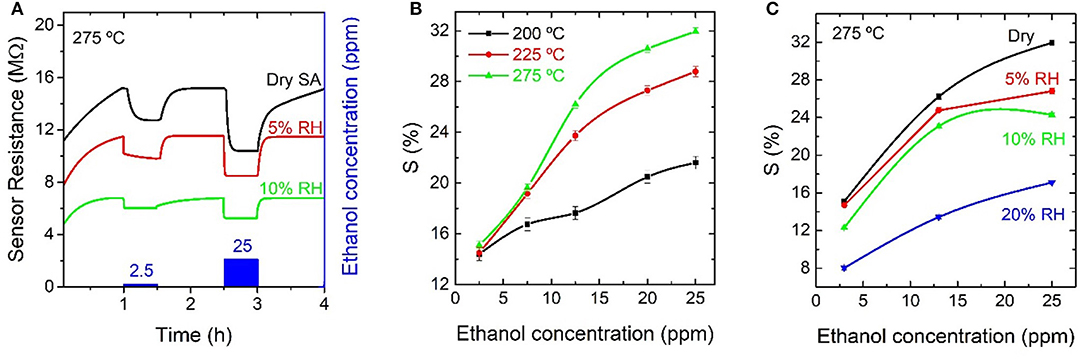
Figure 9. (A) Resistance evolution of an indium oxide octahedra-based gas sensor at 275°C toward different concentrations of ethanol diluted in dry synthetic air and in humid conditions (5 and 10% relative humidity); (B) relative response summary at different temperatures and (C) relative response summary for different relative humidity backgrounds at 275°C, for the measurements toward ethanol.
It is well-known that a high supersaturation ratio of In2O3 vapor (In2O3(g)) in the synthesis atmosphere makes the crystal growth rates perpendicular to {111}, {110}, and {100} quite close, producing octahedral crystalline structures (Hao et al., 2005). This fact avoids the formation of other morphologies that can grow by self-catalysis or by using the Au as catalyst to activate a metal-assisted growth at the surface of the substrates, e.g., nanowires. In our synthesis experiments, where three steps are involved (explained in detail in the Supplementary Material) oxygen vapor partial pressure (pO2(g)) was the only limiting factor to achieve a high supersaturation ratio of In2O3(g). Thus, once In2O3:C proportion and amount, gas flow, and T were fixed, the adequate adjustment of pO2(g) promoted the formation of octahedral structures. When the O2 concentration was maintained at 2.5% during the synthesis process, only octahedral structures were formed. To confirm this fact, an additional set of experiments with decreasing O2 concentrations was performed, and when the O2 concentration was kept at 1.3%, a mixture of nanowires and octahedral structures were observed in most of the samples. The appearance of nanowires is because the supersaturation ratio is not high enough and the growth via the Au at the surface of the substrates is activated. A third set of experiments were performed with no O2 present in the synthesis atmosphere, and only nanowires were obtained. The growth of nanowires, even being possible by self-catalysis, was promoted in this case by the presence of the sputtered Au, what was confirmed by the presence of a Au-tip at the end of each nanowire (Domènech-Gil et al., 2017).
The synthetized In2O3 octahedra are expected to be a semiconductor n-type MOx, similar to other forms of In2O3 (Weiher, 1962). Therefore, it is expected that the resistance decreases as an effect of increasing temperature (Ahlers et al., 2003) and that the resistance increases when exposed to oxygen (Bârsan and Weimar, 2001). Both facts were confirmed with the presented results in Figure 6A. The first fact is indifferent to the surrounding atmosphere (SA or N2) because it is purely due to the excitation of charge carriers (Bârsan and Weimar, 2001) and we can observe that, in both situations, the resistance decreases with increasing temperature. Regarding the second fact, when the fabricated gas sensors were exposed to O2, either in molecular or atomic form, its adsorption promoted a shrinking of the conduction channel and, consequently, a resistance increase (Bârsan and Weimar, 2001). This second fact can be confirmed as well with the results shown in Supplementary Figure 1. Therefore, we can conclude that the synthetized In2O3 octahedra are semiconductor n-type MOx.
According to the n-type behavior, shown in the previous paragraph, we expect a resistance decrease when the sensors are exposed to reducing gases (Bârsan and Weimar, 2001), which was confirmed with the measurements toward RH (Figure 7A and Supplementary Figure 2). The measurements toward RH in N2 atmosphere helped to elucidate the exact gas-solid interaction. In literature, the reactions for H2O molecules and n-type tin oxide (SnO2) are extensively reported (Heiland and Khol, 1988; Bârsan and Weimar, 2001; Koziej et al., 2005; Hernandez-Ramirez et al., 2007; Samà et al., 2016). However, there are two reaction paths proposed (detailed in the Supplementary Material). The first involves Olat and the second, (Koziej et al., 2005).
In our measurements, when In2O3 octahedra were exposed to RH the resistance decreased, confirming an electron release to the semiconductor bulk, which is in good agreement with all the proposed interactions (Heiland and Khol, 1988; Bârsan and Weimar, 2001; Koziej et al., 2005; Hernandez-Ramirez et al., 2007; Samà et al., 2016). When measuring the effect of RH in a N2 atmosphere, is absent at the octahedra surface at the beginning of the measurement. This fact is deduced by the resistance decrease observed when the O2 was removed from the gas chamber (Supplementary Figure 2A), employing the same strategy used in the studies performed in literature (Bârsan and Weimar, 2001; Koziej et al., 2005) to evaluate the reaction between H2O and . Once a new steady state was observed after evacuating the oxygen, a 20% RH flow was introduced in the gas chamber, and a new resistance decrease was observed. Since the majority of were desorbed after the O2 removal, only the reaction with Olat can be the main responsible of this observation. This procedure was repeated, introducing higher RH levels, 80%, finding the same observations. Under these conditions, the only possible mechanism responsible for the further resistance decrease observed when RH was introduced in the gas chamber was Olat. Thus, the results confirmed that the plays the main role in the interaction with H2O, which is consistent with (Koziej et al., 2005). However, the Olat was also influencing the gas-solid surface interaction, as suggested by Heiland and Khol (1988), Bârsan and Weimar (2001), Hernandez-Ramirez et al. (2007), and Samà et al. (2016), since small but perceptible changes were observed with the presence of H2O diluted in N2. In conclusion, the presented results are in perfect agreement with the accepted gas-solid interaction mechanisms for other MOx, but here specified for microstructured In2O3. Thus, and both and Olat take part in the interaction between H2O and In2O3.
Regarding the activation energy, the value obtained for H2O (0.22 ± 0.09) eV, is lower than the value obtained for O2, ~ 0.86 eV, which confirms that, when both gas species are present in the surrounding atmosphere of In2O3 octahedra, the surface interaction is dominated by H2O. This fact can be understood also from the existence of response toward RH, since, otherwise, no response would have been detected by the fabricated sensors when exposed to RH. Therefore, the activation energies calculated are coherent with the experimental results presented. Aside, the obtained values are in good agreement with literature regarding thin films of In2O3 (Korotcenkov et al., 2007).
The measurements that have allowed to calculate the activation energies were performed above 200°C and up to 275°C. At this range of temperatures, it is well-documented in the literature that the molecular form of O2 or H2O is no more present at the surface of In2O3, and, thus, limited to the atomic or hydroxyl group form, respectively.
The change in resistance related to NO2 diluted in dry SA in semiconductor materials is reported to be governed by the following surface reaction (Yamazoe and Shimanoe, 2008):
which induces a charge carrier accumulation at the surface, increasing the resistance of an n-type material, such as In2O3 octahedra. Thus, the results obtained are coherent with this explanation. As deduced from the measurements, NO2 should have a higher adsorption ratio than O2 and when both are present in the gas measurement chamber, the resistance increases compared to the case of dry SA atmosphere.
For humid conditions, the possible reaction ruling the resistance changes for other MOx is reported (Stǎnoiua et al., 2013) as:
This equation justifies that for constant NO2 concentration with increasing H2O presence, the reaction tends to the left side, giving rise to an increase of positive fixed charges at the surface and, thus, a resistance reduction. On the contrary, by maintaining H2O at a constant concentration and increasing the NO2 presence, a displacement to the right side of the equation is promoted, increasing negative surface charges and, consequently, the resistance (Stǎnoiua et al., 2013). A quantitative evaluation of the resistance changes is beyond the scope of this paper, but the results can be qualitatively explained. In the measurements performed in this study, RH was maintained constant while the NO2 concentration was varied. When the concentration was increasing, the resistance and relative response increased (when compared to the situation without RH), which is in agreement with the second case mentioned, i.e., with a right shift of the equation. This result is in good agreement with the proposed reaction, and here confirmed for microstructured In2O3.
Microstructured In2O3 have been reported to have good sensitivity both in dry and under humid conditions, between room temperature (Mu et al., 2015) and up to 130°C (Gonzalez et al., 2016) with and without UV light exposure. In these studies, the response times range from 4.5 to 15 min, and the power consumption ranges from 41 to 855 mW, that in our case are 3.5 min and 4.5 mW.
In recent studies about In2O3 surfaces, it has been demonstrated via diffuse reflectance infrared Fourier transform spectroscopy under operando conditions coupled to multivariate spectral analysis that the presence of hydroxyl groups on In2O3 surfaces enhances the response to NO2 (Roso et al., 2017). If a constant concentration of surface hydroxyl groups during NO2 sensing can be assumed, as in our measurements where the RH level was maintained constant as a background gas, then the gas-solid interactions can be summarized as: (1) terminal hydroxyl groups interact with adsorbed NO2 forming nitrite () species, and, thus, inducing a change in resistance; (2) terminal hydroxyl groups presence decreases by the formation of nitrate () species via the oxidation of the species at the In2O3 surface.
The chemical reactions involved in the sensing process of EtOH are quite complicated. In addition to adsorbed species, different gaseous intermediates, such as acetaldehyde, acetone, ethylene, H2O, and CO2, are formed. The mentioned processes are explained in detail elsewhere (Yamazoe et al., 2003; Sänze et al., 2013; Gu et al., 2014; Lupan et al., 2016; Domènech-Gil et al., 2017) and summarized in Equations (5)–(9) in the Supplementary Material. The reactions involved in EtOH sensing end up with a reduction of the negative surface charge accumulation, thus behaving as a reducing gas, and decreasing the sensor's resistance (Gu et al., 2014). The results presented in this work corroborate this fact, and, therefore, are in good agreement with the mentioned reactions.
When H2O was added to EtOH measurements, a competitive process occurred between H2O and EtOH to react with . H2O reacts mainly with the , as demonstrated above. Since H2O was introduced in the gas test chamber prior to EtOH, the available for the interaction with EtOH would decrease with increasing RH concentration. This fact was demonstrated with the measurements performed in this work, where less response toward EtOH was observed the higher the RH was. In other words, the presence of H2O as background gas prevented the interaction with EtOH by consuming the available. This observation is consistent with the reactions reported in literature (Gu et al., 2014; Lupan et al., 2016). This explains that at above 20% RH the response toward EtOH completely disappeared. Therefore, the results show that in air quality monitoring, with RH presence, the sensors do not detect EtOH.
In this work we have demonstrated the controlled growth of In2O3 octahedral structures, and that, thanks to dielectrophoretic techniques, it is possible to align chains of octahedra between top electrodes of suspended microhotplates with buried heaters, giving rise to MOx-based chemoresistive gas sensors. By using this strategy, the electrical conduction path is considerably limited when compared to meshes of multi-micro or -nanostructures, and, therefore, the effects of the intergranular gas sensing mechanism are highlighted. At the same time, this strategy promotes fast responses of 45 s for O2, 90 s for H2O, and 180 s for NO2. In the presence of relative humidity, the sensor only responds to NO2, with an absence of response toward CO and CH4, and a vanishing of response toward ethanol. As result, the fabricated devices are selective to NO2 in environments where RH is above 30%, thus, in daily-life environments. The response of these sensors toward NO2 increases with the RH presence, and is independent of the RH concentration. Thus, they are very stable under RH changes and, therefore, suitable for personal security applications, either for indoor or outdoor activities.
Even though the fabrication methodology presented in this work is a proof of concept and may require further refinement, it can be implemented as a cost-effectively post-process in CMOS-compatible microhotplate fabrication and, thus, expands the possibility of producing selective NO2 gas sensors for air quality monitoring.
The original contributions presented in the study are included in the article/Supplementary Material, further inquiries can be directed to the corresponding author/s.
GD-G has contributed by performing the synthesis of the indium oxide microstructures, the dielectrophoretic alignment experiments, the sensor mounting, the SEM characterization, and the gas sensing characterization. He also helped in the XRD and TEM characterization. Aside, he has interpreted the presented results and prepared the manuscript. IG and CC have contributed with the fabrication of the microhotplates used as platform for the gas sensors here presented. AR-R has contributed by performing the TEM characterization, helped to interpret the results and in the manuscript preparation, and directed the research. All authors contributed to the article and approved the submitted version.
This work has been partially supported by the Spanish Ministerio de Economía y Competitividad, through projects TEC2013-48147-C6 and TEC2016-79898-C6 (AEI/FEDER, EU) and by the Spanish Agencia Estatal de Investigación (AEI), through projects PID2019-107697RB-C41/AEI/10.13039/501100011033 and PID2019-107697RB-C42/AEI/10.13039/501100011033.
The authors declare that the research was conducted in the absence of any commercial or financial relationships that could be construed as a potential conflict of interest.
We want to acknowledge Sven Barth (Goethe Universität Frankfurt, Germany) for his support regarding the chemical reactions related to the synthesis mechanisms.
The Supplementary Material for this article can be found online at: https://www.frontiersin.org/articles/10.3389/fsens.2021.672516/full#supplementary-material
Ahlers, S., Becker, T., Hellmich, W., Braunmühl, C., and Müller, G. (2003). “Temperature- and field-effect-modulation techniques for thin-film metal oxide gas sensors,” in Advanced Gas Sensing, the Electroadsorptive Effect and Related Techniques, ed T. Doll (New York, NY: Springer Science + Business Media), 123–159.
Bârsan, N., and Weimar, U. (2001). Conduction model of metal oxide gas sensors. J. Electrocer. 7, 143–167. doi: 10.1023/A:1014405811371
Brunet, E., Maier, T., Mutinati, G. C., Steinhauer, S., Köck, A., Gspan, C., et al. (2012). Comparison of the gas sensing performance of SnO2 thin film and SnO2 nanowire sensors. Sens. Act. B Chem. 165:1. doi: 10.1016/j.snb.2012.02.025
Chmela, O., Sadílek, J., Domènech-Gil, G., Samà, J., Somer, J., Mohan, R., et al. (2017). Selectively arranged single-wire based nanosensor array systems for gas monitoring. Nanoscale 10, 9087–9096. doi: 10.1039/C8NR01588K
Choi, Y. J., Hwang, I. S., Park, J. G., Choi, K. J., Park, J. H., and Lee, J. H. (2008). Novel fabrication of an SnO2 nanowire gas sensor with high sensitivity. Nanotechnology 19:9. doi: 10.1088/0957-4484/19/9/095508
Chowdhury, N. K., and Bhowmik, B. (2021). Micro/nanostructured gas sensors: the physics behind the nanostructure growth, sensing and selectivity mechanisms. Nanoscale Adv. 3, 73–93. doi: 10.1039/D0NA00552E
Domènech-Gil, G., Barth, S., Samà, J., Pellegrino, P., Gràcia, I., Cané, C., et al. (2017). Gas sensors based on individual indium oxide nanowire. Sens. Act. B 238, 447–454. doi: 10.1016/j.snb.2016.07.084
European Environment Agency (2006). Air Quality Standards. Available online at: https://www.eea.europa.eu/themes/air/air-quality-standards (accessed February 22, 2021).
Glorennec, P., Bonvallot, N., Mandin, C., Goupil, G., Pernelet-Joly, V., Millet, M., et al. (2008). Is a quantitative risk assessment of air quality in underground parking garages possible? Indoor Air 18:4. doi: 10.1111/j.1600-0668.2008.00529.x
Gonzalez, O., Roso, S., Vilanova, X., and Llobet, E. (2016). Enhanced detection of nitrogen dioxide via combined heating and pulsed UV operation of indium oxide nano-octahedra. Nanotechnology 7, 1507–1518. doi: 10.3762/bjnano.7.144
Gu, F., Zhang, L., Wang, Z., Han, D., and Guo, G. (2014). Fine-tuning the structure of cubic indium oxide and their ethanol-sensing properties. Sens. Act. B Chem. 193, 669–678. doi: 10.1016/j.snb.2013.12.026
Guilera, J., Fàbrega, C., Casals, O., Hernández-Ramírez, F., Wang, S., Mathur, S., et al. (2015). Facile integration of ordered nanowires in functional devices. Sens. Act. B Chem. 221, 37–44. doi: 10.1016/j.snb.2015.06.069
Hao, Y., Meng, G., Ye, C., and Zhang, L. (2005). Controlled synthesis of In2O3 octahedrons and nanowires. Cryst. Growth Des. 5:4. doi: 10.1021/cg050103z
Heiland, G., and Khol, D. (1988). Physical and Chemical Aspects of Oxidic Semiconductor Gas Sensors. Aachen: Kodansha Ltd. doi: 10.1016/B978-0-444-98901-7.50007-5
Hernandez-Ramirez, F., Barth, S., Tarancon, A., Casals, O., Pellicer, E., Rodriguez, J., et al. (2007). Water vapor detection with individual tin oxide nanowires. Nanotechnology 18:42. doi: 10.1088/0957-4484/18/42/424016
Hsu, L.-C., Ativanichayaphong, T., Cao, H., Sin, J., Graff, M., Stephanou, H. E., et al. (2007). Evaluation of commercial metal-oxide based NO2 sensors. Sens. Rev. 27:2. doi: 10.1108/02602280710731687
Korotcenkov, G., Brinzari, V., Stetter, J. R., Blinov, I., and Blaja, V. (2007). The nature of processes controlling the kinetics of indium oxide-based thin films gas sensor response. Sens. Act. B Chem. 128, 51–63. doi: 10.1016/j.snb.2007.05.028
Koziej, D., Bârsan, N., Weimar, U., Szuber, J., Shimanoe, K., and Yamazoe, N. (2005). Water-oxygen interplay on tin dioxide surface: Implication on gas sensing. Chem. Phys. Lett. 410, 4–6. doi: 10.1016/j.cplett.2005.05.107
Kumar, M., Singh, V. N., Mehta, B. R., and Singh, J. P. (2009). Tunable synthesis of indium oxide octahedra, nanowires and tubular nanoarrow structures under oxidizing and reducing ambients. Nanotechnology 20:23. doi: 10.1088/0957-4484/20/23/235608
Lupan, O., Cretu, V., Postica, V., Ababii, N., Polonskyi, O., Kaidas, V., et al. (2016). Enhanced etanol vapour sensing perfomances of copper oxide nanocrystals with mixed phases. Sens. Act. B Chem. 224, 434–448. doi: 10.1016/j.snb.2015.10.042
Lupan, O., Ursaki, V. V., Chai, G., Chow, L., Emelchenko, G. A., Tiginyanu, I. M., et al. (2010). Selective hydrogen gas nanosensor using individual ZnO nanowire with fast response at room temperature. Sens. Act. B Chem. 144, 56–66. doi: 10.1016/j.snb.2009.10.038
Mu, X., Chen, C., Han, L., Shao, B., Wei, Y., Liu, Q., et al. (2015). Indium oxide octahedrons based on sol-gel process enhance room temperature gas sensing performance. J. Alloys Compd. 637, 55–61. doi: 10.1016/j.jallcom.2015.03.002
Pethig, R. (2010). Dielectrophoresis: status of the theory, technology and applications. Biomicrofluidics 4:022811. doi: 10.1063/1.3456626
Prades, J. D., Jimenez-Diaz, R., Hernandez-Ramirez, F., Barth, S., Cirera, A., Romano-Rodriguez, A., et al. (2008). Ultralow power consumption gas sensors based on self-heated individual nanowires. Appl. Phys. Lett. 93:123110. doi: 10.1063/1.2988265
Puigcorbé, J., Vogel, D., Michel, B., Vilà, A., Gràcia, I., Cané, C., et al. (2003). Thermal and mechanical analysis of micromachined gas sensors. J. Micromech. Microeng. 13:548. doi: 10.1088/0960-1317/13/5/304
Roso, S., Degler, D., Llobet, E., Barsan, N., and Urakawa, A. (2017). Temperature-dependent NO2 sensing mechanism over indium oxide. ACS Sens. 2, 1272–1277. doi: 10.1021/acssensors.7b00504
Samà, J., Barth, S., Domènech-Gil, G., Prades, J. D., López, N., Casals, O., et al. (2016). Site-selectively grown SnO2 NWs networks on micromembranes for efficient ammonia sensing in humid conditions. Sens. Act. B Chem. 232, 402–409. doi: 10.1016/j.snb.2016.03.091
Samà, J., Domènech-Gil, G., Gràcia, I., Borrisé, X., Cané, C., Barth, S., et al. (2019). Electron beam lithography for contacting single nanowires on non-flat suspended substrates. Sens. Act. B Chem. 286, 616–623. doi: 10.1016/j.snb.2019.01.040
Samà, J., Seifner, M. S., Domènech-Gil, G., Santander, J., Calaza, C., Moreno, M., et al. (2017). Low temperature humidity sensor based on Ge nanowires selectively grown on suspended microhotplates. Sens. Act. B Chem. 243, 669–677. doi: 10.1016/j.snb.2016.12.042
Sänze, S., Gurlo, A., and Hess, C. (2013). Monitoring gas sensors at work: operando raman-FTIR study of ethanol detection by indium oxide. Angew. Chem. Int. Ed. 52, 3607–3610. doi: 10.1002/anie.201207258
Seo, H. W., Han, C. S., Hwang, S. O., and Park, J. (2006). Dielectrophoretic assembly and characterization of individually suspended Ag, GaN, SnO2 and Ga2O3 nanowires. Nanotechnology 17:14. doi: 10.1088/0957-4484/17/14/008
Stǎnoiua, A., Simiona, C. E., and Somacescub, S. (2013). NO2 sensing mechanism of ZnO–Eu2O3 binary oxide under humid air conditions. Sens. Act. B Chem. 186, 687–694. doi: 10.1016/j.snb.2013.06.083
Wang, Z. L. (2000). Transmission Electron Microscopy of shape-controlled nanocrystals and their assemblies. J. Phys. Chem. B 104:6. doi: 10.1021/jp993593c
Weiher, R. L. (1962). Electrical properties of single crystals of indium oxide. J. Appl. Phys. 33:2834. doi: 10.1063/1.1702560
World Health Organization (2010). “Carbon monoxide,” in WHO Guidelines for Indoor Air Quality: Selected Pollutants, eds F. Theakston, B. Mills, and S. Lund (Bonn: in puncto druck + medien GmbH), 55–89.
Xu, L., Dai, Z., Duan, G., Guo, L., Wang, Y., Zhou, H., et al. (2015). Micro/nano gas sensors: a new strategy towards in-situ wafer-level fabrication of high-performance gas sensing chips. Sci. Rep. 5:10507. doi: 10.1038/srep10507
Yamazoe, N., Sakai, G., and Shimanoe, K. (2003). Oxide semiconductor gas sensors. Catal. Surv. Asia 7, 63–75. doi: 10.1023/A:1023436725457
Keywords: gas sensor, microstructures, nitrogen dioxide, humidity, indium oxide
Citation: Domènech-Gil G, Gràcia I, Cané C and Romano-Rodríguez A (2021) Nitrogen Dioxide Selective Sensor for Humid Environments Based on Octahedral Indium Oxide. Front. Sens. 2:672516. doi: 10.3389/fsens.2021.672516
Received: 25 February 2021; Accepted: 29 March 2021;
Published: 26 April 2021.
Edited by:
Nuria Castell, Norwegian Institute for Air Research, NorwayReviewed by:
Eduard Llobet, University of Rovira i Virgili, SpainCopyright © 2021 Domènech-Gil, Gràcia, Cané and Romano-Rodríguez. This is an open-access article distributed under the terms of the Creative Commons Attribution License (CC BY). The use, distribution or reproduction in other forums is permitted, provided the original author(s) and the copyright owner(s) are credited and that the original publication in this journal is cited, in accordance with accepted academic practice. No use, distribution or reproduction is permitted which does not comply with these terms.
*Correspondence: Albert Romano-Rodríguez, YWxiZXJ0LnJvbWFub0B1Yi5lZHU=; Guillem Domènech-Gil, Z3VpbGxlbS5kb21lbmVjaEBsaXUuc2U=
Disclaimer: All claims expressed in this article are solely those of the authors and do not necessarily represent those of their affiliated organizations, or those of the publisher, the editors and the reviewers. Any product that may be evaluated in this article or claim that may be made by its manufacturer is not guaranteed or endorsed by the publisher.
Research integrity at Frontiers
Learn more about the work of our research integrity team to safeguard the quality of each article we publish.