 Muhammad Muneer1
 Mumtaz Ali Khan2*†
 Fayaz Ullah Shinwari3Ijaz Ahmed4
 Syed Mamoon Siyar5
 Fahad Alshehri6
 Muhammad Shahab6*
- 1Department of Geology, Khushal Khan Khattak University, Karak, Pakistan
- 2Department of Earth and Environmental Sciences, Bahria University Islamabad, Islamabad, Pakistan
- 3Researches Organization for Development (ROD), Kabul, Afghanistan
- 4Université du Québec en Abitibi-Témiscamingue (UQAT), Québec City, QC, Canada
- 5Department of Geology, University of Malakand, Chakdara, Pakistan
- 6Department of Geology and Geophysics, College of Science, King Saud University, Riyadh, Saudi Arabia
The Study area lies in the southern Kohat deformed fold and thrust belt. This part of the Kohat plateau, borders the southern extension of the Himalayan deformation, with the Salt range to the south most. The research is based on DRASTIC model. Anthropogenic activities have the potential to pollute groundwater. An essential component of managing groundwater is vulnerability mapping. This study used the DRASTIC model to analyze aquifer vulnerability and identify the hydrogeological condition in the southern portion of the Karak, Khyber Pakhtunkhwa. For the models, the information layers were provided via geographic information systems (GIS). The DRASTIC model uses seven environmental parameters. Vulnerability index concentrations were found to be 0.78% for Very Low vulnerability, 9.57% for Low vulnerability, 24.96% for Moderate vulnerability, 54.01% for High vulnerability, and 10.68% for Very High vulnerability, according to the results. A total 164.446 km2 of the total 1,540 km2 area is covered by the Very High vulnerable zone. The highest Nitrate concentration recorded in the area is 11 ppm and lowest is 4.4 ppm. Around 45% of the samples surpassed the approved limit of PSQWA (Pakistan Standards and Quality Control Authority) and NSQWQ (National Standards for Quality of Water) standard. The concentration of Nitrate >10 ppm represent that some human action has contributed toward the highest concentration.
1 Introduction
The most crucial resource for life on Earth to survive and flourish, according to Kahlown et al. (2005) is water. There is no denying that subsurface water reservoirs are among the most important and necessary sources of freshwater on the planet (Madsen, 1995). Groundwater resources are more severely impacted by pollution than surface water resources because of the relatively tighter regulation of pollution on them, and as a result, they are rapidly running out of water. Groundwater is regarded as a “major drinking water resource” because of its low susceptibility to contamination (EPA, 1985). Though it is nearly impossible to estimate the precise volume of subsurface water present in aquifers all over the world, a rough calculation indicates that the planet’s reservoirs hold between 15.2 and 60 million cubic meters of water. The amount of fresh groundwater in this system, according to Mishra (2023), is between 8 and 10 million cubic meters, with the remaining volume being brackish and salty. Given its accessibility and superior quality to surface water, groundwater is crucial for daily activities. In daily life, groundwater is used for many things, including domestic, industrial, and agricultural uses. This transforms it into a tactical resource.
According to Abbas et al. (2012) 4,430 km3 of groundwater is pumped out of the earth each year, with about 70% of that volume being used for agriculture. The remaining 25 and 5% of the pumped groundwater are used for domestic and industrial purposes, respectively. The combined annual withdrawal across the globe, according to Eurostat data from 2011, is estimated to be around 1,000 km3 (or 22% of all groundwater pumps globally). Nearly 2 billion people are thought to rely solely on groundwater resources for their daily needs. The needs of nations all over the world are met by 273 of these groundwater resources that cross national boundaries (Richts et al., 2011). According to a UN report from UNDESA and UNECLAC (2015), the planet’s population, which was estimated to be 6.9 billion people in 2010, is growing quickly and is anticipated to reach 8.3 billion people by 2030. There is no proof that socioeconomic or ecological factors will have an impact on that number, and rapid population growth puts the world’s freshwater reserves beneath the earth’s surface in grave danger. Subsurface water supplies are burdened and pressed by industrial growth, urbanization, and agriculture, which lessens their overall dominance. The primary source of fresh water, groundwater, is used to supply a variety of domestic, commercial, and agricultural needs. There are more aquifers in that region that are susceptible to groundwater pollution from anthropogenic, domestic, industrial, and agricultural activities, all of which have a short-term impact on the water. Remediation is a pricy and difficult task to prevent long-term losses or damages from groundwater contamination (Secunda et al., 1998). Globally, the quality of subsurface waters has significantly declined as a result of accelerating industrialization, urbanization, and anthropogenic pressures (Khatri and Tyagi, 2015). In addition to harming direct and indirect ecosystem processes, subsurface aquifers with contaminated groundwater disrupt the ecosystem and pose a health risk (Danielopol et al., 2003). Chemical (chloride, nitrates, sulfates, etc.), physical (turbidity, odor, taste), and biological (e.g., bacteria) factors are just a few of the many causes of groundwater contamination. We must consider all the major contributing factors, such as chemical, physical, and biological factors, when evaluating the quality of subsurface water (Alley, 1993). The chemical factor has become more important in groundwater quality development as a result of the increased penetration hazards, ease of pollution, and various anthropogenic activities that result in a significant amount of harmful and poisonous chemical elements being discharged into groundwater. The management of subsurface water places more emphasis on these chemical parameters. When groundwater is supplied to homes and used for drinking water while containing hazardous materials, inorganic contaminants, and heavy metal residues, human lives are put in danger. Due to poor management practices and drinking water evolution, infections linked to contaminated groundwater are frequent in developing and third world nations. According to estimates from the WHO (2008), about 3.3 million people die each year in third-world nations due to insufficient access to clean water, unsanitary living conditions, or poor sanitation systems. A large portion of these deaths are thought to be caused by drinking subsurface water that has been contaminated with pathogens. Since underground aquifers are more prone to contamination than surface-water bodies, this fact primarily contributes to diseases linked to groundwater. Subsurface water is regarded as a reliable water source in Pakistan. In addition to drinking water and farming, it is used in a number of different industrial fields. About 35% of what is needed for agriculture comes from groundwater. Furthermore, it is acknowledged that underground water is one of Pakistan’s most important sources of drinking water (Daud et al., 2017). Population growth brought about unexpected and ill-managed urbanization, industrialization, and agricultural development. Pakistan’s groundwater quality is in danger due to these adverse consequences of the growing population. Due to the unchecked disposal of sewage, industrial, and solid wastes as well as the use of insecticides, herbicides, and chemical fertilizers in agriculture, it is now more likely that groundwater will become polluted. According to Kurwadkar et al. (2020) numerous shallow aquifers, particularly in urban areas, are reportedly affected by the widespread groundwater pollution caused by sewage dumping in Pakistan. In the nation’s major cities and metropolitan areas, industrial waste is the main cause of groundwater contamination. Groundwater in industrialized areas and states like Lahore, Gujranwala, and Faisalabad is susceptible to pollution because of the large amount of unprocessed toxic waste present. Additionally, the drinking water of the locals is contaminated by waste from nearby industries like textile, sporting goods, tanneries, paper, pharmaceuticals, leather, and chemical (Mahmood et al., 2011). The groundwater in the Karak region has been contaminated by the toxic waste from numerous businesses.
The health of people is impacted by the decline in groundwater quality and quantity, which also disturbs the natural equilibrium of every biota. Several organizations have already started. They take groundwater pollution very seriously and work to mitigate its effects for the benefit of society (Li et al., 2012; Mogaji et al., 2013; Yin et al., 2013; Wu et al., 2014; Jin and Ray, 2014; Shabbir and Ahmad, 2016; Tan and Duan, 2017; Kozłowski and Sojka, 2019; Li and Merchant, 2013). Subsurface water must be protected from contamination by all necessary precautions because it serves as the primary source of drinking water for the majority of people on earth. Additionally, the likelihood of contamination must be assessed (Dixon, 2005; Huan et al., 2012; Neshat et al., 2014; Pacheco et al., 2015; Shahzad et al., 2018; Mohan et al., 2018).
In the Karak district of Khyber Pakhtunkhwa, Pakistan, managing groundwater resources poses a considerable challenge due to multiple concerns regarding water quality. Javed et al. (2019) indicated that the groundwater in this area is largely impacted by high levels of sodium (Na+) and chloride (Cl−), resulting in 84% of the samples being deemed unsuitable for drinking according to WHO standards. Additionally, the study observed that groundwater quality varies spatially, with the majority of samples falling under the C3-S2, C4-S2, and C3-S3 classes, which reflect differing levels of salinity and sodicity that affect agricultural effectiveness. This situation is further complicated by contamination from heavyTamil Nadu, India, but also discov metals, as highlighted by Khan et al. (2021a, 2021b), who discovered that groundwater in Karak contains elevated concentrations of lead (Pb), silver (Ag), iron (Fe), and chromium (Cr), which pose further health hazards. Furthermore, the impact of tectonic activity is an important yet under-researched aspect of groundwater quality. Khattak et al. (2014) noted that radon levels in drinking water sources within the Karak Thrust region often exceed the EPA’s recommended safe thresholds, raising concerns about potential long-term health implications. Besides the quality concerns, fluctuations in water table depth have been recorded, with certain regions, particularly around Sur Dag and Takht-e-Nasrati, showing a downward trend, largely due to excessive extraction (Khan et al., 2021a). The overall rise in groundwater withdrawal, combined with insufficient recharge, intensifies these issues, indicating that sustainable groundwater management practices, such as constructing small dams for aquifer recharge, are essential for maintaining the long-term availability of groundwater resources in the district.
The methods and models used to assess the vulnerability of subsurface water contamination include GOD, SINTACS, MODFLOW, and DRASTIC. This study involved identifying areas that are vulnerable to contamination and used the DRASTIC model, which is based on GIS (Akib et al., 2013; Guler and Ali, 2013; Neshat et al., 2014; Ghosh et al., 2015; Pacheco et al., 2015; Feola et al., 2015; Baghapour et al., 2016; Qadir et al., 2016). The GIS-based DRASTIC model, developed by the United States Environmental Protection Agency USEPA (1994) of the USA, provides support for the assessment of groundwater vulnerability assessment and mapping on a global scale (Sener and Davraz, 2013; Ghosh et al., 2015). The acronym DRASTIC, which stands for “Disruptive, Rapid, and Strategic,” is made up of the first seven letters of the word. The elements are (D) water table depth, (R) net recharge, (A) aquifer media, (S) soil media, (T) topography, (I) vadose zone impact, and (C) hydraulic conductivity. The DRASTIC model includes a ranking scheme. Any hydrogeological setup can be given a numerical value by using weights, ratings, and rankings with an additive model to determine susceptibility to groundwater effusion (Jama et al., 2018; Jin and Ray, 2014; Kozłowski and Sojka, 2019; Shahzad et al., 2018; Yin et al., 2013).
The DRASTIC model was chosen for this research because it is well-suited to the hydrogeological and environmental conditions present in Karak District. In comparison to other models such as SINTACS (Subjectivity, Uncertainty, and Numeric Theme for assessing vulnerability of aquifers to surface contamination), AVI (Aquifer Vulnerability Index), or GOD (Groundwater Occurrence, Overlying Lithology, and Depth to Water Table), DRASTIC strikes a good balance between simplicity and depth, making it effective for evaluating groundwater vulnerability in semi-arid regions like Karak. The inclusion of seven environmental parameters in the model corresponds effectively with the varying topography, soils, and aquifer characteristics observed in the study area, ensuring that essential factors influencing groundwater vulnerability are considered.
Furthermore, DRASTIC’s GIS-based application facilitates detailed spatial mapping of vulnerability, which is crucial in light of the differences in groundwater recharge and contamination risks throughout the region. The model’s standardized framework for weighting and rating, although recognized globally, was also a suitable choice due to the accessibility of the required data and the scale of the study area.
In the southernmost region of district’s Karak Khyber Pakhtunkhwa Pakistan’s, this research was conducted. The main objective of this study is to use the GIS-based DRASTIC model to address groundwater pollution issues. Investigate how the influencing factors affect how sensitive the groundwater is to pollution. To address this, information has been gathered from a variety of private, public, and semi-public organizations. After going through a quality check, the data was integrated into ArcGIS to produce thematic maps of the DRASTIC model’s components. Finally, a map of the groundwater vulnerability index has been developed. The results of this study have been calibrated using the field data on groundwater nitrate concentration. The results of this study will be used to manage groundwater resources and identify potential groundwater risk areas. This map will help administrative department’s better serve the public and supply them with clean groundwater in the future by lowering the threat posed by polluted aquifers.
The Karak district was chosen as the focus area for DRASTIC modeling because of its distinct hydrogeological and environmental traits. This region primarily experiences arid and semi-arid conditions, resulting in scarce groundwater resources essential for agriculture, drinking water, and domestic uses. The rising human activities, including urban expansion and intensive agriculture, significantly threaten groundwater quality. Despite the critical nature of these resources, there is insufficient comprehensive research on groundwater vulnerability in the district, resulting in a lack of understanding of potential contamination risks. Previous studies have not sufficiently explored the combination of hydrogeological factors with contamination indicators like nitrate concentration to support vulnerability evaluations. By concentrating on Karak, this study seeks to fill these gaps and provide a scientific foundation for sustainable groundwater management and protective strategies that are adapted to the district’s unique circumstances.
In other regions where the DRASTIC model has been implemented, such as the Kherran Plain in Iran, our research reveals a consistent trend of increased hazard in areas characterized by shallow water tables, permeable soils, and significant human activity (Kumar et al., 2009; Chitsazan and Akhtari, 2009). Simultaneously, the study conducted in Kakamigahara Heights, Japan, emphasized that net recharge and geological media are the two primary factors influencing aquifer vulnerability, findings that align with our own research (Babiker et al., 2005). This study not only supports the conclusions drawn by Kumar et al. (2009) in Tamil Nadu, India, but also discovered a notable correlation between nitrate concentrations and zones of high susceptibility as indicated by the DRASTIC model. Conversely, our analysis revealed that the relationship between nitrate levels was more delicate, suggesting that the DRASTIC index highlights local contamination rather than widespread pollution. This difference underscores the need for susceptibility assessments to take into account the unique hydrogeological and anthropogenic ecological aspects of the specific area being investigated in order to accurately create an effective risk map.
2 Study area
The district of Karak is situated in the Kohat Division of Pakistan’s Khyber Pakhtunkhwa province (Figure 1). The study area is situated in the westernmost region of the main Himalayan foreland fold and thrust belt, the Kohat Plateau. The Kurram strike-slip fault and the Indus River separate it from the Potwar plateau in the west and east, respectively. Both the major boundary thrust in the north and the Shinghar range in the south encircle it. District Karak is comprised of three tehsils, which are further subdivided into 23 union councils. Karak is a plain and hilly region that is 548 meters (1,798 feet) above sea level. In 1982, Karak was regarded as a district.

Figure 1. Location map of District Karak.
The socio-economic conditions in Karak, shaped by local industries and farming practices, have a direct impact on the quality and availability of groundwater. In the beekeeping industry, for instance, research conducted in Karak, Bannu, and Kohat shows that many beekeepers are young and have limited educational backgrounds, facing difficulties such as pest problems and diseases (Jamil et al., 2023). These challenges, combined with a significant reliance on groundwater, contribute to the overall water stress in the region. The socio-economic effects of this water scarcity are significant, as illustrated by a study on the repercussions of water crises in Karak, which indicates that communities experience conflicts over water allocation, forced migration, and economic difficulties, especially for women who are tasked with water collection (Rasool et al., 2020). Additionally, research on drinking water quality in the region indicates that although many water sources meet safety regulations, some contain higher levels of sodium and heavy metals like iron and chromium, which could pose health risks (Ahmad et al., 2020). These socio-economic and industrial dynamics highlight the intricate connection between groundwater quality and the wellbeing of the community, underscoring the necessity for holistic water resource management to enhance both human and environmental health in Karak.
The Digital Elevation Model (DEM) of the Karak District reveals a varied topography, with elevations spanning from 339 meters in the low-lying areas to 1,474 meters in the highlands. The western and central regions, which feature lower elevations, primarily consist of plains and gently rolling terrains, whereas the rugged mountainous landscapes are found in the higher elevations located in the eastern and southeastern regions. The accompanying map (Figure 1) depicts a clearly defined dendritic drainage system, where first-order streams merge into higher-order streams, highlighting the impact of different slopes and structural influences. The variability in topography indicates that areas with high relief are more likely to experience enhanced runoff, erosion, and sediment transport, while lower regions may act as zones for sediment deposition. This varied landscape significantly affects groundwater recharge, soil stability, and land use planning, presenting vital considerations for hydrological and geological research in the region.
Karak experiences a highly fluctuating climate throughout the year, marked by hot summers and minimal annual rainfall, especially in the Thal zone, which receives <500 mm of rain each year (Khan et al., 2015). During June and July, temperatures can soar to 46°C, and the predominantly sandy soil in this area is conducive to agriculture, with crops depending on either rainfall or water from tube wells. In contrast, the northeastern Tehsil Karak receives annual rainfall between 500 and 750 mm and is characterized by medium clay soil (Khan et al., 2021b). These climatic and soil conditions are crucial in influencing the agricultural potential and water availability throughout the district.
The surface hydrology in Karak consists of seasonal flood streams that flow during or following precipitation, especially during the monsoon months of March–April and July–August. These streams contribute to downstream flow, with annual rainfall serving as the key source for aquifer recharge. The semi-arid region faces limited and sporadic rainfall, concentrated in brief rainy periods, leaving the majority of the year dry. High temperatures accompanied by heavy rainfall frequently result in substantial water loss through evaporation and runoff (Farid, 2019). Rainfall patterns indicate that 68% of the annual precipitation takes place between June and November, with summer rains being intense but short, in stark contrast to the extended, low-intensity winter showers (Khan et al., 2021b). Summers are characterized by extreme heat and monsoons in May and June, while winters are extremely cold due to the influence of western winds. The drainage system is predominantly active during flood seasons, underscoring the significant role of surface hydrology in regional water resource management.
The soil map of Karak District indicates the presence of two primary soil types: clayey and loamy. Clayey soil is found mainly in the southwestern and southeastern regions, where it retains moisture and is suitable for water-demanding crops, though it necessitates adequate drainage (Hatiye et al., 2016). Loamy soil, which spans the majority of the district, is highly fertile and accommodates a variety of crops due to its balanced mix of sand, silt, and clay (Zhao et al., 2019). The distribution of these soil types mirrors the area’s topography and climate, influencing agricultural methods and water management strategies.
3 Materials and methods
DRASTIC modeling serves as a commonly utilized method for evaluating groundwater vulnerability by integrating various hydrogeological elements to identify areas at risk. Just as climate variations and shifts in land use influence environmental factors such as temperature and air quality, DRASTIC sheds light on the geographical differences in groundwater conditions. For example, the analysis of precipitation and temperature trends in Patna Gupta et al. (2022a) illustrates how evolving climatic patterns, including reduced rainfall and increased temperatures, can affect local groundwater conditions, potentially worsening vulnerabilities. In addition, the anticipated rise in temperatures in the River Ganges basin due to climate change may lead to alterations in groundwater recharge and evaporation rates, affecting both groundwater quality and availability (Gupta et al., 2022b). Furthermore, shifts in land use, such as urban expansion and deforestation, have been found to impact air quality and local environmental health (Jodhani et al., 2024), factors that can indirectly influence groundwater through modifications in infiltration rates and contamination risks. The decrease in wetland areas in Varanasi (Das et al., 2020) also underscores how changes in land use and urbanization can diminish groundwater replenishment, which is a crucial element in DRASTIC assessments. Additionally, research on air pollutants (Srivastava et al., 2023) highlights how pollutants like SO2 and NO2 may compromise groundwater quality through acidification processes. By merging these environmental alterations, DRASTIC modeling can aid in developing strategies to alleviate risks and safeguard groundwater resources in an environment that is rapidly evolving.
One of the most popular models for determining how vulnerable groundwater is to possible pollutants is DRASTIC (Akhter and Hasan, 2016; Awawdeh et al., 2014; Fritch et al., 2000; Knox et al., 1993; Nawafleh et al., 2011; Piscopo, 2001; Secunda et al., 1998; Tan and Duan, 2017). The GIS-based DRASTIC method used seven parameters, including hydraulic conductivity, aquifer media, soil media, topography, net recharge, and groundwater table depth. Spatial datasets are combined for each of these parameters (Navulur and Engel, 1998). Each parameter is given a numerical rating in accordance with Aller et al. (1987) and USEPA (1994). The DRASTIC model specifies that each weight must be multiplied by each rating before the results are added to produce the DRASTIC index (Knox et al., 1993). Every parameter is categorized into separate groups, and each group is assigned a rating based on how significant it is. These weights were determined through expert opinion and a review of relevant literature, adhering to established protocols (Aller et al., 1987). Greater weights were given to depth to water, recharge area, and aquifer conductivity because of their considerable impact on groundwater movement and the transportation of contaminants. The other parameters received weights based on their estimated importance within the study area. The weights for each parameter were determined to be between 1 and 5, and the rate ranged from 1 to 10. According to Aller et al. (1987) based on the relative significance of each parameter (Fortin et al., 1997; Fritch et al., 2000; Jang et al., 2017; Knox et al., 1993; Mohan et al., 2018). The region’s net recharge was determined in this study by combining and analyzing data on the mean annual precipitation, land use, and other variables. The DRASTIC Index is calculated using the following Equation 1 (Nurfahasdi et al., 2023).
D = Depth to the water table.
R = Net recharge.
A = Aquifer media.
S = Soil media.
T = Topography.
I = Impact of Vadose Zone.
C = Conductivity of Water.
r = Rating.
w = Weight.
Each parameter is divided into classes, and each class is given a rating based on its significance. The ratings range from 1 to 10, with each indicating the relative susceptibility of the groundwater to contamination. Different government, semi-government, and private organizations provided various types of data for various parameters. To gather data and to confirm data obtained from secondary sources, thorough field surveys were conducted. The research utilized ESRI’s ArcGIS 10.4 to digitize the maps, process the data through interpolation, and create the final susceptibility map (Figure 2).
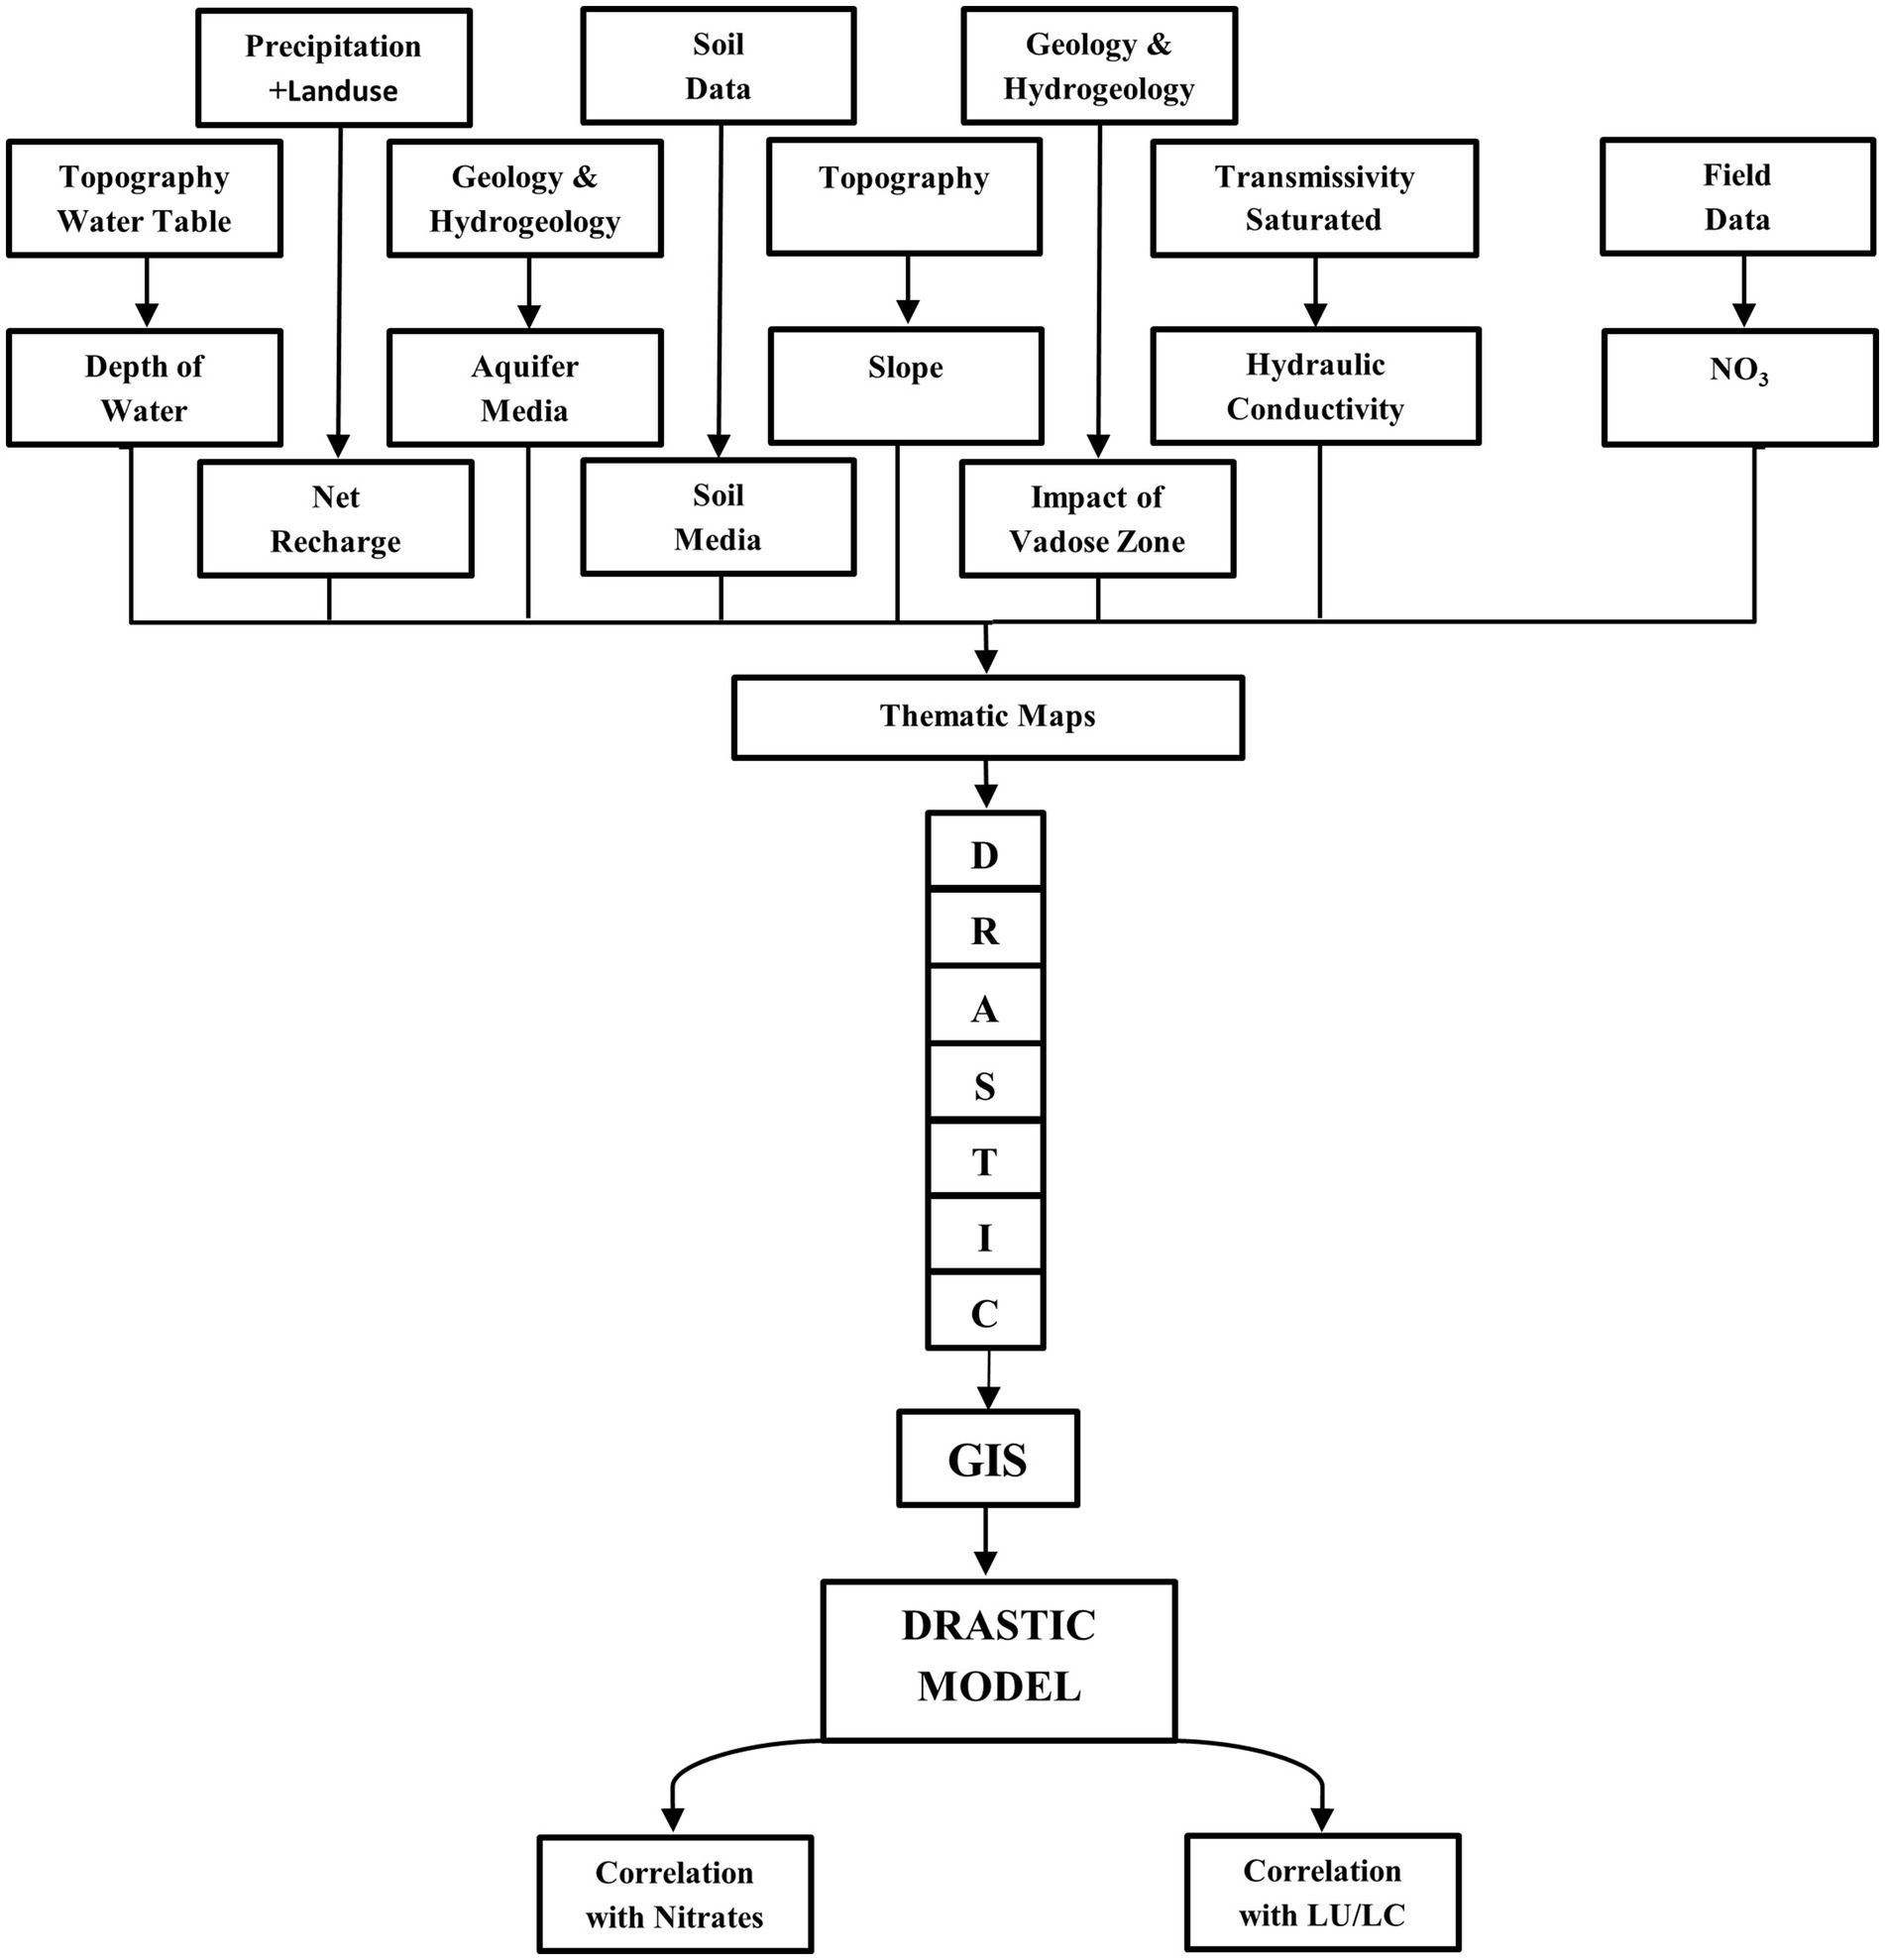
Figure 2. Flowchart of methodology.
The factors and their corresponding classes are given weights and ratings in this study based on the Delphi method. These ratings have been used all over the world and are clearly defined. For the purpose of determining the level of vulnerability, the Delphi method considers the expertise and actions of experts (Khan et al., 2016). Table 1 lists each DRASTIC factor’s data type, format, and source.
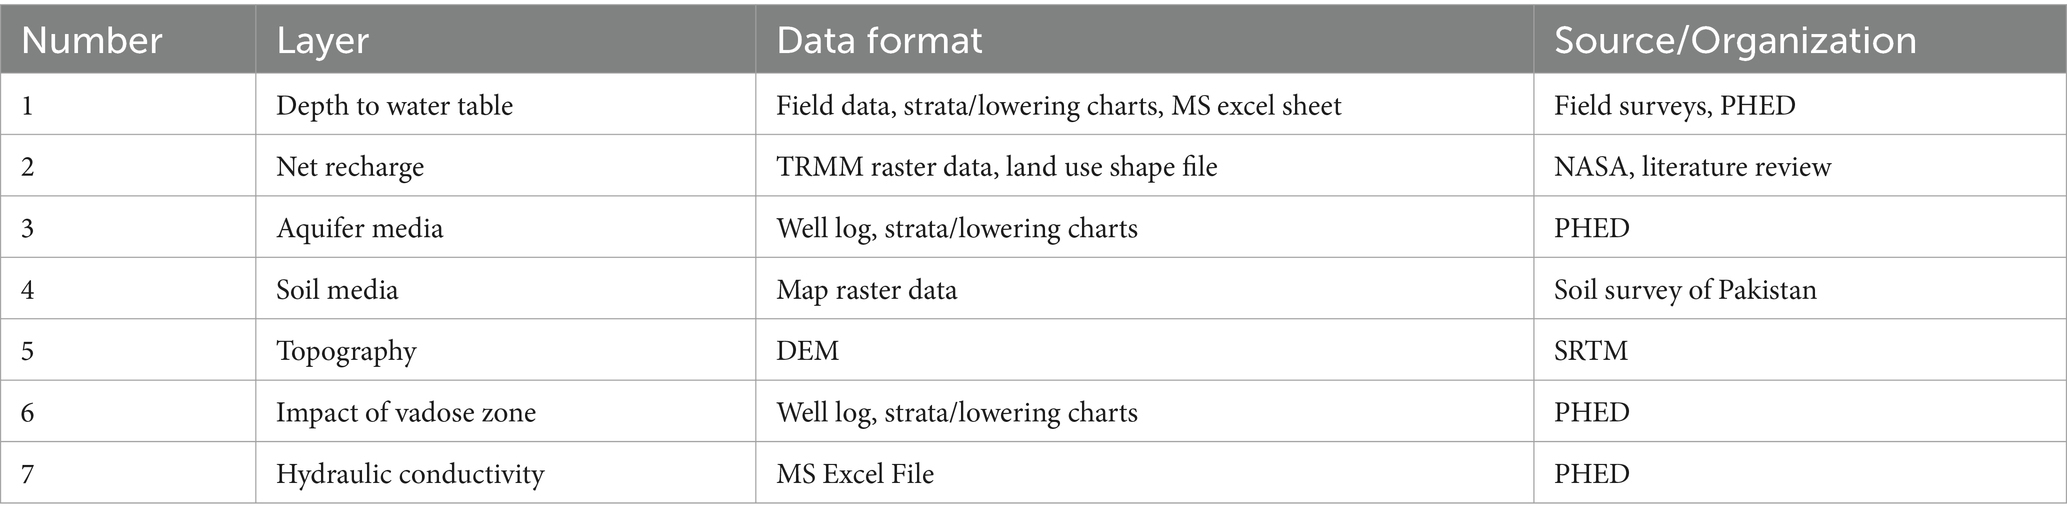
Table 1. Type and nature of data collected from various organizations.
3.1 Water table depth
The groundwater’s susceptibility to pollution is significantly influenced by the depth of the groundwater table. Less vulnerability to pollution results from a deeper water table, and vice versa. In the research area of the district Karak has a water table that is relatively deeper, with a range of 34–145 meters (Figure 3).
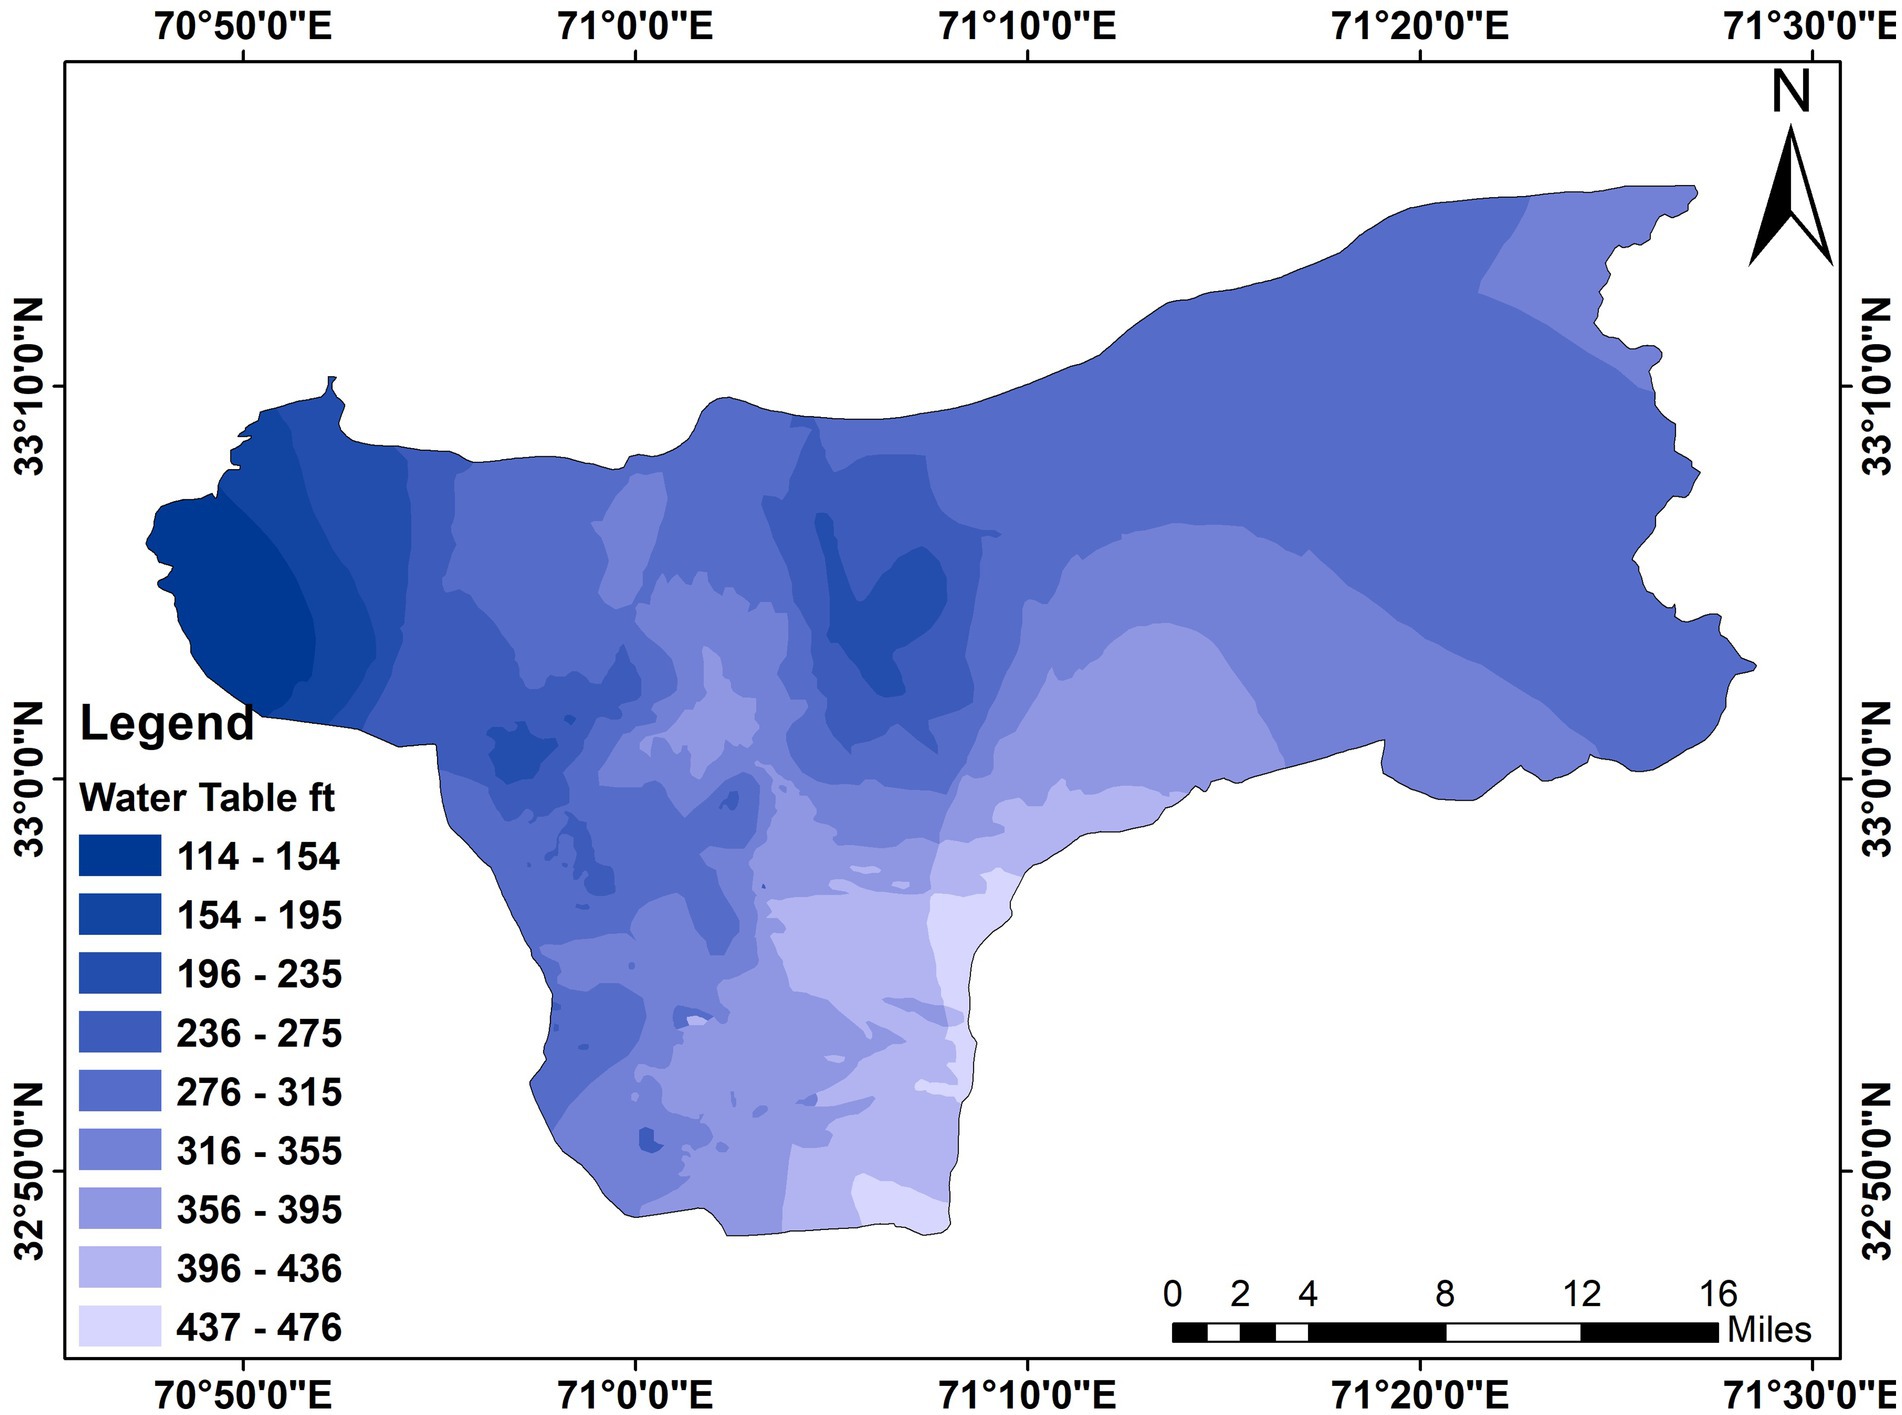
Figure 3. Depth to water table map of the study area.
3.2 Recharge
The net recharge makes it possible for pollutants to enter the aquifer in addition to diluting the contaminant. As a result, the susceptibility to contamination directly correlates with the amount of recharge, with higher recharge resulting in higher ratings (Abdullahi, 2009; Davis et al., 2002). The recharge was calculated in this study by stacking the parts. Using information on the study area, local precipitation, and land cover to perform a weighted overlay analysis. Figures 2, 3 displays maps of mean land cover, annual precipitation, and mean temperatures. The resulting map shows that district Karak’s populated areas have a lower recharge rate due to their buildup zones and slight elevation (Figure 4).
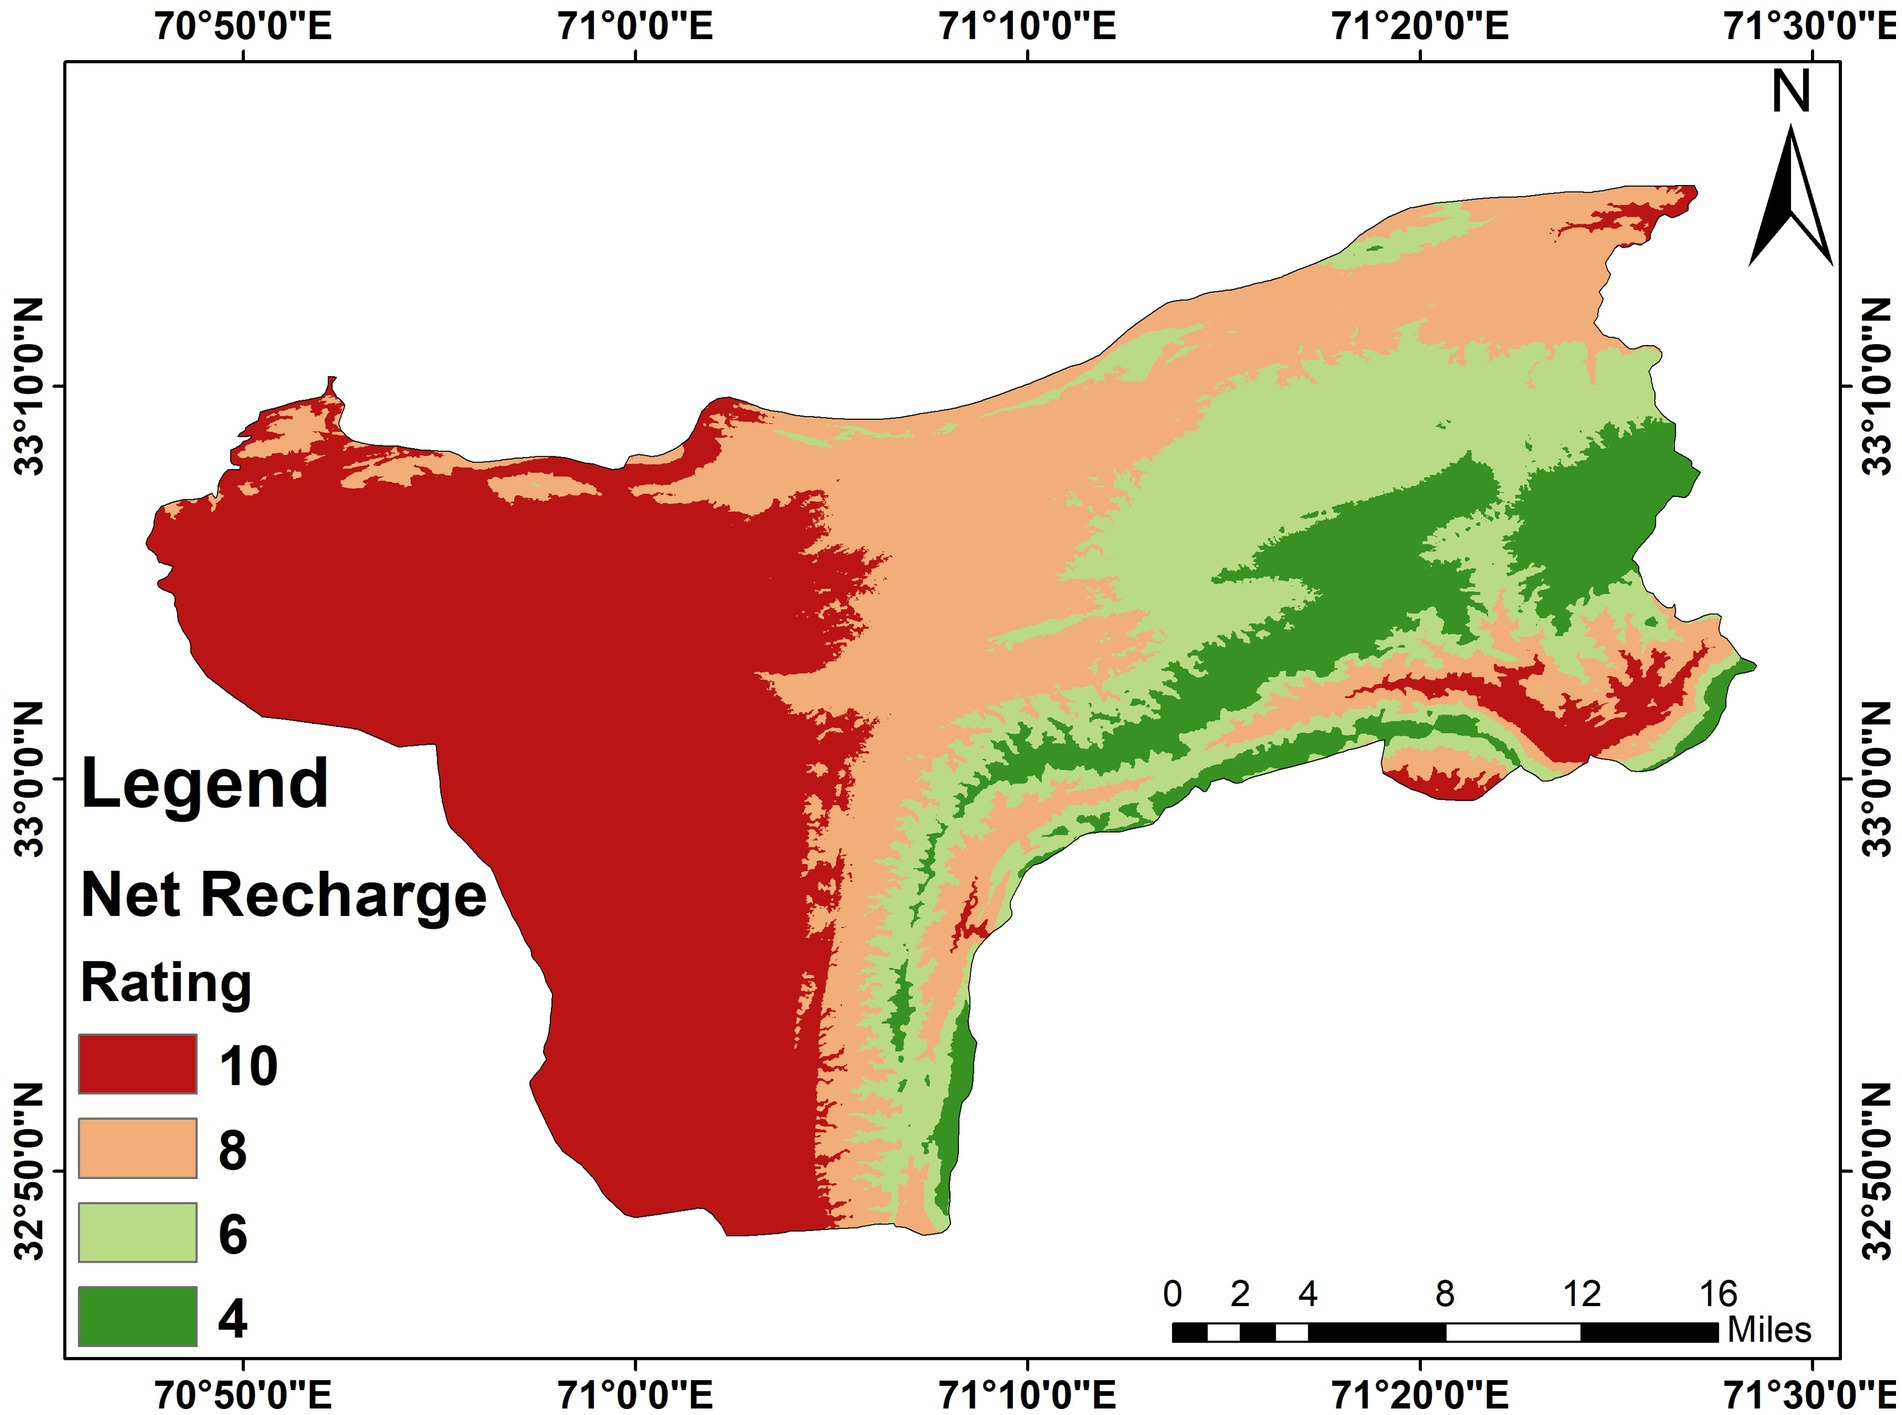
Figure 4. Net recharge map of the study area.
3.3 Aquifer media
In terms of aquifer media, permeability affects susceptibility to pollution and vice versa. Aquifers with large grained sediment have a greater propensity for pollution, whereas unfractured fine-grained aquifers have a lower propensity for it (Hearne et al., 1992). The aquifers in the study area have a relatively high permeability rating (Figure 5).
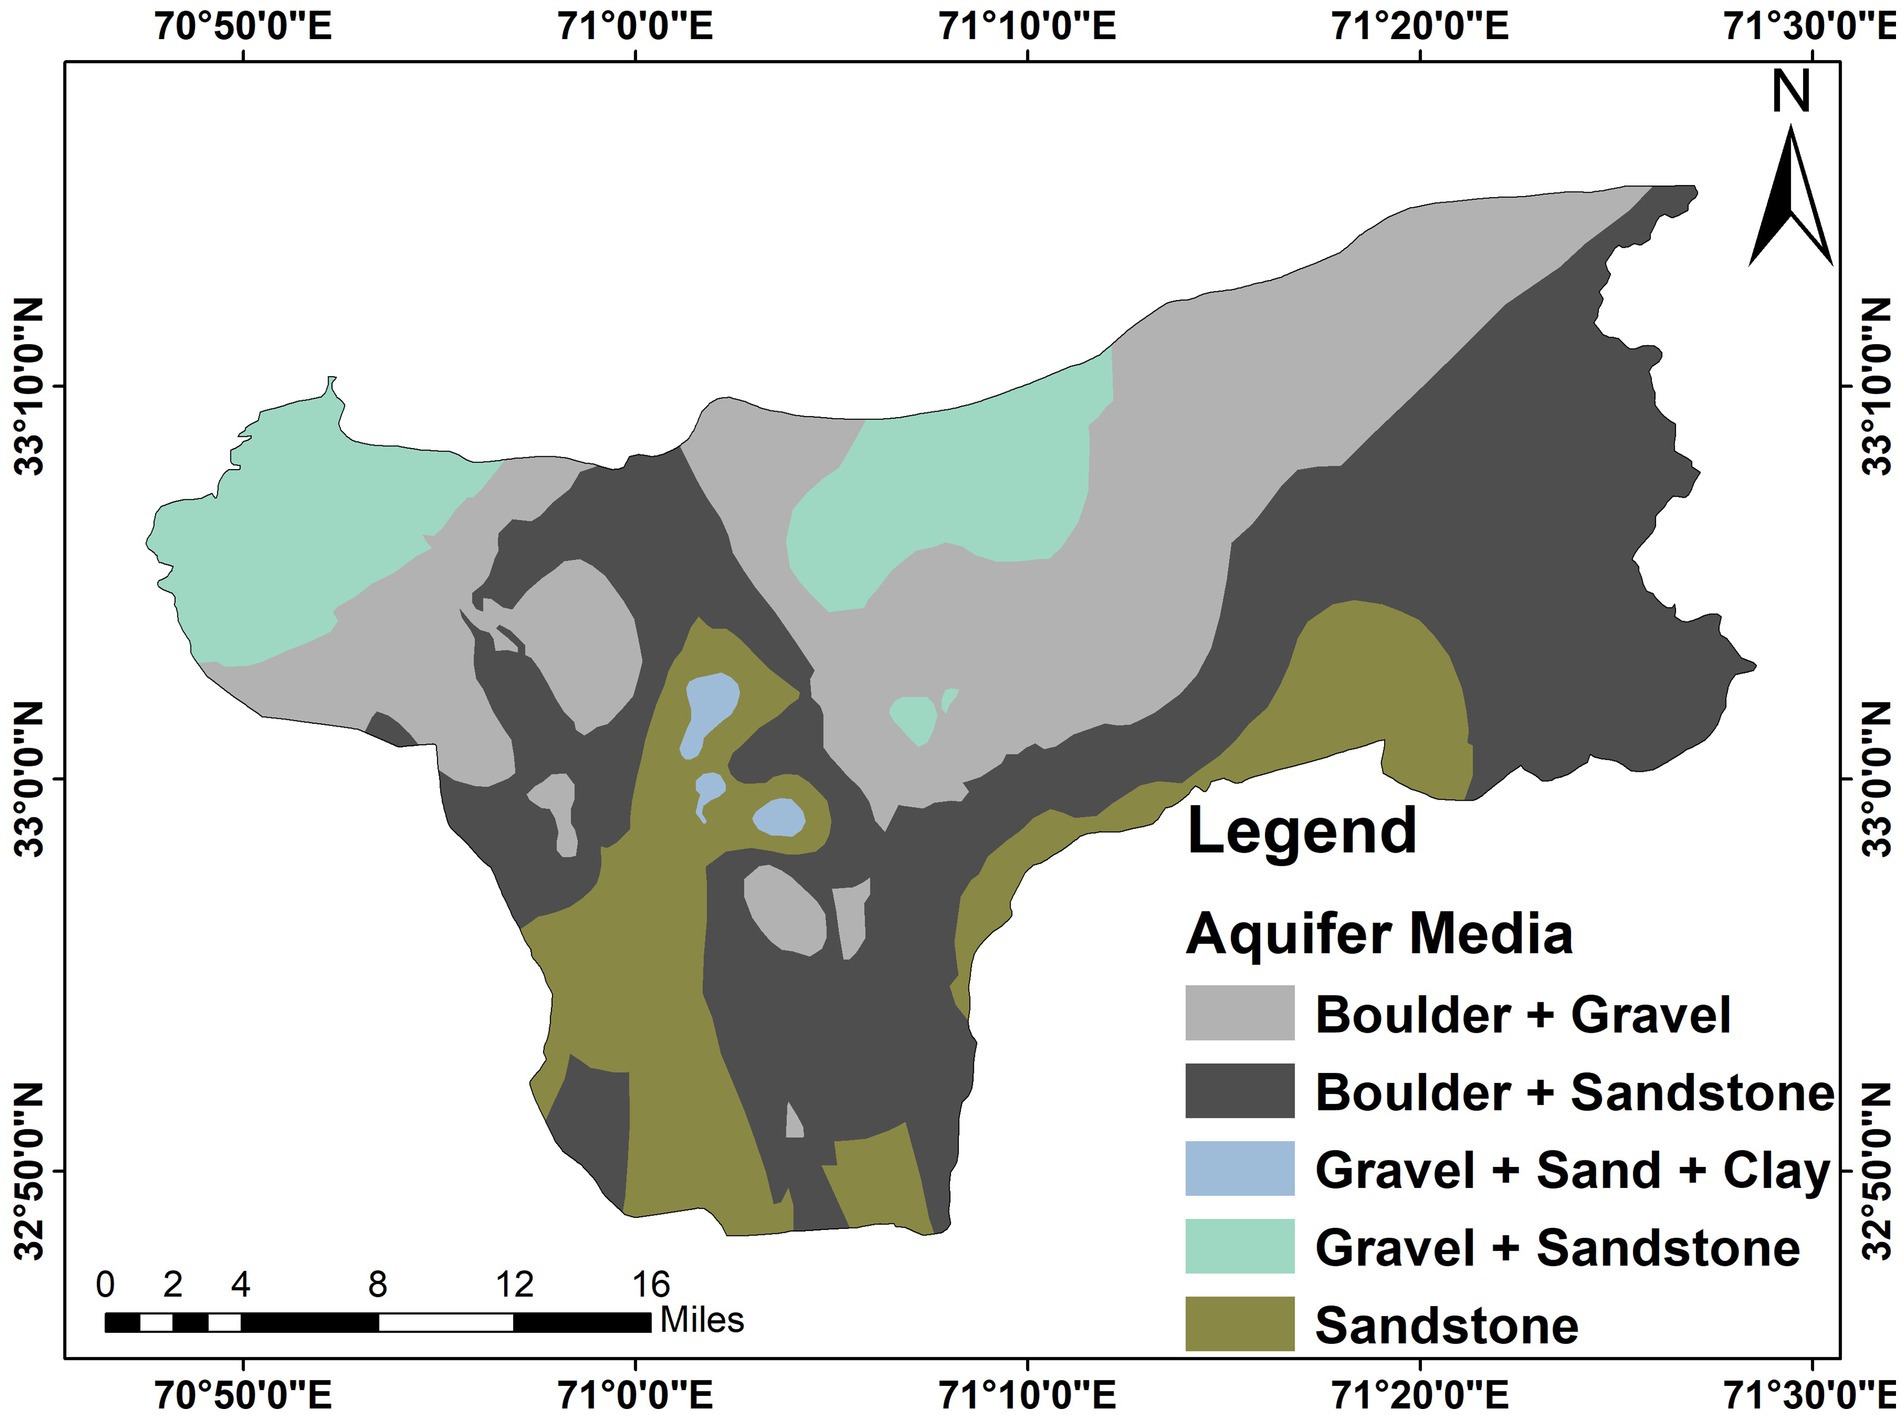
Figure 5. Aquifer media map of the study area.
3.4 Soil media
The vadose zone’s uppermost portion, known as the soil media, is a crucial component because it acts as a barrier for contaminants on their way to the aquifer. The loamy soil makes up the bulk of the research area (Figure 6).
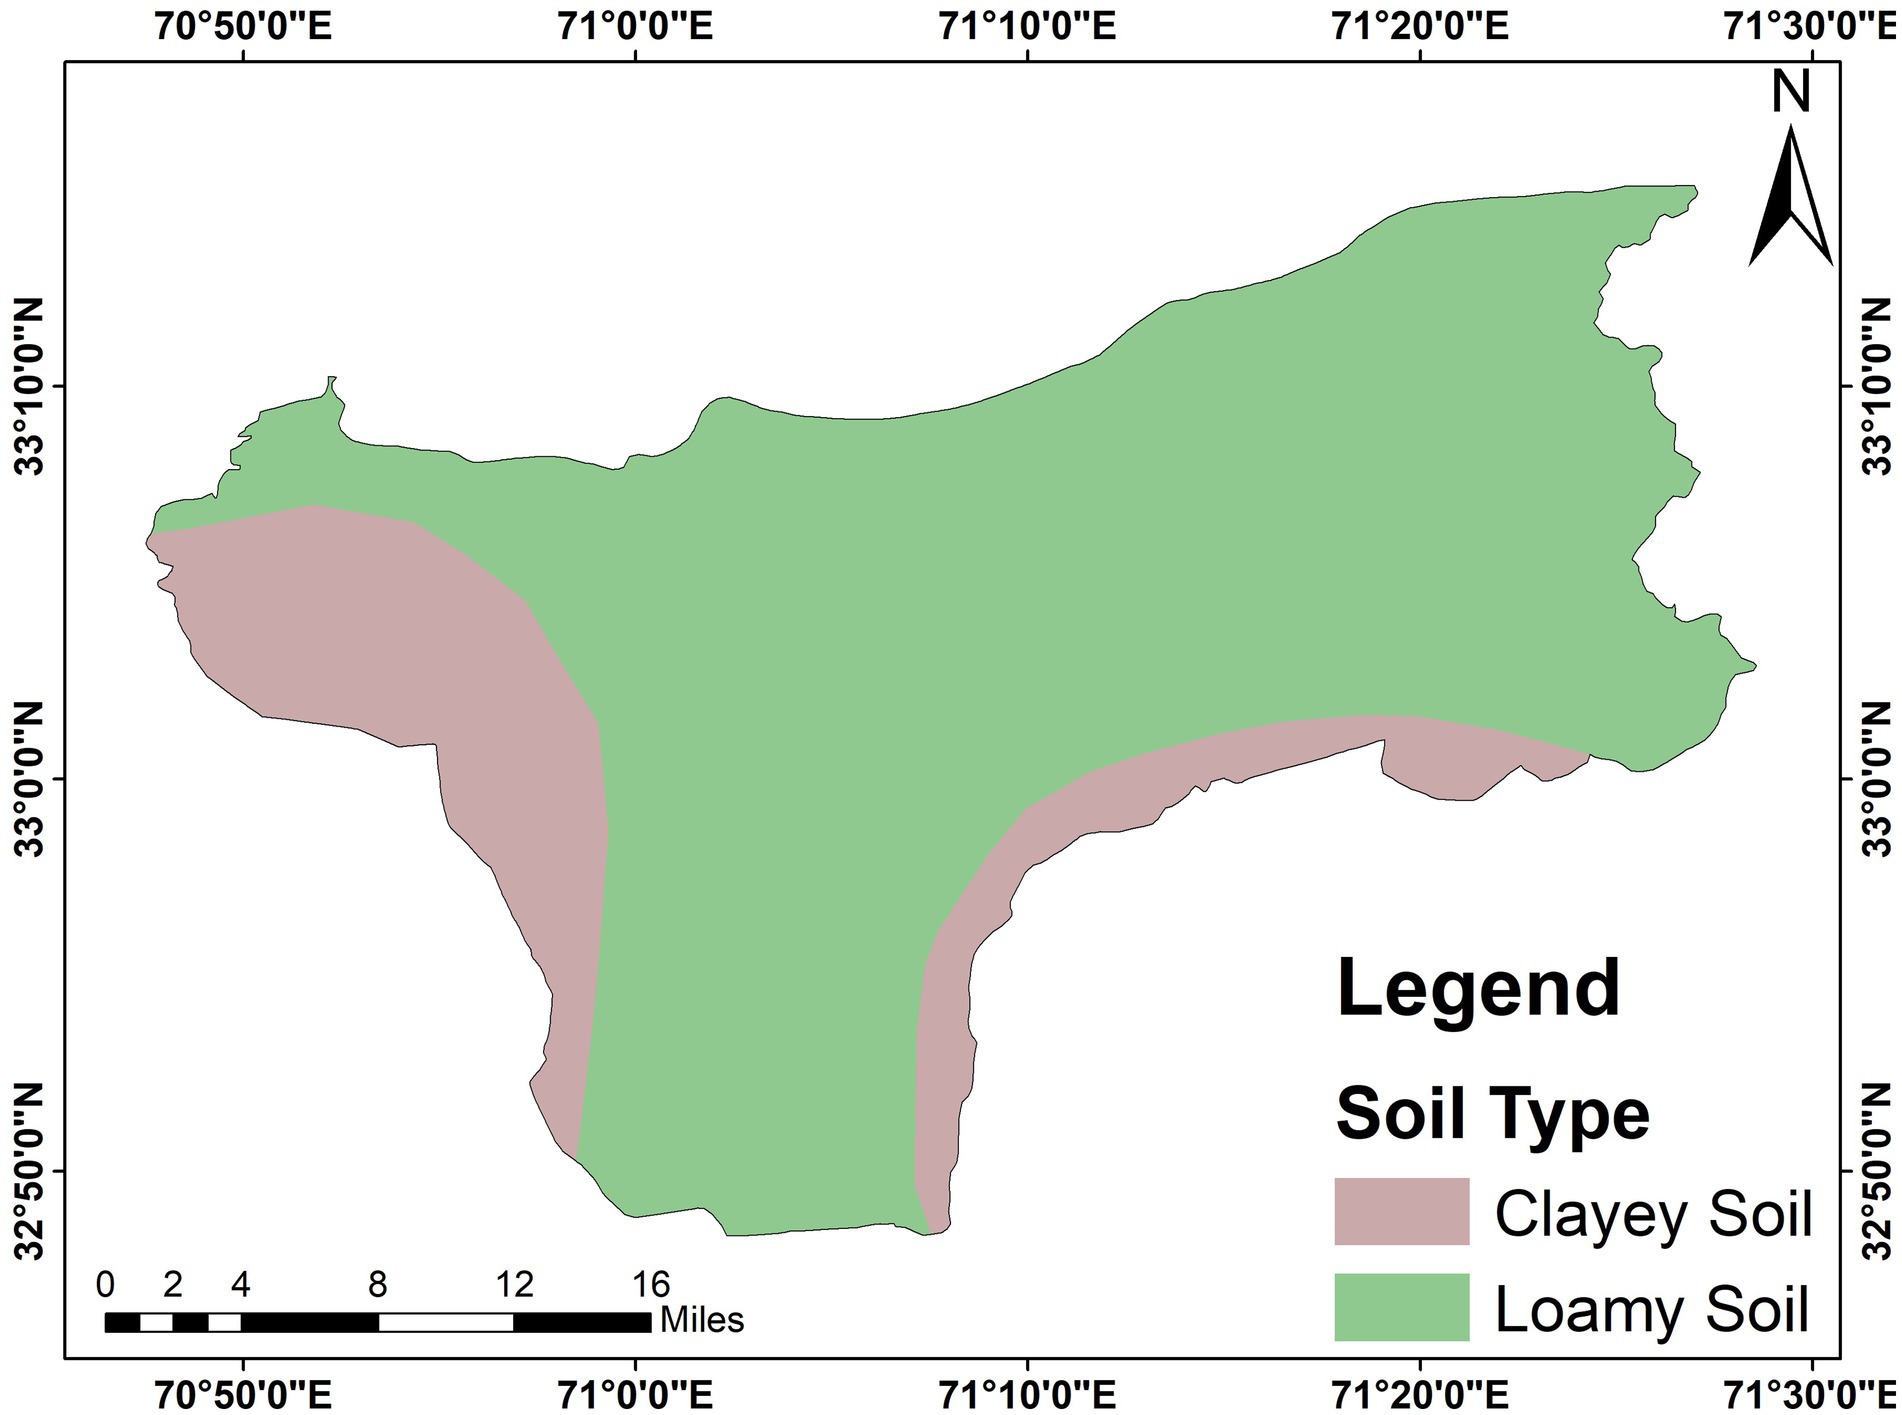
Figure 6. Soil media map of the study area.
3.5 Topography
When determining the area’s susceptibility to pollution, the topography is crucial because it affects how quickly water runs off. Water and consequently contaminants are retained for a shorter period of time the steeper the slope (Figure 7).
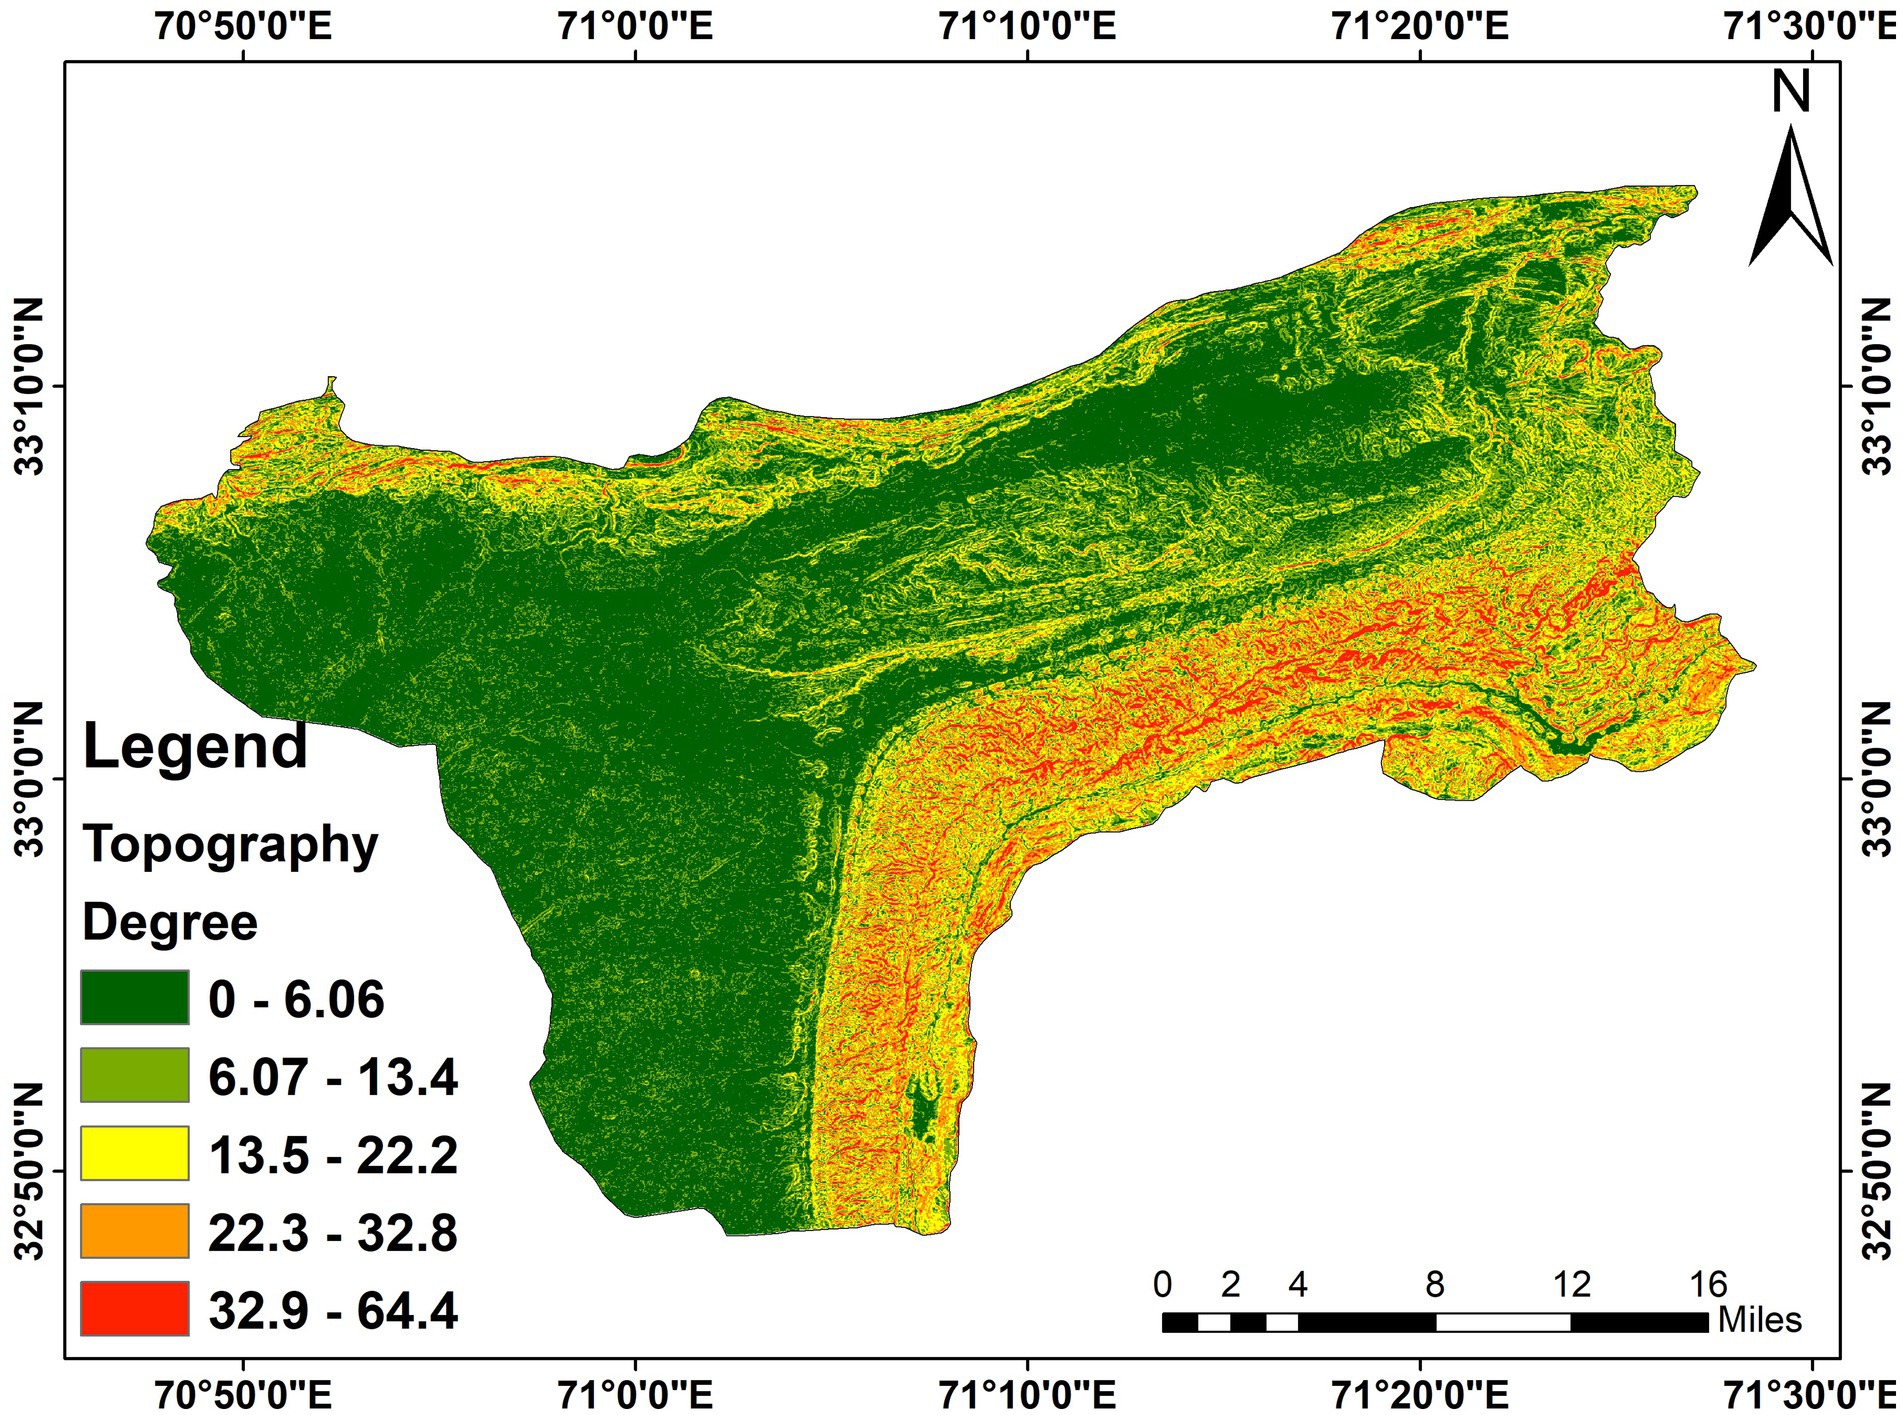
Figure 7. Topography of the study area.
3.6 Impact of vadose zone
The material in the vadose zone, which is situated between the ground surface and the aquifer, can have a big impact on the vulnerability assessment because it either limits the contamination or makes it easy for it to pass. With increasing grain size, the water below the vadose zone becomes safer (Figure 8).
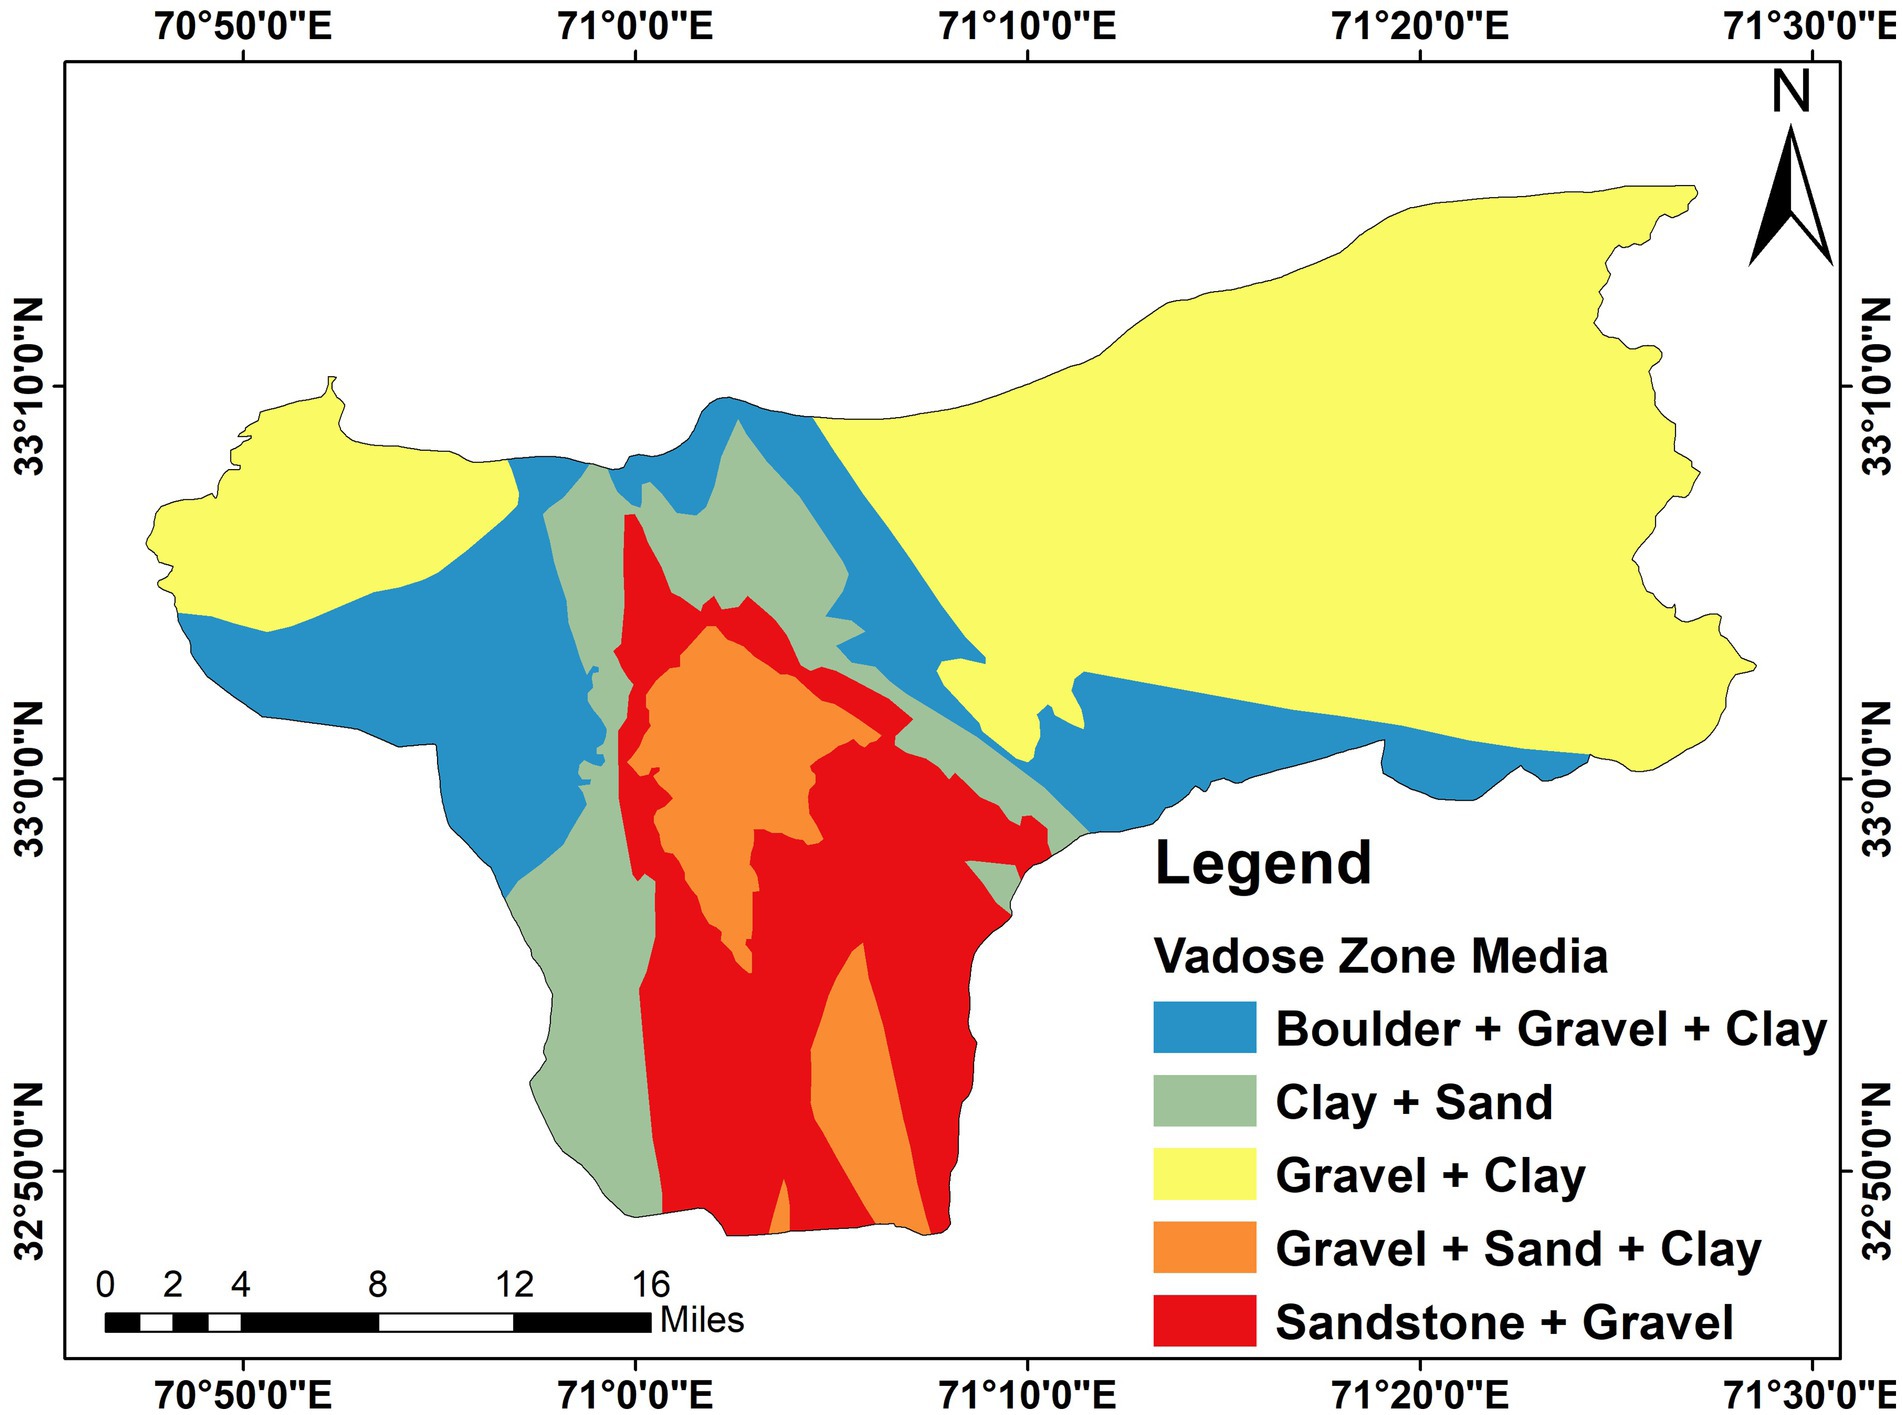
Figure 8. Vadose Zone media map of the study area.
3.7 Hydraulic conductivity
Hydraulic conductivity is the ability of aquifer rock to conduct and pass fluid. Despite carrying somewhat less weight, it is still a significant factor. The permeability of an aquifer determines its conductivity, which in turn depends on the grain size; i.e., the hydraulic conductivity will increase with finer grain size and vice versa (Figure 9).

Figure 9. Hydraulic conductivity map of the study area.
In Figures 3–9 the spatial distributions of each parameter are displayed. Table 2 lists the parameters’ ranges, rankings, and weights. In order to determine the amount of nitrate, laboratory testing of water samples was done. After that, a map (Figure 10) illustrating the distribution of nitrate concentration was produced using interpolation of the data. Arc-GIS was used to perform a weighted overlay analysis to create a final DRASTIC index map using Equation 1. Figure 11 depicts the DRASTIC index map. The DRASTIC index map was subsequently calibrated with nitrate (Figure 12). This study utilized ESRI’s ArcGIS 10.8 to collect, present, extrapolate from, and analyze the information gathered from various sources. The WGS 1984 projection system was used to create each map in ESRI’s ArcGIS software.
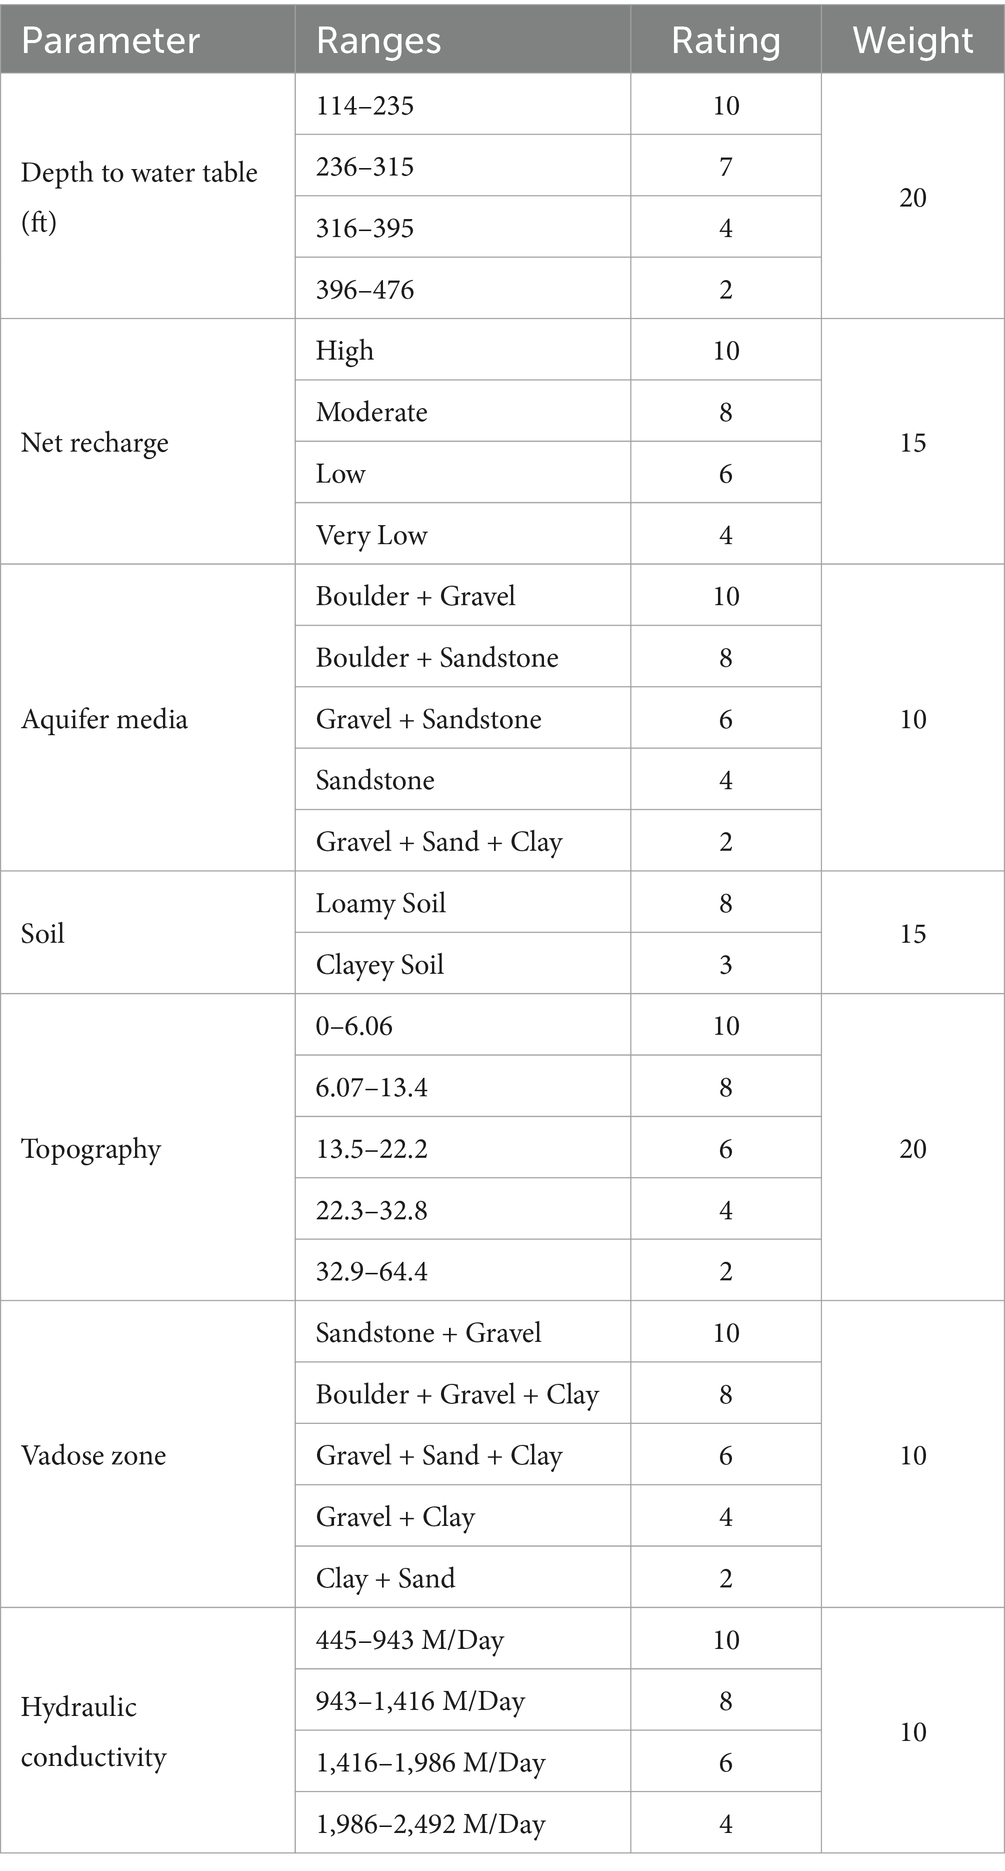
Table 2. The weight and rating assigned of each influencing DRASTIC parameters.
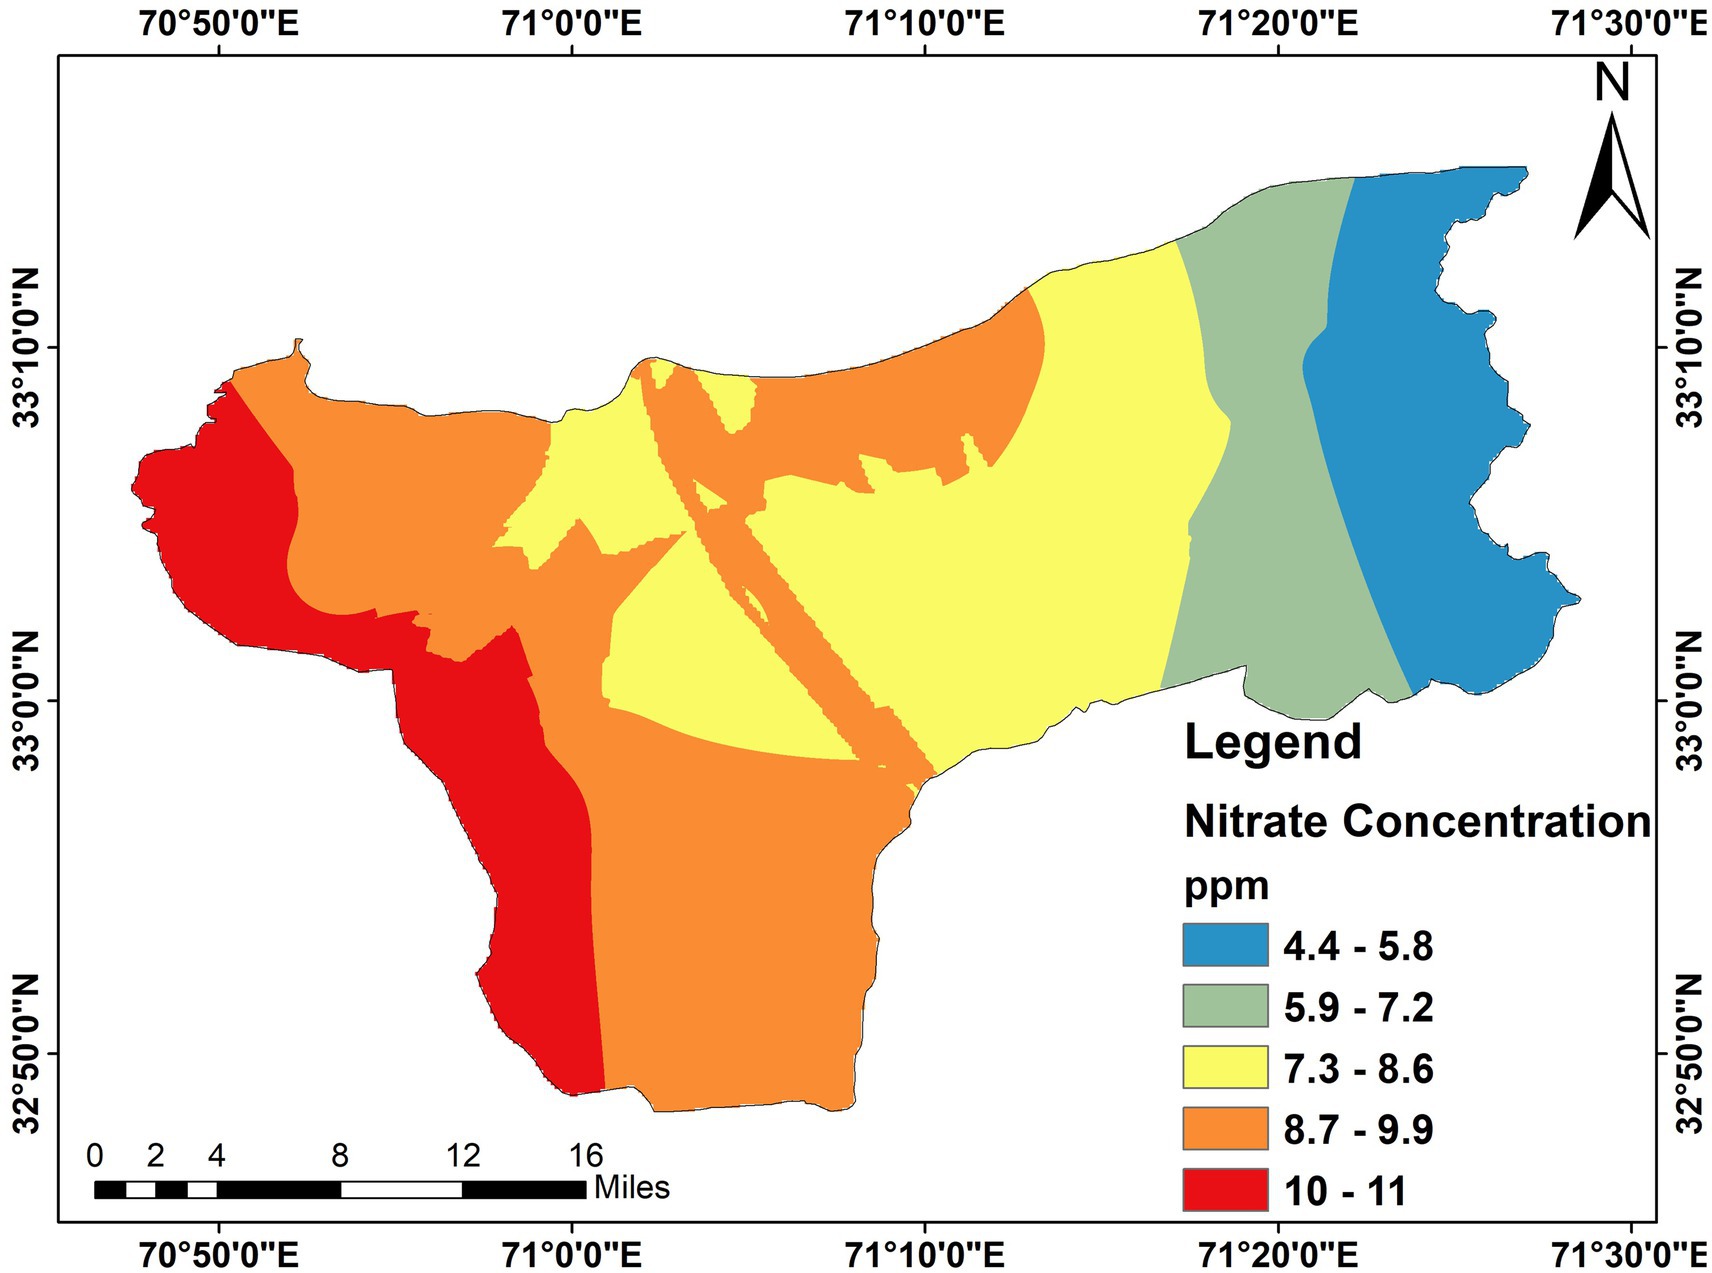
Figure 10. Spatial distribution of nitrates in the study area.

Figure 11. DRASTIC vulnerability index map.
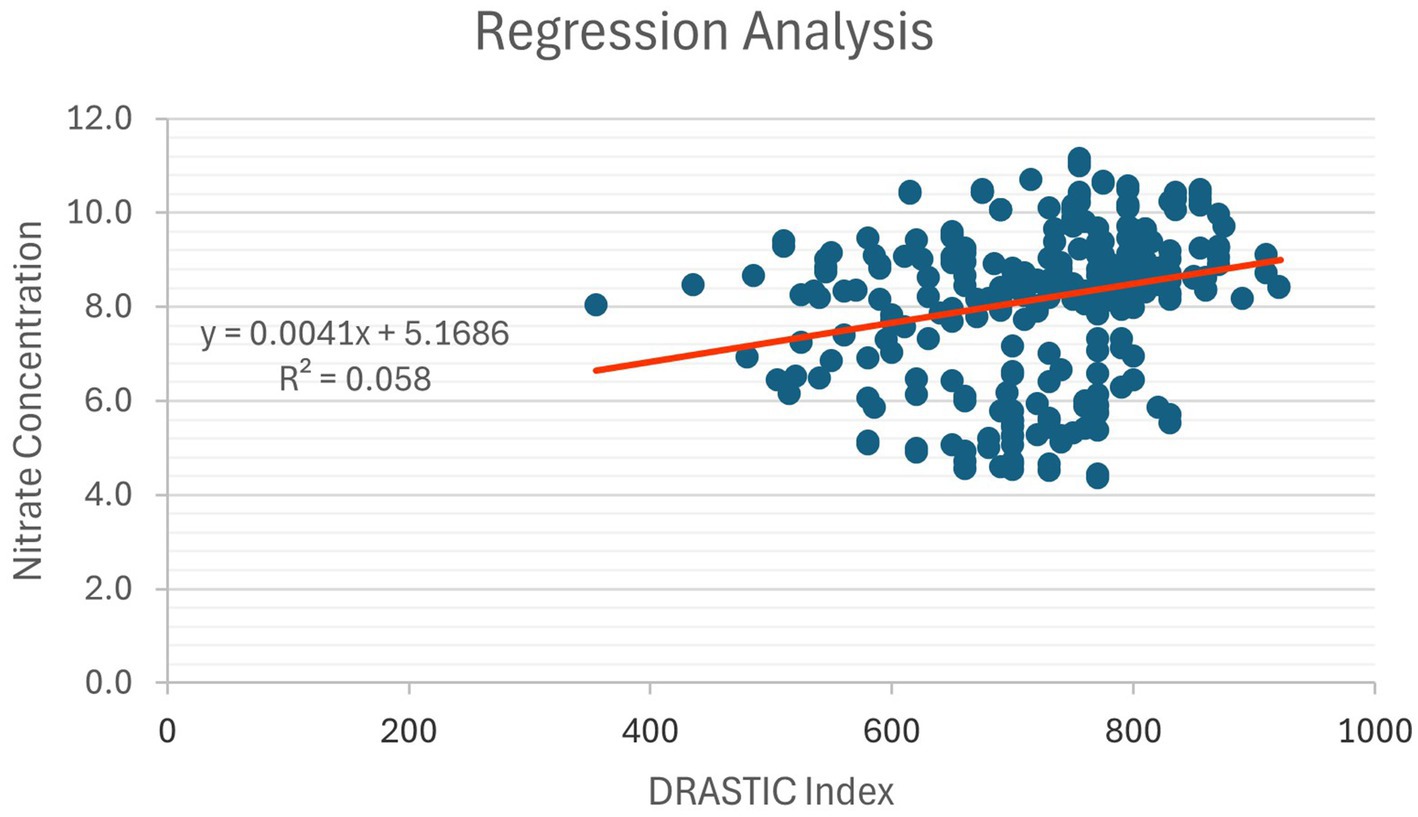
Figure 12. Regression analysis between DRASTIC index and nitrate concentrations.
4 Results and discussion
Southern Karak District has a DRASTIC vulnerability index. Data were then interpolated following that. Modifications were made to the GIS-based DRASTIC as is customary. In past studies, the GIS-based DRASTIC model frequently had aquifer or environmental parameters added to it or subtracted from it, depending on the specific research objectives and study themes. Changes to ratings and the addition of new parameters are the key modifications. Rather than the customary classes, the vulnerability index values in this study were divided into five classes: very low, low, moderate, high, and very high. The map of the DRASTIC index uses nitrate concentration as its reference point. A map of the research area is needed to measure the impact of anthropogenic activities and to portray pollution susceptibility more accurately.
The results showed the DRASTIC index values ranging from 325 to 950. A lower DRASTIC index value means that pollution is less likely to occur. According to Table 3, there are five categories for the DRASTIC index values: Very Low, Low, Moderate, High and Very High. The values of the DRASTIC index can be categorized using a variety of methods, such as classification based on a histogram’s valleys (Kumar et al., 2016, 2017a, 2017b, 2020), quantile classification (Rahman, 2008), and using natural breaks, Jenks, to classify the values of the DRASTIC index (Kumar and Pramod Krishna, 2019). However, classes in this study were split into equal intervals (Kaliraj et al., 2014; Maqsoom et al., 2020; Rajput et al., 2020).

Table 3. Statistical distribution of the DRASTIC map.
A large section of the study area is covered by the highly vulnerable zone which 831.795 square kilometers and it captivates 54.01% of the total area of the study area. On the DRASTIC index map, the Very Low vulnerable zone is less evenly distributed and takes up 16.06 square kilometers less territory. Which make up 0.78 percent of the entire region. The Low vulnerable zone covers 147.359 square km area which is 9.475 of the total area, Moderate zone covers 384.327 square km area which is 24.965 of the total area and the Very high vulnerable zone covers 164.446 square km area which make up to 10.68% of the total study area.
The most significant factor in the research area is the depth of the water table. In the study area, the water table is at its deepest point (450 feet). When the water table is deeper, the region is less vulnerable to contaminants seeping below. The research region receives very little recharge, which lessens its susceptibility to contamination from the surface. This is the second important component. Due to the investigated area’s high level of impermeability, pollution is less likely to affect it. The area’s fine particles coat the surface and keep contaminants from penetrating. The minute grain-size particles filter the water and stop pollutants from flowing downward. The area is generally unpopulated, lies in a medium-vulnerable zone, has a shallow water table, is clayey on the surface, and has a small amount of soil. Low permeability causes a contaminated particle to migrate only little downhill. Large, extremely porous sandstone and gravel particles make up the aquifer media in this zone, which can allow for groundwater contamination. The high sensitivity is caused by a number of variables. One of the main reasons for the high vulnerability zone is that it receives a lot more recharging than other research locations. These areas also have strong vadose zones, high hydraulic conductivity, and very permeable aquifer media. These factors make the area more vulnerable, based on the weight and rating that each range is given. Even though this zone’s slope is fairly steep, Aller et al. (1987) gave it a minimum weight of “1,” therefore it is insufficient to reduce susceptibility.
Human activities like intensive farming, inadequate waste management, industrial processes, and urban development can greatly affect groundwater quality by contaminating it with pollutants including nitrates, pesticides, and heavy metals. Human activities like extensive farming methods, inadequate waste management, industrial operations, and urban development can greatly affect groundwater quality by releasing contaminants such as nitrates, pesticides, and heavy metals.
Most studies either employ a map of annual precipitation or a map of the distribution of rainfall (Ghosh et al., 2015; Kumar and Pramod Krishna, 2019; Saha and Alam, 2014), in order to compute recharge. According to some studies (Awawdeh et al., 2014), the Net Recharge can be calculated using rainfall patterns and soil permeability. The DRASTIC index map and information on land use and land cover are sometimes combined to create updated DRASTIC maps (Awawdeh et al., 2014). However, in this study, the land use map is combined. Because of the importance of both of these factors in influencing how much an aquifer recharges, net recharge can be computed using mean annual precipitation.
To reduce risks in areas with high vulnerability, it is vital to employ strategies that are both targeted and specific to the context. In regions prone to groundwater pollution, the establishment of localized water purification systems like reverse osmosis or advanced filtration methods is essential for providing safe drinking water. Moreover, it is important to implement controlled practices for groundwater extraction to avoid further depletion and contamination of resources. The use of GIS and remote sensing technologies can facilitate real-time tracking of groundwater quality and levels, thus offering early warning systems for potential risks. Additionally, enforcing more stringent land-use regulations, especially in recharge zones, along with encouraging sustainable farming methods through incentives, will lessen the strain on groundwater supplies. These approaches, customized to fit the distinct conditions of each high-risk area, are crucial for effectively addressing risks and fostering long-term water sustainability.
4.1 Correlation of the DRASTIC map with nitrate concentration
A map (Figure 11) of Nitrate concentration was created to calibrate and confirm the DRASTIC vulnerability map. Forty samples from the study area’s accessible zone were taken and the nitrate parameter was examined to create this map. The permissible level established by Pakistan Standard Quality Control Authority (PSQCA) and National Standard for Drinking Water Quality (NSDWQ) is 10 ppm, but the average value over the entire region is 8.67 ppm. The lowest and highest concentrations that were measured were 4.4 ppm and 11 ppm, respectively. The permitted limit of PSQWA and NSQWQ standard was exceeded by about 45% of the samples. Figure 10 identifies the area of district Karak where nitrate is concentrated. The Regression analysis (Figure 12) showed a very weak correlation between DRASTIC model and the Nitrate concentration in the karak region with the R2 0.058.
Nitrate concentrations more than 10 ppm indicate that human activity has played a role in the highest concentration (Spalding and Exner, 1993). After the preparation of both the DRASTIC index map and the nitrate concentration map it showed that in the areas where the nitrate concentration is higher the DRASTIC index values are also higher in those areas.
4.2 Correlation of the DRASTIC map with land use/land cover
To explore the relationship between Land Use/Land Cover (LULC) and the DRASTIC index, a point sampling approach was utilized. A series of points were randomly created within the study region. For each point, the LULC category was identified by superimposing the point onto the LULC map. After that, the relevant DRASTIC index value was obtained from the DRASTIC index map at each point’s location. The gathered LULC categories and corresponding DRASTIC index values for all the randomly generated points were then organized into a table.
Based on the gathered data (Table 4), an assessment was performed to comprehend the connection between land use/land cover (LULC) and groundwater vulnerability. This assessment included computing summary statistics (mean, standard deviation, minimum, maximum) for DRASTIC index values corresponding to each LULC category. The findings showed that crop areas had the highest average DRASTIC index value, indicating a greater vulnerability of groundwater. Urban regions also demonstrated considerable vulnerability with a high average DRASTIC index. In comparison, areas with tree cover had the lowest average DRASTIC index value, suggesting a reduced vulnerability of groundwater. Barren land presented an intermediate average DRASTIC index. These results imply that crops and urban zones may necessitate more rigorous land management strategies to reduce the risk of groundwater pollution. Conversely, tree-covered areas could function as a natural barrier, minimizing the risks associated with groundwater pollution.
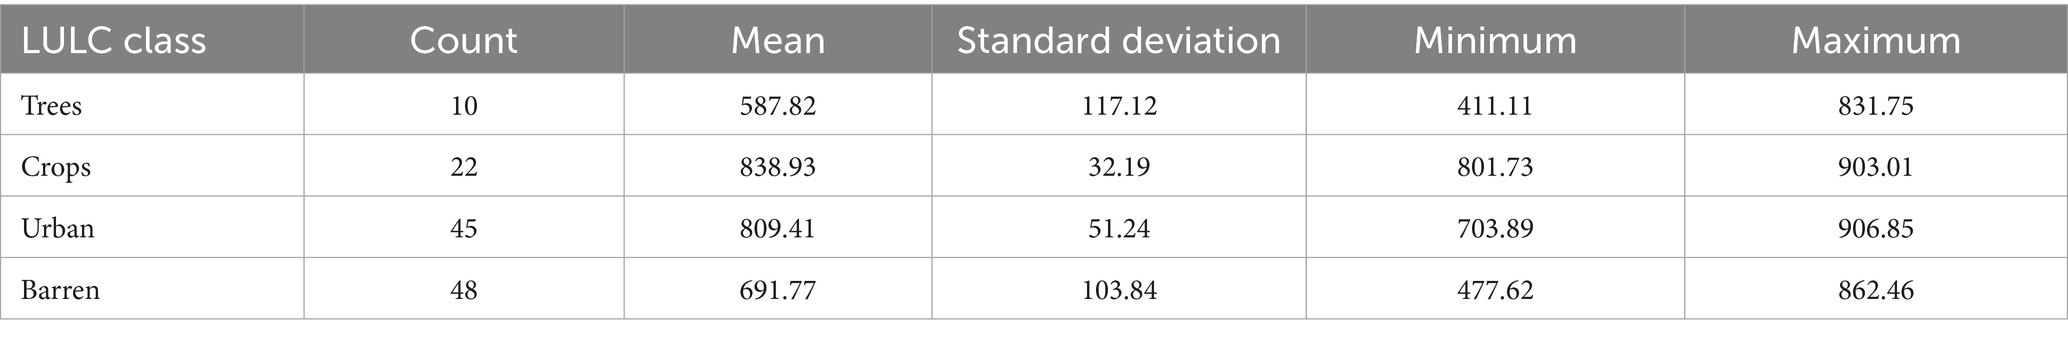
Table 4. Correlation of LULC with DRASTIC index.
The analysis indicates that among the land-use and land-cover (LULC) categories, agricultural crops have the highest average DRASTIC index value (838.93), indicating a relatively high vulnerability to groundwater issues. Urban regions also show considerable vulnerability with an elevated average DRASTIC index (809.41). On the other hand, areas covered by trees have the lowest average DRASTIC index value (587.82), implying they have a lower vulnerability to groundwater issues compared to agricultural crops and urban regions. Barren land presents a moderate average DRASTIC index (691.77). These results imply that agricultural crops and urban areas may require more rigorous land management strategies to reduce the risks of groundwater contamination. Possible measures could include proper waste management, regulated use of fertilizers and pesticides, and rainwater harvesting techniques. In contrast, maintaining tree coverage can serve as a natural barrier that lessens the risks of contaminating groundwater. Therefore, it is advantageous to preserve and enhance tree cover for the protection of groundwater resources.
4.3 Implications of the DRASTIC index map
The DRASTIC index map clearly showed that the water table depth, slope, vadose zone material, presence of surface water bodies, and net recharge are the main elements influencing groundwater vulnerability. There are differences in these elements between the high and low through the moderate index zones. Care must be taken when doing so because it is normal practice in many places to dispose of waste and effluents in surface water bodies, which are given higher indices and provide an excellent recharge for groundwater. The most vulnerable discovery was the discovery of the highly contaminated surface streams in the Hattar area. The industrial garbage that was dumped there poisoned the nearby waterway. The highlands, where there is more precipitation and groundwater flowing from north to south, are where the majority of recharge occurs in the research area. This further demonstrates why the places on the map have a higher vulnerability score. In light of this, it is suggested that improving the state of crises should start with the more vulnerable places, particularly in the southern regions where facilities like the Shanawa nuclear facility and the area around it that are drained by those effluents. These further require specific duties to use appropriate technological solutions for disposal of these effluents in order to rehabilitate and recover the contaminated ecosystem. Additionally, it is advised that efforts for health risk monitoring be started right once to guarantee the safety of the areas and the people who live there.
5 Conclusion
This research employed the GIS-based DRASTIC model to assess groundwater vulnerability in the Karak District, indicating that 54.01% of the land is classified as high vulnerability zones and 10.68% as very high vulnerability, primarily attributed to shallow water tables, high rates of recharge, and permeable aquifer materials. In contrast, areas identified as low and very low vulnerability constitute only 9.57 and 0.78% of the region, respectively, linked to deeper water tables and lower permeability. These results highlight the urgent need for specific measures, such as encouraging sustainable farming practices, improving wastewater treatment facilities, and enforcing land-use regulations to safeguard recharge zones and reduce contamination risks from fertilizers, urban runoff, and industrial waste. Although the DRASTIC model offers a solid basis for vulnerability assessment, it has limitations, including the omission of dynamic contamination sources and reliance on indirect indicators of pollutants, which require validation through direct monitoring of contaminants. Future studies should integrate additional factors, like real-time data on nitrate concentrations, and investigate machine learning techniques to enhance predictive precision. The conclusions drawn from this study provide a scientific foundation for effective policymaking and sustainable management of groundwater resources that considers the specific circumstances of semi-arid regions like Karak.
Data availability statement
The original contributions presented in the study are included in the article/supplementary material, further inquiries can be directed to the corresponding author/s.
Author contributions
MM: Investigation, Methodology, Writing – original draft. MK: Conceptualization, Resources, Supervision, Writing – review & editing. FS: Formal analysis, Software, Writing – original draft. IA: Data curation, Validation, Writing – review & editing. SS: Data curation, Writing – review & editing. FA: Funding acquisition, Project administration, Writing – review & editing. MS: Funding acquisition, Writing – review & editing.
Funding
The author(s) declare that financial support was received for the research, authorship, and/or publication of this article. The authors extend their appreciation to Researchers Supporting Project Number (RSP2025R327), King Saud University, Riyadh, Saudi Arabia.
Conflict of interest
The authors declare that the research was conducted in the absence of any commercial or financial relationships that could be construed as a potential conflict of interest. The authors declare no conflict of interest.
Generative AI statement
The author(s) declare that no Gen AI was used in the creation of this manuscript.
Publisher’s note
All claims expressed in this article are solely those of the authors and do not necessarily represent those of their affiliated organizations, or those of the publisher, the editors and the reviewers. Any product that may be evaluated in this article, or claim that may be made by its manufacturer, is not guaranteed or endorsed by the publisher.
References
Abbas, J. I., Kiyani, S. G., Ahsan, M. S., and Akram, H., &. Iqbal,. (2012). Spatio-temporal analysis of water table within Rawalpindi municipal jurisdiction. NUST. Islamabad.
Abdullahi, U. (2009). Evaluation of models for assessing groundwater vulnerability to pollution in Nigeria. Bayero J. Pure Appl. Sci. 2, 138–142. doi: 10.4314/bajopas.v2i2.63801
Ahmad, S., Faisal, S., Ali, F., Ullah, S., Ullah, R., Khan, M. A., et al. (2020). Assessment of drinking water quality and human health risks in Karak and adjoining areas, southeastern Kohat Basin, Pakistan. J. Himalayan Earth Sci. 53:126.
Akhter, G., and Hasan, M. (2016). Determination of aquifer parameters using geoelectrical sounding and pumping test data in Khanewal District, Pakistan. Open Geosci. 8:71. doi: 10.1515/geo-2016-0071
Akib, S., Shirazi, S. M., Imran, H. M., Yusop, Z., and Harun, Z. B. (2013). Groundwater vulnerability assessment in the Melaka state of Malaysia using DRASTIC and GIS techniques. Environ. Earth Sci. 70, 2293–2304. doi: 10.1007/s12665-013-2360-9
Aller, L., Lehr, J., Petty, R., Bennett, T., and Hackett, G. (1987). DRASTIC: A standardized system for evaluating groundwater pollution potential using hydrogeologic settings. Nat. Water Well Assoc. 29, 23–37. doi: 10.17491/jgsi/1987/290112
Awawdeh, M., Obeidat, M., and Zaiter, G. (2014). Groundwater vulnerability assessment in the vicinity of Ramtha wastewater treatment plant, North Jordan. Appl. Water Sci. 5, 321–334. doi: 10.1007/s13201-014-0194-6
Babiker, K. I. S., Mohamed, M. A., Hiyama, T., and Kato, K. (2005). A GIS-based DRASTIC model for assessing aquifer vulnerability in Kakamigahara Heights, Gifu prefecture, Central Japan. Sci. Total Environ. 345, 127–140. doi: 10.1016/j.scitotenv.2004.11.005
Baghapour, M. A., Nobandegani, A. F., Talebbeydokhti, N., Bagherzadeh, S., Nadiri, A. A., Gharekhani, M., et al. (2016). Optimization of DRASTIC method by artificial neural network, nitrate vulnerability index, and composite DRASTIC models to assess groundwater vulnerability for unconfined aquifer of shiraz plain, Iran. J. Environ. Health Sci. Eng. 14:13. doi: 10.1186/s40201-016-0254-y
Chitsazan, Y. M., &. Akhtari, Y. (2009). A GIS-based DRASTIC model for assessing aquifer vulnerability in Kherran plain, Khuzestan, Iran. Water Resour. Manag., 23, 1137–1155, doi: 10.1007/s11269-008-9319-8
Danielopol, J., Griebler, C., Gunatilaka, A., Notenboom, J., Griebler, C., and Gunatilaka, A. (2003). Present state and future prospects for groundwater ecosystems. Environ. Conserv. 30, 104–130. doi: 10.1017/S0376892903000109
Das, N., Ohri, A., Agnihotri, A. K., Omar, P. J., and Mishra, S. (2020). Wetland dynamics using geo-spatial technology. Adv. Water Res. Eng. Manage. Select Proc. TRACE 39, 237–244. doi: 10.1007/978-981-13-8181-2_18
Daud, S. J., Nafees, M., Ali, S., Rizwan, M., Bajwa, R. A., and Shakoor, M. B. (2017). Drinking water quality status and contamination in Pakistan. Biomed. Res. Int. 2017, 1–18. doi: 10.1155/2017/7908183
Davis, A. D., Long, A. J., and Wireman, M. (2002). KARSTIC: a sensitivity method for carbonate aquifers in karst terrain. Environ. Geol. 42, 65–72. doi: 10.1007/s00254-002-0531-1
Dixon, B. (2005). Applicability of neuro-fuzzy techniques in predicting ground water vulnerability: a sensitivity analysis. J. Hydrol. 309, 17–38. doi: 10.1016/j.jhydrol.2004.11.010
EPA (1985). Compilation of air pollution emission factors, AP-42. New York, NY: US Environmental Protection Agency.
Farid, H. U. (2019). Assessing seasonal and long-term changes in groundwater quality due to over-abstraction using geostatistical techniques. Environ. Earth Sci. 78:386. doi: 10.1007/s12665-019-8373-2
Feola, G., Lerner, A. M., Jain, M., Joseph, M., Montefrio, F., and Nicholas, K. A. (2015). Researching farmer behavior in climate change adaptation and sustainable agriculture: lessons learned from five case studies. J. Rural. Stud. 39, 74–84. doi: 10.1016/j.jrurstud.2015.03.009
Fortin, M., Thomson, K., and Edwards, G. (1997). The role of error propagation for integrating multisource data within spatial models: The case of the DRASTIC groundwater vulnerability model. London: Earth Surface Remote Sensing, 358–361.
Fritch, T., Yelderman, J. C., and Arnold, J. G. (2000). An aquifer vulnerability assessment of the Paluxy aquifer, Central Texas, USA, using GIS and a modified DRASTIC approach. J. Environ. Manag. 25, 337–345.
Ghosh, A., Tiwari, A. K., and Das, S. (2015). A GIS based DRASTIC model for assessing groundwater vulnerability of Katri watershed, Dhanbad, India. Modeling Earth Systems Environment 1:2. doi: 10.1007/s40808-015-0009-2
Guler, C., and Ali, M. (2013). Assessment of groundwater vulnerability to nonpoint source pollution in a Mediterranean coastal zone Mersin, Turkey under conflicting land use practices. Ocean Coastal Manage. 71, 141–152. doi: 10.1016/j.ocecoaman.2012.10.010
Gupta, N., Mahato, P. K., Patel, J., Omar, P. J., and Tripathi, R. P. (2022a). Understanding trend and its variability of rainfall and temperature over Patna (Bihar). Curr. Directions Water Scarcity Res. 7, 533–543. doi: 10.1016/B978-0-323-91910-4.00030-3
Gupta, N., Patel, J., Gond, S., Tripathi, R. P., Omar, P. J., and Dikshit, P. K. S. (2022b). Projecting future maximum temperature changes in river Ganges Basin using observations and statistical downscaling model (SDSM). River dynamics and flood hazards: Studies on risk and mitigation. Singapore: Springer Nature Singapore, 561–585.
Hatiye, S. D., Hari Prasad, K. S., Ojha, C. S., and Adeloye, A. J. (2016). Estimation and characterization of deep percolation from rice and berseem fields using lysimeter experiments on sandy loam soil. J. Hydrol. Eng. 21:05016006. doi: 10.1061/(ASCE)HE.1943-5584.0001365
Hearne, G., Wireman, M., Campbell, A., Turner, S., and Ingersoll, G. (1992). Vulnerability of the uppermost ground water to contamination in the greater Denver area. New York, NY: US Geological Survey, Water-Resources Investigations Report.
Huan, H., Wang, J., and Teng, Y. (2012). Science of the total environment assessment and validation of groundwater vulnerability to nitrate based on a modified DRASTIC model: a case study in Jilin City of Northeast China. Sci. Total Environ. 440, 14–23. doi: 10.1016/j.scitotenv.2012.08.037
Jama, R., Ikram, M., and Khan, K. (2018). Physicochemical properties of soil and water along Haro River and Khanpur dam, Haripur, Pakistan. Int. J. Econ. Environ. Geol. 9, 54–61.
Jamil, H., Akif, M., Khan, F., Shah, N. U., Nabi, E. U., Haris, M., et al. (2023). Socio-economic analysis of beekeeping: A case study of District Karak, Bannu, and Kohat. Journal of Xi’an Shiyou University, Natural Science Edition, 19, 1159–1169.
Jang, W., Engel, B., Harbor, J., and Theller, L. (2017). Aquifer vulnerability assessment for sustainable groundwater management using DRASTIC. Water 9:792. doi: 10.3390/w9100792
Javed, T., Sarwar, T., Ullah, I., Ahmad, S., and Rashid, S. (2019). Evaluation of groundwater quality in district Karak Khyber Pakhtunkhwa, Pakistan. Water Sci. 33, 1–9. doi: 10.1080/11104929.2019.1626630
Jin, S., and Ray, C. (2014). Using fuzzy logic analysis for siting decisions of infiltration trenches for highway runoff control. Sci. Total Environ. 493, 44–53. doi: 10.1016/j.scitotenv.2014.05.121
Jodhani, K. H., Gupta, N., Parmar, A. D., Bhavsar, J. D., Patel, H., Patel, D., et al. (2024). Synergizing google earth engine and earth observations for potential impact of land use/land cover on air quality. Results Eng. 22:102039. doi: 10.1016/j.rineng.2024.102039
Kahlown, M. A., Majeed, A., Ashraf, M., and Tahir, M. A. (2005). Drinking water quality in Pakistan: a case study of Islamabad and Rawalpindi cities. Pakistan Council of Research in Water Resources, Islamabad, Pakistan, 245–253.
Kaliraj, S., Chandrasekar, N., Peter, T., Selvakumar, S., and Magesh, N. (2014). Mapping of coastal aquifer vulnerable zone in the south west coast of Kanyakumari, South India, using GIS-based DRASTIC model. Environ. Monit. Assess. 187:1. doi: 10.1007/s10661-014-4073-2
Khan, A., Ahmad, S., and Noman, M. (2015). Sustainability of groundwater resources in semi-arid regions using integrated hydrological modeling and remote sensing: a case study from Pakistan. Environ. Earth Sci. 74, 4443–4456. doi: 10.1007/s12665-015-4641-3
Khan, A., Hassan, M., and Rasheed, M. (2021a). Evaluation of groundwater quality and vulnerability to contamination in the Lahore region of Pakistan. Environ. Earth Sci. 80:438. doi: 10.1007/s12665-021-08904-0
Khan, R., Islam, S., and Singh, R. (2016). Methods of estimating groundwater recharge. Int. J. Eng. Assoc. 5, 1047–1057.
Khan, A., Naeem, M., Zekker, I., Arian, M. B., Michalski, G., Zeeshan, S., et al. (2021b). Multivariate statistical analysis of heavy metals and physico-chemical parameters in the groundwater of Karak District, Khyber Pakhtunkhwa, Pakistan. Proc. Estonian Acad. Sci. 70, 297–306. doi: 10.3176/proc.2021.3.08
Khatri, S. N., &. Tyagi, S. (2015). Influences of natural and anthropogenic factors on surface and groundwater quality in rural and urban areas. Front. Life Sci., 8, 23–39, doi: 10.1080/21553769.2014.933716
Khattak, N. U., Khan, M. A., Shah, M. T., and Ali, N. (2014). Radon concentration in drinking water sources of the region adjacent to a tectonically active Karak thrust, southern Kohat plateau, Khyber Pakhtunkhwa, Pakistan. J. Radioanal. Nucl. Chem. 302, 315–329. doi: 10.1007/s10967-014-3257-0
Knox, R. C., Sabatini, D. A., and Canter, L. W. (1993). Subsurface transport and fate processes. New York, NY: Lewis Publishers.
Kozłowski, M., and Sojka, M. (2019). Applying a modified DRASTIC model to assess groundwater vulnerability to pollution: a case study in Central Poland. Pol. J. Environ. Stud. 28, 1223–1231. doi: 10.15244/pjoes/84772
Kumar, A., and Pramod Krishna, A. (2019). Groundwater vulnerability and contamination risk assessment using GIS-based modified DRASTIC-LU model in hard rock aquifer system in India. Geocarto Int. 35, 1149–1178. doi: 10.1080/10106049.2018.1557259
Kumar, S. K., Rammohan, V., Sahayam, J. D., and Jeevanandam, M. (2009). Assessment of groundwater quality and hydrogeochemistry of Manimuktha River basin, Tamil Nadu, India. Environ. Monitor. Assessment 159, 341–351. doi: 10.1007/s10661-008-0633-7
Kumar, P., Thakur, P., Bansod, B., and Debnath, S. (2016). Groundwater vulnerability assessment of Fatehgarh Sahib District. Punjab: India International Science Festival (IISF) - Young Scientists’ Conclave (YSC).
Kumar, P., Thakur, P., Bansod, B., and Debnath, S. (2017a). Groundwater: a regional resource and a regional governance. Environ. Dev. Sust. 20, 1133–1151. doi: 10.1007/s10668-017-9931-y
Kumar, P., Thakur, P., Bansod, B., and Debnath, S. (2017b). Multicriteria evaluation of hydro-geological and anthropogenic parameters for the groundwater vulnerability assessment. Environ. Monit. Assess. 189:564. doi: 10.1007/s10661-017-6267-x
Kumar, P., Thakur, P., Bansod, B., and Debnath, S. (2020). Groundwater vulnerability assessment and mapping using DRASTIC model. London: CRC Press.
Kurwadkar, A. S., Kanel, S. R., and Nakarmi, A. (2020). Groundwater pollution: occurrence, detection, and remediation of organic and inorganic pollutants. Water Environ. Res. 92, 1659–1668. doi: 10.1002/wer.1415
Li, Y., Li, J., Chen, S., and Diao, W. (2012). Establishing indices for groundwater contamination risk assessment in the vicinity of hazardous waste landfills in China. Environ. Pollut. 165, 77–90. doi: 10.1016/j.envpol.2011.12.042
Li, R., and Merchant, J. W. (2013). Modeling vulnerability of groundwater to pollution under future scenarios of climate change and biofuels-related land use change: a case study in North Dakota, USA. Sci. Total Environ. 447, 32–45. doi: 10.1016/j.scitotenv.2013.01.011
Madsen, E. L. (1995). Impacts of agricultural practices on subsurface microbial ecology. Adv. Agron. 54, 1–67. doi: 10.1016/S0065-2113(08)60897-4
Mahmood, B. S. Q., Baig, S. A., Nawab, B., Shafqat, M. N., Pervez, A., &. Zeb, B. S. (2011). Development of low cost household drinking water treatment system for the earthquake affected communities in northern Pakistan. Desalination, 273, 316–320. doi: 10.1016/j.desal.2011.01.052
Maqsoom, A., Aslam, B., Khalil, U., Ghorbanzadeh, O., Ashraf, H., Faisal Tufail, R., et al. (2020). A GIS-based DRASTIC model and an adjusted DRASTIC model (DRASTICA) for groundwater susceptibility assessment along the China–Pakistan economic corridor (CPEC) route. ISPRS Int. J. Geo Inf. 9:332. doi: 10.3390/ijgi9050332
Mishra, R. K. (2023). Fresh water availability and its global challenge. Br. J. Multidisciplinary Adv. Stu. 4, 1–78. doi: 10.37745/bjmas.2022.0208
Mogaji, K. A., Lim, H. S., and Abdullah, K. (2013). Modeling groundwater vulnerability prediction using geographic information system GIS-based ordered weighted average OWA method and DRASTIC model theory hybrid approach. Arab. J. Geosci. 7, 5409–5429. doi: 10.1007/s12517-013-1163-3
Mohan, C., Western, A. W., Wei, Y., and Saft, M. (2018). Predicting groundwater recharge for varying land cover and climate conditions. A global meta-study. Hydrol. Earth Syst. Sci. 22, 2689–2703. doi: 10.5194/hess-22-2689-2018
Navulur, K. C. S., and Engel, B. A. (1998). Groundwater vulnerability assessment to non-point source nitrate pollution on a regional scale using GIS. Trans. ASAE 41, 1671–1678. doi: 10.13031/2013.17343
Nawafleh, A., Awawdeh, M., and Salameh, E. (2011). Assessment of groundwater vulnerability to contamination in Irbid governorate, North Jordan. DIRASAT 38, 122–133.
Neshat, A. R., Pradhan, B., and Dadras, M. (2014). Groundwater vulnerability assessment using an improved DRASTIC method in GIS. Resour. Conserv. Recycl. 86, 74–86. doi: 10.1016/j.resconrec.2014.02.008
Nurfahasdi, S. M., Zega, A. Y., Silalahi, A. M. E., Singh, D. R., and Babayev, A. (2023). Mapping groundwater vulnerability using drastic method. E3S Web Conf. 434:03019. doi: 10.1051/e3sconf/202343403019
Pacheco, F. A. L., Pires, L. M. G. R., Santos, R. M. B., and Fernandes, L. F. S. (2015). Factor weighting in DRAS-TIC modeling. Sci. Total Environ. 505, 474–486. doi: 10.1016/j.scitotenv.2014.09.092
Piscopo, G. (2001). Groundwater vulnerability map explanatory notes—Castlereagh Catchment. NSW Department of Land and Water Conservation.
Qadir, A., Ahmad, Z., et al. (2016). A spatio-temporal three-dimensional conceptualization and simulation of Dera Ismail Khan alluvial aquifer in visual MODFLOW: a case study from Pakistan. Arab. J. Geosci. 9:2069. doi: 10.1007/s12517-015-2069-z
Rahman, A. (2008). A GIS based DRASTIC model for assessing groundwater vulnerability in shallow aquifer in Aligarh, India. Applied Geography 28, 32–53. doi: 10.1016/j.apgeog.2007.07.008
Rajput, H., Goyal, R., and Brighu, U. (2020). Modification and optimization of DRASTIC model for groundwater vulnerability and contamination risk assessment for Bhiwadi region of Rajasthan, India. Environ. Earth Sci. 79:8874. doi: 10.1007/s12665-020-8874-z
Rasool, A., Saeed, S., and Shah, R. (2020). Water crisis and its impact on the socio-economic condition of local people of district Karak, Khyber Pakhtunkhwa, Pakistan. Islamabad J. Soc. Sci. 1, 39–50.
Richts, M. A, Struckmeier, W. F, and Zaepke, H. (2011). “WHYMAP and the groundwater resources map of the world 1: 25,000,000,” in Sustaining Groundwater Resources: A Critical Element in the Global Water Crisis, 159–173.
Saha, F. D., & Alam, F. (2014). Groundwater vulnerability assessment using DRASTIC and pesticide DRASTIC models in intense agriculture area of the Gangetic plains, India. Environ. Monit. Assess., 186, 8741–8763, doi: 10.1007/s10661-014-4041-x
Secunda, S., Collin, M., and Melloul, A. (1998). Groundwater vulnerability assessment using a composite model combining DRASTIC with extensive agricultural land use. Environ. Manag. 54, 39–57.
Sener, E., and Davraz, A. (2013). Assessment of groundwater vulnerability based on a modified DRASTIC model, GIS and an analytic hierarchy process AHP method: the case of Egirdir Lake basin Isparta, Turkey. Hydrogeol. J. 21, 701–714. doi: 10.1007/s10040-012-0947-y
Shabbir, R., and Ahmad, S. S. (2016). Water resource vulnerability assessment in Rawalpindi and Islamabad, Pakistan using analytic hierarchy process (AHP). J. King Saud Univ. Sci. 28, 293–299. doi: 10.1016/j.jksus.2015.09.007
Shahzad, S. M., Jianxin, L., Shahzad, A., Raza, M. S., Ya, S., and Meryem, F. (2018). Groundwater potential zone identification in unconsolidated aquifer using geophysical techniques around tarbela ghazi, district haripur, Pakistan. International Journal of Geological and Environmental Engineering, 12, 475–482.
Spalding, R., and Exner, M. (1993). Occurrence of nitrate in groundwater–a review. J. Environ. Qual. 22, 392–402. doi: 10.2134/jeq1993.00472425002200030002x
Srivastava, S., Omar, P. J., Shekhar, S., and Gupta, S. (2023). Study of acidic air pollutant (SO2 and NO2) tolerance of microalgae with sodium bicarbonate as growth stimulant. AQUA—Water Infrastr. Ecosyst. Soc. 72, 739–749. doi: 10.2166/aqua.2023.013
Tan, M., and Duan, Z. (2017). Assessment of GPM and TRMM precipitation products over Singapore. Remote Sens. 9:720. doi: 10.3390/rs9070720
USEPA (1994). An determination of metals and trace elements in water and wastes by inductively coupled plasma-atomic emission spectrometry. Washington, DC: USEPA.
Wu, W., Yin, S., Liu, H., and Chen, H. (2014). Groundwater vulnerability assessment and feasibility mapping under reclaimed water irrigation by a modified DRASTIC model. Water Resour. Manag. 28, 1219–1234. doi: 10.1007/s11269-014-0536-z
Yin, L., Zhang, E., Wang, X., Wenninger, J., Dong, J., Guo, L., et al. (2013). A GIS-based DRASTIC model for assessing groundwater vulnerability in the Ordos plateau, China. Environ. Earth Sci. 69, 171–185. doi: 10.1007/s12665-012-1945-z
Keywords: groundwater pollution, contamination, groundwater vulnerability assessment, DRASTIC model, geographic information system (GIS)
Citation: Muneer M, Khan MA, Shinwari FU, Ahmed I, Siyar SM, Alshehri F and Shahab M (2025) Assessment of groundwater intrinsic vulnerability using GIS-based DRASTIC method in district Karak, Khyber Pakhtunkhwa, Pakistan. Front. Water. 7:1540703. doi: 10.3389/frwa.2025.1540703
Edited by:
Jahangeer Jahangeer, University of Nebraska-Lincoln, United StatesReviewed by:
Sivakumar Karthikeyan, Alagappa University, IndiaPadam Jee Omar, Babasaheb Bhimrao Ambedkar University, India
Copyright © 2025 Muneer, Khan, Shinwari, Ahmed, Siyar, Alshehri and Shahab. This is an open-access article distributed under the terms of the Creative Commons Attribution License (CC BY). The use, distribution or reproduction in other forums is permitted, provided the original author(s) and the copyright owner(s) are credited and that the original publication in this journal is cited, in accordance with accepted academic practice. No use, distribution or reproduction is permitted which does not comply with these terms.
*Correspondence: Mumtaz Ali Khan, bXVtdGF6a2hhbkBidWkuZWR1LnBr; Muhammad Shahab, c2hhaGFiZ2VvMDdAZ21haWwuY29t
†ORCID: Mumtaz Ali Khan, https://orcid.org/0000-0001-6660-0859