 Ossama M. M. Abdelwahab
 Giovanni Francesco Ricci
 Francesco Gentile
 Anna Maria De Girolamo
94% of researchers rate our articles as excellent or good
Learn more about the work of our research integrity team to safeguard the quality of each article we publish.
Find out more
ORIGINAL RESEARCH article
Front. Water, 13 March 2025
Sec. Water and Climate
Volume 7 - 2025 | https://doi.org/10.3389/frwa.2025.1486644
Introduction: This study analyzes the impact of climate change on streamflow and sediment yield in the Carapelle basin, a Mediterranean watershed located in the Apulia Region of Italy.
Methods: Three climate model projections (CMCC, MPI, EC-EARTH) under the CMIP6 SSP2-4.5 scenario were bias-corrected and evaluated using statistical measures to ensure enhanced fit with observed data. The Soil and Water Assessment Tool (SWAT) model was implemented to simulate hydrology and sediment yield. The model was calibrated and validated using measured streamflow and sediment load data from 2004–2011, demonstrating satisfactory performance for both parameters. Baseline conditions (2000–2020) were compared with future projections (2030–2050).
Results: Climate projections for 2030-2050 indicated temperature increases up to 1.3°C and average annual rainfall decreases up to 38% compared to baseline. These changes resulted in reduced water yield and sediment load across all models. The CMCC model projected the highest reduction in mean annual flow (67%), with smaller reductions from MPI (35%) and EC-EARTH (7%). Correspondingly, sediment load reductions were 52.8% (CMCC), 41.7% (MPI), and 18.1% (EC-EARTH). Despite these overall reductions, spatial analysis revealed that soil erosion remained critical (sediment yield >10 t ha−1) in certain areas, particularly on steep slopes with wheat cultivation.
Discussion: Integrating climate considerations into water management strategies is essential to sustaining Mediterranean river basins under future climate conditions. Adaptation measures such as BMPs and NBSs should be implemented to reduce soil erosion and to mitigate climate change impacts.
Soil erosion presents a formidable environmental challenge to arable lands globally (Maeda et al., 2010; Panagos et al., 2015; Borrelli et al., 2021). While global soil erosion averages around 10.2 t ha−1 yr.−1 (Yang et al., 2003), soil formation lags significantly behind at less than 0.6 t ha−1 yr.−1 (Montgomery, 2007). This disparity drives widespread soil degradation (Borrelli et al., 2020; De Girolamo et al., 2022; Fortesa et al., 2021), threatening soil health, agricultural productivity, and food security (Ricci et al., 2020; Li and Fang, 2016; Challinor et al., 2014).
In the Mediterranean, climate change (CC) is expected to reshape hydrological patterns and exacerbate erosion trends (Serpa et al., 2015; Panagos et al., 2021). Numerous studies have investigated the potential impacts of future climate change on the hydrological cycle (Blöschl et al., 2017; Lespinas et al., 2014; Bertola et al., 2021; Leone et al., 2024). These studies have reported changes in runoff and evapotranspiration (Piras et al., 2016), extended dry seasons (De Girolamo et al., 2017), increased variability between dry and wet season discharge (Villani et al., 2024; Fonseca and Santos, 2019), and an uneven spatiotemporal decrease in total water yield (Brouziyne et al., 2020). Additionally, high-intensity storms are predicted to become more frequent (Fornaroli et al., 2020). These shifts in rainfall regimes could lead to a general decrease in soil erosion (Elaloui et al., 2023; Zema et al., 2022). However, the potential for increased sediment transport during extreme rainfall events remains high (Nadal-Romero et al., 2022). To plan effective adaptation and mitigation strategies, understanding both historical and future soil erosion trends is essential (Xiong and Leng, 2024). General Circulation Models (GCMs) are vital in CC studies, projecting future climate scenarios based on Intergovernmental Panel on Climate Change’s (IPCC) special report on emission scenarios (Leone et al., 2024; IPCC, 2014, 2021; Johnson and Sharma, 2011).
The CMIP6, the sixth phase of the Coupled Model Intercomparison Project, developed models for climate projections to understand past, present and future climate changes. CMIP6 models offer high spatial resolution and enhanced physical and biogeochemical processes, promise more precise climate simulations (Eyring et al., 2019; Lun et al., 2021). However, GCM outputs require downscaling and bias correction for regional climate and hydrological applications (Hoang et al., 2016; Kiem et al., 2008; Mandle et al., 2017). While CC impact studies using CMIP6 GCMs have predominantly focused on streamflow changes and associated risks (Gu et al., 2023; Yin et al., 2021), sediment dynamics, crucial to river systems (Darby et al., 2016; Ma et al., 2019), remain underexplored. Changes in precipitation (PCP) patterns, both in intensity and spatial distribution, can lead to shifts in river morphology and hydro-sedimentary response of the watersheds (Abed-Elmdoust et al., 2016). However, the assessment of these alterations is complex as several factors influence flow and sediment distribution and watershed resilience (Sarker et al., 2019). For instance, the placement of hydrological monitoring stations is increasingly important to capture climate-induced variability (Singhal et al., 2024). The construction and regulation of dams also play a significant role in modulating climate change impacts on river basins, affecting both natural flow regimes and sediment continuity (Gao et al., 2018; Gao et al., 2022; Ma et al., 2024).
Contemporary research employs advanced statistical analyses and hydrologic modelling to assess CC impacts on river discharge (Sun et al., 2022). By integrating climate model outputs with hydrologic models, researchers can predict long-term water resource effects (Groppelli et al., 2011). The Soil and Water Assessment Tool (SWAT) (Arnold et al., 1998), an open-source, semi-distributed model, is instrumental in these studies, effectively evaluating climate impacts on hydrological processes (De Girolamo et al., 2022; Leone et al., 2023). SWAT’s versatility allows detailed simulations of sediment transport, streamflow, and water quality (Abdelwahab et al., 2018; Ricci et al., 2018; Wu et al., 2020), essential for sustainable water management in a changing climate (Tariq et al., 2024). This study aims to elucidate the responses of streamflow and sediment loads to future climate change in the Carapelle River basin (Apulia, Italy), an area where agricultural practices are responsible of a high rate of soil erosion (Ricci et al., 2022; Abdelwahab et al., 2016). The specific objectives are: (i) utilizing the SWAT hydrological model with CMIP6 GCMs to simulate CC-induced hydrological changes in the Carapelle River, and (ii) assessing the impact of these changes on soil erosion rates at basin and sub-basin levels. This study aims to provide crucial insights for researchers and policymakers to understand regional climate dynamics and develop effective adaptive strategies for water resource management.
The Carapelle basin (Figure 1), situated in northern Apulia (SE Italy), encompasses a drainage area of 506 km2 with a main channel extending 52.16 km. The topography is characterized by a mean elevation of 466 m above sea level (a.s.l.), ranging from 120 to 1,089 m a.s.l., with an average basin slope of 8.2% and a main channel slope of 1.8%. Originating in the Campanian Apennine region, the river traverses the Daunia Hills before transitioning to a braided morphology in the alluvial plain (Abdelwahab et al., 2016). The hydrological regime exhibits significant short-term variability, with minimal flows during summer months (June–September) and peak discharges in winter and early spring.
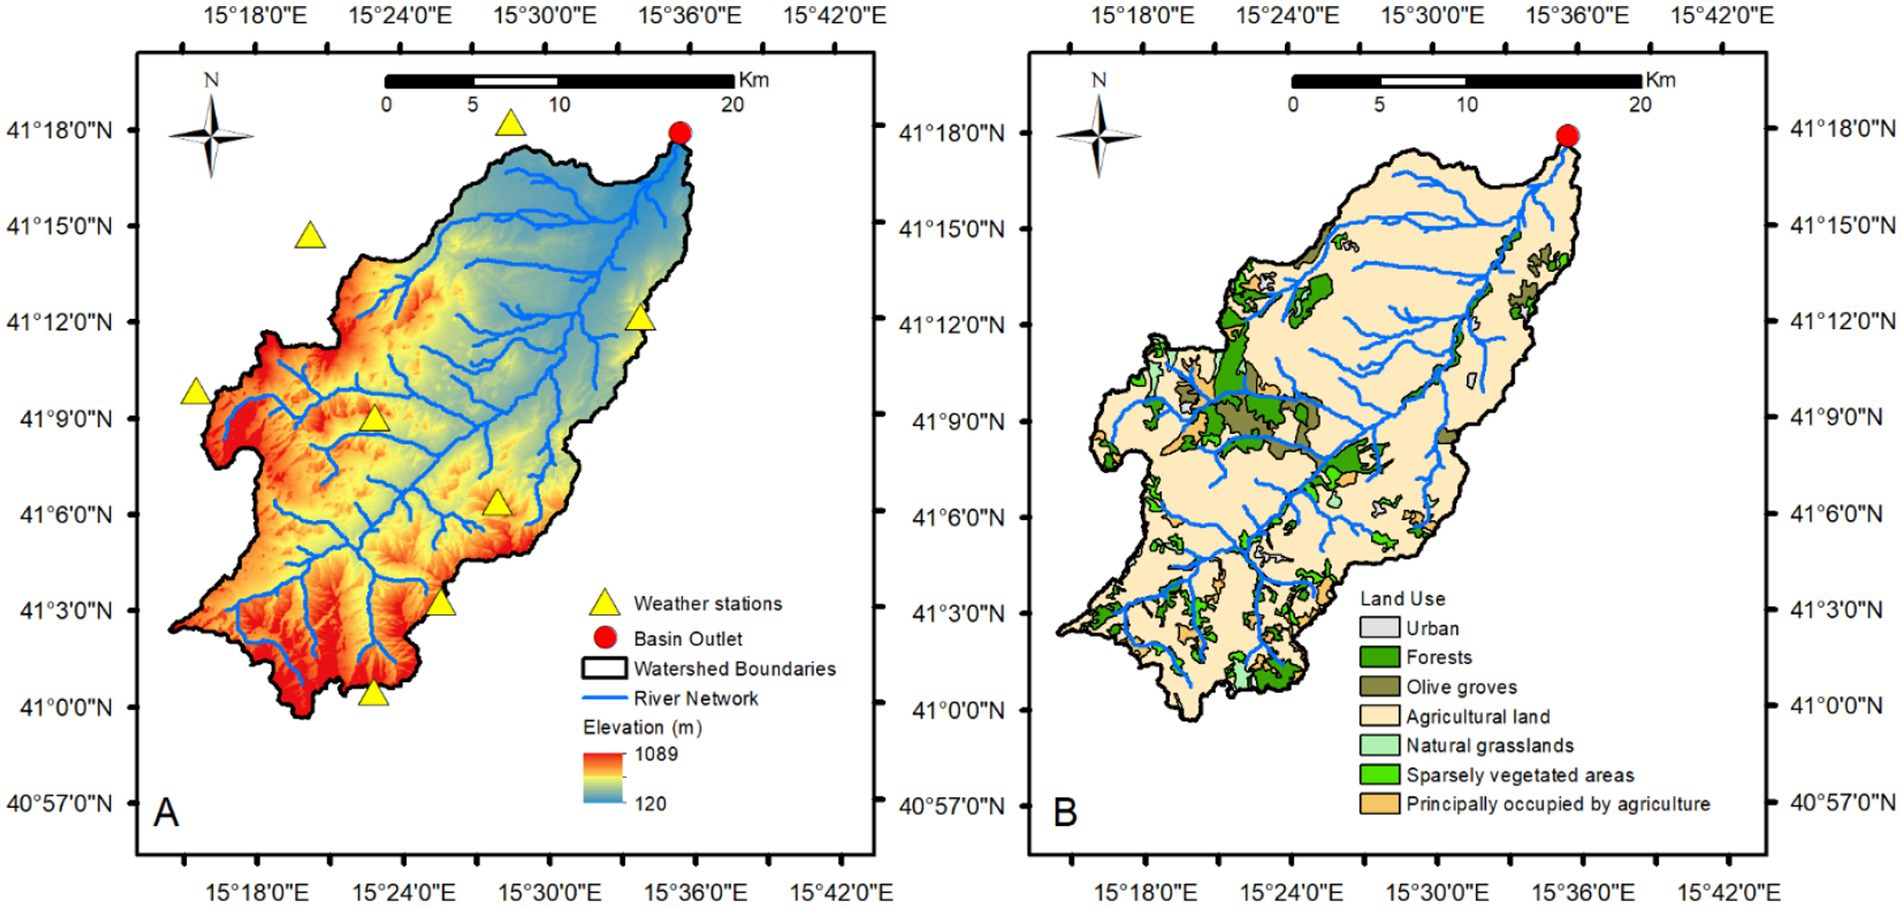
Figure 1. Study area: Carapelle basin (Apulia Region).
The areas of the Carapelle catchment belong to the irrigated area of the Capitanata Reclamation Consortium (literally Consorzio di Bonifica della Capitanata). The territory has a high agricultural vocation (arable land >75%; olive groves about 7%), especially in the areas of Ortanova, Ordona, and Carapelle municipalities, forests (5%) is a minor land use (Figure 1). Therefore, the Carapelle River basin supports significant agricultural water demands and, in the last years has undergone intensive agricultural transformation primarily dependent on groundwater irrigation (Autorità di Bacino, 2015; Consorzio di Bonifica Della Capitanata, 2022). However, unrestricted groundwater extraction over the past two decades has led to declining water tables (Consorzio di Bonifica Della Capitanata, 2022). To address these water management challenges, a major water infrastructure project has been proposed: the Palazzo d’Ascoli reservoir, with a planned capacity of 67 million m3, of which 40 million m3 would be allocated for agricultural irrigation across 30,000 hectares, with the remainder serving industrial needs. The reservoir will have several implications on the river ecosystem and an accurate evaluation of the ecological flow will be required. Currently, there is no explicit information on environmental flow requirements (Consorzio di Bonifica Della Capitanata, 2022).
Dominant erosion processes include sheet wash and concentrated water erosion, while gully erosion is negligible. The area is prone to landslides, particularly in clay-flysch geological units susceptible to rainfall-induced slope movements (Wasowski et al., 2010). Bank erosion is prevalent, especially in upstream reaches. The basin experiences a Mediterranean climate, characterized by wet autumns and winters contrasting with dry springs and summers (Milella et al., 2012). Annual precipitation ranges from 450 to 800 mm, with March and November being the wettest months and August the driest. A monitoring station near Ordona (41°17′50.347”N, 15°36′2.583″E) is equipped with dual gauging systems: an electromechanical and ultrasound stage meter for streamflow measurements, and an infrared optical probe (Hach-Lange Solitax) for suspended sediment concentration (SSC) measurements, both recording at 30-min intervals. Daily sediment loads were calculated for the 2007–2011 study period, with brief interruptions for maintenance. Detailed station specifications are available in Gentile et al. (2010).
The methodology applied in this study is composed of three main stages: hydrological modelling; downscaling and bias correction (BC) of data from CMIP6 climate models; and analysis of the CC impacts on flow regime and sediment (Figure 2). In the first stage the SWAT model was set up for the study area, calibrated and validated. Subsequently, in the second stage, meteorological data (precipitation, minimum and maximum temperatures) were extracted from the three selected climate projections downscaled and, bias-corrected. The calibrated SWAT model was then run using daily observed climatic data from 2000 to 2020, and daily climatic modelled data from 2030 to 2050, which constituted the baseline and the near future (NF) periods, respectively. Finally, in the third stage, the modelled series of streamflow and sediment were analyzed to assess the CC impact on hydrology and sediment.
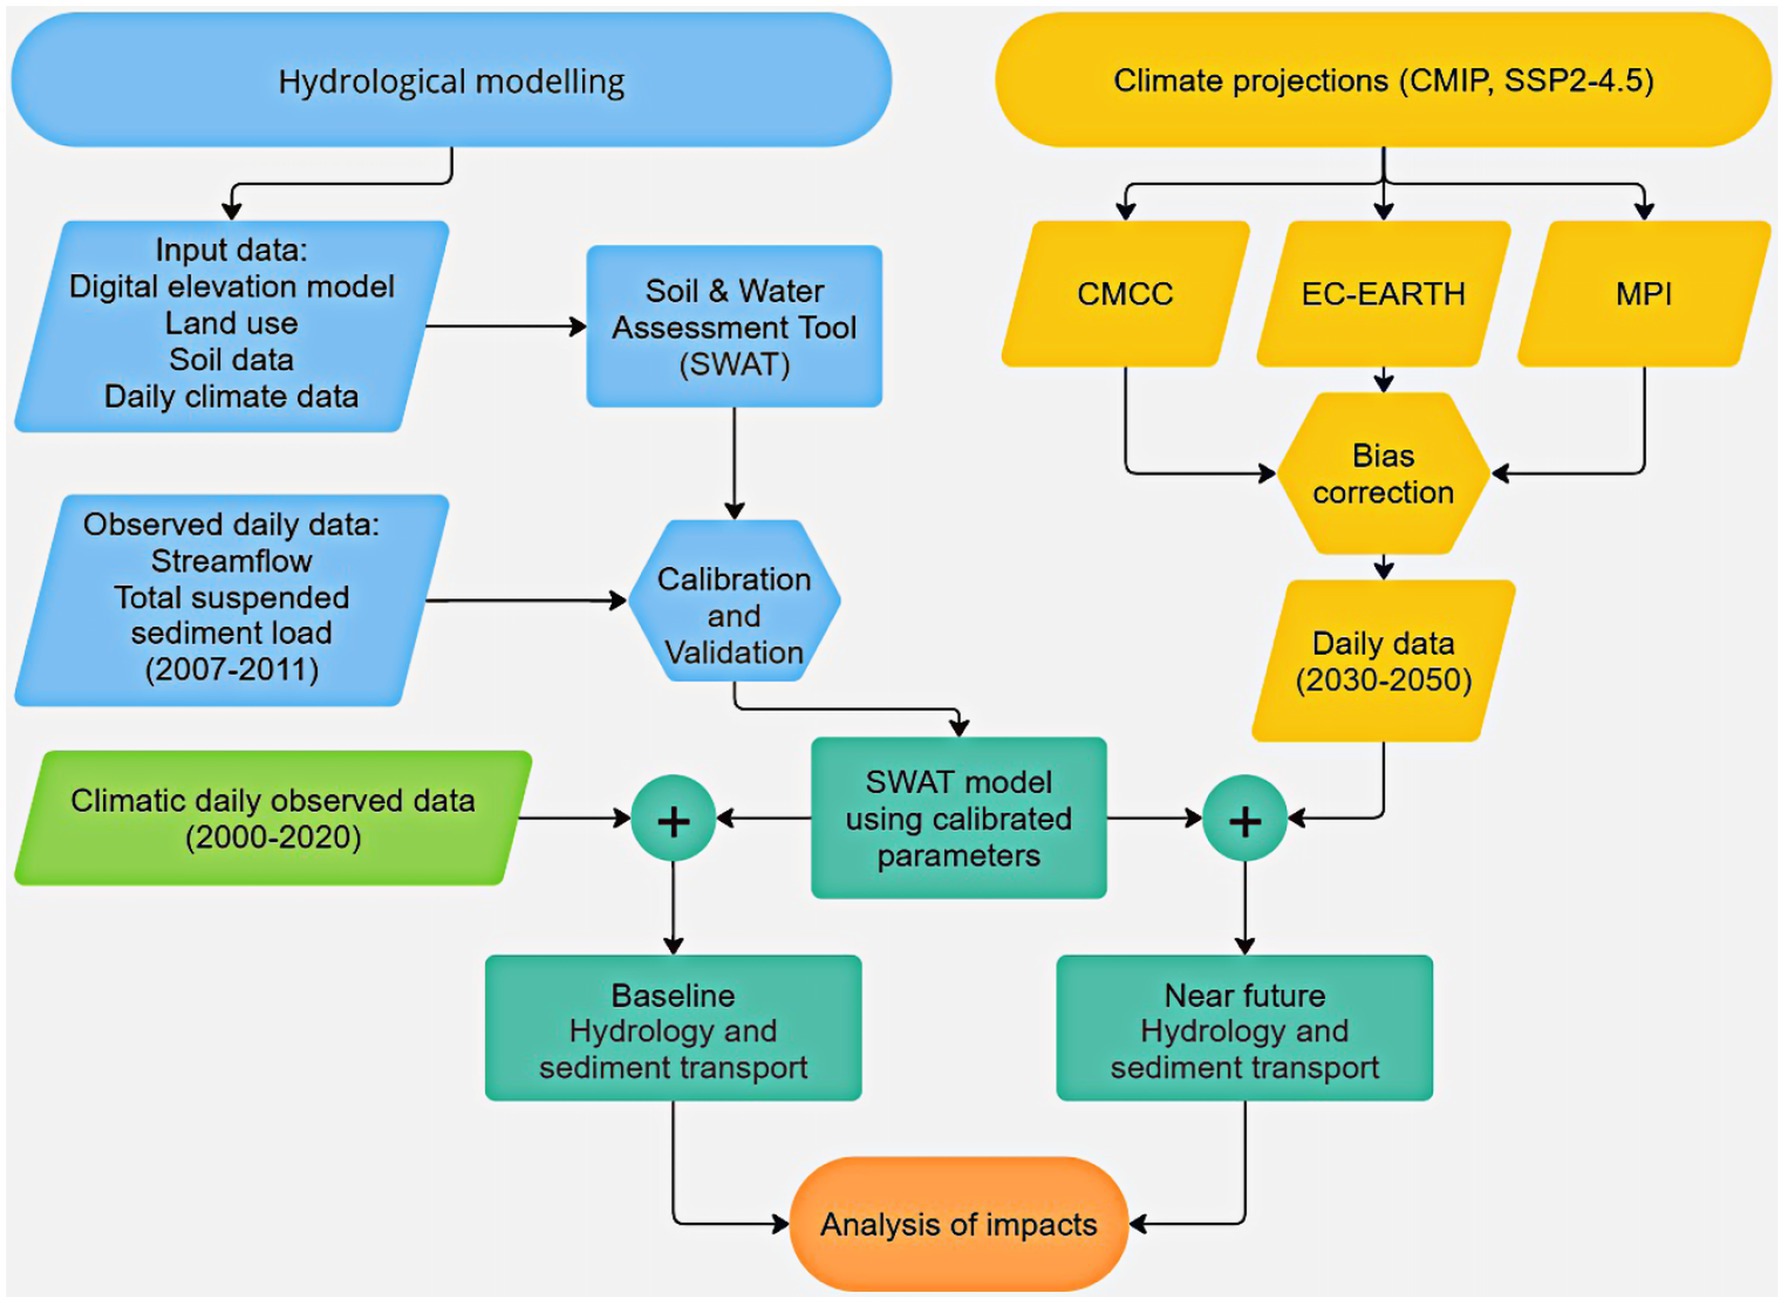
Figure 2. Flowchart of the applied methodology.
The CMIP6 (O’Neill et al., 2016) data archive is distributed through the Earth System Grid Federation (ESGF) though many national centers have either a full or partial copy of the data. A quality-controlled subset of CMIP6 data are made available through the Climate Data Store (CDS) for the users of the Copernicus Climate Change Service (C3S). This subset consists of 51 core variables from 9 of the most popular CMIP6 experiments, which can be used to assess plausible future changes in these variables under various socio-economic pathways. The CDS subset has undergone a rigorous quality control procedure to ensure a high standard of dependability, making it more reliable than the main CMIP6 ESGF archive, which comes with limited quality assurance and may contain metadata errors or omissions. For this reason, CDS1 offers access to over large number of CMIP6 General Circulation Models (GCMs) with various variables. From this extensive collection, three models as detailed in Table 1, were selected. Then, historical and future climate simulations for the period 1985 to 2065, focusing on 3 parameters: minimum temperature (Tas_min), maximum temperature (Tas_max), and precipitation (pr) for the specified basin, were extracted. The analysis carried out considered one prospective scenario: SSP2-4.5, a business-as-usual pathway. In this scenario, the number 2 represents a medium pathway for human development without climate policy, while “4.5” indicates the projected radiative forcing (W/m2) by the year 2,100 (El-Rawy et al., 2023).
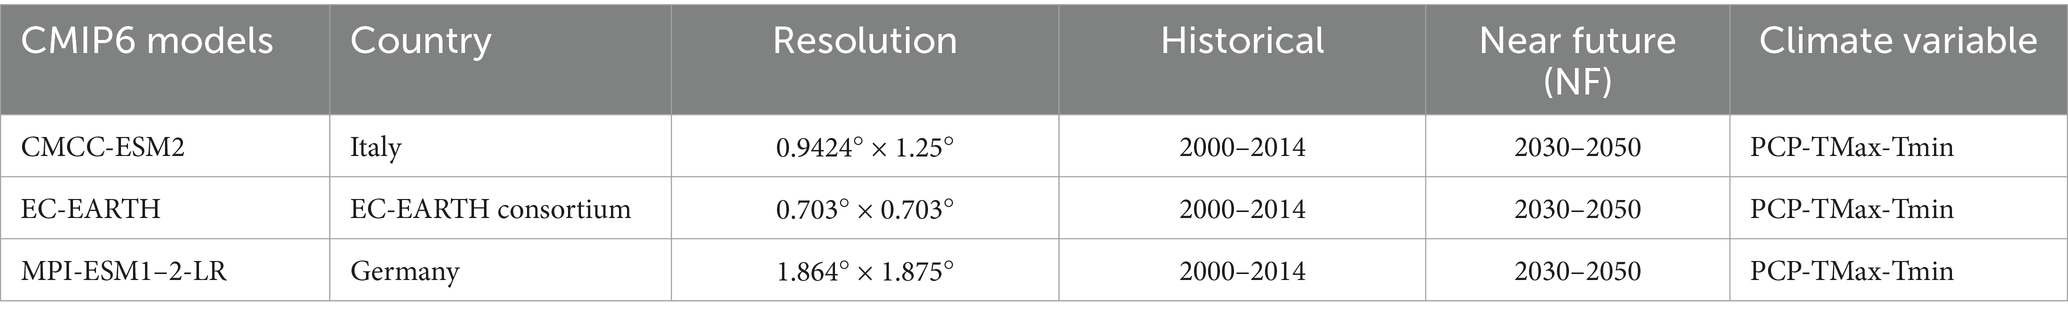
Table 1. Climate model projections: GCMs, resolution, historical and NF period.
Bias Correction (BC) procedures are used to minimize the discrepancies between modelled and measured climatic data, making simulated climate data more accurate for hydrological models. The bias in data can be influenced by various factors such as mean, standard deviation, temporal distribution, frequencies, and extreme occurrences. Several BC methods are available, differing in applicability and limitations, and are widely discussed in climate impact studies (Ehret et al., 2012; Teutschbein and Seibert, 2012; Chen et al., 2013; Rajczak et al., 2016; Rohith and Jayakumar, 2017; Turco et al., 2017; Yin et al., 2020). These methods are classified into two main categories: 1-simple parametric transformations (e.g., linear scaling, power transformation, and linear regression) (Fang et al., 2015; Tschöke et al., 2017; Gudmundsson et al., 2012), which correct bias using various transformation functions; and 2-distribution-derived transformations (quantile scaling QS, Chen et al., 2013, quantile mapping QM, Maraun et al., 2010, and distribution mapping DM, Teutschbein and Seibert, 2012), which correct bias based on probability distributions fitted to observed data and simulations. Distribution-derived methods generally perform better than simple transformations (Chen et al., 2013; Fang et al., 2015). QS and QM use empirical distributions, while DM uses parametric distributions, making it more suitable for extrapolation and outperforming in general (Nanjegowda and Parambath, 2022). CMhyd tool (Rathjens et al., 2016) is used in this work to perform the bias correction. It is a tool for extracting and bias-correcting data from global and regional climate models, written in Python and uses various packages. It provides climate data representative of specific gauge locations in a basin. CMhyd identify biases in historical climate data to adjust future simulations, assuming the correction remains valid under future conditions. However, the effectiveness of these corrections for future conditions remains uncertain. Due to its higher performance as previously mentioned, the DM technique was adopted in this work for BC process.
DM (Teutschbein and Seibert, 2012) aligns climate values simulated by Regional Climate Models (RCMs) with observed values through a transfer function that adjusts key climate variables’ distributions. Known as ‘probability mapping’, ‘quantile-quantile mapping’, or ‘statistical downscaling’, this method is widely recognized in climate science (Sennikovs and Bethers, 2009; Block et al., 2009; Ines and Hansen, 2006; Johnson and Sharma, 2011; Boé et al., 2007; Sun et al., 2011). For modelling precipitation distributions, the Gamma distribution, characterized by shape (α) and scale (β) parameters, is effective. The shape parameter (α) influences the distribution’s profile, and the scale parameter (β) affects the spread, impacting the probability of extreme events. Temperature data is typically modeled using the Gaussian distribution, defined by location (μ) and scale (σ) parameters, to capture symmetric and continuous data patterns. A detailed description of the method can be found in Teutschbein and Seibert (2012).
In this study, the SWAT model, a semi-distributed continuous hydrological model developed by the United States Department of Agriculture (USDA) (Arnold et al., 1998; Arnold et al., 2012), was used to assess streamflow and sediment transport. The revised (Abbaspour et al., 2015) version of SWAT 2012 (Winchell et al., 2013) was implemented and run at daily time-step from 2004 to 2011. The first 3 years (2004–2006) were used as warm-up period. SWAT divide the basin first in sub-basins and then into hydrological response units (HRUs), which are the minimum territorial unit of the model, characterized by unique combination of soil characteristics, land use and slope. The study area was divided into 115 sub-basins, using a threshold of 200 ha and, into 451 HRUs, using percentage thresholds of 25% for slope, 25% for land use and, 5% for soil characteristics. The maintaining of the proportions between the main soil types, slope classes, and land uses was verified (Ricci et al., 2020; Ricci et al., 2022). For each HRU, the SWAT model simulates the surface runoff using the modified Soil Conservation Service-Curve Number method (SCS-CN) (USDA-SCS, 1972) and the sediment yield using the Modified Universal Soil Loss Equation (MUSLE) (Williams, 1975). The Manning’s equation and a simplified version of Bagnold’s stream power relationship were used to computes the rate and the velocity of flow and, sediment degradation or deposition, respectively (Bagnold, 1977; Neitsch et al., 2011). The Hargreaves method (Hargreaves, 1975), which requires temperature and solar radiation as input, was used to estimate potential evapotranspiration. SWAT requires several measurements and input data for its implementation, calibration and validation, which can limit its applicability (Abdelwahab et al., 2018). The input data used in this study to configure the model is detailed in Table 2. Farming operations data were retrieved for winter wheat and olive groves and the management files (.mgt) was modified accordingly. Winter wheat was planted in November and harvested in July. Ploughing (25–40 cm depth), which in the study area is generally perpendicular to contour lines even in mountain areas (>15%) was performed in August. Harrowing was carried out in October. Two fertilizing operation were conducted in December (fertilizer grade: 25–15-00; amount 180–220 kg ha−1) and February (urea; amount 100–140 kg ha-1). A 4-year crop rotation (wheat, wheat, wheat, clover) was considered. For olive groves, three shallow tillage operations (ploughing and harrowing) were performed every 2 months starting in April and two fertilizer applications were adopted, in December (manure) and in spring (fertilizer grade: 26–00-00; amount 90–110 kg ha−1). The crop was yield in November (Abdelwahab et al., 2016; Ricci et al., 2022).
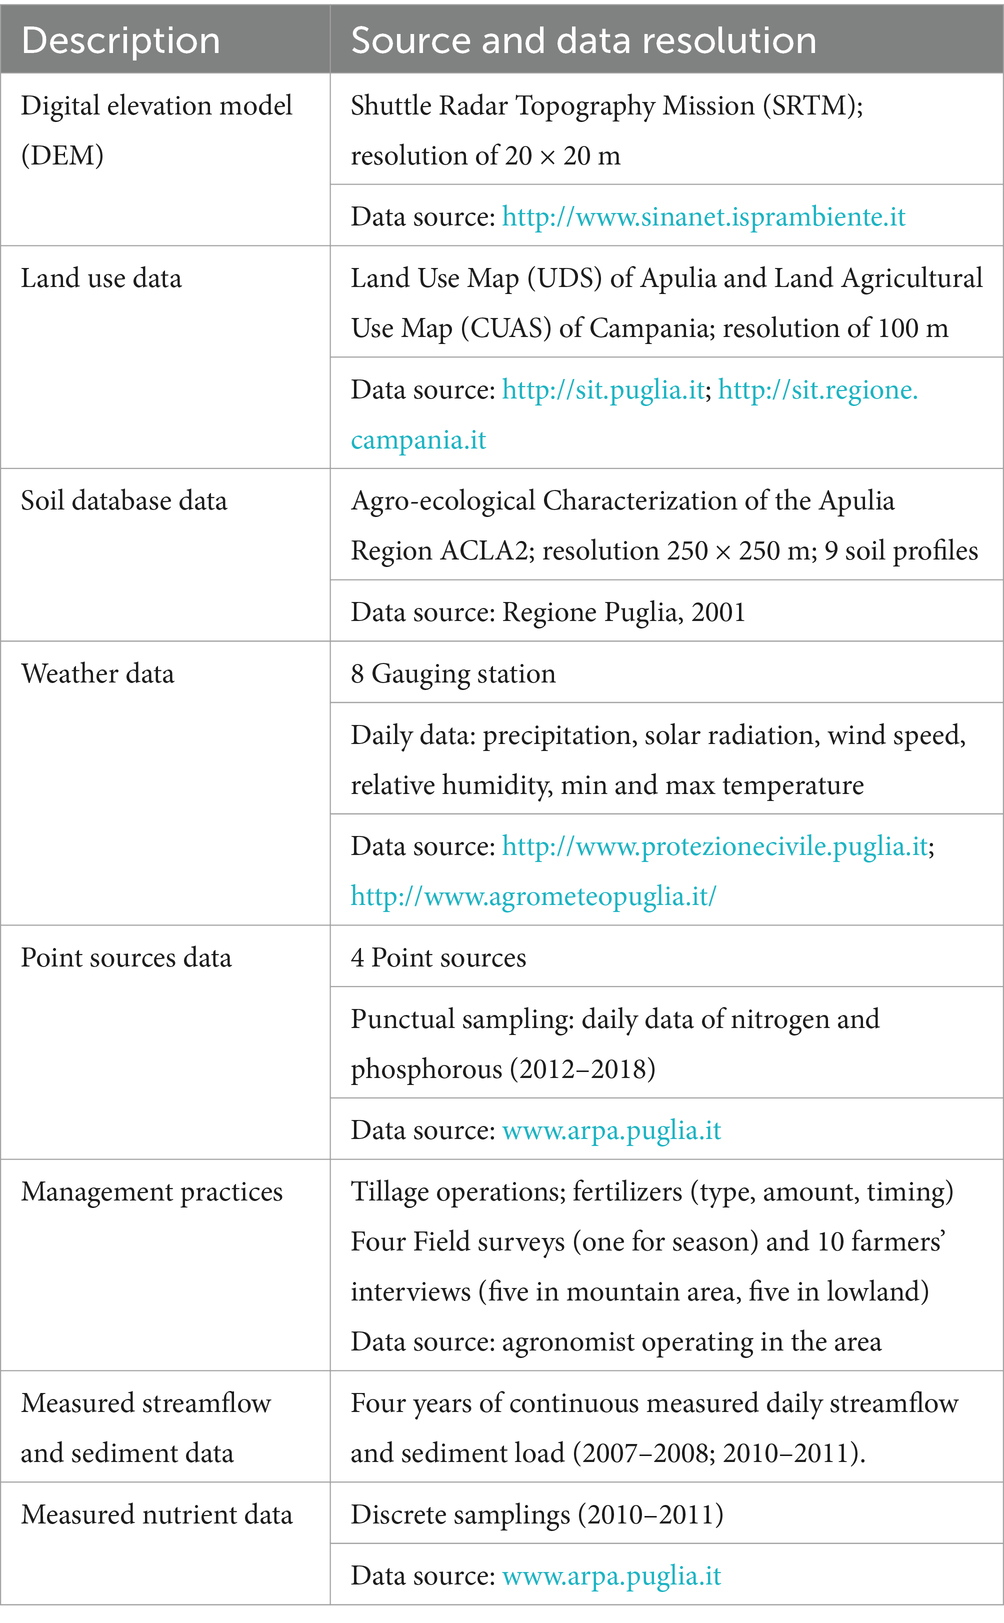
Table 2. List of SWAT input data, source, and resolution.
Following Arnold et al. (2012, 2015), the SWAT model was first calibrated for streamflow and then for sediment load. Two sub-datasets were prepared for observed daily streamflow and sediment load (2007 to 2011). The first subset (January 2007 to April 2009) was used for the calibration, and the second (from January 2010 to December 2011) was used for the validation. Data from May to December 2009 were not available due to a malfunctioning of the station (Ricci et al., 2020). The Sequential Uncertainty Fitting version 2 (SUFI2) method, available in the SWAT-CUP tool (Abbaspour et al., 2015), was utilized to determine the sensitive parameters for both the calibrated variable. A further description of the sensitivity analysis, calibration, and validation are available in Ricci et al. (2018). Subsequently, SWAT-CUP was used manually adjust the model parameters and refine the match between simulated and observed data (Jeong et al., 2010; Ricci et al., 2020) and to identify the optimal set of parameters through an automated process, targeting a Nash-Sutcliffe Efficiency (NSE) greater than 0.5 as the objective function. Table 3 lists the calibrated parameters for both streamflow and sediment load. The USLE P-factor, which represents conservative management practices, was set to 1.0 because no conservation practices were implemented in the basin. To evaluate the model’s performances at daily scale, coefficient of determination (R2) and NSE > 0.5 and Percent Bias (PBIAS) ≤ 25% for runoff, and ≤ 55% for sediment were considered (Moriasi et al., 2007; Molina-Navarro et al., 2017).
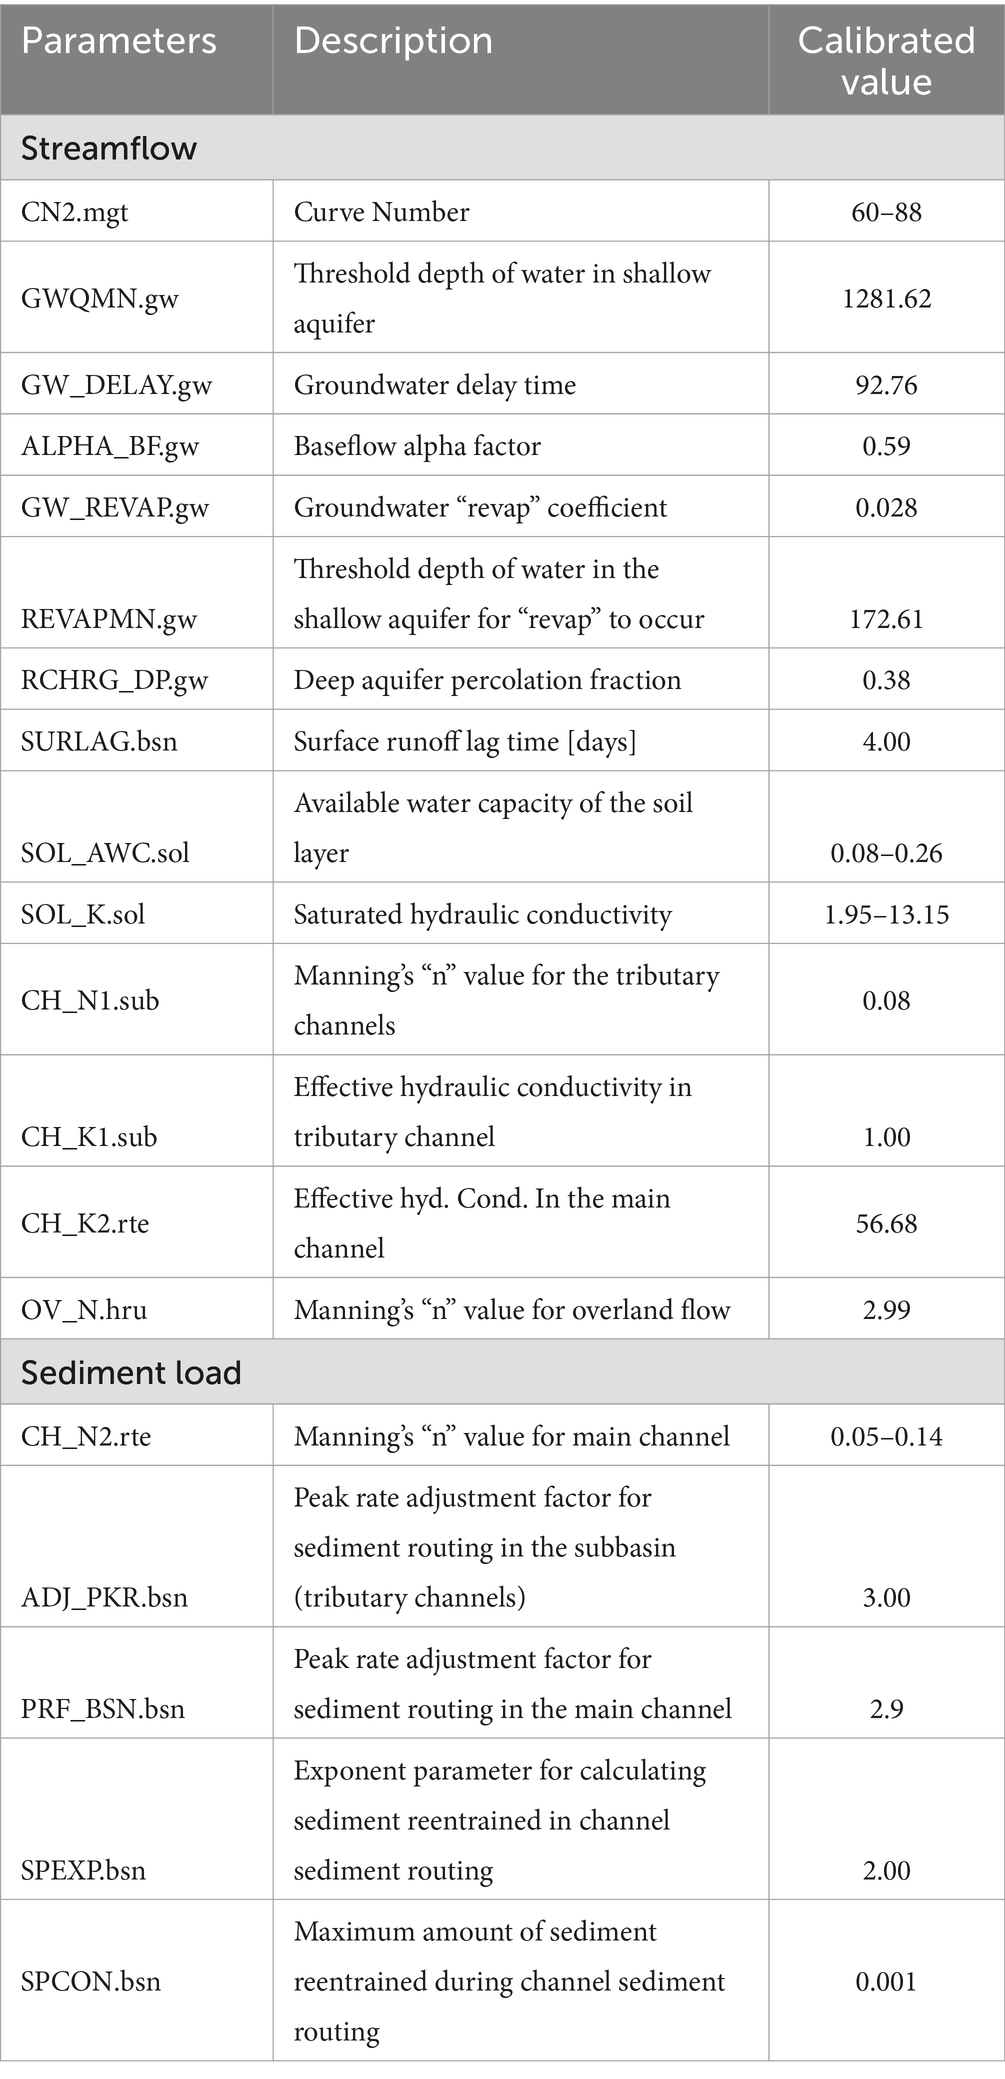
Table 3. SWAT model parameters used for the calibration and their final values.
There were substantial differences in the ability of GCMs to reproduce temperature and precipitation data under current climate conditions. To evaluate the efficacy of BC procedure, a range of statistical parameters were employed, for both daily Min and Max temperature and daily precipitation time series, including monthly means (μ), and 90th percentiles. It is important to note that this assessment was limited to the historical period (2000–2014), as direct validation of BC methods for future conditions is inherently unfeasible. For precipitation specifically, the analysis incorporated additional metrics: the probability of wet days (Prwet), and the average precipitation intensity on wet days (iwet). These characteristics of bias- corrected Climate Model simulated variables were compared to observational data on a month-by-month basis throughout the year. The un-corrected CMCC model simulations (Figure 3) showed an underestimation of the mean monthly PCP values through most of the months while it overestimated it during February and from August to October. The CMCC model had constant tendency to predict more wet days while it often simulated many low-intensity rain events. MPI and EC-EARTH models showed similar results, with higher mean monthly values shown by EC-EARTH, compared to MPI model. In general, the EC-EARTH showed higher mean monthly precipitation values in the 1st half of the year compared the 2 other models while in the 2nd half the CMCC showed the highest values. The precipitation-BC was able to improve the raw GCM simulations to some extent. With all models, there was a very slight a bias present in the mean of daily precipitation as in the case of MPI in the summer months (under-estimation) and EC-EARTH (slight overestimate during summer months) (Figure 3).
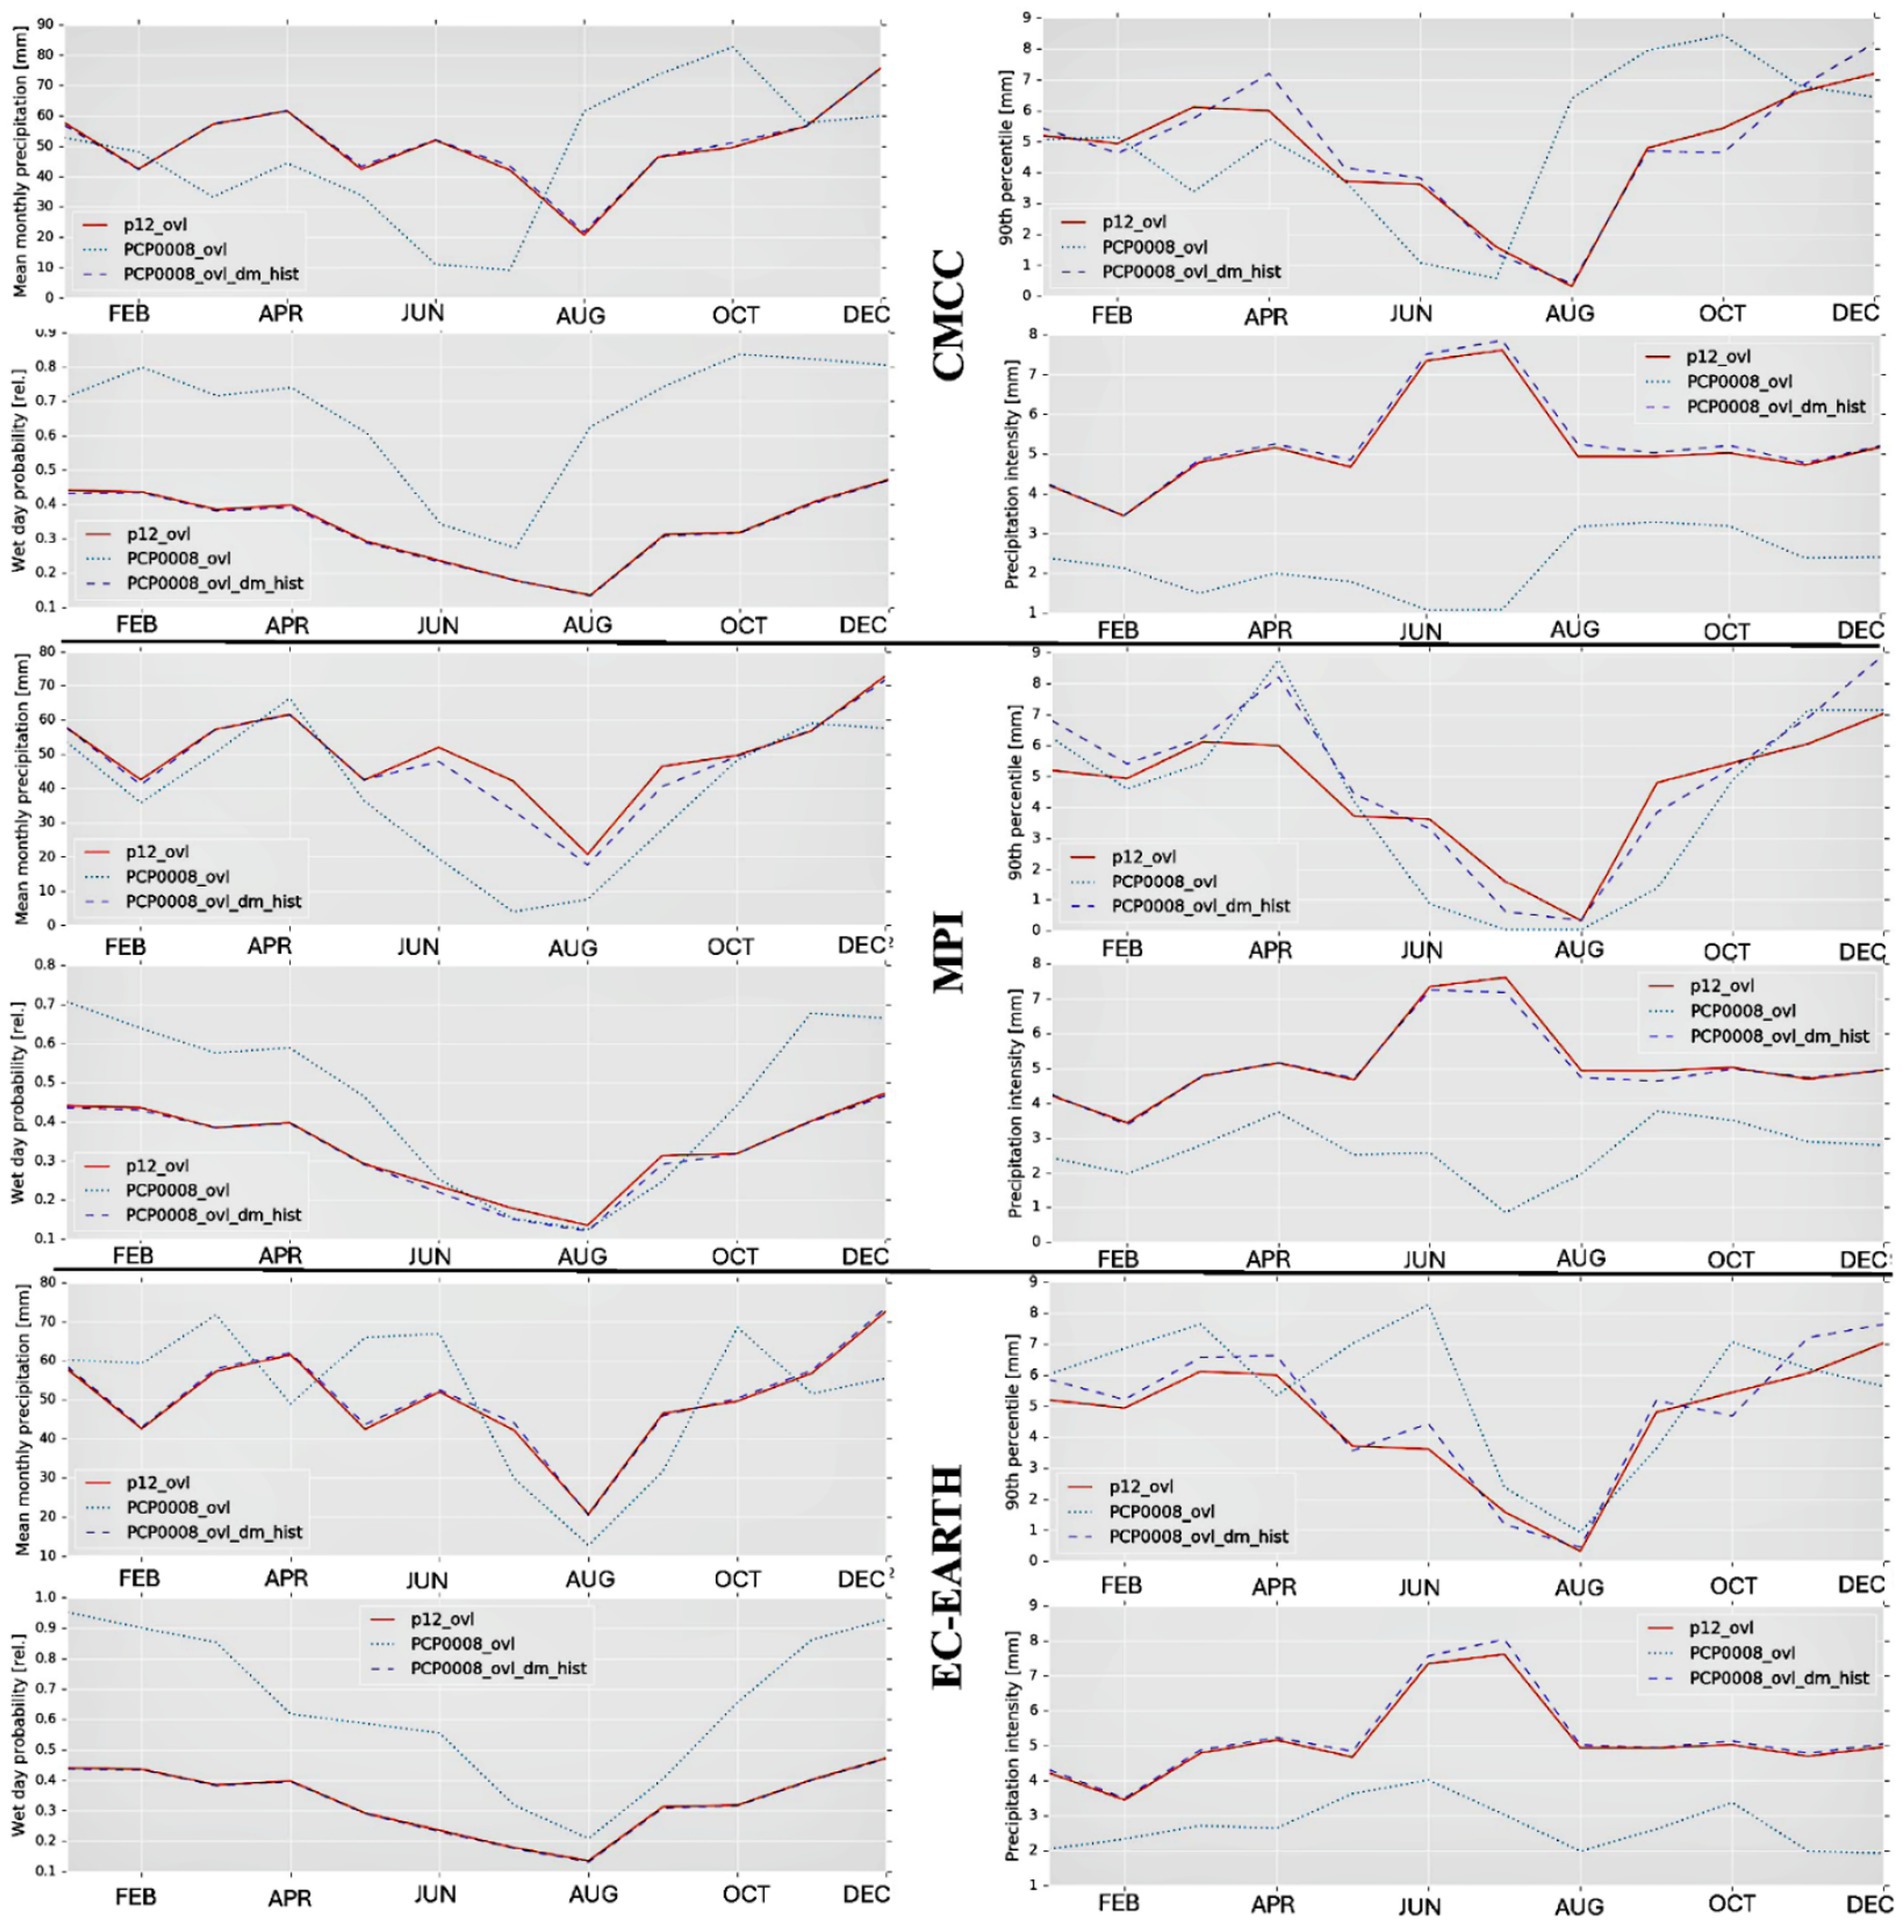
Figure 3. GCMs precipitation series before (PCP0008) and after (PCP008_ovl_dm_hist) bias correction in relation to the observed series (p12_ovl) measured by different statistical indices.
There were slight differences in the daily precipitation series’ probability of wet days and the precipitation intensity between the 3 models. However, the major dissimilarities were identified in the 90th percentiles which showed larger variability ranges and still had biases of a similar magnitude to the uncorrected precipitation. Regarding the temperature there were substantial differences in the ability of the 3 GCMs un-corrected simulation to reproduce temperature under current climate conditions. While the EC-EARTH and MPI models showed a tendency to overestimate the mean monthly maximum temperature (Tmax) and minimum temperature (Tmin) all over the year (except December), the CMCC model overestimated both minimum and maximum temperatures in the 1st half of the year from January to July while it showed an underestimation of the mean monthly temperature from August to November (Figure 3). In general, the highest values of Tmax were provided by CMCC model during the summer months (January-August). After the BC (Figure 4) the GCMs showed a very close match in the mean monthly temperatures with all biases perfectly corrected, while the 90th percentile showed a very slight variation between the 3 models and the observed data. Overall, the DM BC method was able to correct raw values of both temperature and precipitation for the 3 GCM models adopted in this study.
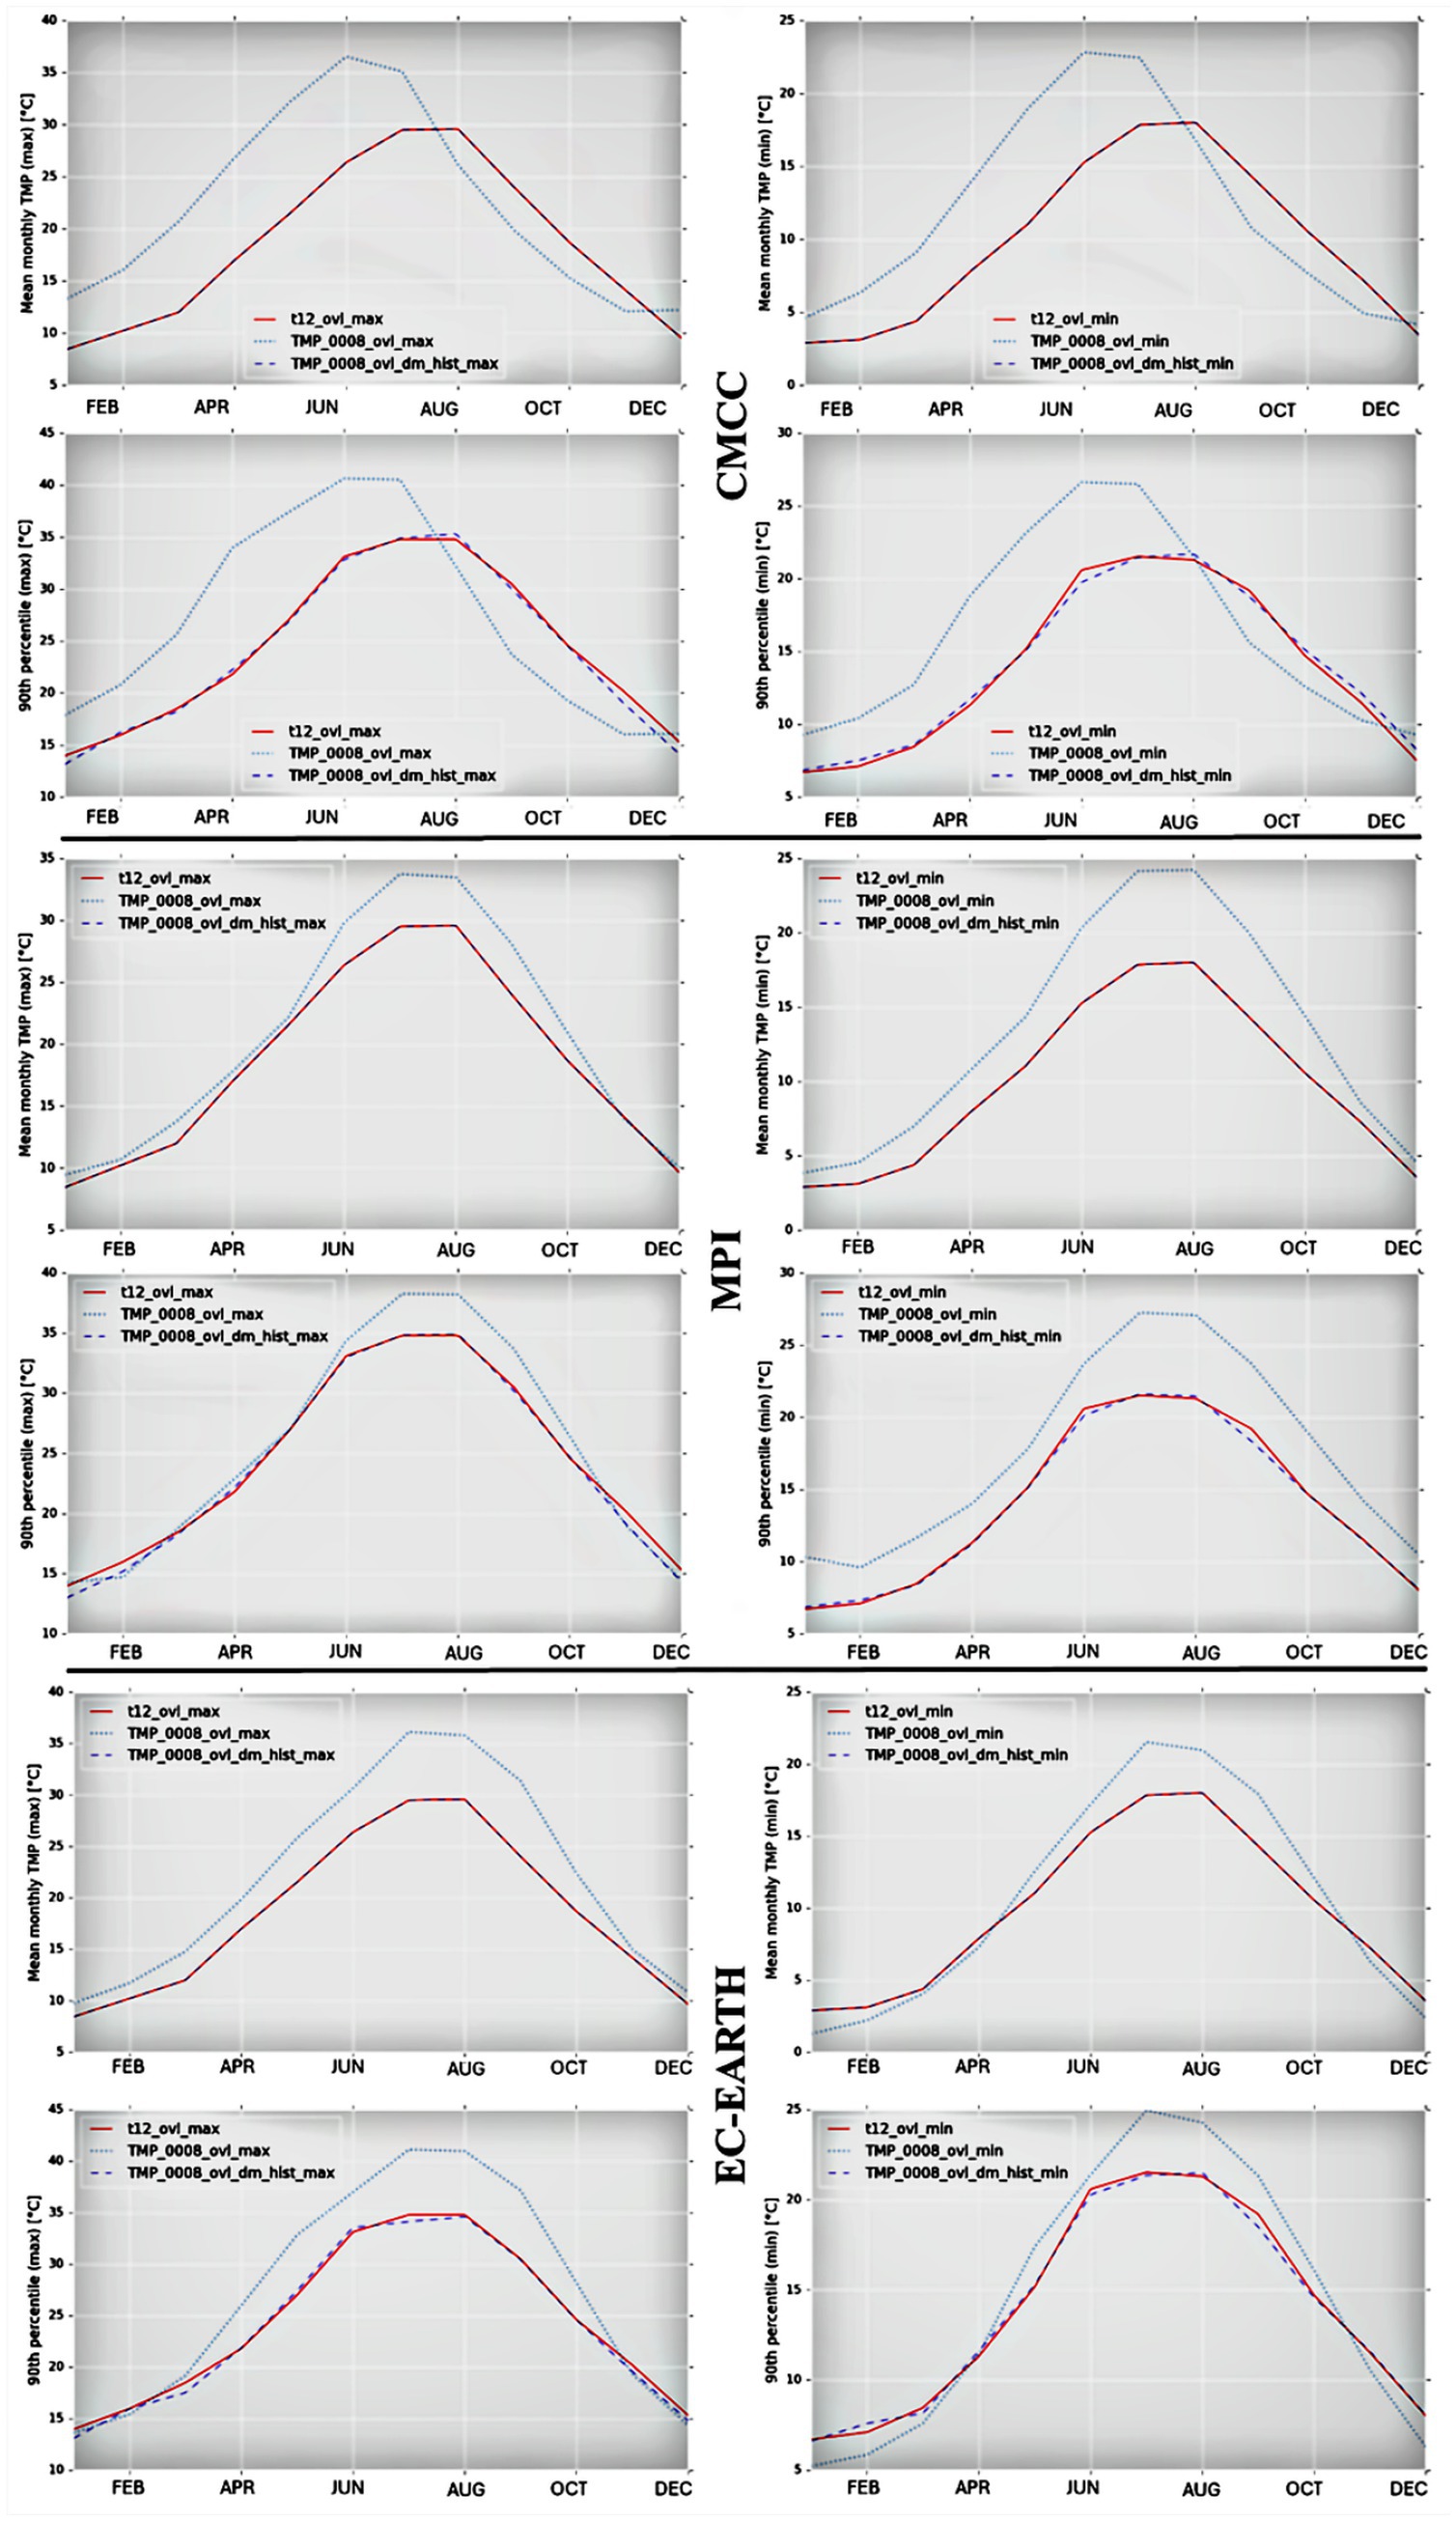
Figure 4. GCMs monthly Tmax and Tmin series before (PCP0008) and after (PCP008_ovl_dm_hist) bias correction in relation to the observed series (t12_ovl_max, t12_ovl_min) measured by different statistical indices.
The analyzed CMIP6 GCMs project a consistent increase in mean monthly Tmax and Tmin for all months, with the strongest warming occurring in winter and the weakest in summer. The average annual rise of Tmax and Tmin projected for the NF period was 1.5°C and 1.3°C, respectively, compared to the baseline scenario, indicating a pronounced warming projected by CMCC model especially during Autumn and winter months. The trendline Analysis Mann-Kendall test at a significance level 5%, showed a significant positive trend for both Tmax (p < 0.0001 Kendall’s Tau = 0.622) and Tmin (p < 0.0001 Kendall’s Tau = 0.669) projected by the CMCC model on annual scale. The MPI model projected a consistent increase in mean monthly Tmax and Tmin for all months. Generally, the average annual Tmax projected for the NF were 1.3°C and 1.1°C by MPI and EC-EARTH respectively, while for Tmin both Models showed a rise by almost 1°C for the forementioned period. The Mann-Kendall trendline Analysis test showed a significant positive trend for both Tmax (p < 0.0001 Kendall’s Tau = 0.435) and Tmin (p < 0.0001 Kendall’s Tau = 0.525) projected by the MPI model on annual scale. However, The EC-EARTH showed a very weak significant positive trend line only for the Tmin (p = 0.000 Kendall’s Tau = 0.346) on annual scale while for Tmax there was not a significant trend. Changes in mean monthly precipitation show consistent reduction in the future.
Under CMCC model projections, the mean monthly precipitation decreases by 9%(August) to 41.2% (April) with an average reduction of 24% for all months except July that was the only month with a precipitation increase by 34.1%. The minimum mean monthly value was projected in June (11 mm), while July (76.2 mm) unexpectedly showed the highest projected value for the period 2030–2050 even higher than the winter months. The accumulated annual precipitation varied significantly during the NF with the highest value expected (741.8 mm) in 2050 and the lowest (183.4 mm) in 2043, with an overall average for the entire NF period of 371.8 mm, which is 38% less than the baseline.
The MPI model showed a decline in monthly precipitation from 4% (October) to 23.8% (April) in all months except February and May, which witnessed an increase by 6.9 and 6.3%, respectively. The minimum mean monthly value was projected in August (5.7 mm), while December (57 mm) showed the highest projected value for the period 2030–2050. Generally, the MPI projection showed higher values of precipitation than baseline during winter and Autumn (average of 48 mm). The accumulated annual precipitation varied significantly in NF with the highest value expected (1,008 mm) in 2048 and the lowest (183.4 mm) in 2039, with an overall average for the entire NF period of 466.2 mm which is 23% less than the baseline.
The EC-EARTH model showed a general decline by 5% in October to 16.7% in March. The minimum mean monthly value was projected in August (11.4 mm), while November (75 mm) showed the highest projected. The accumulated annual precipitation varied significantly during the NF period with the highest value expected (799 mm) in 2048 and the lowest (248.8 mm) in 2038, with an overall average for the entire NF period of 539 mm which is 10% less than the base scenario average Annual value. Among the analyzed projections, EC-EARTH showed the highest precipitation values either as average monthly or accumulated annual for the NF period predictions. Though a trend analysis Mann-Kendall test, it was found that neither CMCC nor EC-EARTH models showed any significant trend for precipitation on annual basis. While the MPI model showed a significant negative trend on annual scale.
The SWAT model exhibited satisfactory performance for the two simulated variables, streamflow and sediment load at the outlet, in both the calibration and validation periods (Figures 5, 6). The streamflow was underestimated in the calibration period (PBIAS +5.3%) while overestimated in the validation period (PBIAS -17.2%). Despite the overall performance, SWAT tended to overestimate slightly the normal flow and the low-flow (Figure 5) whereas several peaks were underestimated, particularly during the calibration period (Figure 6). In the dry year (2011), SWAT generally overestimated low-flow, while peak flows were relatively well simulated (Figure 6). For instance, the modeled highest peak flow, which was recorded in the wettest month of the simulation period (November 2010), was 6% lower than observed (simulated 79 m3s−1; observed 94 m3s−1). The average yearly rainfall was 662 mm, ranging from 542 mm (2007) to 888 mm (2010). The average yearly actual evapotranspiration was 470 mm (71% of the rainfall). This value is comparable to those reported by Romanazzi et al. (2015). The average yearly surface runoff and total water yield (Surface runoff + baseflow + lateral flow) were 86 mm (17% of the rainfall) and 180 mm (27% of the rainfall), respectively.
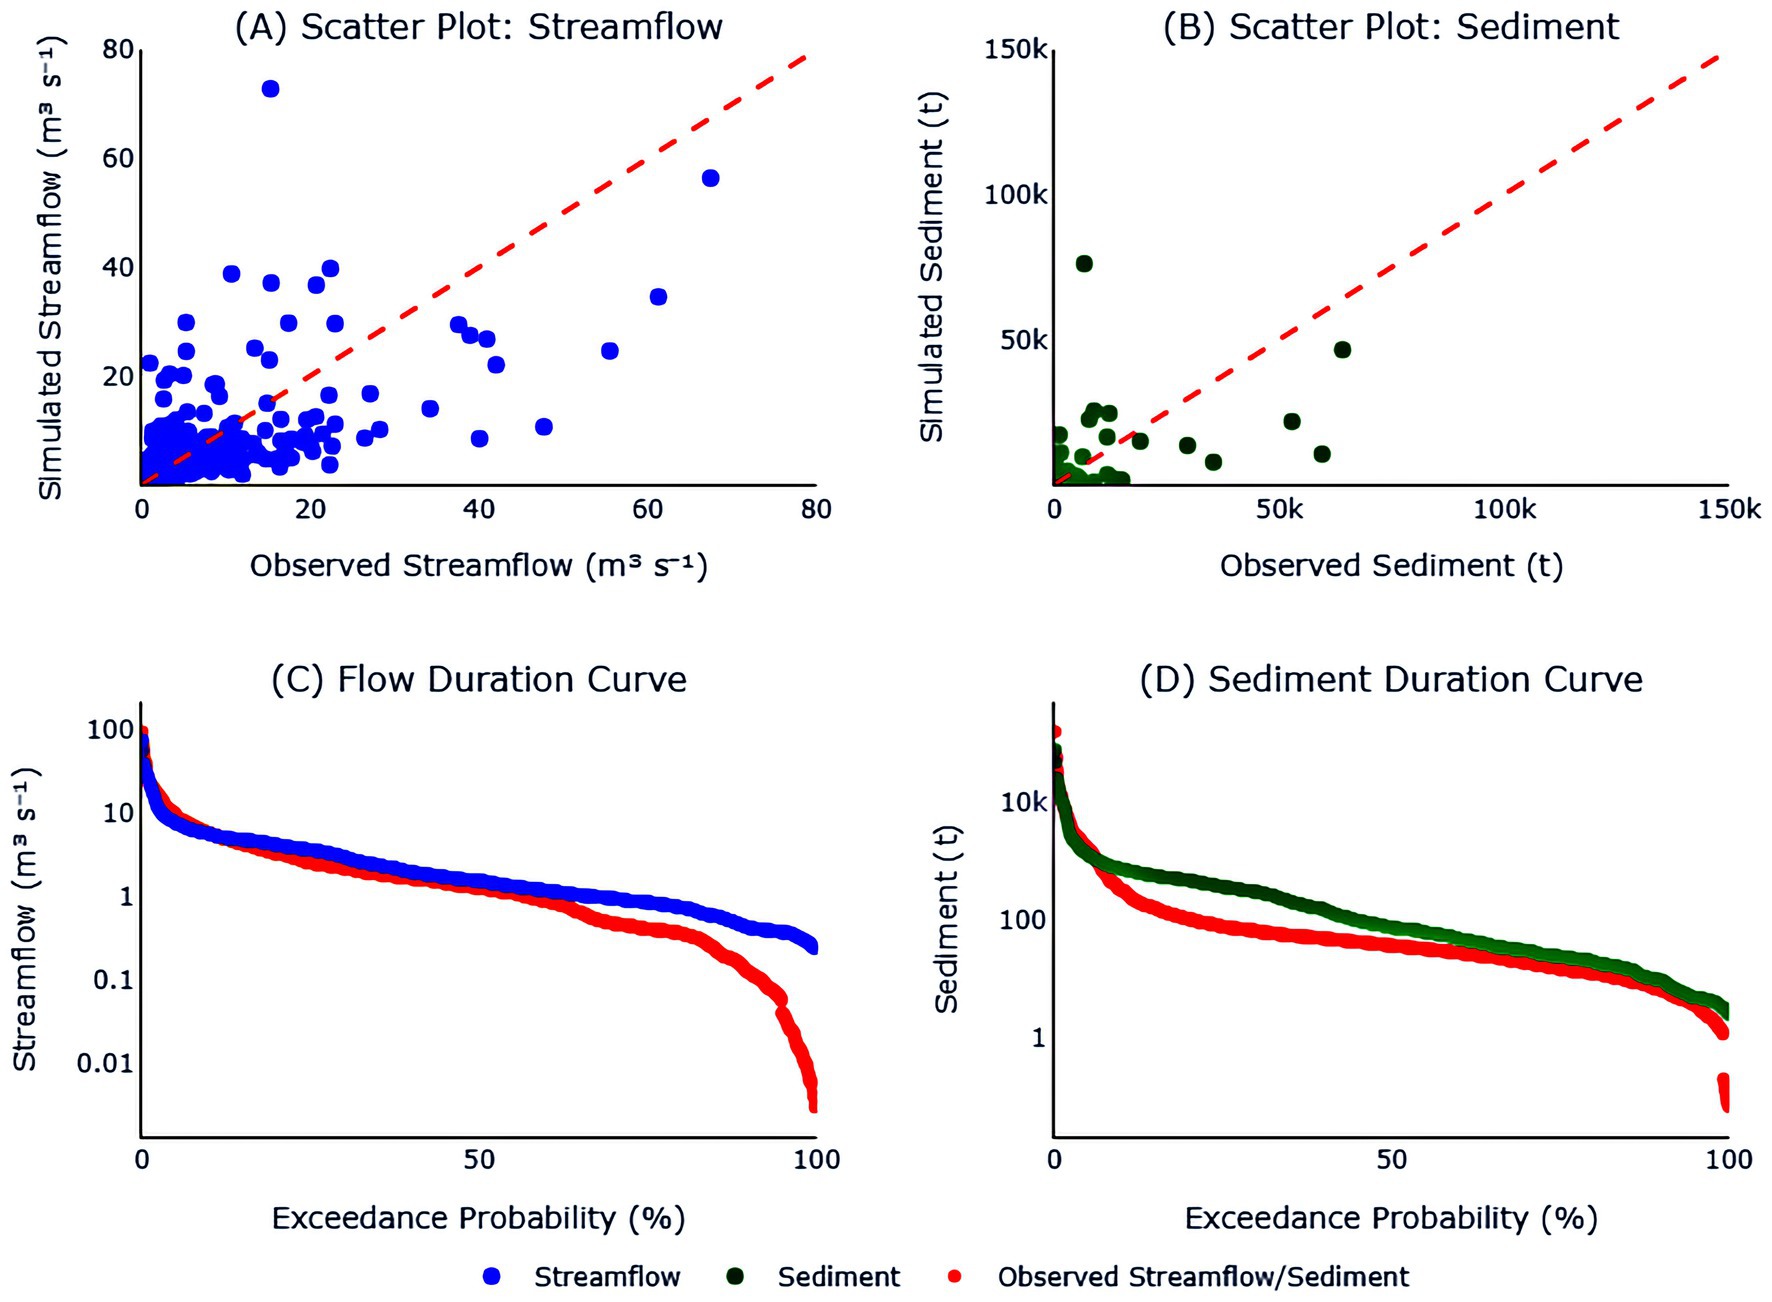
Figure 5. Scatter plots for observed and simulate streamflow (A) and observed and simulated sediment (B). Flow duration curve (C) and sediment duration curve (D).
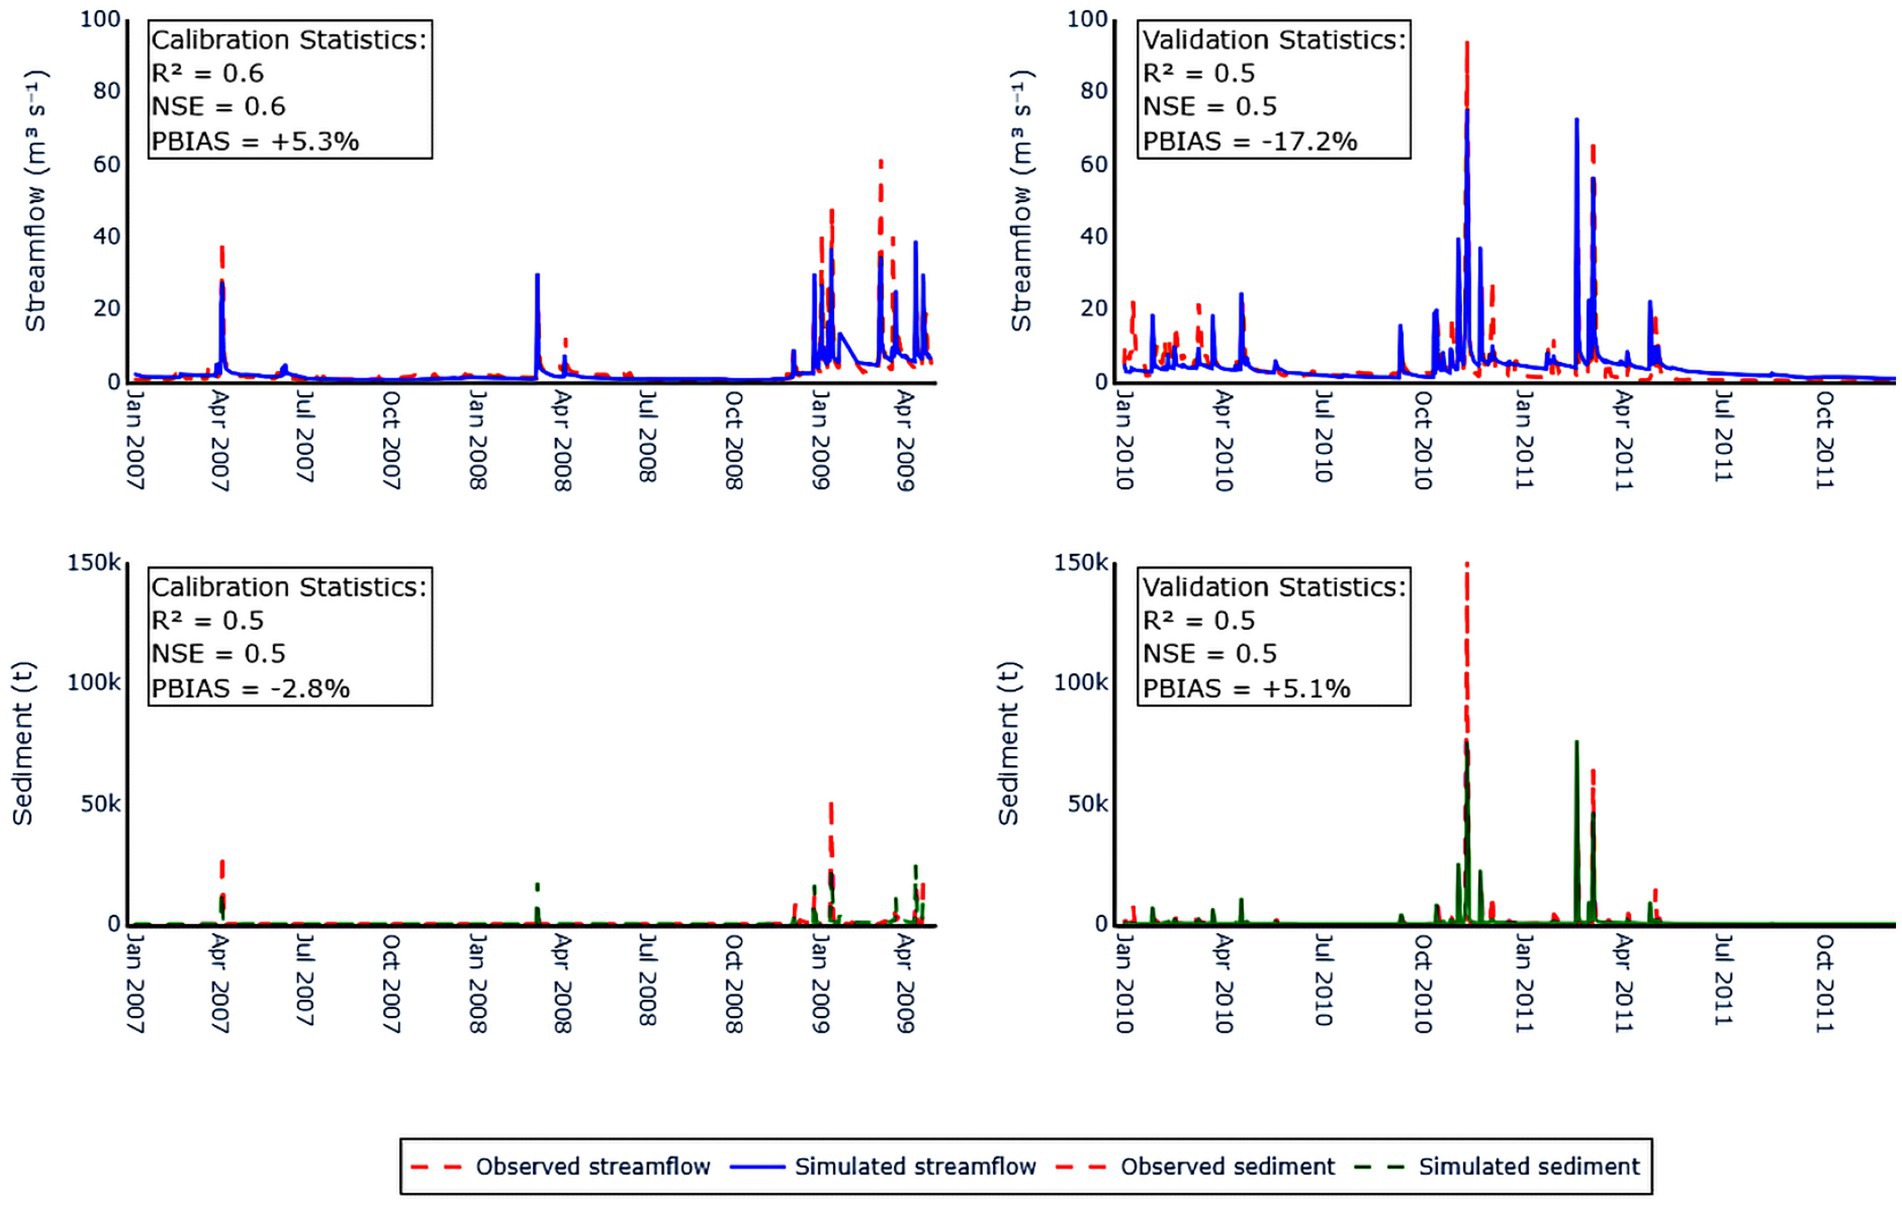
Figure 6. Daily observed and simulated streamflow and sediment load for the calibration (top-left) and validation period (top-right) and statistical indices: the coefficient of determination (R2), the Nash and Sutcliffe Efficiency (NSE), and the Percent Bias (PBIAS %).
The sediment load was overestimated in the calibration period (PBIAS -2.8%) and underestimated in the validation period (PBIAS +5.1%). The simulated sediment loads generally matched the observed data, except some peaks that were underestimated (Figure 6). The highest sediment peak, which was recorded in November 2010, was underestimated by the model (49.5%; simulated 1.52 t ha−1; observed 3.07 t ha−1). Soil erosion in the area mainly occurs in winter (December to April) due to frequent rainfall events. The average annual specific sediment load was 5.95 t ha−1 yr.−1, ranging from 1.46 t ha−1 yr.−1 (2007) to 8.71 t ha−1 yr.−1 (2010).
The streamflow simulated by the SWAT model by using daily observed climatic data (2000–2020, baseline) and model projections (CMCC, EC-EARTH, and MPI, respectively) (2030–2050, NF) were compared. The climatic models adopted in this study predicted a reduction in the average yearly rainfall compared to the baseline. Specifically, at the basin scale, rainfall was 678.5 mm for the baseline, 386.5 mm for CMCC (−43%), 602.0 mm for EC-EARTH (−11.3%) and 529.0 mm for MPI (−22%). A reduction of the actual evapotranspiration (477.8 mm yr.−1, baseline) was predicted in the future (305.2 mm yr.−1 for CMCC, 420.3 mm yr.−1 for EC-EARTH and 396.2 mm yr.−1 for MPI). Similarly, a reduction of the total water yield (Surface runoff + baseflow + lateral flow) was simulated (from 168.44 mm yr.−1, in the baseline, to 54.77 mm yr.−1, 156.23 mm yr.−1 and 109.33 mmyr−1 for CMCC, EC-EARTH and MPI, respectively).
To analyze the variability of the flow regime components under climate change, some Indicators of Hydrological Alterations (IHAs) were assessed (Richter et al., 1996; Leone et al., 2024). The mean flow at the outlet, which was equal to 0.89 m3s−1 for CMCC, 2.48 m3s−1 for EC-EARTH and 1.74 m3s−1 for MPI, compared with the baseline (2.66 m3s−1) showed an important contraction. Similarly, a contraction of the magnitude of monthly flow for the wet season (from December to April) was predicted for the three climate model projections (Figure 7). CMCC model predicted the largest reduction of flow that was quantified for the wet months at 81%. The highest reduction (86.3%) was simulated in February (median flow was 2.67 m3s−1 for the baseline and 0.365 m3s-1 for CMCC). The average reduction of monthly flow was 21.5% for EC-EARTH and 47.0% for MPI. The highest reduction (51.2% EC-EARTH and 57.4% MPI) was predicted in March when the median value was 2.89 m3s−1for the baseline and 1.41 m3s−1 and 1.23 m3s−1 for EC-EARTH and MPI, respectively. Similar behavior can be evidenced for the 10th and the 25th percentile. Considering the 90th percentile, both EC-EARTH and MPI showed higher values than the baseline. Specifically, EC-EARTH overtake the baseline in January (baseline =3.91 m3s-1, EC-EARTH = 4.02 m3s−1), February (baseline = 4.33 m3s−1, EC-EARTH = 4.47 m3s−1) and December (baseline = 4.16 m3s-1, EC-EARTH = 5.44 m3s−1), while MPI showed high values in April (baseline = 4.60 m3s−1, MPI = 4.76 m3s−1). These increases in monthly streamflow can be attributed to flood events.
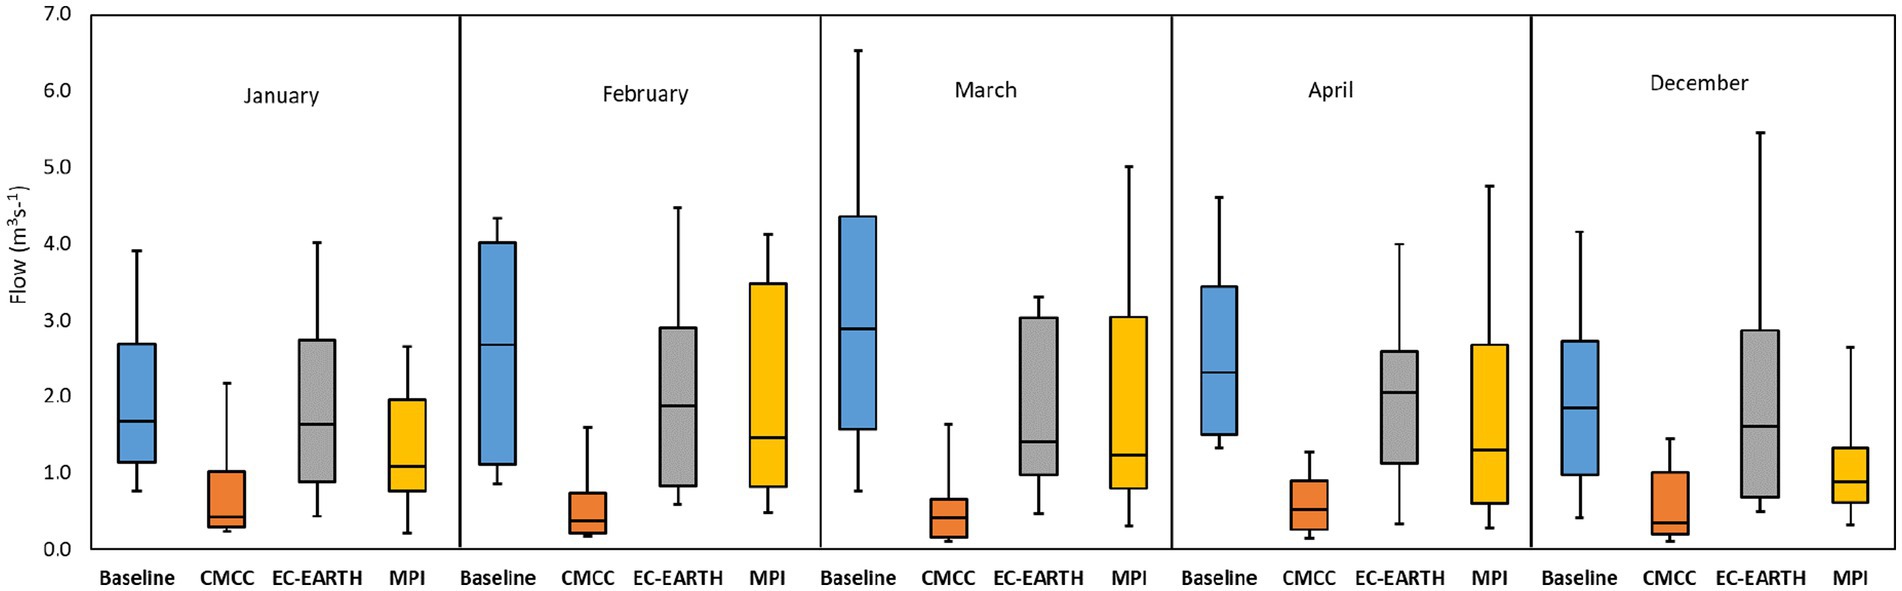
Figure 7. Box and whiskers: Monthly mean flow for the wet season. The lower and the upper whiskers represent the 10th and the 90th, respectively. The minor quartile is the 25th percentile and the major is the 75th percentile. The black line in the center is the median.
Changes in the annual extreme streamflow of 1-, 30-, and 90-day duration were analyzed (Figures 8A,B). CMCC and MPI showed similar values of these indicators, with a general reduction compared to the baseline. The depletion of the median value of the daily streamflow was 43.7 and 38.8% for CMCC and MPI, respectively. Reductions in the 90-day maximum flow were predicted, especially by CMCC and MPI (4.46 m3s−1 for the baseline, 1.85 m3s−1 for CMCC, and 2.5 m3s−1 for MPI; Figure 8B). CMCC showed values lower than MPI and EC-EARTH (10th, 25th, and 75th percentile in Figure 8). Reduction in 1-day maximum flow is predicted by the CMCC model (i.e., 10th and 25th percentiles were 33.7 m3s−1 and 39.8 m3s−1 for the baseline, and 0.64 m3s−1 and 7.57 m3s−1 for future, respectively) (Figure 8A). Contrarily, EC-EARTH showed the median values of the three IHAs higher than the baseline and a larger interannual variability (i.e., larger interquartile range) (Figures 8A,B). An increment of 35.7% was predicted for the median value of 1-day maximum flow (median value and the 75th percentile were 50.3 m3s−1 and 75.3 m3s−1 for the baseline, and 68.3 m3s−1 and 104.9 m3s−1 for EC-EARTH, respectively) (Figure 8B). EC-EARTH showed a higher occurrence of high values of 30- and 90- days maximum flow, with respect to the baseline (Figures 8A,B). These results could be due to the increase of occurrence of large floods predicted by EC-EARTH.
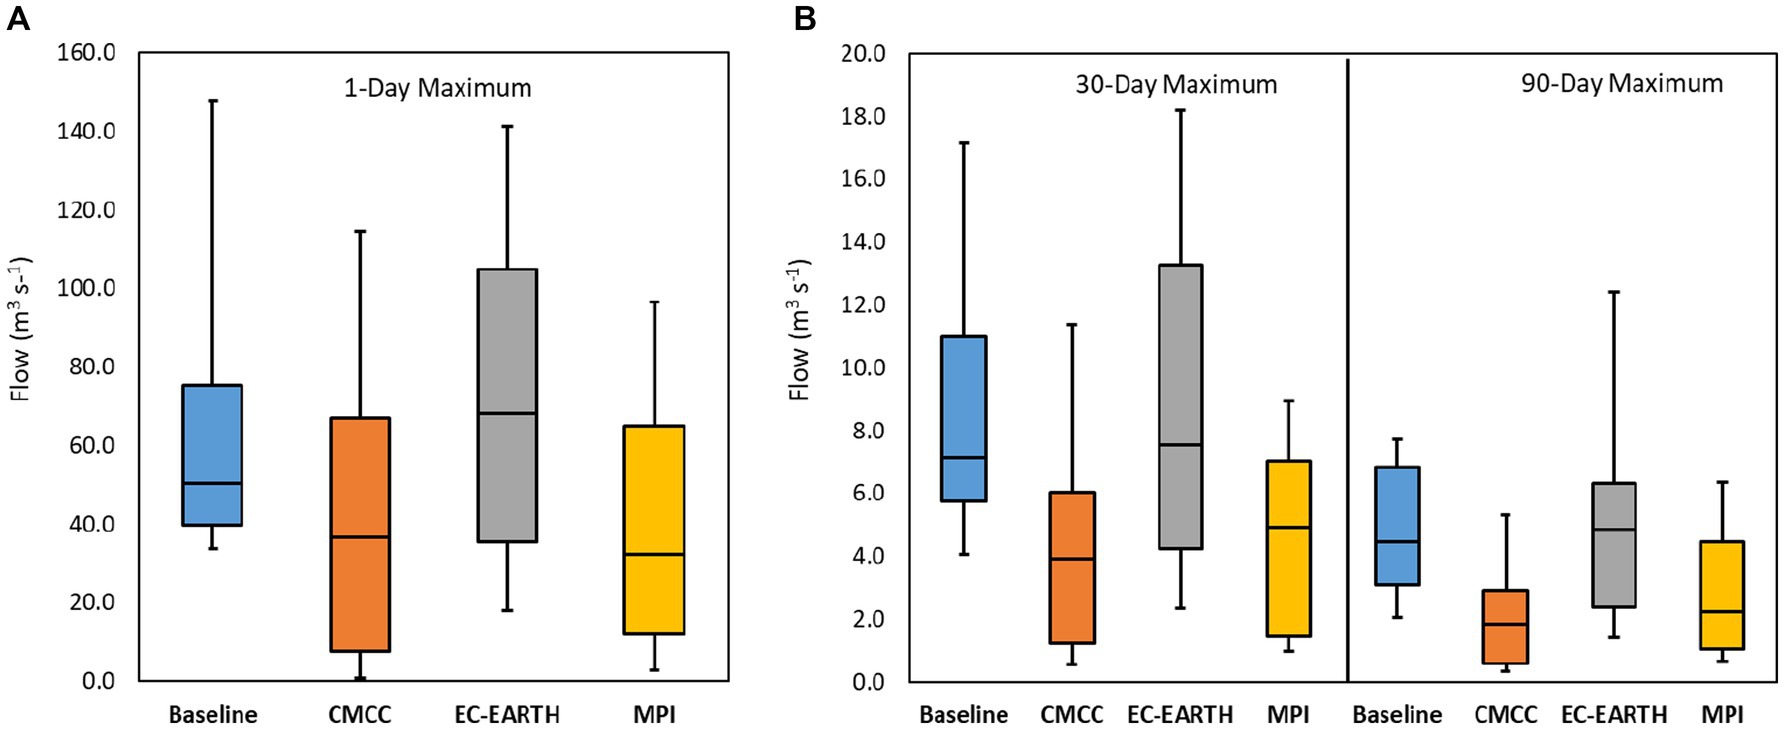
Figure 8. Box and whiskers (A) 1-day maximum flow, (B) 30-, 90-days maximum flow. The lower and the upper whiskers represent the 10th and the 90th percentile, respectively. The minor quartile is the 25th percentile and the major is the 75th percentile. The black line in the center is the median.
Changes in the specific sediment load (t ha−1) at the basin scale and in the sediment yield (t ha−1) at the sub-basins scale were assessed by comparing the daily sediment simulated data by the SWAT model for the baseline and for the future by using the three climate model projections (CMCC, EC-EARTH, MPI). A reduction of the specific sediment load (Table 4) associated with the reduction of the streamflow was predicted. At the annual scale, the specific sediment load simulated for the baseline was 6.84 t ha−1 yr.−1, whereas CMCC predicted a reduction of 52.8% (3.23 t ha−1 yr.−1), EC-EARTH of 18.1% (5.60 t ha−1 yr.−1) and MPI of 41.7% (3.99 t ha−1 yr.−1). At the monthly scale, the specific sediment load for the baseline was generally higher than the future projection. However, in July, CMCC (0.35 t ha−1 yr.−1) and MPI (0.24 t ha−1 yr.−1) showed simulated values higher than baseline (0.07 t ha−1 yr.−1), EC-EARTH showed sediment yield higher than baseline in April (baseline = 0.19 t ha−1 yr.−1 and EC-EARTH = 0.30 t ha−1 yr.−1), in May (baseline = 0.08 t ha−1 yr.−1 and EC-EARTH = 0.29 t ha−1 yr.−1), in June (baseline = 0.10 t ha−1 yr.−1 and EC-EARTH = 0.12 t ha−1 yr.−1), November and December.
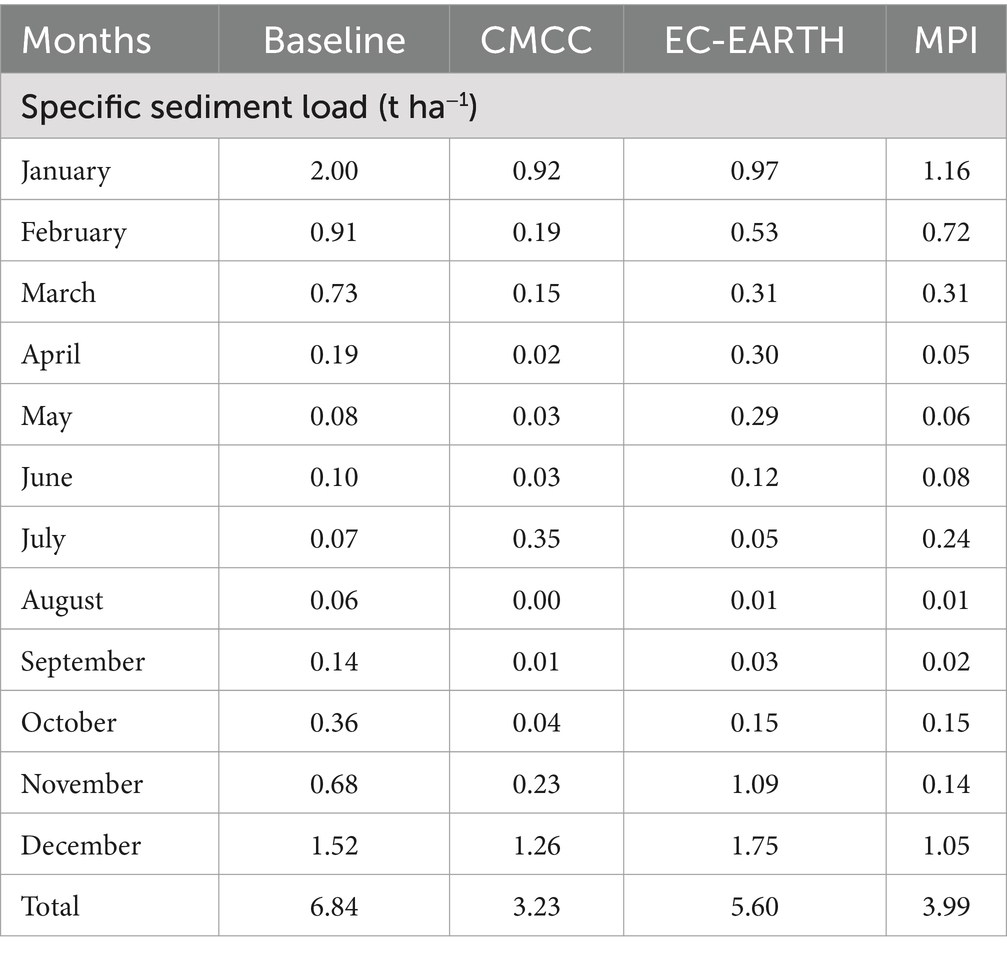
Table 4. Monthly annual average specific simulated sediment load at the basin outlet for the baseline (2000–2020) and for the NF (2030–2050) climate changes scenarios (CMCC; EC-EARTH and MPI).
A visual comparison was carried out to analyze the spatial distribution of soil erosion risk areas at the sub-basin scale between the baseline (2000–2020) and NF (2030–2050) (Figure 9). To better draw the maps, the annual sediment yield values were divided into six classes, considering the ranges obtained for the baseline (0.01 to 38.6 t ha−1). In the baseline 33 of the total 115 sub-basins, whose HRUs are characterized by the presence of wheat cultivation and slopes >15% (Figure 1), were under high erosion rate conditions (average > 10 t ha−1) (Figure 9). Specifically, sub-basins N. 59 and N. 60, whose dominant HRUs are wheat and the slope is close to 20%, showed the highest sediment yield values, respectively 30.6 t ha−1 and 38.64 t ha−1. Flat areas instead had an average rate of sediment yield <3 t ha−1.
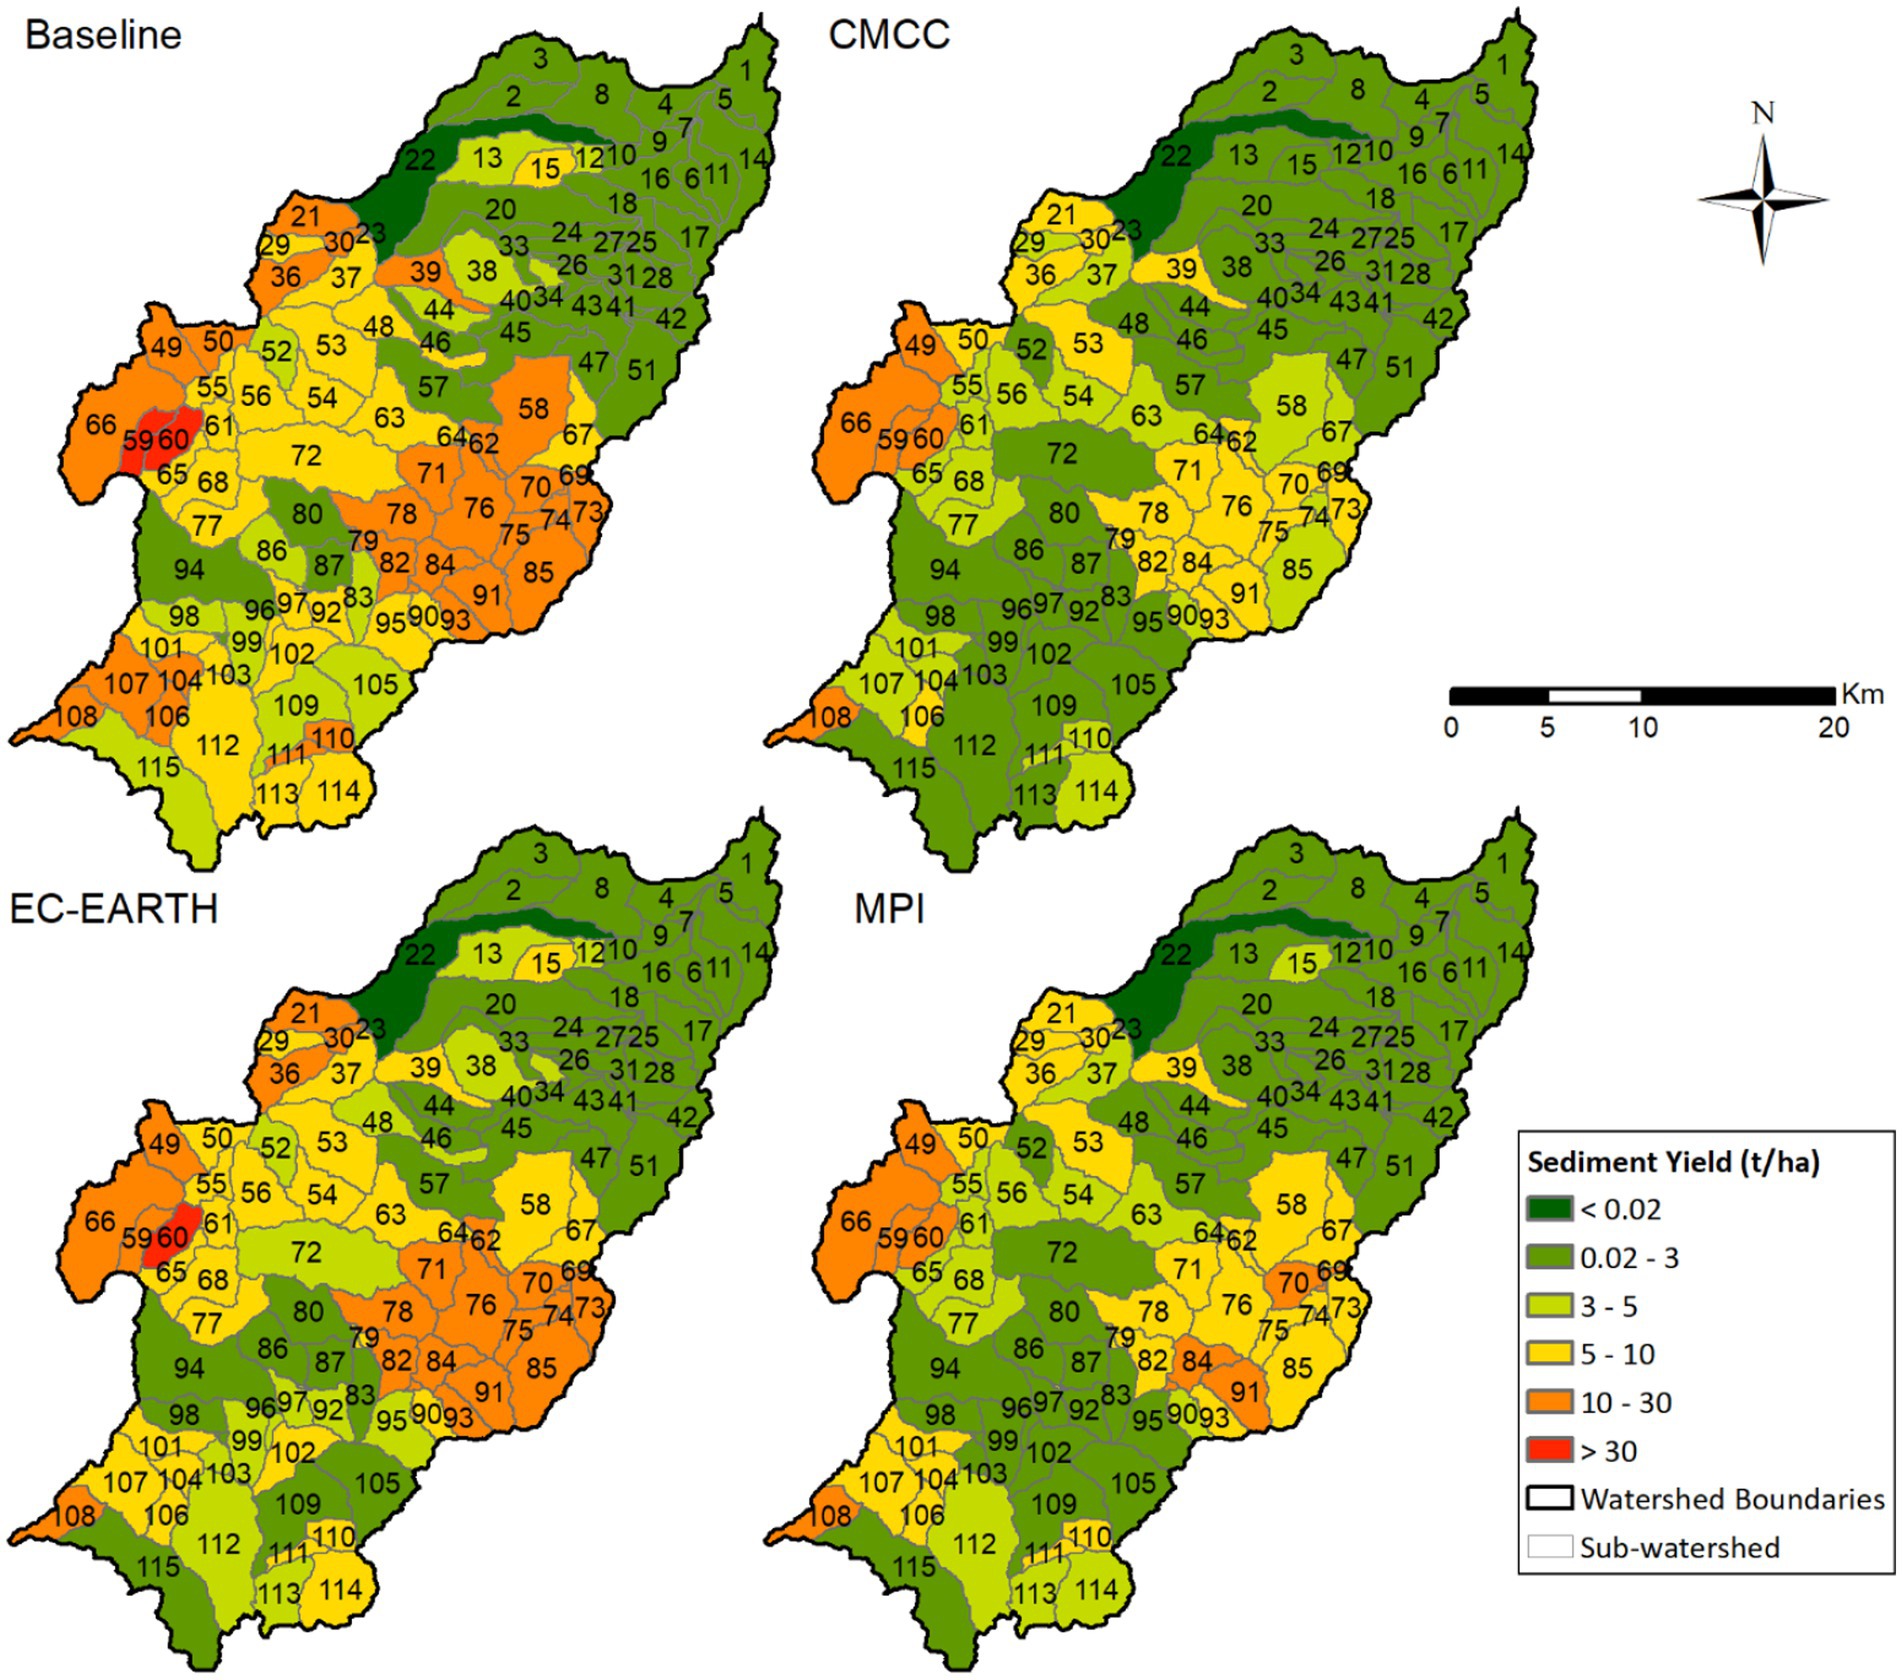
Figure 9. Annual spatial distribution of the specific sediment yield (t ha−1) for the baseline scenario (2000–2020) and the NF (2030–2050) climate changes scenarios (CMCC; EC-EARTH and MPI). Numbers refers to the SWAT sub-basins.
The model projections analyzed here showed a general reduction of the annual sediment yield: CMCC ranged from 0.01 to 22.8 t ha−1 (average reduction 53%), EC-EARTH from 0.01 to 30.4 t ha−1 (average reduction of 12%), and MPI from 0.01 to 25.3 t ha−1 (average reduction 42.5%). For CMCC the number of sub-basins under high erosion rate conditions (average > 10 t ha−1) is decreased to 5, while for MPI to 10. Several sub-basins in steep slope areas (e.g., central and eastern parts of the basin) changed class from 10 to 30 t ha−1 to 5–10 t ha−1 (Figure 9). Sub-basins N. 59 and N. 60 in Figure 9 showed a decrease of about 41% (18.3 t ha−1 and 22.4 t ha−1, respectively) for CMCC, and 34% (20.1 t ha−1; 5.3 t ha−1) for MPI. EC-EARTH showed a distribution of the high-risk erosion areas similar to the baseline: only 10 sub-basins changed class from 10–30 t ha−1 to 5–10 t ha−1 (Figure 9). Indeed, the number of sub-basins under high erosion rate conditions (average > 10 t ha−1) remained high (23). Sub-basins N. 59 and N. 60 showed a decrease of about 21% (N. 59 24.27 t ha−1; N.60 30.43 t ha−1).
The present work confirmed that the SWAT model can simulate the complex hydro-sedimentary response in the Mediterranean environment (Borrelli et al., 2021; Ricci et al., 2022) and the climate change impacts on hydro-sedimentary response. The statistical performances for the streamflow and the sediment load simulations were satisfactory for the calibration period (2007–2009). For the validation period (2010–2011), the statistical indices showed lower values, especially for the streamflow, which was overestimated. This can be attributed to errors in predicting low flow after the biggest flood event, recorded in November 2010 (Figure 2), which caused an increase in the CN values due to the high antecedent soil water conditions (Ricci et al., 2020; Dash et al., 2023). Another source of uncertainty, which can lead to discrepancies between observed and simulated data, can be represented by the not-optimal location of the weather station, associated with the convective character of rainfall events (Mtibaa and Asano, 2022; Ricci et al., 2022). In the validation period, SWAT underestimated the sediment load, especially the main observed peak (November 2010). This can be related to the MUSLE equation, which computes average soil loss values and does not consider some processes, such as streambank erosion, which are very common during peak flows in the Mediterranean environment (Panda et al., 2021). Ricci et al. (2020) pointed out that particular attention must be reserved when defining the sub-basins and HRUs in the Mediterranean areas to improve the model performances. This work confirmed the importance of the sub-basin delineation (Chen et al., 2021).
The identified limitations in SWAT’s performance during the baseline period may have important implications for interpreting future scenario predictions. Several key uncertainties should be considered. The model’s tendency to underestimate peak sediment loads during extreme events suggests that future projections may similarly fail to capture the full extent of sediment transport during intense rainfall. Additionally, the simulated overestimation of streamflow following a major flood, due to the high antecedent soil water content, suggests that post-event flow conditions could be overestimated in future scenarios. Another limitation is SWAT’s inability to effectively model streambank erosion processes, which are common in the study area peak flows. Hence, as a result, total sediment yield may be underestimated.
The model projections selected in the present study (MPI, EC-EARTH, CMCC) showed differences in rainfall prediction (coefficient of variation = 0.22), whereas they showed a good agreement in temperature increase. These results confirmed previous studies that recognized Global Circulation Models as the largest sources of uncertainty when analyzing the impact of CC on water resources (Vetter et al., 2017; Hattermann et al., 2018). Hence, the results of the SWAT model simulations showed differences in the magnitude of annual (Coefficient of variation = 0.47) and monthly streamflow (Coefficient of variation up to 0.67 in June and December) among the model projections. While uncertainty affects the results, the climate projections indicated that CC will have important implications on water resources with alterations in flow and sediment regimes. Specifically, reductions in streamflow were predicted by the model projections (up to 67% on a yearly basis) with a shift toward drier conditions. Among the model projections, CMCC forecasted the worst impact on water resources (−67%) whereas the EC-EARTH (−7%) showed a minor deviation compared to the baseline. The highest deviation from the baseline of the maximum streamflow for different durations (90-day max; 30-day max) was detected for the CMCC model and the lowest was found for the EC-EARTH. Concerning the maximum streamflow for one-day duration (1-day max), EC- EARTH showed an increase of the high values (+16% on average) compared to the baseline, contrarily CMCC showed a reduction of the highest values (−35%). MPI model projection also showed a negative rate of change in the mean annual 1-day max (−28%) and it generally showed an intermediate behavior compared to the CMCC and EC- EARTH for all the IHAs.
Concerning the sediment regime, overall the three model projections showed a reduction in annual sediment load (52.8% for CMCC, 18.1% for EC-EARTH, and 41.7% for MPI). A monthly redistribution of sediment transport can be highlighted. An average reduction of 60% was predicted by the models in January, March, and October. In July a remarkable increase in sediment load under CMCC (0.35 t ha−1 yr.−1) and MPI (0.24 t ha−1 yr.−1) compared to baseline (0.07 t ha−1 yr.−1) was simulated. The EC-EARTH predicted an increase in sediment load in April, May, and November, with respect to the baseline. Specific sediment loads ranged from 0.3 t ha−1 yr.−1 to 1.09 t ha−1 yr.−1 for EC-EARTH and from 0.08 t ha−1 yr.−1 to 0.68 t ha−1 yr.−1 for the baseline. Slopes and wheat cultivations were the main factors influencing the sediment yield production at the sub-basin level. Model projections showed a general reduction of the annual sediment yield and different spatial distributions of high-risk erosion areas. The sub-basins under a high erosion rate decreased. This change involved mainly the sub-basins located in the central and eastern parts of the basin, where the average slope ranges from 15 to 18%. EC-EARTH showed a minor reduction (12%) and a distribution of the high-risk erosion areas similar to the baseline. Some persistent hotspots can be highlighted. Sub-basins with slopes >18% (e.g., 49, 59, 60, 66, 108) maintained high erosion rates (>10 t ha-1) under all climate models.
These results confirmed previous studies analyzing CC impacts in basins under the Mediterranean climate. Indeed, a reduction in mean annual values of maximum streamflow for different duration was predicted for the Celone River basin (Italy; De Girolamo et al., 2022), for Ben Guerir River basin (Brouziyne et al., 2021) and the Merguellil basin (Tunisia; Abouabdillah et al., 2010) for the NF. A SWAT+ model-based study on the Sulcis watershed (Sardinia, Italy) (Pulighe et al., 2021) predicted notable reductions in water yield, surface runoff, groundwater recharge, and baseflow by the late 21st century under both RCP4.5 and RCP8.5 scenarios, primarily driven by increased temperatures and decreased precipitation, leading to enhanced evapotranspiration losses. Blöschl et al. (2019), who analyzed changing climate in Europe, found a negative rate of change in the mean annual flood discharge (highest peak discharge recorded per year) per decade in Candelaro River (Apulia, Italy), from 12 to 24%. On the other hand, the increment of the maximum streamflow for 1 day, evidenced especially by the EC-EARTH model, can be related to an increase in PCP intensity, as already stated by other authors (Noto et al., 2023; Ghanghas et al., 2024). This can lead to heightened soil erosion (Borrelli et al., 2020).
The findings of this study underscore that climate-driven changes are not merely prospective but are actively manifesting, necessitating immediate integration of these considerations into water resources management and territorial-environmental planning frameworks. The reduced water availability is only one of the implications of the CC on water resources. This study showed that hydrological and sediment regime alterations are expected in the future. As a result of the reduced magnitude of the annual flow, 1-day maximum flow, 30-, and 90-days maximum flow, river morphology and physical habitat conditions could change with several implications on the integrity of river ecology (Arthington, 2012; Todaro et al., 2022). For instance, species diversity, abundance and richness could be reduced, and non-native species could become dominant (Poff and Ward, 1989). Changes in nutrient cycles and transport could occur as pointed out by Ramião et al. (2024). The authors detected a decline in nutrient exports in a humid Portuguese Mediterranean catchment due to reduced runoff and soil erosion from decreased rainfall, reinforcing the link between climate change, sediment transport, and nutrient cycling. However, the potential for extreme hydrological variability remains. Indeed, studies on Mediterranean flood risk (Tramblay et al., 2023), found increasing trends in extreme precipitation-driven flash floods despite declining annual rainfall. The Carapelle River basin, as reported in the General Reclamation plan of the Capitanata areas (Consorzio di Bonifica Della Capitanata, 2022), is already experiencing significant water scarcity with declining groundwater levels from intensive agricultural extraction and insufficient surface water supplies (https://www.bonificacapitanata.it/schemi-idrici/ accessed on 7/2/2025). While plans exist for building the Palazzo d’Ascoli reservoir (67 million m3 capacity) to supplement water resources, climate change is expected to exacerbate the competition for water resources in the future.
Hence, water resources management options and mitigation measures (i.e., wastewater reuse, precision agriculture) are needed urgently to address the challenge of maintaining the river ecosystem and meeting the growing demand for freshwater resources. This study can provide to water manager’s specific details about the areas within the basing at risk of erosion also in the CC context. Management strategies, such as Best Management Practices (BMPs) or Nature Based Solutions (NBSs), should be promoted to achieve the goals of the EU Soil Strategy of the European Green Deal and of the Nature Restauration Law, which aim to address land degradation and have all EU ecosystems in healthy conditions by 2050 (Panagos et al., 2022; EU, 2024). No-tillage, contour farming, and cover crops are agricultural practices, already implemented in European countries, which contribute to maintaining a minimum soil cover and reduce the number and the depth of the tillage thus reducing sheet and rill erosion (Panagos et al., 2016; Ricci et al., 2020; Fendrich et al., 2023). In the proximity of the stream network and steep slope areas, riparian buffers, buffer strips, or land use changes in permanent crops, such as pasture or forest, are recognized as effective measures (Englund et al., 2021; Cole et al., 2020; Ricci et al., 2020). Related to this, it is important to highlight that BMPs and NBSs are multifunctional by definition, hence their implementation can lead to several other positive outcomes for the Agro-environmental ecosystem such as improved water quality, increased nutrients in the soil (Ricci et al., 2022; Netti et al., 2024) or increase the net greenhouse gas removal (Ran et al., 2018; Montanarella and Panagos, 2021). However, social, attitudinal, and other contextual factors, including the small size of farms, and the significant investments from the private and public sectors required for their implementation led to the failure of adopting BMPs or NBSs (Panagos et al., 2016; Brown et al., 2021; Ricci et al., 2020). To enhance the adoption of BMPs and NBSs, the most recent EU Common Agricultural Policy (CAP) 2023–2027 adopted the concept of eco-schemes, or a program of funding addressed to each farmer who voluntarily implements climate-sensitive and nature-sensitive practices (Panagos et al., 2022).
This study investigates the impact of climate change on streamflow and sediment yield in the Carapelle basin, located in the Apulia Region of Italy. Three climate model projections (CMCC, EC-EARTH, and MPI) were analyzed after undergoing bias correction, which improved the fit between observed and corrected data. Utilizing the SWAT model with data of the three different climate model projections the impacts of climate changes on hydrology and sediment yield are highlighted. Future projections (2030–2050) indicate a temperature increase (1–1.3°C) and a reduction in average annual rainfall (10–38%) compared to the baseline (2000–2020). As a result, the SWAT model predicted reductions in water yield and sediment load at the basin scale. The CMCC model forecasted the most significant reduction in mean annual flow (67%), followed by MPI (35%) and EC-EARTH (7%). Sediment load reductions were predicted at 52.8% for CMCC, 41.7% for MPI, and 18.1% for EC-EARTH. The decrease in annual rainfall is expected to lead to a reduction in water yield and sediment load across the basin, with considerable spatial variability indicating that some areas will be more affected than others. Despite the overall reduction in sediment load, certain sub-basins, especially those with steep slopes and wheat cultivation, will continue to experience critical erosion rates. To mitigate these effects, it is important to implement effective water resources management strategies and conservation agricultural practices. Best Management Practices (BMPs) and Nature-Based Solutions (NBSs) are identified as crucial for reducing soil erosion and improving agro-environmental health. Encouraging the adoption of BMPs and NBSs through policy incentives can significantly contribute to the resilience of the agricultural sector in the face of climate change. This research, by integrating multiple climate models and focusing on spatial variability, provides a novel, comprehensive assessment of the combined impacts of climate change on hydrology and sediment transport within a Mediterranean basin. The work underscores the importance to carry out specific studies on sediment dynamics to provide valuable information to water resource managers and policy makers. In conclusion, the study underscores the urgent need for proactive management and conservation efforts to address the anticipated challenges posed by climate change. By leveraging innovative practices and policies, it is possible to ensure the sustainable management of water and soil resources in the Mediterranean region, thereby supporting the resilience and productivity of its agricultural landscapes.
The raw data supporting the conclusions of this article will be made available by the authors, without undue reservation.
OMMA: Conceptualization, Data curation, Investigation, Methodology, Visualization, Writing – original draft, Writing – review & editing. GFR: Conceptualization, Data curation, Investigation, Methodology, Visualization, Writing – original draft, Writing – review & editing. FG: Investigation, Methodology, Supervision, Project administration, Funding acquisition, Writing – review & editing. AMDG: Investigation, Methodology, Supervision, Project administration, Writing – original draft, Writing – review & editing.
The author(s) declare that financial support was received for the research and/or publication of this article. This study was carried out within the Agritech National Research Center and received funding from the European Union Next-Generation EU (PIANO NAZIONALE DI RIPRESA E RESILIENZA (PNRR)—MISSIONE 4 COMPONENTE 2, INVESTIMENTO 1.4—D.D. 1032 17/06/2022, CN00000022) and the PRIN project “Soil Conservation for sustainable Agriculture in the framework of the European green deal” (SCALE) and received funding from the European Union Next- GenerationEU (National Recovery and Resilience Plan - NRPP, M4.C2.1.1., project 2022PB2NSP). This manuscript reflects only the authors’ views and opinions, neither the European Union nor the European Commission can be considered responsible for them.
The authors declare that the research was conducted in the absence of any commercial or financial relationships that could be construed as a potential conflict of interest.
The author(s) declared that they were an editorial board member of Frontiers, at the time of submission. This had no impact on the peer review process and the final decision.
All claims expressed in this article are solely those of the authors and do not necessarily represent those of their affiliated organizations, or those of the publisher, the editors and the reviewers. Any product that may be evaluated in this article, or claim that may be made by its manufacturer, is not guaranteed or endorsed by the publisher.
Abbaspour, K. C., Rouholahnejad, E., Vaghefi, S., Srinivasan, R., Yang, H., and Kløve, B. (2015). A continental-scale hydrology and water quality model for Europe: calibration and uncertainty of a high-resolution large-scale SWAT model. J. Hydrol. 524, 733–752. doi: 10.1016/j.jhydrol.2015.03.027
Abdelwahab, O. M. M., Bingner, R. L., Milillo, F., and Gentile, F. (2016). Evaluation of alternative management practices with the AnnAGNPS model in the Carapelle watershed. Soil Sci. 181, 293–305. doi: 10.1097/SS.0000000000000162
Abdelwahab, O. M. M., Ricci, G. F., De Girolamo, A. M., and Gentile, F. (2018). Modelling soil erosion in a Mediterranean watershed: comparison between SWAT and AnnAGNPS models. Environ. Res. 166, 363–376. doi: 10.1016/j.envres.2018.06.029
Abed-Elmdoust, A., Miri, M.-A., and Singh, A. (2016). Reorganization of river networks under changing spatiotemporal precipitation patterns: an optimal channel network approach, water. Resour. Res. 52, 8845–8860. doi: 10.1002/2015WR018391
Abouabdillah, A., Oueslati, O., De Girolamo, A. M., and Lo Porto, A. (2010). Modeling the impact of climate change in a mediterranean catchment (Merguellil, Tunisia). Fresenius Environ. Bull. 19, 2334–2347.
Arnold, J. G., Moriasi, D. N., Gassman, P. W., Abbaspour, K. C., White, M. J., Srinivasan, R., et al. (2012). SWAT: model use, calibration, and validation. Trans. ASABE 55, 1491–1508. doi: 10.13031/2013.42256
Arnold, J. G., Srinivasan, R., Muttiah, R. S., and Williams, J. R. (1998). Large area hydrologic modeling and assessment PART I: model DEVELOPMENT1. JAWRA 34, 73–89. doi: 10.1111/j.1752-1688.1998.tb05961.x
Arnold, J., Youssef, A., Yen, M., White, M. Y., Sheshukov, A. M., Sadeghi, A., et al. (2015). Hydrological processes and model representation: impact of soft data on calibration. Trans. ASABE 58, 1637–1660. doi: 10.13031/trans.58.10726
Arthington, A. H. (2012). Environmental flows: Saving rivers in the third millennium. Oakland, CA: University of California Press.
Autorità di Bacino. (2015). Studio per la definizione delle opere necessarie alla messa in sicurezza del reticolo idraulico pugliese, con particolare riferimento alle aree del Gargano, delle coste joniche e salentine Della regione Puglia. Avaialble online at: https://www.distrettoappenninomeridionale.it/oldsite/images/_PGRA/II%20ciclo%202019/PIANO%20VIGENTE/VALUTAZIONE%20PRELIMINARE%20II%20CICLO/Relazione%20metodologica/cartella_Reference/Puglia/studi_PAI_interventi/ITR161I020_5POFESR_CARAPELLE.pdf (Accessed February 05, 2025).
Bagnold, R. A. (1977). Bed load transport by natural rivers. Water Resour. Res. 13, 303–312. doi: 10.1029/WR013i002p00303
Bertola, M., Viglione, A., Vorogushyn, S., Lun, D., Merz, B., and Blöschl, G. (2021). Do small and large floods have the same drivers of change? A regional attribution analysis in Europe. Hydrol. Earth Syst. Sci. 25, 1347–1364. doi: 10.5194/hess-25-1347-2021
Block, P. J., Souza Filho, F. A., Sun, L., and Kwon, H.-H. (2009). A streamflow forecasting framework using multiple climate and hydrological Models1. JAWR 45, 828–843. doi: 10.1111/j.1752-1688.2009.00327.x
Blöschl, G., Hall, J., Parajka, J., Perdigão, R. A. P., Merz, B., Arheimer, B., et al. (2017). Changing climate shifts timing of European floods. Science 357, 588–590. doi: 10.1126/science.aan2506
Blöschl, G., Hall, J., Viglione, A., Perdigão, R. A. P., Parajka, J., Merz, B., et al. (2019). Changing climate both increases and decreases European river floods. Nature 573, 108–111. doi: 10.1038/s41586-019-1495-6
Boé, J., Terray, L., Habets, F., and Martin, E. (2007). Statistical and dynamical downscaling of the seine basin climate for hydro-meteorological studies. Int. J. Climatol. 27, 1643–1655. doi: 10.1002/joc.1602
Borrelli, P., Alewell, C., Alvarez, P., Anache, J. A. A., Baartman, J., Ballabio, C., et al. (2021). Soil erosion modelling: a global review and statistical analysis. Sci. Total Environ. 780:146494. doi: 10.1016/j.scitotenv.2021.146494
Borrelli, P., Robinson, D. A., Panagos, P., Lugato, E., Yang, J. E., Alewell, C., et al. (2020). Land use and climate change impacts on global soil erosion by water (2015-2070). Proc. Natl. Acad. Sci. 117, 21994–22001. doi: 10.1073/pnas.2001403117
Brouziyne, Y., Abouabdillah, A., Chehbouni, A., Hanich, L., Bergaoui, K., McDonnell, R., et al. (2020). Assessing hydrological vulnerability to future droughts in a Mediterranean watershed: combined indices-based and distributed modeling approaches. Water 12:333. doi: 10.3390/w12092333
Brouziyne, Y., De Girolamo, A. M., Aboubdillah, A., Benaabidate, L., Bouchaou, L., and Chehbouni, A. (2021). Modeling alterations in flow regimes under changing climate in a Mediterranean watershed: an analysis of ecologically-relevant hydrological indicators. Ecol. Inform. 61:101219. doi: 10.1016/j.ecoinf.2021.101219
Brown, C., Kovács, E., Herzon, I., Villamayor-Tomas, S., Albizua, A., Galanaki, A., et al. (2021). Simplistic understandings of farmer motivations could undermine the environmental potential of the common agricultural policy. Land Use Policy 101:105136. doi: 10.1016/j.landusepol.2020.105136
Challinor, A. J., Watson, J., Lobell, D. B., Howden, S. M., Smith, D. R., and Chhetri, N. (2014). A meta-analysis of crop yield under climate change and adaptation. Nat. Clim. Chang. 4, 287–291. doi: 10.1038/nclimate2153
Chen, J., Brissette, F. P., Chaumont, D., and Braun, M. (2013). Finding appropriate bias correction methods in downscaling precipitation for hydrologic impact studies over North America. Water Resour. Res. 49, 4187–4205. doi: 10.1002/wrcr.20331
Chen, D., Pan, Y., Jin, X., Du, H., Li, M., and Jiang, P. (2021). The delineation of ecological redline area for catchment sustainable management from the perspective of ecosystem services and social needs: a case study of the Xiangjiang watershed, China. Ecol. Indic. 121:107130. doi: 10.1016/j.ecolind.2020.107130
Cole, L. J., Stockan, J., and Helliwell, R. (2020). Managing riparian buffer strips to optimise ecosystem services: a review. Agric. Ecosyst. Environ. 296:106891. doi: 10.1016/j.agee.2020.106891
Consorzio di Bonifica Della Capitanata. (2022). Piano Generale Di Bonifica, Tutela E Valorizzazione Del Territorio Della Capitanata. Available at: https://www.bonificacapitanata.it/wp-content/uploads/2024/11/DCDA20220323_100_ALL2-1.pdf (Accessed February 05, 2025).
Darby, S. E., Hackney, C. R., Leyland, J., Kummu, M., Lauri, H., Parsons, D. R., et al. (2016). Fluvial sediment supply to a mega-delta reduced by shifting tropical-cyclone activity. Nature 539, 276–279. doi: 10.1038/nature19809
Dash, S. S., Sahoo, B., and Raghuwanshi, N. S. (2023). SWAT model calibration approaches in an integrated paddy-dominated catchment-command. Agric. Water Manag. 278:108138. doi: 10.1016/j.agwat.2023.108138
De Girolamo, A. M., Bouraoui, F., Buffagni, A., Pappagallo, G., and Lo Porto, A. (2017). Hydrology under climate change in a temporary river system: potential impact on water balance and flow regime. River Res. Appl. 33, 1219–1232. doi: 10.1002/rra.3165
De Girolamo, A. M., Cerdan, O., Grangeon, T., Ricci, G. F., Vandromme, R., and Lo Porto, A. (2022). Modelling effects of forest fire and post-fire management in a catchment prone to erosion: impacts on sediment yield. Catena 212:106080. doi: 10.1016/j.catena.2022.106080
Ehret, U., Zehe, E., Wulfmeyer, V., Warrach-Sagi, K., and Liebert, J. (2012). HESS opinions “should we apply bias correction to global and regional climate model data?”. Hydrol. Earth Syst. Sci. 16, 3391–3404. doi: 10.5194/hess-16-3391-2012
Elaloui, A., Khalki, E. M.El, Namous, M., Ziadi, K., Eloudi, H., Faouzi, E., et al. (2023). Soil erosion under future climate change scenarios in a semi-arid region. Water 15,:146. doi: 10.3390/w15010146
El-Rawy, M., Batelaan, O., Al-Arifi, N., Alotaibi, A., Abdalla, F., and Gabr, M. E. (2023). Climate change impacts on water resources in arid and semi-arid regions: a case study in Saudi Arabia. Water 15:606. doi: 10.3390/w15030606
Englund, O., Börjesson, P., Mola-Yudego, B., Berndes, G., Dimitriou, I., Cederberg, C., et al. (2021). Strategic deployment of riparian buffers and windbreaks in Europe can co-deliver biomass and environmental benefits. Commun. Earth Environ. 2:176. doi: 10.1038/s43247-021-00247-y
EU (2024). Regulation of the European Parliament and of the council on nature restoration and amending Regulation (EU) 2022/869. Available online at: https://data.consilium.europa.eu/doc/document/PE-74-2023-INIT/en/pdf (Accessed July 6, 2024).
Eyring, V., Cox, P. M., Flato, G. M., Gleckler, P. J., Abramowitz, G., Caldwell, P., et al. (2019). Taking climate model evaluation to the next level. Nat. Clim. Chang. 9, 102–110. doi: 10.1038/s41558-018-0355-y
Fang, G. H., Yang, J., Chen, Y. N., and Zammit, C. (2015). Comparing bias correction methods in downscaling meteorological variables for a hydrologic impact study in an arid area in China. Hydrol. Earth Syst. Sci. 19, 2547–2559. doi: 10.5194/hess-19-2547-2015
Fendrich, A. N., Matthews, F., Van Eynde, E., Carozzi, M., Li, Z., d’Andrimont, R., et al. (2023). From regional to parcel scale: a high-resolution map of cover crops across Europe combining satellite data with statistical surveys. Sci. Total Environ. 873:162300. doi: 10.1016/j.scitotenv.2023.162300
Fonseca, A. R., and Santos, J. A. (2019). Predicting hydrologic flows under climate change: the Tâmega Basin as an analog for the Mediterranean region. Sci. Total Environ. 668, 1013–1024. doi: 10.1016/j.scitotenv.2019.01.435
Fornaroli, R., Muñoz-Mas, R., and Martínez-Capel, F. (2020). Fish community responses to antecedent hydrological conditions based on long-term data in Mediterranean river basins (Iberian Peninsula). Sci. Total Environ. 728:138052. doi: 10.1016/j.scitotenv.2020.138052
Fortesa, J., Ricci, G. F., García-Comendador, J., Gentile, F., Estrany, J., Sauquet, E., et al. (2021). Analysing hydrological and sediment transport regime in two Mediterranean intermittent rivers. Catena 196:104865. doi: 10.1016/j.catena.2020.104865
Gao, G., Fu, B., Zhang, J., Ma, Y., and Sivapalan, M. (2018). Multiscale temporal variability of flow-sediment relationships during the 1950s–2014 in the loess plateau, China. J. Hydrol. 563, 609–619. doi: 10.1016/j.jhydrol.2018.06.044
Gao, Y., Sarker, S., Sarker, T., and Leta, O. T. (2022). Analyzing the critical locations in response of constructed and planned dams on the Mekong River basin for environmental integrity. Environ. Res. Commun. 4:101001. doi: 10.1088/2515-7620/ac9459
Gentile, F., Bisantino, T., Corbino, R., Milillo, F., Romano, G., and Liuzzi, G. T. (2010). Monitoring and analysis of suspended sediment transport dynamics in the Carapelle torrent (southern Italy). Catena 80, 1–8. doi: 10.1016/J.CATENA.2009.08.004
Ghanghas, A., Sharma, A., and Merwade, V. (2024). Unveiling the evolution of extreme rainfall storm structure across space and time in a warming climate. Earths Future 12:e2024EF004675. doi: 10.1029/2024EF004675
Groppelli, B., Soncini, A., Bocchiola, D., and Rosso, R. (2011). Evaluation of future hydrological cycle under climate change scenarios in a mesoscale alpine watershed of Italy. Nat. Hazards Earth Syst. Sci. 11, 1769–1785. doi: 10.5194/nhess-11-1769-2011
Gu, L., Yin, J., Slater, L. J., Chen, J., Do, H. X., Wang, H.-M., et al. (2023). Intensification of global hydrological droughts under anthropogenic climate warming. Water Resour. Res. 59:e2022WR032997. doi: 10.1029/2022WR032997
Gudmundsson, L., Bremnes, J. B., Haugen, J. E., and Engen-Skaugen, T. (2012). Technical note: downscaling RCM precipitation to the station scale using statistical transformations – a comparison of methods. Hydrol. Earth Syst. Sci. 16, 3383–3390. doi: 10.5194/hess-16-3383-2012
Hargreaves, G. H. (1975). Moisture availability and crop production. Trans. ASAE 18, 0980–0984. doi: 10.13031/2013.36722
Hattermann, F. F., Vetter, T., Breuer, L., Su, B., Daggupati, P., Donnelly, C., et al. (2018). Sources of uncertainty in hydrological climate impact assessment: a cross-scale study. Environ. Res. Lett. 13:15006. doi: 10.1088/1748-9326/aa9938
Hoang, L. P., Lauri, H., Kummu, M., Koponen, J., van Vliet, M. T. H., Supit, I., et al. (2016). Mekong River flow and hydrological extremes under climate change. Hydrol. Earth Syst. Sci. 20, 3027–3041. doi: 10.5194/hess-20-3027-2016
Ines, A. V. M., and Hansen, J. W. (2006). Bias correction of daily GCM rainfall for crop simulation studies. Agric. For. Meteorol. 138, 44–53. doi: 10.1016/j.agrformet.2006.03.009
IPCC (2014). Climate change 2013 – The physical science basis: Working group I contribution to the fifth assessment report of the intergovernmental panel on climate change. Cambridge: Cambridge University Press.
IPCC (2021). Climate change 2021 – The physical science basis: Working group I contribution to the sixth assessment report of the intergovernmental panel on climate change. Cambridge: Cambridge University Press.
Jeong, J., Kannan, N., Arnold, J., Glick, R., Gosselink, L., and Srinivasan, R. (2010). Development and integration of sub-hourly rainfall–runoff modeling capability within a watershed model. Water Resour. Manag. 24, 4505–4527. doi: 10.1007/s11269-010-9670-4
Johnson, F., and Sharma, A. (2011). Accounting for interannual variability: a comparison of options for water resources climate change impact assessments. Water Resour. Res. 47:272. doi: 10.1029/2010WR009272
Kiem, A. S., Ishidaira, H., Hapuarachchi, H. P., Zhou, M. C., Hirabayashi, Y., and Takeuchi, K. (2008). Future hydroclimatology of the Mekong River basin simulated using the high-resolution Japan meteorological agency (JMA) AGCM. Hydrol. Process. 22, 1382–1394. doi: 10.1002/hyp.6947
Leone, M., Gentile, F., Lo Porto, A., Ricci, G. F., and De Girolamo, A. M. (2023). Ecological flow in southern Europe: status and trends in non-perennial rivers. J. Environ. Manag. 342:118097. doi: 10.1016/j.jenvman.2023.118097
Leone, M., Gentile, F., Lo Porto, A., Ricci, G. F., Schürz, C., Strauch, M., et al. (2024). Setting an environmental flow regime under climate change in a data-limited Mediterranean basin with temporary river. J. Hydrol. Reg. Stud. 52:101698. doi: 10.1016/j.ejrh.2024.101698
Lespinas, F., Ludwig, W., and Heussner, S. (2014). Hydrological and climatic uncertainties associated with modeling the impact of climate change on water resources of small Mediterranean coastal rivers. J. Hydrol. 511, 403–422. doi: 10.1016/j.jhydrol.2014.01.033
Li, Z., and Fang, H. (2016). Impacts of climate change on water erosion: a review. Earth Sci. Rev. 163, 94–117. doi: 10.1016/j.earscirev.2016.10.004
Lun, Y., Liu, L., Cheng, L., Li, X., Li, H., and Xu, Z. (2021). Assessment of GCMs simulation performance for precipitation and temperature from CMIP5 to CMIP6 over the Tibetan plateau. Int. J. Climatol. 41, 3994–4018. doi: 10.1002/joc.7055
Ma, D., Bai, Z., Xu, Y.-P., Gu, H., and Gao, C. (2024). Assessing streamflow and sediment responses to future climate change over the upper Mekong River basin: a comparison between CMIP5 and CMIP6 models. J. Hydrol. Reg. Stud. 52:101685. doi: 10.1016/j.ejrh.2024.101685
Ma, D., Xu, Y.-P., Gu, H., Zhu, Q., Sun, Z., and Xuan, W. (2019). Role of satellite and reanalysis precipitation products in streamflow and sediment modeling over a typical alpine and gorge region in Southwest China. Sci. Total Environ. 685, 934–950. doi: 10.1016/j.scitotenv.2019.06.183
Maeda, E. E., Pellikka, P. K. E., Siljander, M., and Clark, B. J. F. (2010). Potential impacts of agricultural expansion and climate change on soil erosion in the eastern Arc Mountains of Kenya. Geomorphology 123, 279–289. doi: 10.1016/j.geomorph.2010.07.019
Mandle, L., Wolny, S., Bhagabati, N., Helsingen, H., Hamel, P., Bartlett, R., et al. (2017). Assessing ecosystem service provision under climate change to support conservation and development planning in Myanmar. PLoS One 12:e0184951. doi: 10.1371/journal.pone.0184951
Maraun, D., Wetterhall, F., Ireson, A. M., Chandler, R. E., Kendon, E. J., Widmann, M., et al. (2010). Precipitation downscaling under climate change: recent developments to bridge the gap between dynamical models and the end user. Rev. Geophys. 48:314. doi: 10.1029/2009RG000314
Milella, P., Bisantino, T., Gentile, F., Iacobellis, V., and Trisorio Liuzzi, G. (2012). Diagnostic analysis of distributed input and parameter datasets in Mediterranean basin streamflow modeling. J. Hydrol. 473, 262–276. doi: 10.1016/j.jhydrol.2012.09.039
Molina-Navarro, E., Andersen, H. E., Nielsen, A., Thodsen, H., and Trolle, D. (2017). The impact of the objective function in multi-site and multi-variable calibration of the SWAT model. Environ. Model Softw. 93, 255–267. doi: 10.1016/j.envsoft.2017.03.018
Montanarella, L., and Panagos, P. (2021). The relevance of sustainable soil management within the European green Deal. Land Use Policy 100:104950. doi: 10.1016/j.landusepol.2020.104950
Montgomery, D. R. (2007). Soil erosion and agricultural sustainability. Proc. Natl. Acad. Sci. 104, 13268–13272. doi: 10.1073/pnas.0611508104
Moriasi, D. N., Arnold, J. G., Liew, M., Bingner, R. L., Harmel, R. D., and Veith, T. L. (2007). Model evaluation guidelines for systematic quantification of accuracy in watershed simulations. Trans. ASABE 50, 885–900. doi: 10.13031/2013.23153
Mtibaa, S., and Asano, S. (2022). Hydrological evaluation of radar and satellite gauge-merged precipitation datasets using the SWAT model: case of the Terauchi catchment in Japan. J. Hydrol. Reg. Stud. 42:101134. doi: 10.1016/j.ejrh.2022.101134
Nadal-Romero, E., Rodríguez-Caballero, E., Chamizo, S., Juez, C., Cantón, Y., and García-Ruiz, J. M. (2022). Mediterranean badlands: their driving processes and climate change futures. Earth Surf. Process. Landf. 47, 17–31. doi: 10.1002/esp.5088
Nanjegowda, R. A., and Parambath, S. K. (2022). A novel bias correction method for extreme rainfall events based on L-moments. Int. J. Climatol. 42, 250–264. doi: 10.1002/joc.7242
Neitsch, S. L., Williams, J. R., Arnold, J. G., and Kiniry, J. R. (2011). Soil and water assessment tool theoretical documentation version 2009. Texas Water Resources Institute, College Station. Available at: https://oaktrust.library.tamu.edu/items/ee261b66-c392-40d9-8c03-e455f5a8347e
Netti, A. M., Abdelwahab, O. M., Datola, G., Ricci, G. F., Damiani, P., Oppio, A., et al. (2024). Assessment of nature-based solutions for water resource management in agricultural environments: a stakeholders’ perspective in southern Italy. Sci. Rep. 14:24668. doi: 10.1038/s41598-024-76346-5
Noto, L. V., Cipolla, G., Francipane, A., and Pumo, D. (2023). Climate change in the Mediterranean Basin (Part I): induced alterations on climate Forcings and hydrological processes. Water Resour. Manag. 37, 2287–2305. doi: 10.1007/s11269-022-03400-0
O’Neill, B. C., Tebaldi, C., van Vuuren, D. P., Eyring, V., Friedlingstein, P., Hurtt, G., et al. (2016). The scenario model Intercomparison project (ScenarioMIP) for CMIP6. Geosci. Model Dev. 9, 3461–3482. doi: 10.5194/gmd-9-3461-2016
Panagos, P., Ballabio, C., Himics, M., Scarpa, S., Matthews, F., Bogonos, M., et al. (2021). Projections of soil loss by water erosion in Europe by 2050. Environ. Sci. Pol. 124, 380–392. doi: 10.1016/j.envsci.2021.07.012
Panagos, P., Borrelli, P., Poesen, J., Ballabio, C., Lugato, E., Meusburger, K., et al. (2015). The new assessment of soil loss by water erosion in Europe. Environ. Sci. Pol. 54, 438–447. doi: 10.1016/j.envsci.2015.08.012
Panagos, P., Imeson, A., Meusburger, K., Borrelli, P., Poesen, J., and Alewell, C. (2016). Soil conservation in Europe: wish or reality? Land Degrad. Dev. 27, 1547–1551. doi: 10.1002/ldr.2538
Panagos, P., Montanarella, L., Barbero, M., Schneegans, A., Aguglia, L., and Jones, A. (2022). Soil priorities in the European Union. Geoderma Reg. 29:e00510. doi: 10.1016/j.geodrs.2022.e00510
Panda, C., Das, D. M., Raul, S. K., and Sahoo, B. C. (2021). Sediment yield prediction and prioritization of sub-watersheds in the upper Subarnarekha basin (India) using SWAT. Arab. J. Geosci. 14:809. doi: 10.1007/s12517-021-07170-8
Piras, M., Mascaro, G., Deidda, R., and Vivoni, E. R. (2016). Impacts of climate change on precipitation and discharge extremes through the use of statistical downscaling approaches in a Mediterranean basin. Sci. Total Environ. 543, 952–964. doi: 10.1016/j.scitotenv.2015.06.088
Poff, N. L., and Ward, J. V. (1989). Implications of streamflow variability and predictability for lotic community structure: a regional analysis of streamflow patterns. Can. J. Fish. Aquat. Sci. 46, 1805–1818. doi: 10.1139/f89-228
Pulighe, G., Lupia, F., Chen, H., and Yin, H. (2021). Modeling climate change impacts on water balance of a Mediterranean watershed using SWAT+. Hydrology 8:157. doi: 10.3390/hydrology8040157
Rajczak, J., Kotlarski, S., and Schär, C. (2016). Does quantile mapping of simulated precipitation correct for biases in transition probabilities and spell lengths? J. Clim. 29, 1605–1615. doi: 10.1175/JCLI-D-15-0162.1
Ramião, J. P., Pascoal, C., Pinto, R., and Carvalho-Santos, C. (2024). Mitigating water pollution in a Portuguese river basin under climate change through agricultural sustainable practices. Mitig. Adapt. Strateg. Glob. Change 29:25. doi: 10.1007/s11027-024-10121-9
Ran, L., Lu, X., Fang, N., and Yang, X. (2018). Effective soil erosion control represents a significant net carbon sequestration. Sci. Rep. 8:12018. doi: 10.1038/s41598-018-30497-4
Rathjens, H., Bieger, K., Srinivasan, R., Chaubey, I., and Arnold, J. G. (2016). CMhyd user manual. Available online at: https://swat.tamu.edu/media/115265/bias_cor_man.pdf (Accessed July 6, 2024).
Ricci, G. F., D’Ambrosio, E., De Girolamo, A. M., and Gentile, F. (2022). Efficiency and feasibility of Best management practices to reduce nutrient loads in an agricultural river basin. Agric. Water Manag. 259:107241. doi: 10.1016/j.agwat.2021.107241
Ricci, G. F., De Girolamo, A. M., Abdelwahab, O. M. M., and Gentile, F. (2018). Identifying sediment source areas in a Mediterranean watershed using the SWAT model. Land Degrad. Dev. 29, 1233–1248. doi: 10.1002/ldr.2889
Ricci, G. F., Jeong, J., De Girolamo, A. M., and Gentile, F. (2020). Effectiveness and feasibility of different management practices to reduce soil erosion in an agricultural watershed. Land Use Policy 90:104306. doi: 10.1016/j.landusepol.2019.104306
Richter, B. D., Baumgartner, J. V., Powell, J., and Braun, D. P. (1996). A method for assessing hydrologic alteration within ecosystems. Conserv. Biol. 10, 1163–1174. doi: 10.1046/j.1523-1739.1996.10041163.x
Rohith, A. N., and Jayakumar, K. V. (2017). “Downscaling precipitation in Hemavathy River basin by three different approaches” in Development of water resources in India. eds. V. Garg, V. P. Singh, and V. Raj (Cham: Springer International Publishing), 189–198.
Romanazzi, A., Gentile, F., and Polemio, M. (2015). Modelling and management of a Mediterranean karstic coastal aquifer under the effects of seawater intrusion and climate change. Environ. Earth Sci. 74, 115–128. doi: 10.1007/s12665-015-4423-6
Sarker, S., Veremyev, A., Boginski, V., and Singh, A. (2019). Critical nodes in river networks. Sci. Rep. 9:11178. doi: 10.1038/s41598-019-47292-4
Sennikovs, J., and Bethers, U. (2009). “Statistical downscaling method of regional climate model results for hydrological modelling” in 18th world IMACS congress and MODSIM09 international congress on modelling and simulation. eds. R. S. Anderssen, R. D. Braddock, and L. T. H. Newham (Cairns, Australia: Modelling and Simulation Society of Australia and New Zealand and International Association for Mathematics and Computers in Simulation), 3962–3968.
Serpa, D., Nunes, J. P., Santos, J., Sampaio, E., Jacinto, R., Veiga, S., et al. (2015). Impacts of climate and land use changes on the hydrological and erosion processes of two contrasting Mediterranean catchments. Sci. Total Environ. 538, 64–77. doi: 10.1016/j.scitotenv.2015.08.033
Singhal, A., Jaseem, M., Divya, D., Sarker, S., Prajapati, P., Singh, A., et al. (2024). Identifying potential locations of hydrologic monitoring stations based on topographical and hydrological information. Water Resour. Manag. 38, 369–384. doi: 10.1007/s11269-023-03675-x
Sun, F., Roderick, M. L., Lim, W. H., and Farquhar, G. D. (2011). Hydroclimatic projections for the Murray-Darling basin based on an ensemble derived from intergovernmental panel on climate change AR4 climate models. Water Resour. Res. 47:829. doi: 10.1029/2010WR009829
Sun, J., Yan, H., Bao, Z., and Wang, G. (2022). Investigating impacts of climate change on runoff from the Qinhuai River by using the SWAT model and CMIP6 scenarios. Water 14:778. doi: 10.3390/w14111778
Tariq, M., Rohith, A. N., Cibin, R., Aruffo, E., Abouzied, G. A. A., and Di Carlo, P. (2024). Understanding future hydrologic challenges: modelling the impact of climate change on river runoff in Central Italy. Environ. Challenges 15:100899. doi: 10.1016/j.envc.2024.100899
Teutschbein, C., and Seibert, J. (2012). Bias correction of regional climate model simulations for hydrological climate-change impact studies: review and evaluation of different methods. J. Hydrol. 457, 12–29. doi: 10.1016/j.jhydrol.2012.05.052
Todaro, V., D’Oria, M., Secci, D., Zanini, A., and Tanda, M. G. (2022). Climate change over the Mediterranean region: local temperature and precipitation variations at five pilot sites. Water 14:2499. doi: 10.3390/w14162499
Tramblay, Y., Arnaud, P., Artigue, G., Lang, M., Paquet, E., Neppel, L., et al. (2023). Changes in Mediterranean flood processes and seasonality. Hydrol. Earth Syst. Sci. 27, 2973–2987. doi: 10.5194/hess-27-2973-2023
Tschöke, G. V., Kruk, N. S., de Queiroz, P. I. B., Chou, S. C., and de Sousa Junior, W. C. (2017). Comparison of two bias correction methods for precipitation simulated with a regional climate model. Theor. Appl. Climatol. 127, 841–852. doi: 10.1007/s00704-015-1671-z
Turco, M., Llasat, M. C., Herrera, S., and Gutiérrez, J. M. (2017). Bias correction and downscaling of future RCM precipitation projections using a MOS-analog technique. J. Geophys. Res. Atmos. 122, 2631–2648. doi: 10.1002/2016JD025724
USDA-SCS (1972). National Engineering Handbook, section 4, hydrology. Washington, DC: USDA Soil Conservation Service.
Vetter, T., Reinhardt, J., Flörke, M., van Griensven, A., Hattermann, F., Huang, S., et al. (2017). Evaluation of sources of uncertainty in projected hydrological changes under climate change in 12 large-scale river basins. Clim. Chang. 141, 419–433. doi: 10.1007/s10584-016-1794-y
Villani, L., Castelli, G., Yimer, E. A., Chawanda, C. J., Nkwasa, A., Van Schaeybroeck, B., et al. (2024). Impacts of climate change and vegetation response on future aridity in a Mediterranean catchment. Agric. Water Manag. 299:108878. doi: 10.1016/j.agwat.2024.108878
Wasowski, J., Lamanna, C., and Casarano, D. (2010). Influence of land-use change and precipitation patterns on landslide activity in the Daunia Apennines, Italy. Q. J. Eng. Geol. Hydrogeol. 43, 387–401. doi: 10.1144/1470-9236/08-101
Williams, J. R. (1975). Sediment-yield prediction with universal equation using runoff energy factor1., in Present and prospective Technology for Predicting Sediment Yield and Sources: Proceedings of the sediment-yield workshop, USDA sedimentation laboratory, Oxford, Miss., Nov. 28–30, 1972, (Agricultural Research Service, US Department of Agriculture).
Winchell, M., Srinivasan, R., Di Luzio, M., and Arnold, J. (2013). ArcSWAT interface for SWAT2012: user’s guide. Texas: Blackland Research Center.
Wu, J., Yen, H., Arnold, J. G., Yang, Y. C. E., Cai, X., White, M. J., et al. (2020). Development of reservoir operation functions in SWAT+ for national environmental assessments. J Hydrol (Amst) 583:124556. doi: 10.1016/j.jhydrol.2020.124556
Xiong, M., and Leng, G. (2024). Global soil water erosion responses to climate and land use changes. Catena 241:108043. doi: 10.1016/j.catena.2024.108043
Yang, D., Kanae, S., Oki, T., Koike, T., and Musiake, K. (2003). Global potential soil erosion with reference to land use and climate changes. Hydrol. Process. 17, 2913–2928. doi: 10.1002/hyp.1441
Yin, Z., Feng, Q., Yang, L., Deo, R. C., Adamowski, J. F., Wen, X., et al. (2020). Projected spatial patterns in precipitation and air temperature for China’s northwest region derived from high-resolution regional climate models. Int. J. Climatol. 40, 3922–3941. doi: 10.1002/joc.6435
Yin, J., Guo, S., Gentine, P., Sullivan, S. C., Gu, L., He, S., et al. (2021). Does the hook structure constrain future flood intensification under anthropogenic climate warming? Water Resour. Res. 57:e2020WR028491. doi: 10.1029/2020WR028491
Zema, D. A., Carrà, B. G., Lucas-Borja, M. E., Filianoti, P. G. F., Pérez-Cutillas, P., and Conesa-García, C. (2022). Modelling water flow and soil Erosion in Mediterranean headwaters (with or without check dams) under land-use and climate change scenarios using SWAT. Water 14:338. doi: 10.3390/w14152338
Keywords: GCMS, climate change, runoff, SWAT, sediment, bias correction
Citation: Abdelwahab OMM, Ricci GF, Gentile F and De Girolamo AM (2025) Modelling the impact of climate change on runoff and sediment yield in Mediterranean basins: the Carapelle case study (Apulia, Italy). Front. Water. 7:1486644. doi: 10.3389/frwa.2025.1486644
Edited by:
Maria Giovanna Tanda, University of Parma, ItalyReviewed by:
Gonzalo González Barberá, Spanish National Research Council (CSIC), SpainCopyright © 2025 Abdelwahab, Ricci, Gentile and De Girolamo. This is an open-access article distributed under the terms of the Creative Commons Attribution License (CC BY). The use, distribution or reproduction in other forums is permitted, provided the original author(s) and the copyright owner(s) are credited and that the original publication in this journal is cited, in accordance with accepted academic practice. No use, distribution or reproduction is permitted which does not comply with these terms.
*Correspondence: Giovanni Francesco Ricci, Z2lvdmFubmkucmljY2lAdW5pYmEuaXQ=
Disclaimer: All claims expressed in this article are solely those of the authors and do not necessarily represent those of their affiliated organizations, or those of the publisher, the editors and the reviewers. Any product that may be evaluated in this article or claim that may be made by its manufacturer is not guaranteed or endorsed by the publisher.
Research integrity at Frontiers
Learn more about the work of our research integrity team to safeguard the quality of each article we publish.