- 1State Environmental Protection Key Laboratory of Integrated Surface Water-Groundwater Contamination Control, School of Environmental Science and Engineering, Southern University of Science and Technology, Shenzhen, China
- 2Guangdong Provincial Key Laboratory of Soil and Groundwater Pollution Control, School of Environmental Science and Engineering, Southern University of Science and Technology, Shenzhen, China
- 3State Key Laboratory of Mountain Hazards and Engineering Resilience, Institute of Mountain Hazards and Environment, Chinese Academy of Sciences, Chengdu, China
- 4College of Resources and Environmental Engineering, Ludong University, Yantai, China
- 5Eastern Institute for Advanced Study, Eastern Institute of Technology, Ningbo, China
Seasonally frozen ground (SFG) is a significant component of the cryosphere, and its extent is gradually increasing due to climate change. The hydrological influence of SFG is complex and varies under different climatic and physiographic conditions. The summer rainfall dominant climate pattern in Qinghai Lake Basin (QLB) leads to a significantly different seasonal freeze–thaw process and groundwater flow compared to regions with winter snowfall dominated precipitation. The seasonal hydrological processes in QLB are not fully understood due to the lack of soil temperature and groundwater observation data. A coupled surface and subsurface thermal hydrology model was applied to simulate the freeze–thaw process of SFG and groundwater flow in the QLB. The results indicate that SFG begins to freeze in early November, reaches a maximum freezing depth of approximately 2 meters in late March, and thaws completely by June. This freeze–thaw process is primarily governed by the daily air temperature variations. During the early rainy season from April to June, the remaining SFG in deep soil hinders the majority of rainwater infiltration, resulting in a two-month delay in the peak of groundwater discharge compared to scenario with no SFG present. Colder conditions intensify this effect, delaying peak discharge by 3 months, whereas warmer conditions reduce the lag to 1 month. The ice saturation distribution along the hillslope is affected by topography, with a 10 cm deeper ice saturation distribution and 3 days delay of groundwater discharge in the steep case compared to the flat case. These findings highlight the importance of the freeze–thaw process of SFG on hydrological processes in regions dominated by summer rainfall, providing valuable insights into the hydro-ecological response. Enhanced understanding of these dynamics may improve water resource management strategies and support future research into climate-hydrology interactions in SFG-dominated landscapes.
1 Introduction
Frozen ground, extensively found in Earth’s high-latitude and high-altitude regions, is increasingly vulnerable to degradation caused by climate warming (Li et al., 2008; Koven et al., 2011; Zhao and Wu, 2019). It can be categorized into permafrost and seasonally frozen ground (SFG) depending on the freezing duration. Permafrost refers to ground where the subsurface temperature remains at or below 0°C for a minimum of two consecutive years, while SFG occurs where the minimum annual ground surface temperature falls below 0°C, causing the shallow subsurface to freeze in winter and thaw in summer (Evans and Ge, 2017). The degradation of frozen ground with the increasing global mean annual air temperature (MAAT) poses a significant threat to the stability and health of the boreal ecosystem (Zou et al., 2017; Ji et al., 2022; Vaughan et al., 2013). Thus, understanding the mechanisms by which freezing and thawing processes impact hydrologic cycles is crucial for ensuring the sustainability of cold regions (Schmidt et al., 2011; Chen et al., 2024; Sun et al., 2021; Hu et al., 2023; Rafiei Sardooi et al., 2021).
Freeze–thaw processes significantly impact the hydrological dynamics by affecting groundwater recharge, flow pathways and discharge (Ge et al., 2011; Kuang et al., 2024; Ma et al., 2017; Painter et al., 2013; McKenzie and Voss, 2013). In permafrost regions, groundwater flows in the shallow active layer as supra-permafrost groundwater and in the deep subsurface as sub-permafrost groundwater. However, sub-permafrost groundwater is often isolated from the surface due to the presence of low-permeable permafrost (Walvoord et al., 2012; Fan et al., 2024; Evans et al., 2015; Ma et al., 2017). The active layer thickness (ALT) increases with MAAT, lengthening the supra-permafrost groundwater flow path and enhancing the groundwater discharges to streams (Evans et al., 2015; Ma et al., 2017; Sjöberg et al., 2021). In contrast to permafrost, the hydrological influences of SFG are highly site- and climate-specific and less studied (Ala-Aho et al., 2021; Laudon et al., 2007; Appels et al., 2018). Many studies indicate that SFG inhibits groundwater recharge, decreases hydrological connectivity between surface water and groundwater, and thus affects groundwater flow (Cao et al., 2021; Evans et al., 2018; Hu et al., 2022). Conversely, some research reports minor or negligible effects of SFG on hydrological processes (Rush et al., 2021; Rey et al., 2021). These contradictions are primarily due to the presence of the snow cover. In areas with significant snow cover, where meltwater from the snowpack constitutes a vital component of river discharge (Dar et al., 2024; Pant et al., 2021), the hydrological impact of SFG is typically absent, whereas reduced snow cover can increase the hydrological importance of SFG (Ala-Aho et al., 2021). Most previous studies on SFG have been conducted in Arctic–subarctic areas, where winter snowfall dominates climate patterns and creates varying degrees of snow cover. In contrast, Qinghai-Tibetan Plateau (QTP) has a markedly different climate, with summer rainfall constituting the majority of annual precipitation and minimal snow cover (Ma et al., 2021; Chen et al., 2015; Pan et al., 2017).
The basins in the middle and low latitudes of the Qinghai-Tibet Plateau exhibit significant variations in topography, geomorphology, and altitude. Permafrost and SFG are typically distributed at different altitudes within these basins (Cheng and Jin, 2013; Fan et al., 2024), collectively altering hydrological conditions and resulting in complex hydrological processes, SFG usually serves as a transitional and connective zone between permafrost zone and basin outlets, significantly influencing the hydrological processes throughout the entire basin (Ma et al., 2017; Woo, 2012; Ma et al., 2021). While water chemistry and environmental tracers have been widely used to investigate the freeze–thaw and hydrological processes of SFG in the QTP, these methods have significant uncertainty and do not fully elucidate the physical mechanisms influencing hydrological processes (Hu et al., 2022; Chen et al., 2023; Zhao et al., 2022; Ma et al., 2021; Cao et al., 2021). In recent years, physics-based hydro-thermal models that consider phase changes of water, such as SUTRA-ICE and PFLOTRAN-ICE, have received more attention for quantifying the role of SFG in hydrological processes in Arctic–subarctic areas (Rush and Rajaram, 2022; Rush et al., 2021; Walvoord et al., 2019; Evans et al., 2018). Despite this progress, research remains limited in regions where SFG coexists with summer rainfall and minimal snow cover. There is a critical need for quantitative assessments of freeze–thaw dynamics on groundwater flow in these areas. Addressing this research gap is essential to achieving a comprehensive understanding of the hydrological impacts associated with SFG.
In this study, a physical-based hydro-thermal model was adopted to represent a typical hillslope in Qinghai Lake Basin, China. The primary objectives are to (i) evaluate the seasonal freeze–thaw process in the SFG hillslope, (ii) examine the influence of SFG on rainfall infiltration and groundwater discharge, and (iii) investigate the effects of topographic slope on the SFG distribution and groundwater discharge. Our goal is to understand the physical processes governing hydro-thermal responses of SFG with the full complexity of actual boundary conditions in consideration.
2 Materials and methods
2.1 Study area and data
The Qinghai Lake Basin, situated between 36°15′-38°20′N latitude and 97°50′-101°20′E longitude (see Figure 1), is located on the northeastern Qinghai-Tibet Plateau (QTP). This basin spans an area of 29,661 km2, with elevations ranging from 3,265 to 5,280 m. Qinghai Lake, the largest inland saline lake in China, experiences low temperatures throughout the year. The freezing period begins from September to October and lasts until April to May of the following year. Meteorological data from stations in Gangcha, Haiyan, and Tianjun counties indicate that the mean annual temperature in the basin ranges between −1°C and 1°C (Zhang and Duan, 2021; Zhang, 2021). Precipitation is unevenly distributed, with 90–95% occurring from May to October, while winter snowfall is minimal, contributing less than 4% of the annual total. Observational data show that precipitation has fluctuated over the decades, increasing by 9 mm per decade from the 1950s to the early 1980s, then decreasing in the late 1980s, and subsequently rising by 25 mm per decade since the 1990s. The average temperature has risen significantly since the 1950s, at a rate of 0.244°C per decade (Zhang and Duan, 2021). Mountains cover over 68% of the basin, with the Buha and Shaliu Rivers, the two largest rivers, contributing more than 60% of the basin’s total runoff (Hu et al., 2022).
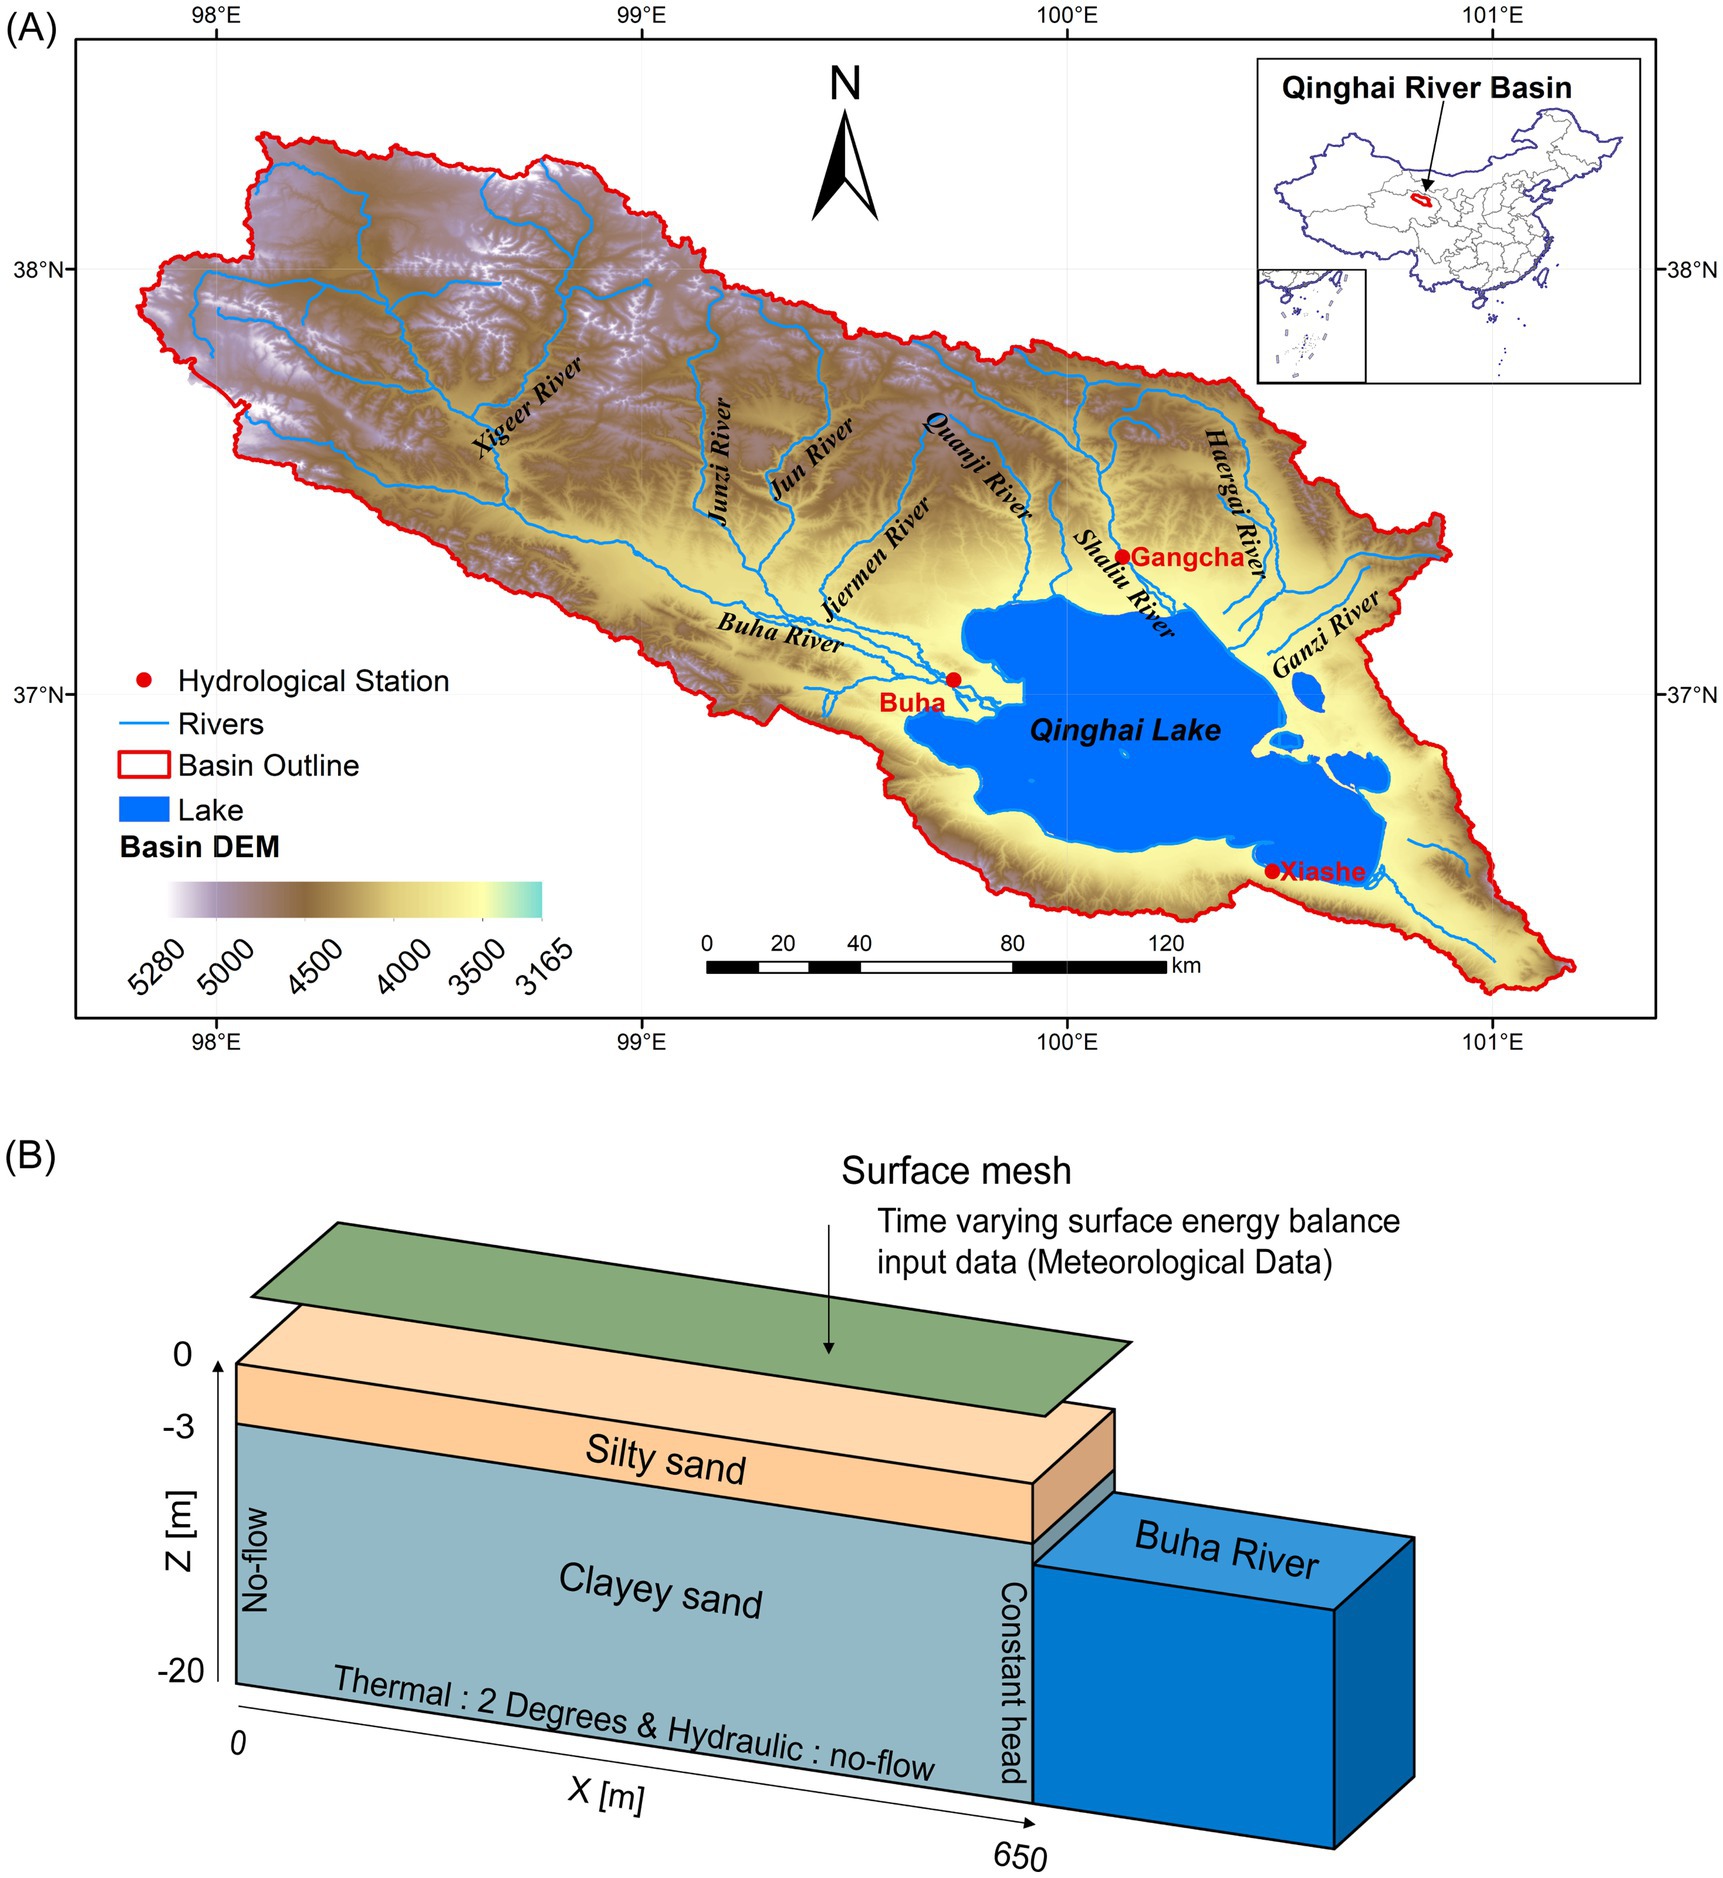
Figure 1. (A) Location of the Qinghai Lake Basin. The model was established for a cross-section adjacent to the Hydrological Station. The elevation data were obtained from the National Tibetan Plateau Data Center (http://data.tpdc.ac.cn), and the resolution of elevation data is 30 m; (B) Conceptual representation of the model domain. The orange and grey represent the two soil layers, silty sand (upper layer) and clayey sand (bottom layer). The blue represents the constant head boundary conditions on the left side and no-flow boundaries were set on the left side and at the bottom. The left and right boundaries had no specified thermal conditions, while the bottom had a constant temperature boundary. The upper boundary was constrained by meteorological data.
The meteorological data used in our study were derived from the China Meteorological Forcing Dataset (Yang et al., 2010; Kun et al., 2019; He et al., 2020). Initially, we created a one-year time series of air temperature by averaging daily temperatures from 1979 to 2000, which was used in model initialization to form a partly frozen soil as the initial condition. Subsequently, a typical-year time series for air temperature, relative humidity, wind speed, incoming shortwave radiation, and rain/snow data was generated by averaging values over 19 years (2001–2019; Supplementary Figure S1). Precipitation was classified as snow if the average air temperature was below 0°C and as rain if above 0°C. The typical-year dataset, which effectively represents seasonal variations in meteorological conditions, was employed during the spin-up process to establish a steady state for surface-subsurface hydro-thermal dynamics. Post spin-up, daily data on air temperature, relative humidity, wind speed, incoming shortwave radiation, and rain/snow from 2017 to 2019 (see Supplementary Figure S1) were used for simulations.
2.2 Groundwater flow model
2.2.1 Integrated hydrological-thermal model
The Advanced Terrestrial Simulator (ATS; Coon et al., 2019), an open-source parallel computing platform, was employed to simulate the integrated surface/subsurface and thermal (freeze–thaw) processes in this research. The subsurface thermal hydrology processes in ATS are modeled using a modified Richards equation linked to an energy transport equation, which accounts for variably saturated and frozen flow conditions (Painter et al., 2016). The phase transition water dynamics adhere to the Clausius-Clapeyron equation (Karra et al., 2014). The soil moisture retention curve in ATS follows the van Genuchten (VG) model and accounts for the effective permeability of soils that are variably saturated, considering the presence of gas and ice. Essential input data for the simulation encompass meteorological data, soil hydraulic and thermal parameters, as well as thermal and hydrologic boundary conditions.
2.2.2 Model application
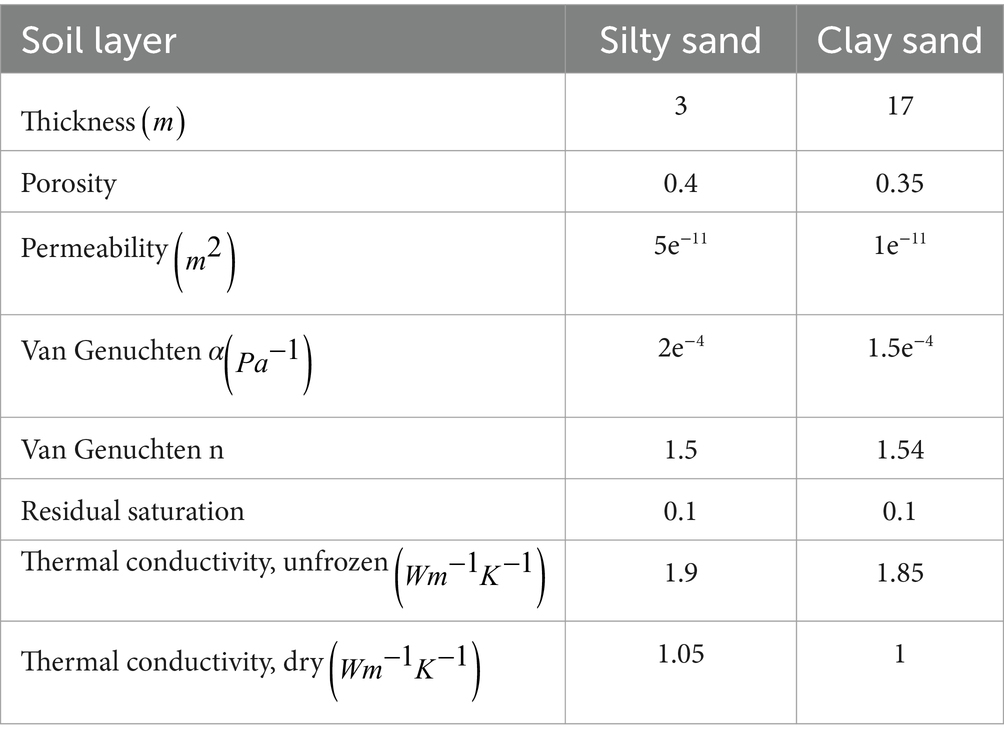
Seasonally frozen ground is widely distributed in the downstream of the Buha River, the coast of Qinghai Lake, therefore, 2D hillslope perpendicular to the Buha River was modeled (Figure 1). The simulated domain was 650 m long 20 m thick, with a hillslope of approximately 0.005 according to the 30 m resolution DEM. The cell size in the horizontal direction was 10 m. Two layers, upper silty sand layer and lower clay sand layer, were simulated in the vertical direction based on borehole data in the study site, with the vertical cell size of 0.05 m in upper 5 m and relatively large cell size of 1 m in the lower 15 m (Figure 1B; Supplementary Figure S2). The finer resolution was setting in the shallow subsurface (upper 5 m) to better describe the seasonal freeze–thaw process and hydrological dynamics. Soil thermal and hydraulic parameters (Table 1) used in this study, were taken from local samples and literature values (Zheng and Bennett, 2002; Peng and Shao, 2007; Anisimov et al., 1997).
No-flow boundary conditions were set on the left side and at the bottom side, consequently the left side is conceptually representing a no-flow water divide. A Dirichlet boundary condition with a constant head of 3.5 m, based on the averaged value of the annual river head, was set on the right side to represent a water outlet. This mimics the water exchange between groundwater and adjacent river. The temperature could become relatively constant at the deep subsurface with negligible seasonal variation (Sjöberg et al., 2021), therefore, a constant 2°C temperature was set at the bottom as a thermal boundary (Jan et al., 2020). The left and right boundaries had no specified thermal conditions. The forcing data generated in section 2.1 was set at the domain surface as the surface boundary condition to drive the model. The initialization and spin-up processes of our simulation is conducted for 20 years following the previous frozen ground hydro-thermal modeling (Painter et al., 2016; Jafarov et al., 2018; Sjöberg et al., 2021; Hamm and Frampton, 2021).
2.2.3 Model calibration
The model was calibrated against time series data for groundwater levels from April to December 2019, and subsurface soil temperatures recorded from June to December 2019. Groundwater levels were monitored daily at the study site using pressure transducers (Onset HOBO). Soil temperature data from a nearby field site around Qinghai Lake were measured at 10-min intervals using soil temperature probes buried at various depths (Li, 2020). Temperature comparisons were conducted from a shallow depth of 5 cm to a deeper layer of 200 cm, ensuring a comprehensive assessment of the entire freeze–thaw process of SFG. We use the Nash-Sutcliffe efficiency (NSE) and root mean squared error (RMSE) as performance metrics and compare them with similar studies (Gao et al., 2023; Rush and Rajaram, 2022; Rush et al., 2021; Jan et al., 2020; Evans et al., 2018) of frozen ground to demonstrate the accuracy and reliability of the model.
2.2.4 Simulation scenarios
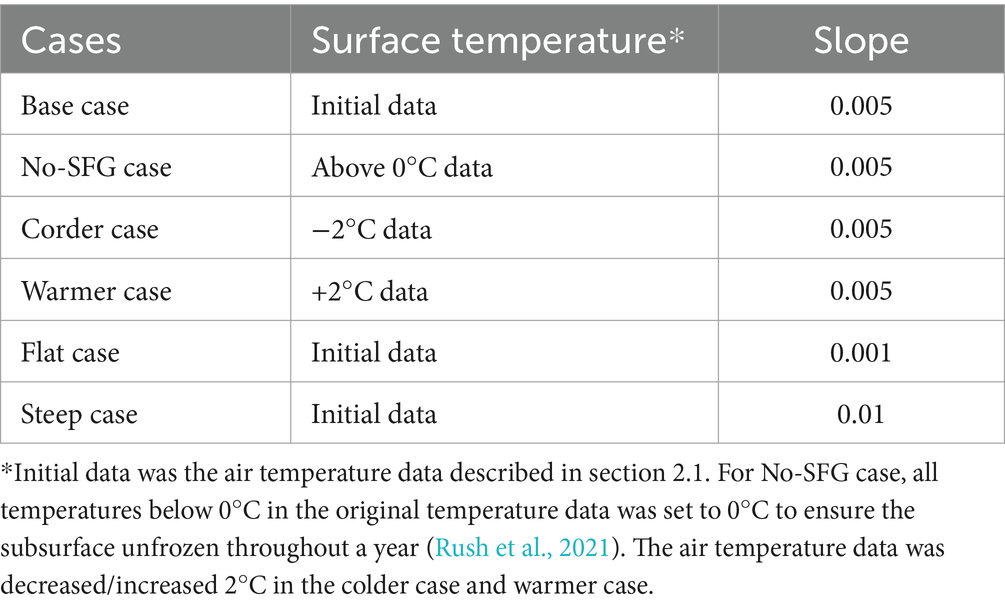
In this study, we designed multiple scenarios to understand the role of SFG in hydrological processes in Qinghai Lake Basin, particularly its influence on rainfall-dominant precipitation infiltration process and groundwater discharge. The site-specific case serves as the base case (Figure 1B; Table 2), and a No-SFG case acts as a control to analyze the impact of SFG on hydrological processes. Additionally, we included a colder case and a warmer case to assess the impacts of varying air temperatures on the duration and frozen depth of SFG and their effects on hydrological processes under climate change conditions. Finally, scenarios with different slopes, a steep case which doubles the slope (0.01), and a flat case with a small but not zero slope (0.001) to ensure the lateral flow, were designed to evaluate the impact of topographic slopes on the SFG distribution and groundwater discharge. These slope values are typical for the QTP regions (Li et al., 2023; Wang et al., 2022).The differences in model settings for these cases are shown in Table 2.
Besides, additional simulations were conducted to evaluate impact of soil permeability and thermal conductivity of the upper layer on model outcomes. For soil permeability, 10 cases were uniformly selected in the range of 1e−12 and 1e−9 m2, covering three orders of magnitude. This ensures a comprehensive evaluation of how variations in soil permeability affect model outcomes. For thermal conductivity, 10 cases were evenly distributed in the range of saturation thermal conductivity 1.70–2.15 Wm−1 K−1 (Anisimov et al., 1997) to evaluate the impact of thermal conductivity changes. Detailed parameters for specific case in the uncertainty analysis are provided in the Supplementary Table S1.
3 Results
3.1 Seasonal freeze–thaw process
Simulated groundwater levels and soil temperatures at selected depths were compared with observation data (Figure 2) to evaluate model’s accuracy in representing the real system. Overall, the simulated water table reasonably matched the observations, with a root-mean-squared-error (RMSE) of 0.51 m. The simulated soil temperatures captured the major trends of the observed temperatures at different depths, with an average RMSE of 2.25°C and a Nash-Sutcliffe Efficiency (NSE) of 0.88.
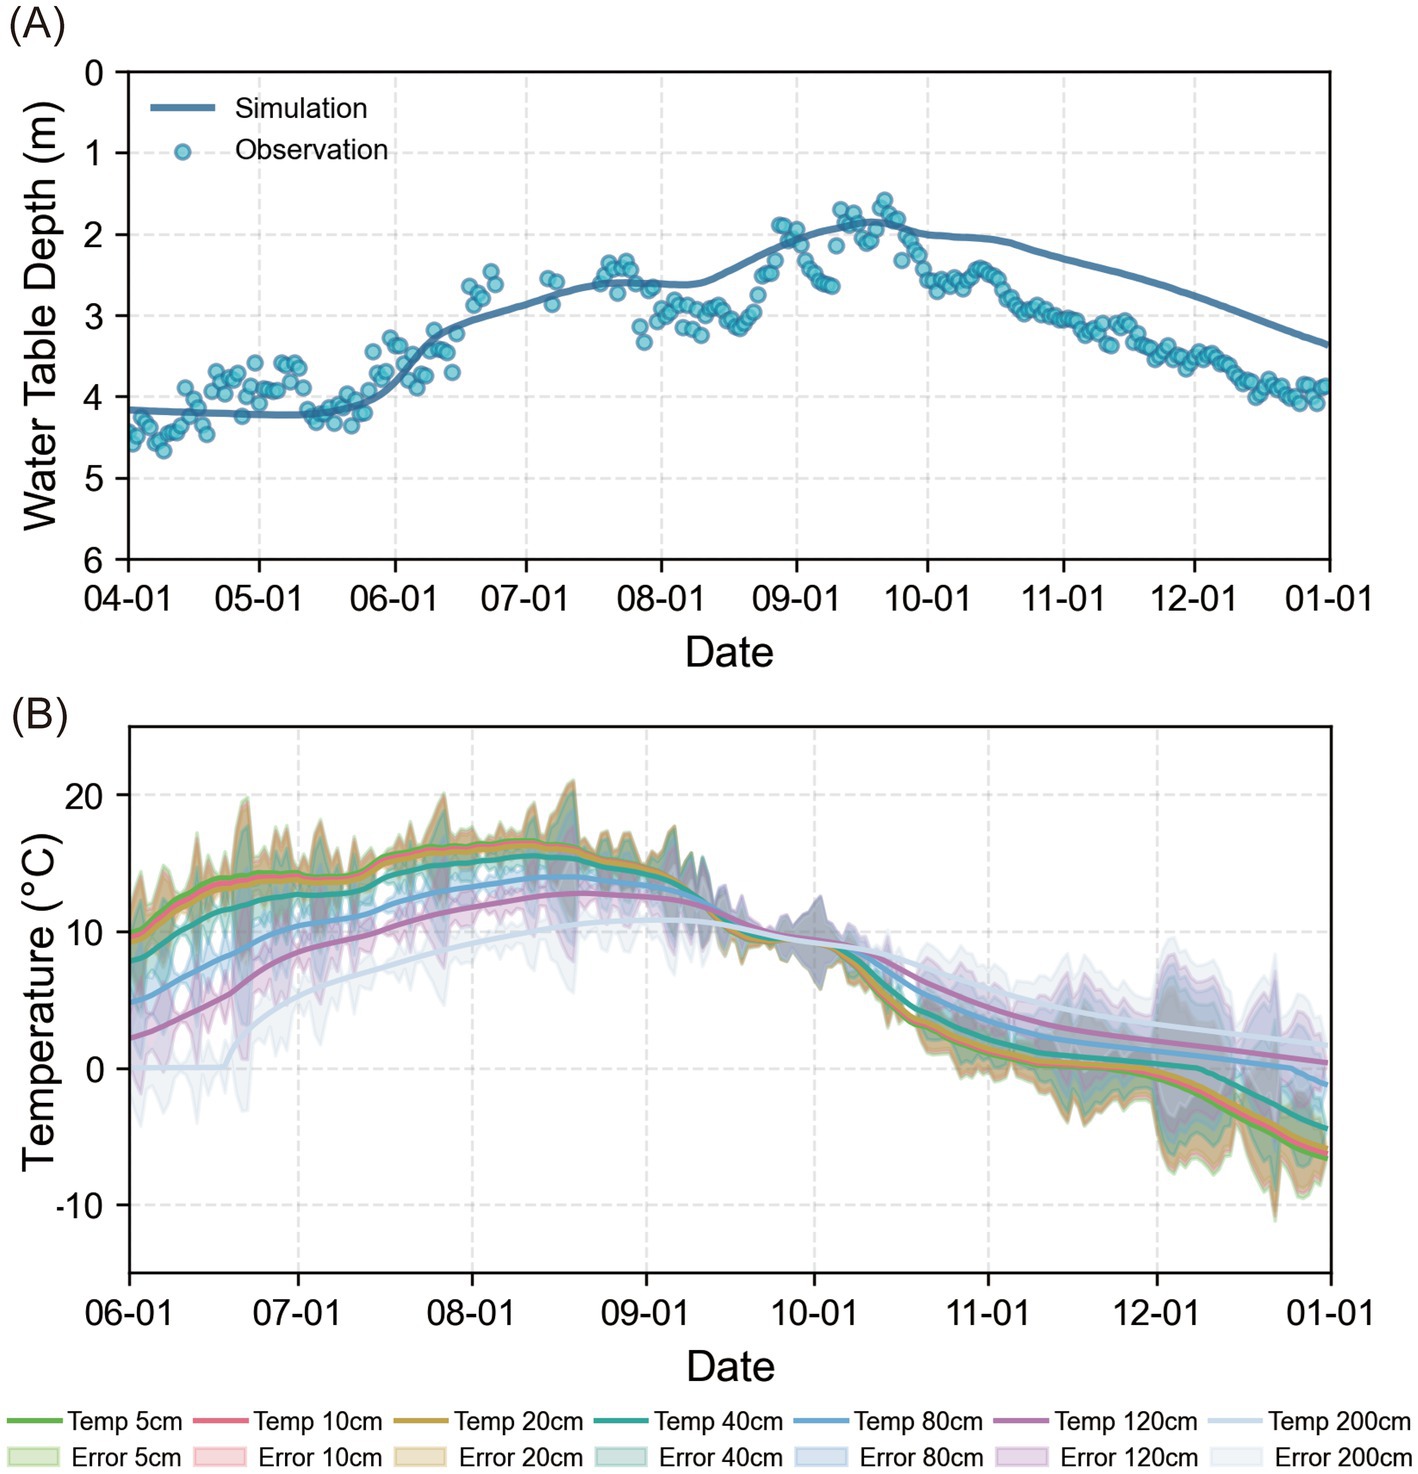
Figure 2. (A) Results of groundwater table calibration from April to December in 2019. (B) Results of soil temperature calibration from June to December in 2019. The lines represent the simulated soil temperature, while the error bars represent the difference between simulated temperature and observed temperature.
In our study, we define the frozen state of SFG using “ice saturation > 0” instead of the zero-degree isotherm, which better characterizes the physical phase transition of water during the freezing and thawing process. Soil ice saturation at six selected dates were shown in Figure 3, illustrating the seasonal freezing–thawing process throughout a year. The surface soil begins to freeze downward in early November, leading to a notable increase in ice saturation in the shallow soil by mid-November (Figure 3F). In late March, the ground is frozen to a maximum depth of approximately 2 meters (Figure 3A). During the warm season, the frozen soil begins to thaw from the surface (Figure 3B) with rapid melting of ice in the upper soil and gradual reduction of ice saturation in the lower frozen soil (Figure 3C). By early June, only minimal ice content with lower saturation remains in the downhill lower soil, and shortly after, the SFG is completely thawed (Figures 3D,E).
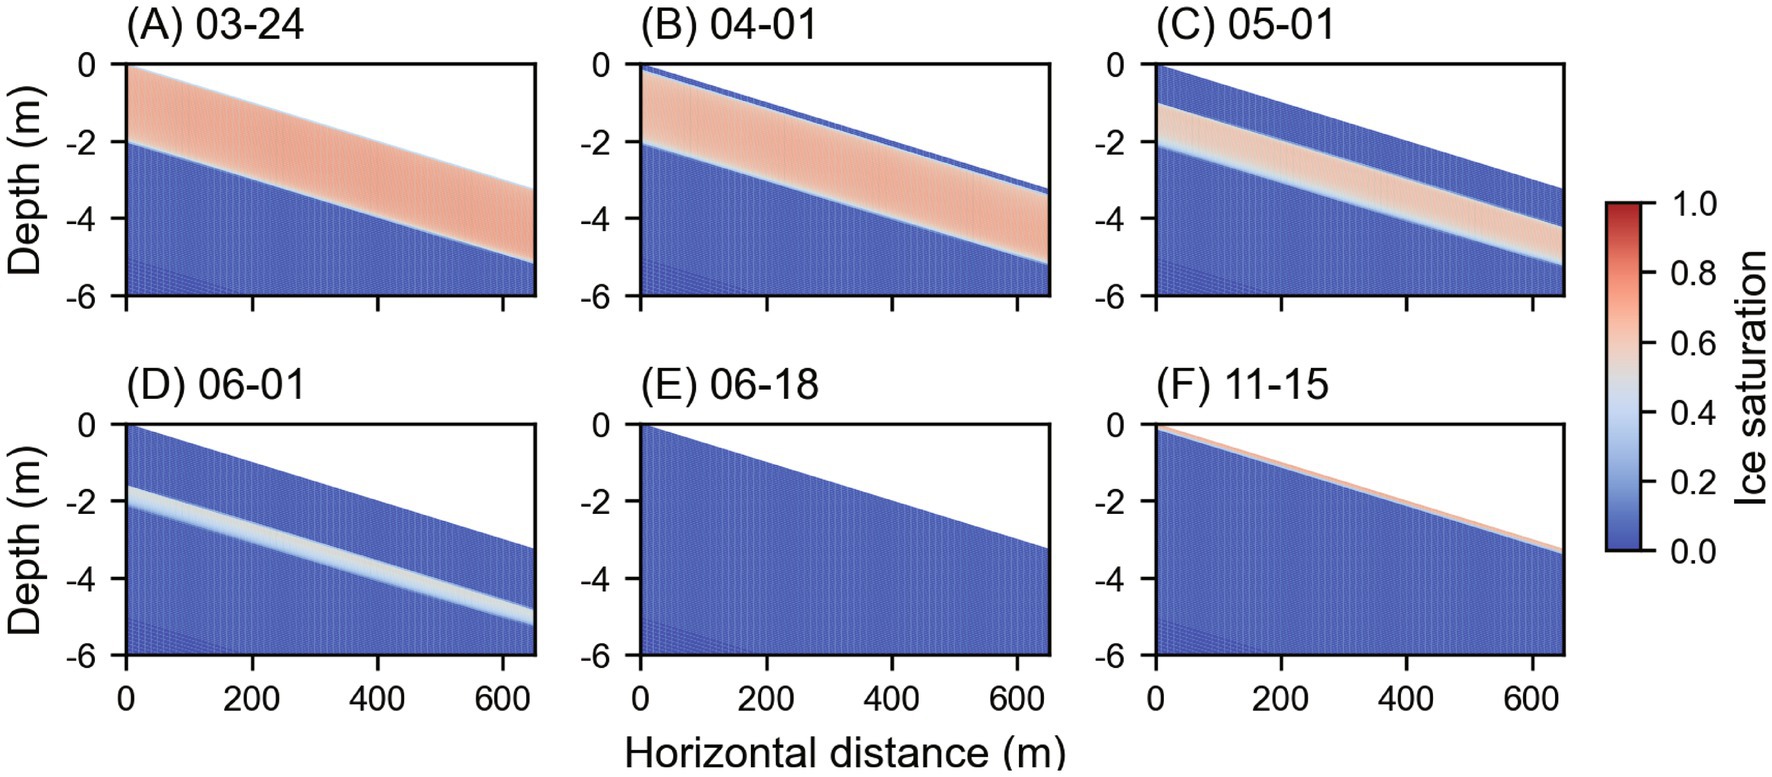
Figure 3. The soil ice saturation of the base case at 6 selected dates highlights the freeze–thaw process of SFG (A-F). The ice saturation reflects the frozen state of SFG. For visualization, only the upper 6 m of the domain is shown.
Meteorological factors, particularly air temperature, significantly impact the freeze–thaw process of frozen ground by influencing the exchange of energy and mass between the atmosphere and the surface ground. The temporal variation of the ice saturation observed near the surface in the base case negatively correlates with the changes in air temperature (Figure 4C). As the air temperature drops below zero in November, soil water begins to freeze into ice, increasing ice saturation. This freezing process continues throughout winter, with ice saturation spreading downward. When the temperature rises above zero in late March, the soil ice starts to melt and eventually disappears completely in June.
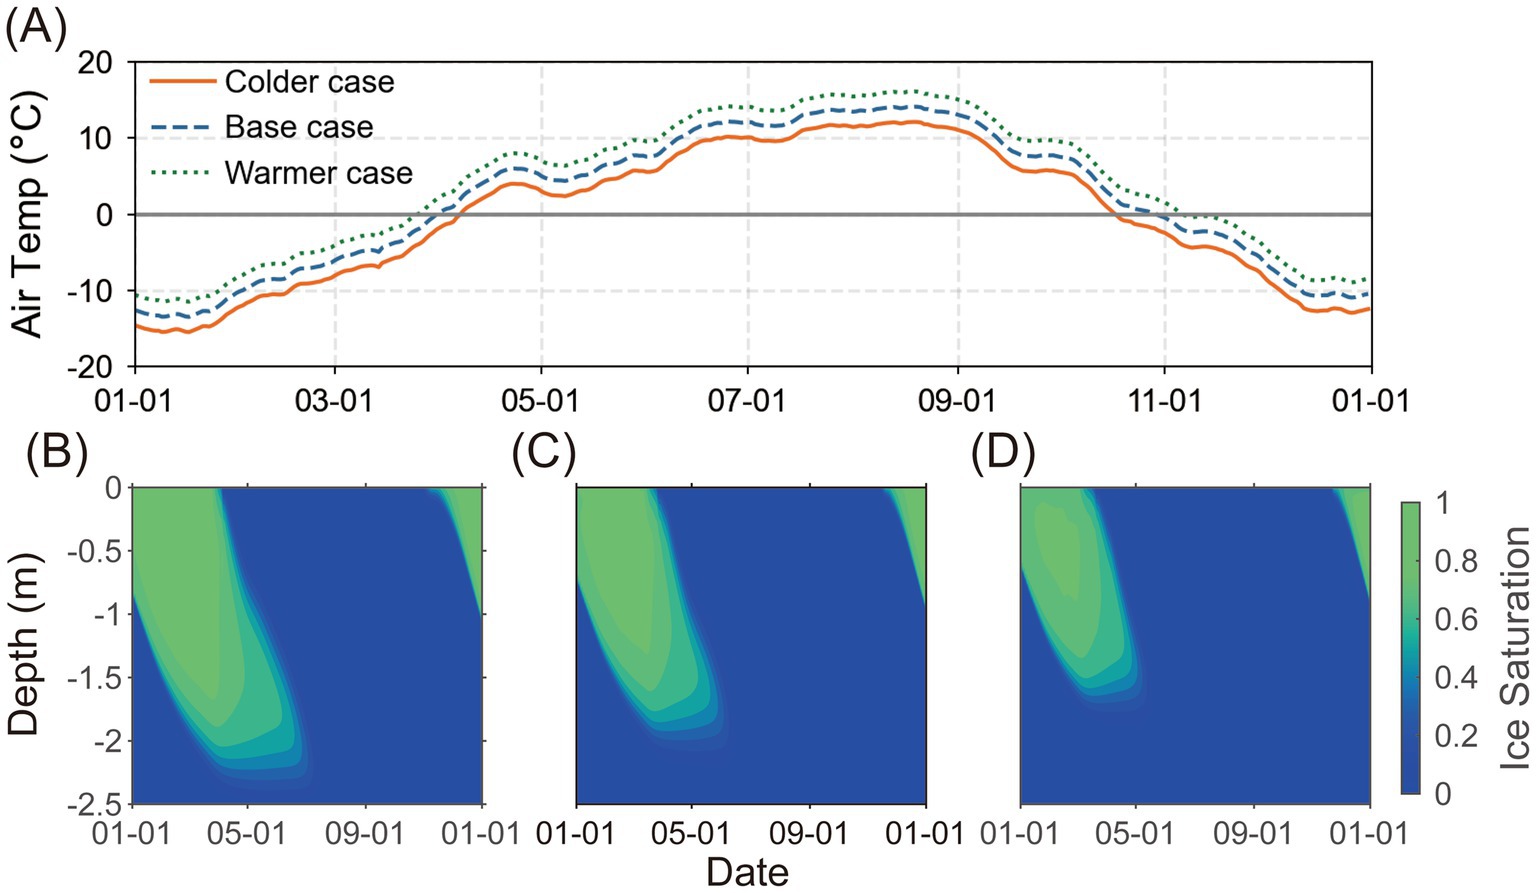
Figure 4. Daily air temperature (A), temporal and spatial variations of the modeled ice saturation of the colder case (B), the base case (C), and the warmer case (D), respectively.
Changes in annual temperature also influences the freezing depth and duration of SFG, as illustrated in Figure 4. The colder case demonstrates a deeper freezing depth (approximately 2.35 meters) and a longer duration (from late October to mid-July). In contrast, the warmer case shows a shallower freezing depth (around 1.7 meters) and a shorter duration (from early November to mid-May). The impact of these variations in freezing depth and duration on hydrological processes will be discussed in the following section.
3.2 SFG influences on infiltration and groundwater flow
The influence of SFG on rainfall infiltration and groundwater flow is evaluated by comparing the simulated liquid saturation at selected depths and groundwater discharge among four scenarios: the base case, colder case, warmer case and the No-SFG case. In the No-SFG case, fluctuations in liquid saturation correspond to rainfall in both shallow and deep soil (dashed lines in Figure 5). In contrast, in the base case, variations in liquid saturation at different depths are closely related to the freeze–thaw process of SFG. The sudden increase in liquid saturation observed in April is due to the phase transition from ice to liquid as the shallow soil thawed. Consequently, rainwater infiltrates the shallow soil, causing liquid saturation to vary according to the rainfall trend from May (blue lines in Figures 5A,B). However, remaining SFG in the deep soil hinders the infiltration process, preventing rainwater from infiltrating the deeper soil until the deep SFG thaws in June, allowing rainfall to start recharging groundwater (blue lines in Figures 5C,D). These effects vary for colder and warmer cases due to different freezing depths and durations of SFG. In the warmer case, deep soil SFG thaws in May, allowing rainwater to infiltrate and recharge groundwater earlier. In the colder case, SFG has a stronger and more prolonged influence on rainfall infiltration due to longer freezing duration in deep soil, delaying rainwater infiltration and groundwater recharge until July (Figures 5C,D).
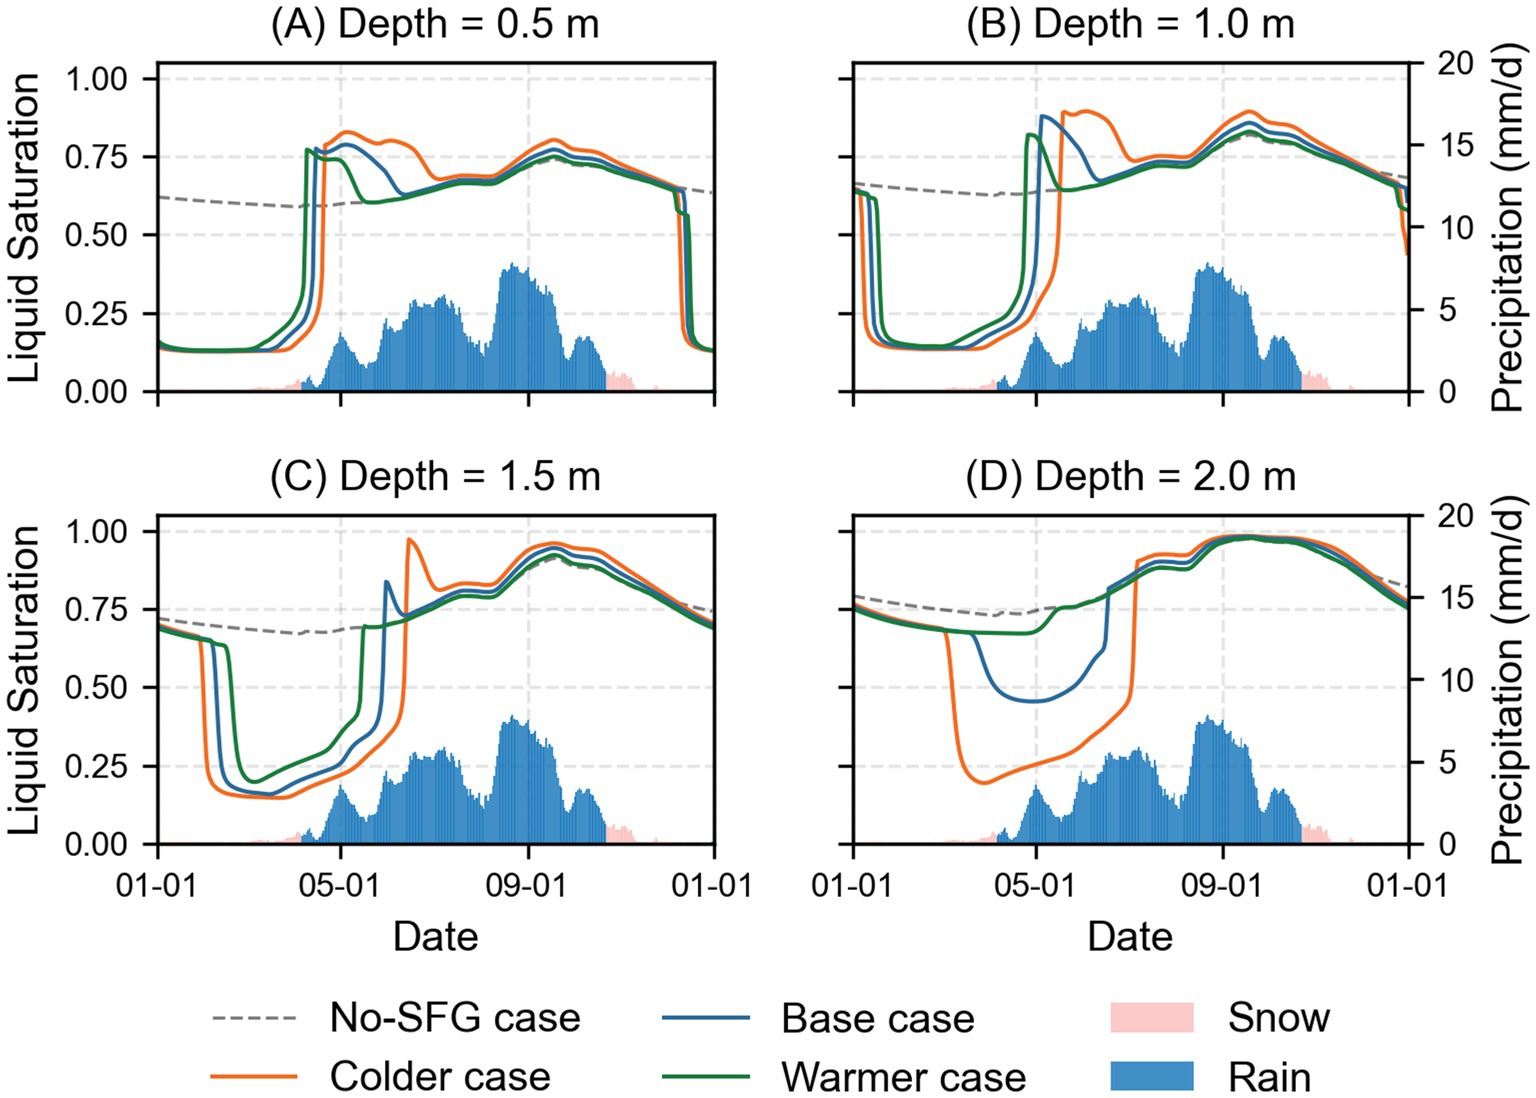
Figure 5. Simulated daily liquid saturation at four selected depths in three cases and daily precipitation (A-D). The blue, orange and green lines represent the simulation results of the base case, colder case, and warmer case, respectively.
The groundwater discharges measured at the downgradient outlet for the four cases are shown in Figure 6. In the No-SFG case, groundwater discharge variations closely follow rainfall patterns, with peaks and valleys corresponding to rainfall events. In the base case, residual SFG in deep soil initially obstructs rainwater infiltration, delaying groundwater recharge. Consequently, the increase in groundwater discharge occurs later than the early rainfall events and gradually reaches the first discharge peak as deep soil thaws in early June, approximately 2 months later than in the No-SFG case. The presence of SFG also causes rainwater to accumulate above the frozen layer, leading to a higher peak discharge once the SFG completely thaws. Additionally, as soil water freezes into ice from early November, reducing infiltration and subsequent groundwater recharge, groundwater discharge declines more rapidly. This decline is more pronounced compared to the No-SFG case. The arrival time of the first groundwater discharge peak and its magnitude also vary for the colder and warmer cases due to differences in SFG duration. In the colder case, the peak is delayed until late June and has the largest discharge among all cases, while in the warmer case, the peak occurs earlier in early May with a smaller discharge.
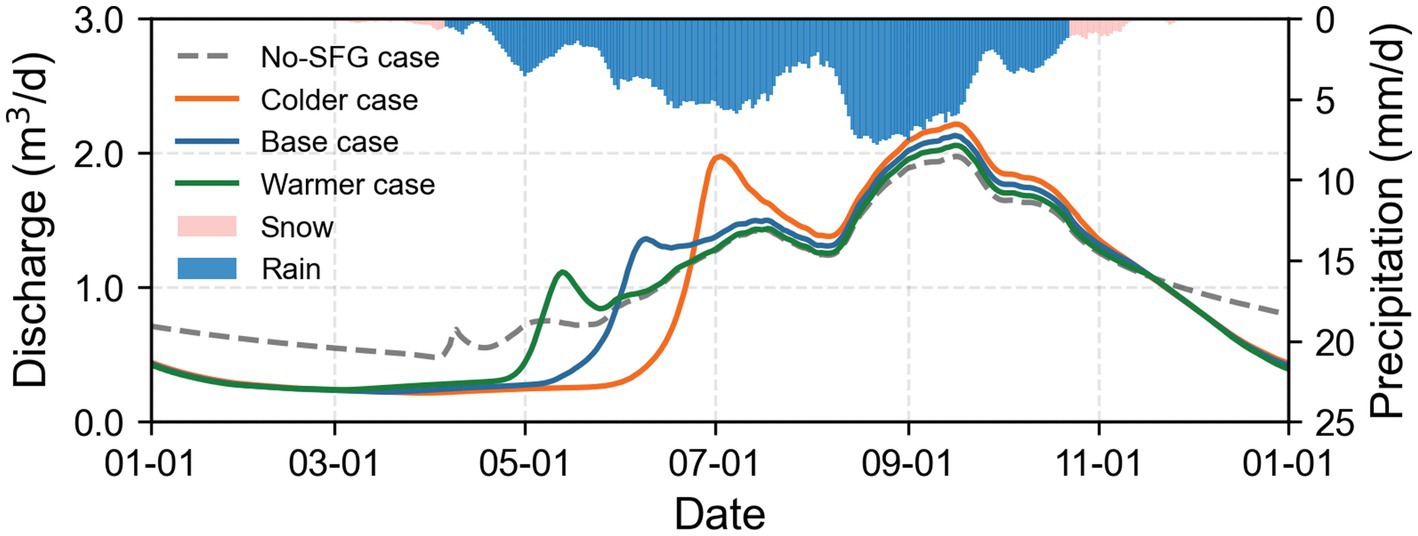
Figure 6. Groundwater discharge through the downhill side outlet of four cases and daily precipitation.
3.3 Topographic influences on SFG distribution and groundwater discharge
We simulated a steep case and a flat case to examine the effects on SFG distribution and groundwater flow. During warm periods, gravitational forces drive water flow from the uphill to the downhill, discharging into rivers via outlets on the downhill side. As a result, liquid saturation on the uphill decreases with increasing slope (Figure 7A). This also leads to decreased ice saturation on the uphill in the frozen period due to phase changes (Figure 7B). Consequently, the uphill side of the hillslope exhibits a decrease in liquid saturation in summer and ice saturation in winter with increasing slope, along with an increase in gas saturation (Figure 7C). Conversely, there is almost no difference in three-phase saturation on the downhill side as shown by the overlapping curves among three cases due to more significant flow exchange controlled by outlet boundary. The difference in ice saturation caused by gravity flow decreases along the hillslope. The greatest difference observed on the uphill side, gradually diminishing downgradient, and becoming negligible at the downhill side (Figure 8).
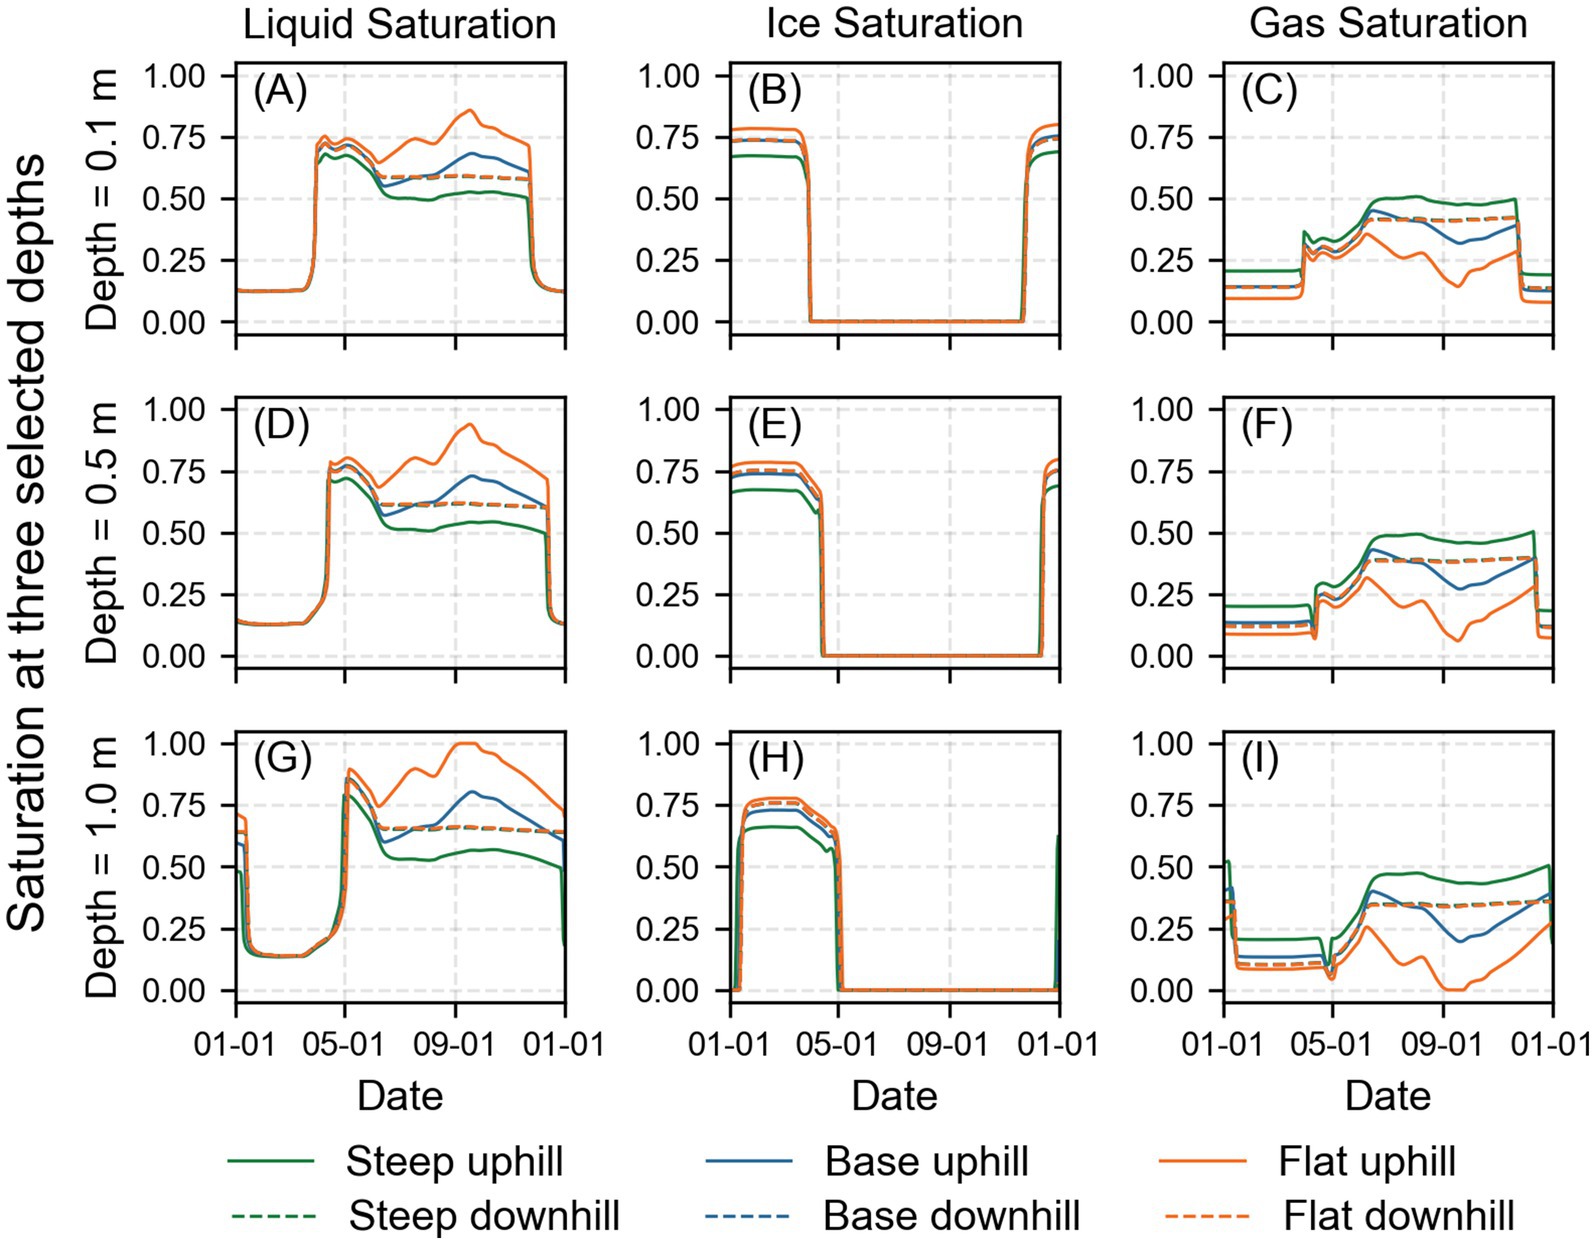
Figure 7. Simulated daily liquid (A,D,G), ice (B,E,H), and gas saturation (C,F,I) at three depths, 0.2 m, 0.5 m, and 1 m below ground surface. Different colors indicate three slopes, respectively. The solid line represents results for the uphill side and the dashed line represents the downhill side. Saturation curves for downhill side of three cases are overlapped.
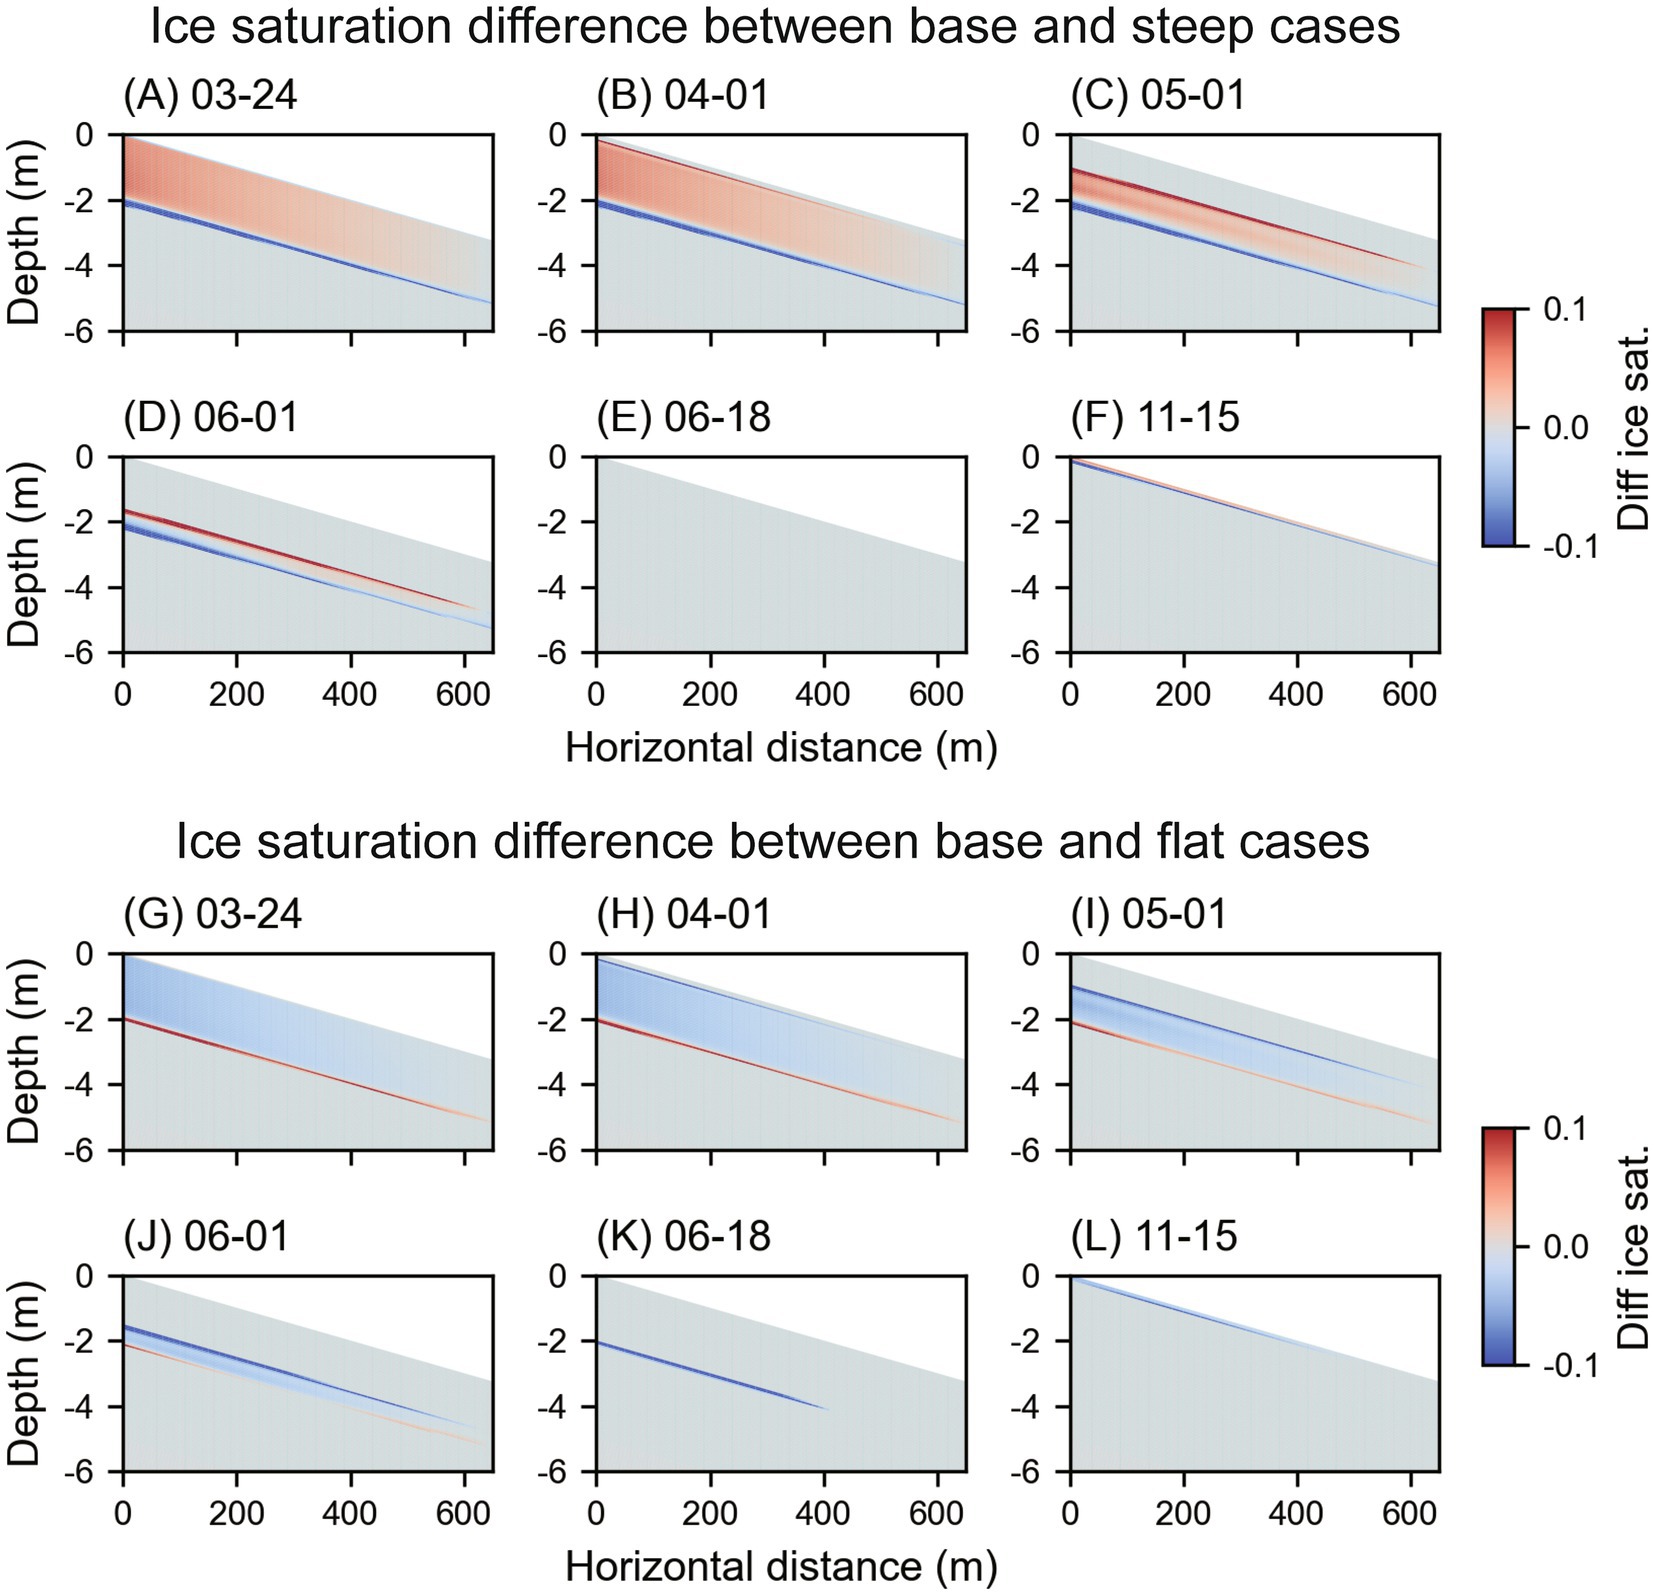
Figure 8. Ice saturation difference between (A–F) the base and the steep case and (G–L) the base and the flat case at six selected dates highlighting the freeze–thaw process, red colors represent higher ice saturation in the base case, while the blue colors represent lower ice saturation in the base case. (For better visualization, only the upper 6 m of the domain is shown).
The steep hillslope results in less liquid saturation in the summer and ice saturation in the winter due to gravitational water flow. This leads to lower heat capacity in the steep case compared to the base case and the flat case. This effect is most obvious on the uphill slope and disappears gradually on the downhill slope. Lower heat capacity allows the freezing process to penetrate deeper in the steep case, resulting in a 5 cm increase in ice saturation distribution depth on average (Figures 8A–D), whereas the flat case shows a 5 cm decrease in ice saturation distribution (Figures 8G–J).
The simulated groundwater discharge and evapotranspiration for three different slope cases are shown in Figure 9. Variations in topographic slopes significantly influence evapotranspiration, which in turn affects groundwater discharge. The least evapotranspiration and the highest groundwater discharge are obtained for steep case, whereas the flat slope case shows the highest evapotranspiration and the lowest groundwater discharge. The variation in slope significantly influences both lateral and vertical soil water flow. As slope increases, increased hydraulic gradient accelerate groundwater movement downhill, reducing groundwater storage and leading to a decline in groundwater levels in uphill (Supplementary Figure S3A). During the later thawing period in steep case, the moisture gradient above and below the remaining ice-containing soil intensifies, enhancing vertical rainwater infiltration (Supplementary Figure S3B). Despite the deeper ice distribution in the steep case, this enhanced infiltration reduces its overall impact, resulting in only a slight delay in groundwater flow. Peak groundwater discharge occurs 3 days later in steep case compared to flat case.
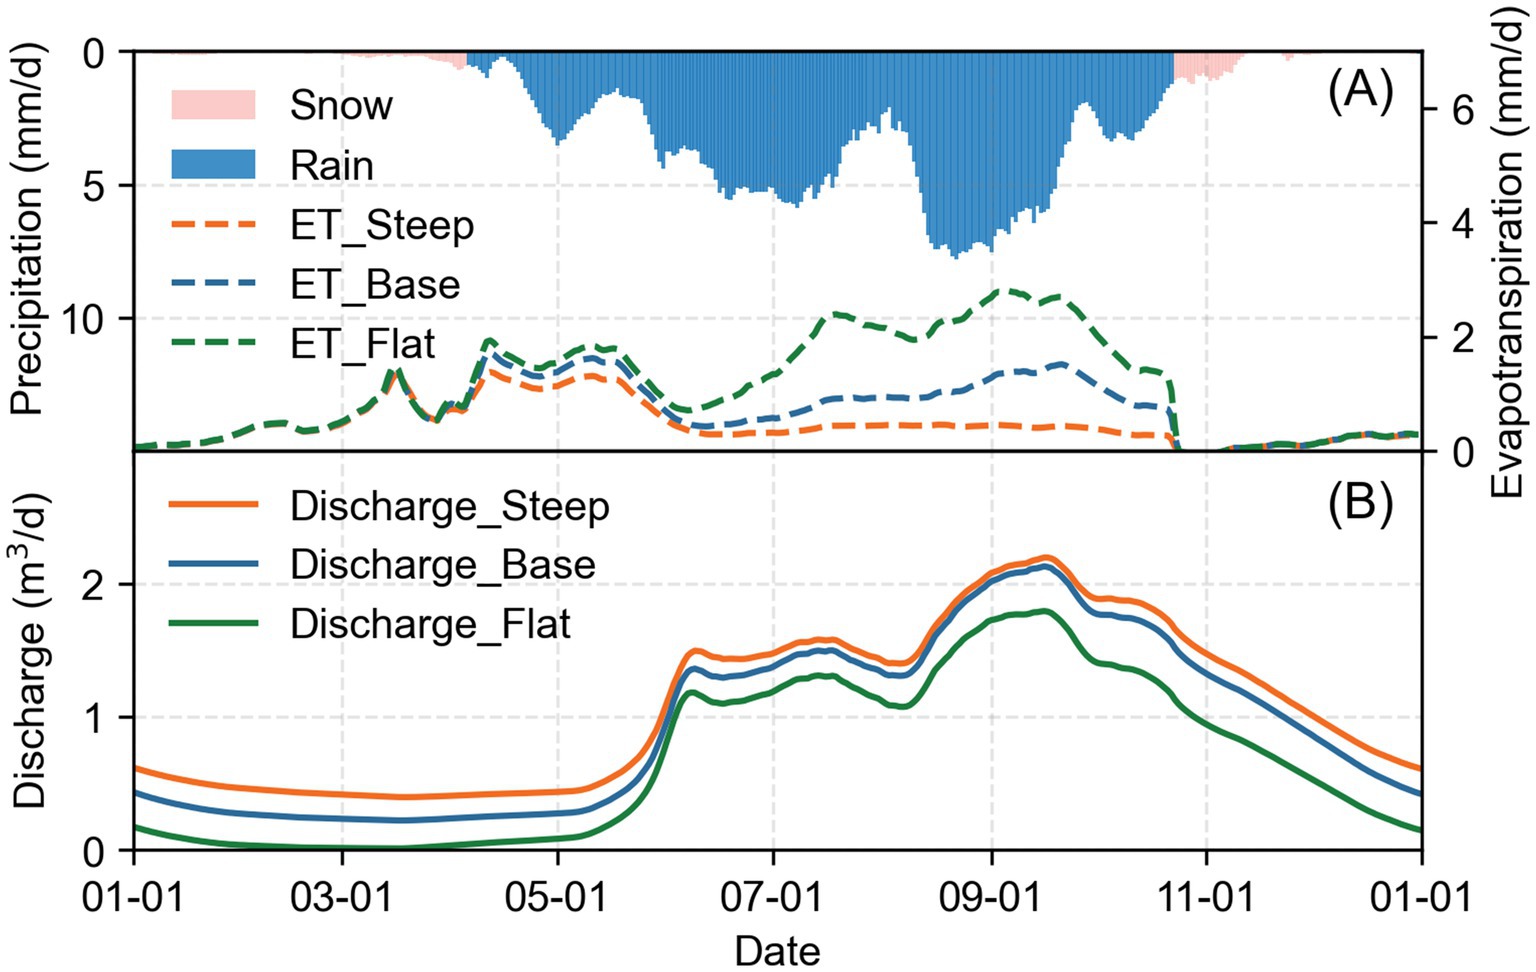
Figure 9. Evapotranspiration (ET) of three slope cases and daily precipitation (A). Groundwater discharge through the downhill side outlet of three slope cases (B).
4 Discussion
4.1 Hydrological influence of SFG
SFG significantly influences hydrological processes by affecting rainfall infiltration and groundwater discharge in QLB. In winter, as the soil freezes downward, infiltration gradually decreases, leading to a reduction in groundwater discharge (Figure 10A). When rainfall begins, the shallow soil thaws, but rainwater infiltration is hindered by the remaining SFG in the deeper soil layers, obstructing groundwater recharge during the early rainy season (Figure 10B). Once the soil completely thaws, rainwater recharges the groundwater, resulting in increased groundwater discharge (Figure 10C). Our results align with previous studies, showing that the dynamic changes in groundwater level and discharge due to freeze–thaw processes are widespread in SFG regions (Zheng et al., 2023; Lyu et al., 2023). These changes are primarily driven by variations in the recharge from the unsaturated zone to the groundwater aquifer influenced by the freeze–thaw cycle.
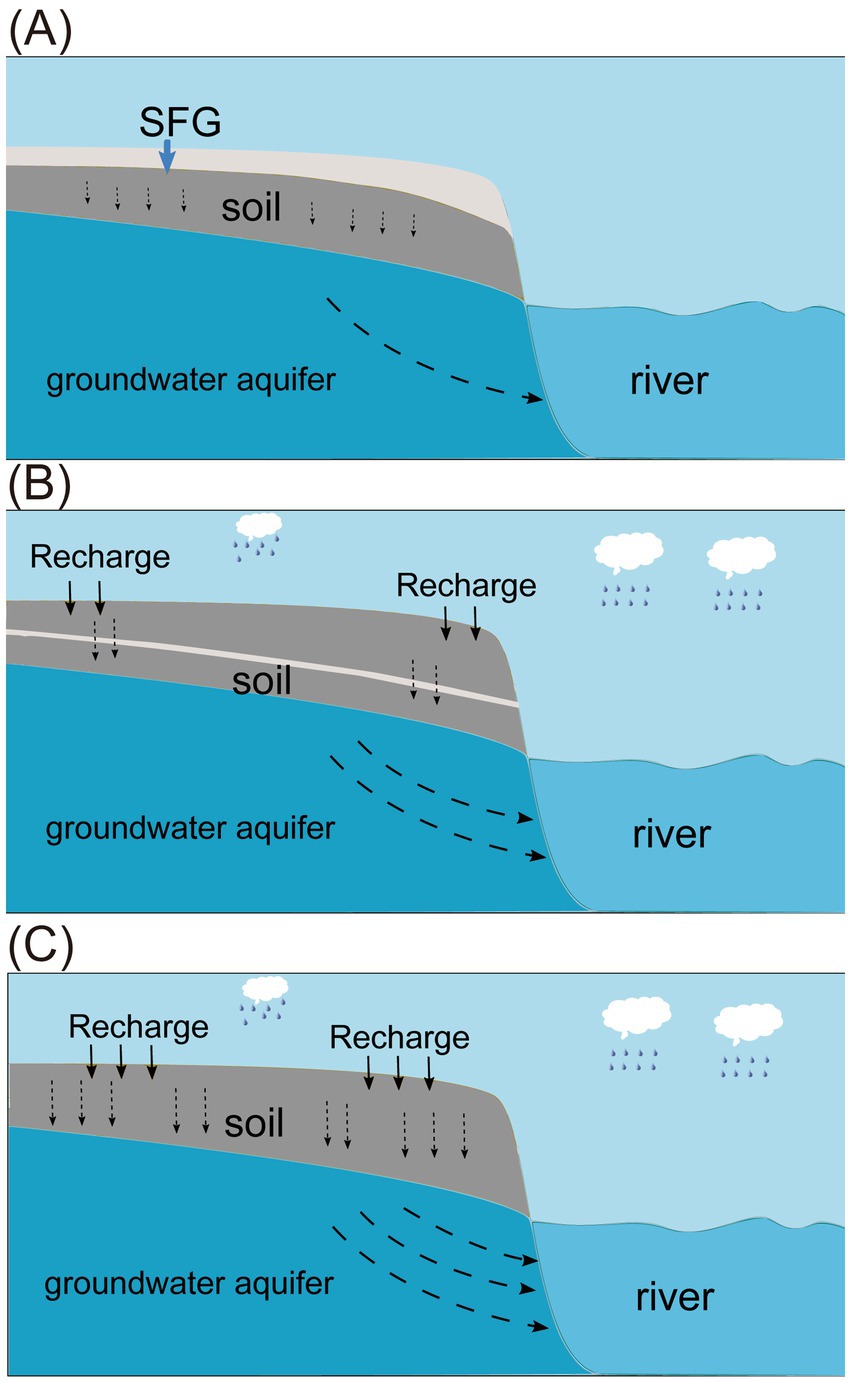
Figure 10. The freeze–thaw process and variation of groundwater flow in SFG. (A) Soil freezing downward and the infiltration was gradually decreased, the groundwater discharge decreased. (B) The shallow soil was thawed when the rainfall began, rainwater was hindered by the remaining SFG in the deep soil. (C) The soil was thawed, the groundwater was recharged by the rainwater, and the groundwater discharge increased.
The hydrological processes show unique characteristics compared to previous studies in Arctic and subarctic regions, where snowfall dominates annual precipitation (Evans et al., 2018; Appels et al., 2018; Wu et al., 2016). These differences arise from variations in the distribution of rain and snow, as well as snowpack conditions, driven by different precipitation patterns. Snow, with its low thermal conductivity, acts as thermal insulation, significantly affecting the ground energy balance. Typically, snow cover thickness inversely correlates with the depth and duration of frozen ground; thus, a thick snowpack can reduce or even prevent the development of frozen ground, even when air temperatures are below freezing (Iwata et al., 2018; Wang and Chen, 2024; Iwata et al., 2011). Consequently, regions with substantial snowpack often report minor or negligible hydrological effects from SFG (Rush et al., 2021; Rey et al., 2021). In contrast, in the QLB, summer rainfall dominates precipitation, resulting in a negligible snowpack. As a result, the freeze–thaw process of SFG is primarily controlled by air temperature, without snow influence.
Moreover, in regions with abundant snowfall, the main influence of SFG is during the spring snowmelt season, where a large amount of meltwater contributes to surface runoff, with less affecting groundwater discharge (Chang et al., 2018; Evans et al., 2018). Our study emphasizes the impact of SFG on groundwater recharge and discharge in the summer rainfall-dominant regions like QLB. In the early rainfall period, while the upper soil thaws, SFG in the deeper soil obstructs rainwater infiltration, delaying groundwater recharge and causing a two-month delay in the peak of groundwater discharge.
4.2 Climate warming weakens the hydrological effect of the SFG
SFG exhibits a strong response to climate warming, including a reduction in maximum freezing depth and an extension of the thawing duration (Song et al., 2022; Peng et al., 2017). A primary influence of air temperature on the SFG freeze–thaw process was reported while snow cover partially affects this process (Wang and Chen, 2024; Peng et al., 2017). The freeze–thaw process of SFG in QLB is dominated by air temperature, as the influence of snow cover is negligible. In warmer case, the maximum SFG depth decreases by 0.65 meters, and the freezing period shortens by about 2 months compared to the colder case. Consequently, the impact of SFG on groundwater recharge and discharge diminishes significantly with a warming climate. In the colder case, the groundwater discharge peak is delayed by approximately 3 months, but this delay is reduced to 1 month in warmer case due to less overlap between the deep freeze period and the rainfall season. In the warmer case, rainfall begins in mid-April, and SFG thaws completely by mid-May, allowing minimal time for SFG to hinder rainfall infiltration. Thus, SFG has a limited effect on the groundwater recharge and discharge processes. Under predicted future climate warming, the freezing depth and period of SFG will further decrease (Zou et al., 2017; Song et al., 2022; Ji et al., 2020). Once the deeper frozen soil melts completely before the rainy season, the differences in rainfall infiltration and groundwater recharge and discharge processes can be essentially ignored.
Our results suggest that SFG can delay and reduce groundwater discharge, with significant variations observed under different climate scenarios and influenced by topographic slope. These results have critical implications for water resource management in regions such as QLB. The delay in peak groundwater discharge and the reduction in winter discharge significantly impact the spatial and temporal distribution of groundwater outflow. As a vital source of recharge for surface water bodies such as rivers and lakes, seasonal variations in groundwater discharge can affect surface water flow and volume (Rosenberry et al., 2015; Sebestyen et al., 2008; Abdelhalim et al., 2020). Therefore, water resource management must consider the effects of freeze–thaw processes and reassess the availability and allocation strategies. This may influence the operational planning of reservoirs, hydropower plants, and the scheduling of water use for agricultural irrigation.
4.3 Sensitivity analysis
Simulations with changed soil permeability and thermal conductivity were set to access the sensitivity of model output to the input data. For soil permeability, as soil permeability increases, the timing of groundwater discharge growth during the thawing period shifts earlier and becomes more gradual (Supplementary Figure S4A). For instance, in the k1 case, groundwater discharge starts to increase sharply in June, with the first peak occurring in mid-June. As permeability reaches k7, noticeable discharge growth begins in May, with the first peak advancing to early June, approximately half a month earlier. Starting from k8, this trend is more pronounced, with discharge growth initiating in late March, and the initial peak is disappeared on the groundwater discharge curve. This phenomenon arises because increased soil permeability enhances water flow, gradually reducing the obstructive effect of diminishing ground ice during the thawing period. In high-permeability soils, water can move more readily through ice-containing layers, recharging the groundwater aquifer more quickly and at an earlier stage, thereby advancing the increase of groundwater discharge.
Soil thermal conductivity significantly impacts the freeze–thaw processes. Higher thermal conductivity enables soil to freeze more deeply in winter and accelerates the thawing process in warmer months. As thermal conductivity increases, the timing of soil thawing advances, leading to an earlier increase of groundwater discharge (Supplementary Figure S4B). For instance, the timing of the first groundwater discharge peak is advanced about 1 week from the low thermal conductivity case (th1) the high thermal conductivity case (th10).
4.4 Limitations
The simulation results demonstrate that air temperature and slope variations significantly influence freeze–thaw dynamics and groundwater discharge. Due to the limited range of temperature and slope values derived from available datasets, the input data may reflect averaged local conditions, which can introduce uncertainty into the model. This averaging effect may mask finer variations and limit the model’s accuracy in simulating local-scale processes. Additionally, soil permeability and thermal conductivity were identified as important parameters impacting outcomes. Given the assumption of two homogeneous soil layers in this study, accounting for soil heterogeneity in future work could further refine the model and improve its predictive accuracy.
Additionally, a 2D hillslope-scale model was employed. While the model captures freeze–thaw cycles and groundwater flow dynamics on a two-dimensional slope, the results cannot be directly extrapolated to a catchment scale due to the simplified geometry and limited hydrological processes. A 3D model would more effectively account for complex topography and better depict the intricate water exchanges between groundwater and surface water influenced by SFG at large scale. Currently, catchment-scale applications of physically-based thermal-hydrology models in SFG regions are scarce, largely due to data limitations and the challenges of modeling freeze–thaw processes at larger scales. Addressing these challenges is a key focus of our future research plans.
5 Conclusion
A coupled surface-subsurface 2D hillslope model, fully considering the hydro-thermal processes, was built to simulate the freeze–thaw process of SFG and the associated variations in groundwater discharge. Two main conclusions can be drawn:
1. The freeze–thaw process of SFG significantly modulate rainfall infiltration and groundwater discharge dynamics by reducing infiltration during winter, hindering recharge in early rainy seasons, and increasing groundwater discharge once the soil completely thaws. The peak of groundwater discharge is delayed by about 2 months and exhibits a higher peak discharge compared to the scenario with SFG absent.
2. Climate change and topographic slope substantially affect freeze–thaw cycles and groundwater discharge. In the colder scenario, groundwater discharge peak is delayed by approximately 3 months with a 0.35 m increase in SFG depth. Whereas, in the warmer case, the delay is reduced to 1 month with a 0.3 m decrease in SFG depth. Additionally, in the steep case, SFG depth increases by 0.1 m, causing a three-day delay in the groundwater discharge peak compared to the flat case.
This study highlights the significant influences of SFG on rainfall infiltration process and groundwater discharge in region where the precipitation is dominated by summer rainfall. These insights provide a foundation for more accurate hydrological research and inform strategies for sustainable water management in SFG regions, offering valuable perspectives on the hydro-ecological responses to climate variability and change.
Data availability statement
The raw data supporting the conclusions of this article will be made available by the authors, without undue reservation.
Author contributions
CD: Investigation, Methodology, Visualization, Writing – original draft. ZG: Conceptualization, Supervision, Writing – review & editing. KC: Conceptualization, Supervision, Writing – review & editing. LF: Writing – review & editing. YZ: Investigation, Writing – review & editing. XK: Writing – review & editing. BC: Writing – review & editing. CZ: Writing – review & editing.
Funding
The author(s) declare that financial support was received for the research, authorship, and/or publication of this article. This research was supported by the National Natural Science Foundation of China (92047202), Guangdong Provincial Key Laboratory of Soil and Groundwater Pollution Control (2023B1212060002), High level university special funds (G03050K001), and Center for Computational Science and Engineering of Southern University of Science and Technology.
Acknowledgments
The authors thank the Guangdong Provincial Key Laboratory of Soil and Groundwater Pollution Control (2023B1212060002) and Center for Computational Science and Engineering of Southern University of Science and Technology.
Conflict of interest
The authors declare that the research was conducted in the absence of any commercial or financial relationships that could be construed as a potential conflict of interest.
Publisher’s note
All claims expressed in this article are solely those of the authors and do not necessarily represent those of their affiliated organizations, or those of the publisher, the editors and the reviewers. Any product that may be evaluated in this article, or claim that may be made by its manufacturer, is not guaranteed or endorsed by the publisher.
Supplementary material
The Supplementary material for this article can be found online at: https://www.frontiersin.org/articles/10.3389/frwa.2024.1495763/full#supplementary-material
References
Abdelhalim, A., Sefelnasr, A., and Ismail, E. (2020). Response of the interaction between surface water and groundwater to climate change and proposed megastructure. J. Afr. Earth Sci. 162:103723. doi: 10.1016/j.jafrearsci.2019.103723
Ala-Aho, P., Autio, A., Bhattacharjee, J., Isokangas, E., Kujala, K., Marttila, H., et al. (2021). What conditions favor the influence of seasonally frozen ground on hydrological partitioning? A systematic review. Environ. Res. Lett. 16:43008. doi: 10.1088/1748-9326/abe82c
Anisimov, O. A., Shiklomanov, N. I., and Nelson, F. E. (1997). Global warming and active-layer thickness: results from transient general circulation models. Glob. Planet. Chang. 15, 61–77. doi: 10.1016/S0921-8181(97)00009-X
Appels, W. M., Coles, A. E., and Mcdonnell, J. J. (2018). Infiltration into frozen soil: from core-scale dynamics to hillslope-scale connectivity. Hydrol. Process. 32, 66–79. doi: 10.1002/hyp.11399
Cao, W., Sheng, Y., Wu, J., and Peng, E. (2021). Soil moisture infiltration characteristics of different types of frozen soil in the source area of the Yellow River. Acta Ecol. Sin. 41, 655–664. doi: 10.5846/stxb201903150491
Chang, Q., Ma, R., Sun, Z., Zhou, A., Hu, Y., and Liu, Y. (2018). Using isotopic and geochemical tracers to determine the contribution of glacier-snow meltwater to streamflow in a partly Glacierized alpine-gorge catchment in northeastern Qinghai-Tibet plateau. J. Geophys. Res. Atmos. 123, 10,037–10,056. doi: 10.1029/2018JD028683
Chen, K., Guo, Z., Zhan, Y., Roden, E. E., and Zheng, C. (2024). Heterogeneity in permeability and particulate organic carbon content controls the redox condition of riverbed sediments at different timescales. Geophys. Res. Lett. 51:e2023gl107761. doi: 10.1029/2023GL107761
Chen, R., Liu, J., Kang, E., Yang, Y., Han, C., Liu, Z., et al. (2015). Precipitation measurement intercomparison in the Qilian Mountains, north-eastern Tibetan plateau. Cryosphere 9, 1995–2008. doi: 10.5194/tc-9-1995-2015
Chen, K., Yang, S., Roden, E. E., Chen, X., Chang, K.-Y., Guo, Z., et al. (2023). Influence of vertical hydrologic exchange flow, channel flow, and biogeochemical kinetics on Ch4 emissions from Rivers. Water Resour. Res. 59:e2023wr035341. doi: 10.1029/2023WR035341
Cheng, G., and Jin, H. (2013). Permafrost and groundwater on the Qinghai-Tibet plateau and in Northeast China. Hydrogeol. J. 21, 5–23. doi: 10.1007/s10040-012-0927-2
Coon, E., Svyatsky, D., Jan, A., Kikinzon, E., Berndt, M., Atchley, A., et al. (2019). Advanced Terrestrial simulator. Los Alamos National Laboratory (LANL). [Computer software]. doi: 10.11578/dc.20190911.1
Dar, T., Rai, N., Kumar, S., and Bhat, M. A. (2024). Understanding hydrological processes of glacierized catchments in the western Himalayas by a multi-year tracer-based hydrograph separation analysis. Hydrol. Process. 38, e15083. doi: 10.1002/hyp.15083
Evans, S. G., and Ge, S. (2017). Contrasting hydrogeologic responses to warming in permafrost and seasonally frozen ground hillslopes. Geophys. Res. Lett. 44, 1803–1813. doi: 10.1002/2016GL072009
Evans, S. G., Ge, S. M., and Liang, S. H. (2015). Analysis of groundwater flow in mountainous, headwater catchments with permafrost. Water Resour. Res. 51, 9564–9576. doi: 10.1002/2015WR017732
Evans, S. G., Ge, S., Voss, C. I., and Molotch, N. P. (2018). The role of frozen soil in groundwater discharge predictions for warming alpine watersheds. Water Resour. Res. 54, 1599–1615. doi: 10.1002/2017WR022098
Fan, L., Ji, F., Kuang, X., Guo, Z., Zhang, R., and Zheng, C. (2024). Impacts of permafrost degradation on streamflow in the northern Himalayas. Sci. China Earth Sci. 67, 1990–2000. doi: 10.1007/s11430-023-1297-4
Gao, H., Zhang, Z., Chen, H., Zhang, W., Xu, C., Yi, Y., et al. (2023). Impacts of seasonally frozen soil hydrothermal dynamics on the watershed hydrological processes inferred from a spatially distributed numerical modelling approach. J. Hydrol. 624:129947. doi: 10.1016/j.jhydrol.2023.129947
Ge, S., Mckenzie, J., Voss, C., and Wu, Q. (2011). Exchange of groundwater and surface-water mediated by permafrost response to seasonal and long term air temperature variation. Geophys. Res. Lett. 38:571. doi: 10.1029/2011GL049571
Hamm, A., and Frampton, A. (2021). Impact of lateral groundwater flow on hydrothermal conditions of the active layer in a high-Arctic hillslope setting. Cryosphere 15, 4853–4871. doi: 10.5194/tc-15-4853-2021
He, J., Yang, K., Tang, W. J., Lu, H., Qin, J., Chen, Y. Y., et al. (2020). The first high-resolution meteorological forcing dataset for land process studies over China. Scientific Data 7:25. doi: 10.1038/s41597-020-0369-y
Hu, G., Li, X., Yang, X., Shi, F., Sun, H., and Cui, B. (2022). Identifying spatiotemporal patterns of hillslope subsurface flow in an alpine critical zone on the Qinghai-Tibetan plateau based on three-year, high-resolution field observations. Water Resour. Res. 58:58. doi: 10.1029/2022WR032098
Hu, Y., Ma, R., Sun, Z., Zheng, Y., Pan, Z., and Zhao, L. (2023). Groundwater plays an important role in controlling riverine dissolved organic matter in a cold alpine catchment, the Qinghai–Tibet plateau. Water Resour. Res. 59, e2022WR032426. doi: 10.1029/2022WR032426
Iwata, Y., Nemoto, M., Hasegawa, S., Yanai, Y., Kuwao, K., and Hirota, T. (2011). Influence of rain, air temperature, and snow cover on subsequent spring-snowmelt infiltration into thin frozen soil layer in northern Japan. J. Hydrol. 401, 165–176. doi: 10.1016/j.jhydrol.2011.02.019
Iwata, Y., Yanai, Y., Yazaki, T., and Hirota, T. (2018). Effects of a snow-compaction treatment on soil freezing, snowmelt runoff, and soil nitrate movement: a field-scale paired-plot experiment. J. Hydrol. 567, 280–289. doi: 10.1016/j.jhydrol.2018.10.016
Jafarov, E. E., Coon, E. T., Harp, D. R., Wilson, C. J., Painter, S. L., Atchley, A. L., et al. (2018). Modeling the role of preferential snow accumulation in through talik development and hillslope groundwater flow in a transitional permafrost landscape. Environ. Res. Lett. 13, 105006. doi: 10.1088/1748-9326/aadd30
Jan, A., Coon, E. T., and Painter, S. L. (2020). Evaluating integrated surface/subsurface permafrost thermal hydrology models in Ats (v0.88) against observations from a polygonal tundra site. Geosci. Model Dev. 13, 2259–2276. doi: 10.5194/gmd-13-2259-2020
Ji, F., Fan, L., Andrews, C. B., Yao, Y., and Zheng, C. (2020). Dynamics of seasonally frozen ground in the Yarlung Zangbo River basin on the Qinghai-Tibet plateau: historical trend and future projection. Environ. Res. Lett. 15, 104081. doi: 10.1088/1748-9326/abb731
Ji, F., Fan, L., Kuang, X., Li, X., Cao, B., Cheng, G., et al. (2022). How does soil water content influence permafrost evolution on the Qinghai-Tibet plateau under climate warming? Environ. Res. Lett. 17, 64012. doi: 10.1088/1748-9326/ac6c9a
Karra, S., Painter, S. L., and Lichtner, P. C. (2014). Three-phase numerical model for subsurface hydrology in permafrost-affected regions (Pflotran-ice v1.0). Cryosphere 8, 1935–1950. doi: 10.5194/tc-8-1935-2014
Koven, C. D., Ringeval, B., Friedlingstein, P., Ciais, P., Cadule, P., Khvorostyanov, D., et al. (2011). Permafrost carbon-climate feedbacks accelerate global warming. Proc. Natl. Acad. Sci. 108, 14769–14774. doi: 10.1073/pnas.1103910108
Kuang, X., Liu, J., Scanlon, B. R., Jiao, J. J., Jasechko, S., Lancia, M., et al. (2024). The changing nature of groundwater in the global water cycle. Science 383:eadf0630. doi: 10.1126/science.adf0630
Kun, Y., Jie, H., Wenjun, T., Hui, L., and Jun, Q. (2019). China meteorological forcing dataset (1979–2018). In: NATIONAL TIBETAN PLATEAU DATA, C. (ed.). National Tibetan Plateau Data Center. doi: 10.11888/AtmosphericPhysics.tpe.249369.file
Laudon, H., Sjöblom, V., Buffam, I., Seibert, J., and Mörth, M. (2007). The role of catchment scale and landscape characteristics for runoff generation of boreal streams. J. Hydrol. 344, 198–209. doi: 10.1016/j.jhydrol.2007.07.010
Li, X. (2020). Qilian Mountains integrated observatory network: Dataset of Qinghai Lake integrated observatory network (an observation system of Meteorological elements gradient of the temperate steppe, 2019). In National Tibetan Plateau Data, C (National Tibetan Plateau Data Center). doi: 10.11888/Meteoro.tpdc.270730
Li, X., Cheng, G. D., Jin, H. J., Kang, E., Che, T., Jin, R., et al. (2008). Cryospheric change in China. Glob. Planet. Chang. 62, 210–218. doi: 10.1016/j.gloplacha.2008.02.001
Lyu, H., Li, H., Zhang, P., Cheng, C., Zhang, H., Wu, S., et al. (2023). Response mechanism of groundwater dynamics to freeze–thaw process in seasonally frozen soil areas: a comprehensive analysis from site to regional scale. J. Hydrol. 625:129861. doi: 10.1016/j.jhydrol.2023.129861
Li, Y., Gong, J., and Zhang, Y. (2023). Investigating the Relationship between Topographic Factors and Vegetation Spatial Patterns in the Alpine Plateau: A Case Study in the Southwestern Tibetan Plateau. Remote Sensing, 15:5356. doi: 10.3390/rs15225356
Ma, R., Sun, Z., Chang, Q., Ge, M., and Pan, Z. (2021). Control of the interactions between stream and groundwater by permafrost and seasonal frost in an alpine catchment, northeastern Tibet plateau, China. J. Geophys. Res. Atmos. 126, e2020JD033689. doi: 10.1029/2020jd033689
Ma, R., Sun, Z., Hu, Y., Chang, Q., Wang, S., Xing, W., et al. (2017). Hydrological connectivity from glaciers to rivers in the Qinghai–Tibet plateau: roles of suprapermafrost and subpermafrost groundwater. Hydrol. Earth Syst. Sci. 21, 4803–4823. doi: 10.5194/hess-21-4803-2017
Mckenzie, J. M., and Voss, C. I. (2013). Permafrost thaw in a nested groundwater-flow system. Hydrogeol. J. 21, 299–316. doi: 10.1007/s10040-012-0942-3
Painter, S. L., Coon, E. T., Atchley, A. L., Berndt, M., Garimella, R., Moulton, J. D., et al. (2016). Integrated surface/subsurface permafrost thermal hydrology: model formulation and proof-of-concept simulations. Water Resour. Res. 52, 6062–6077. doi: 10.1002/2015WR018427
Painter, S. L., Moulton, J. D., and Wilson, C. J. (2013). Modeling challenges for predicting hydrologic response to degrading permafrost. Hydrogeol. J. 21, 221–224. doi: 10.1007/s10040-012-0917-4
Pan, X., Yu, Q., You, Y., Chun, K. P., Shi, X., and Li, Y. (2017). Contribution of supra-permafrost discharge to thermokarst lake water balances on the northeastern Qinghai-Tibet plateau. J. Hydrol. 555, 621–630. doi: 10.1016/j.jhydrol.2017.10.046
Pant, N., Semwal, P., Khobragade, S. D., Rai, S. P., Kumar, S., Dubey, R. K., et al. (2021). Tracing the isotopic signatures of cryospheric water and establishing the altitude effect in Central Himalayas: a tool for cryospheric water partitioning. J. Hydrol. 595:125983. doi: 10.1016/j.jhydrol.2021.125983
Peng, J. P., and Shao, A. J. (2007). Determination of parameters of soil water characteristic carve by MatLab. Soils. 39, 433–438.
Peng, X., Zhang, T., Frauenfeld, O. W., Wang, K., Cao, B., Zhong, X., et al. (2017). Response of seasonal soil freeze depth to climate change across China. Cryosphere 11, 1059–1073. doi: 10.5194/tc-11-1059-2017
Rafiei Sardooi, E., Azareh, A., Mesbahzadeh, T., Soleimani Sardoo, F., Parteli, E. J. R., and Pradhan, B. (2021). A hybrid model using data mining and multi-criteria decision-making methods for landslide risk mapping at Golestan Province, Iran. Environ. Earth Sci. 80:487. doi: 10.1007/s12665-021-09788-z
Rey, D. M., Hinckley, E. L. S., Walvoord, M. A., and Singha, K. (2021). Integrating observations and models to determine the effect of seasonally frozen ground on hydrologic partitioning in alpine hillslopes in the Colorado Rocky Mountains, Usa. Hydrol. Process. 35, e14374. doi: 10.1002/hyp.14374
Rosenberry, D. O., Lewandowski, J., Meinikmann, K., and Nützmann, G. (2015). Groundwater - the disregarded component in lake water and nutrient budgets. Part 1: effects of groundwater on hydrology. Hydrol. Process. 29, 2895–2921. doi: 10.1002/hyp.10403
Rush, M. J., and Rajaram, H. (2022). Influence of snowpack cold content on seasonally frozen ground and its hydrologic consequences: a case study from Niwot ridge, co. Water Resour. Res. 58:58. doi: 10.1029/2021WR031911
Rush, M., Rajaram, H., Anderson, R. S., and Anderson, S. P. (2021). Modeling aspect-controlled evolution of ground thermal regimes on montane hillslopes. J. Geophys. Res. Earth 126, e2021JF006126. doi: 10.1029/2021jf006126
Schmidt, M. W. I., Torn, M. S., Abiven, S., Dittmar, T., Guggenberger, G., Janssens, I. A., et al. (2011). Persistence of soil organic matter as an ecosystem property. Nature 478, 49–56. doi: 10.1038/nature10386
Sebestyen, S. D., Boyer, E. W., Shanley, J. B., Kendall, C., Doctor, D. H., Aiken, G. R., et al. (2008). Sources, transformations, and hydrological processes that control stream nitrate and dissolved organic matter concentrations during snowmelt in an upland forest. Water Resour. Res. 44, W12410. doi: 10.1029/2008WR006983
Sjöberg, Y., Jan, A., Painter, S. L., Coon, E. T., Carey, M. P., O'Donnell, J. A., et al. (2021). Permafrost promotes shallow groundwater flow and warmer headwater streams. Water Resour. Res. 57, e2020WR027463. doi: 10.1029/2020WR027463
Song, L., Wang, L., Zhou, J., Luo, D., and Li, X. (2022). Divergent runoff impacts of permafrost and seasonally frozen ground at a large river basin of Tibetan plateau during 1960–2019. Environ. Res. Lett. 17, 124038. doi: 10.1088/1748-9326/aca4eb
Sun, Y., Clauson, K., Zhou, M., Sun, Z., Zheng, C., and Zheng, Y. (2021). Hillslopes in headwaters of Qinghai-Tibetan plateau as hotspots for subsurface dissolved organic carbon processing during permafrost thaw. J. Geophys. Res. Biogeosci. 126, e2020JG006222. doi: 10.1029/2020JG006222
Vaughan, D. G., Comiso, J. C., Allison, I. C., Carrasco, J., and Zhang, T. (2013). Observations: Cryosphere, Clim. Chang. 2013 Phys. Sci. Basis. Contrib. Work. Gr. I to Fifth Assess. Rep. Intergov. Panel Clim. Change, pp. 317–382, Cambridge Univ. Press, Cambridge, U. K., and New York. doi: 10.1017/CBO9781107415324.012
Walvoord, M. A., Voss, C. I., Ebel, B. A., and Minsley, B. J. (2019). Development of perennial thaw zones in boreal hillslopes enhances potential mobilization of permafrost carbon. Environ. Res. Lett. 14, 15003. doi: 10.1088/1748-9326/aaf0cc
Walvoord, M. A., Voss, C. I., and Wellman, T. P. (2012). Influence of permafrost distribution on groundwater flow in the context of climate-driven permafrost thaw: Example from Yukon Flats Basin, Alaska, United States. Water Resour. Res. 48:48. doi: 10.1029/2011WR011595
Wang, X., and Chen, R. (2024). Freezing and thawing characteristics of seasonally frozen ground across China. Geoderma 448:116966. doi: 10.1016/j.geoderma.2024.116966
Woo, M. K. (2012). Permafrost hydrology. Springer Science & Business Media. doi: 10.1007/978-3-642-23462-0
Wu, M., Huang, J., Wu, J., Tan, X., and Jansson, P.-E. (2016). Experimental study on evaporation from seasonally frozen soils under various water, solute and groundwater conditions in Inner Mongolia, China. J. Hydrol. 535, 46–53. doi: 10.1016/j.jhydrol.2016.01.050
Wang, R., Wang, Y., and Yan, F. (2022). Vegetation Growth Status and Topographic Effects in Frozen Soil Regions on the Qinghai–Tibet Plateau. Remote Sensin, 14, 4830. doi: 10.3390/rs14194830
Yang, K., He, J., Tang, W. J., Qin, J., and Cheng, C. C. K. (2010). On downward shortwave and longwave radiations over high altitude regions: observation and modeling in the Tibetan plateau. Agric. For. Meteorol. 150, 38–46. doi: 10.1016/j.agrformet.2009.08.004
Zhang, G. Q. (2021). Qinghai Lake hydrology and climate data (1956–2020) : National Tibetan Plateau Data Center. doi: 10.1080/27669645.2021.2015870
Zhang, G. Q., and Duan, S. Q. (2021). Lakes as sentinels of climate change on the Tibetan plateau. All Earth 33, 161–165.
Zhao, Z., Fu, R., Liu, J., Dai, L., Guo, X., Du, Y., et al. (2022). Response of seasonally frozen ground to climate changes in the northeastern Qinghai-Tibet plateau. Front. Environ. Sci. : 10, 912209. doi: 10.3389/fenvs.2022.912209
Zhao, D., and Wu, S. (2019). Projected changes in permafrost active layer thickness over the Qinghai-Tibet plateau under climate change. Water Resour. Res. 55, 7860–7875. doi: 10.1029/2019WR024969
Zheng, C., and Bennett, G. D. (2002). Applied contaminant transport modeling (Vol. 2, p. 353). New York: Wiley-Interscience.
Zheng, C., Chen, Y., Gao, W., Liang, X., Šimůnek, J., and Liu, X. (2023). Water transfer mechanisms and vapor flow effects in seasonally frozen soils. J. Hydrol. 627:130401. doi: 10.1016/j.jhydrol.2023.130401
Keywords: seasonally frozen ground, freeze–thaw process, rainfall infiltration, groundwater discharge, climate warming
Citation: Ding C, Guo Z, Chen K, Fan L, Zhan Y, Kuang X, Cui B and Zheng C (2024) The effect of seasonally frozen ground on rainfall infiltration and groundwater discharge in Qinghai Lake Basin, China. Front. Water. 6:1495763. doi: 10.3389/frwa.2024.1495763
Edited by:
Rayees Ahmed, University of Kashmir, IndiaReviewed by:
Irfan Rashid, University of Kashmir, IndiaTariq Abdullah, University of Kashmir, India
Tanveer Dar, Indian Institute of Technology Roorkee, India
Copyright © 2024 Ding, Guo, Chen, Fan, Zhan, Kuang, Cui and Zheng. This is an open-access article distributed under the terms of the Creative Commons Attribution License (CC BY). The use, distribution or reproduction in other forums is permitted, provided the original author(s) and the copyright owner(s) are credited and that the original publication in this journal is cited, in accordance with accepted academic practice. No use, distribution or reproduction is permitted which does not comply with these terms.
*Correspondence: Zhilin Guo, Z3VvemxAc3VzdGVjaC5lZHUuY24=
 Chen Ding
 Zhilin Guo
 Kewei Chen1,2
 Xingxing Kuang
 Buli Cui
 Chunmiao Zheng