 Meseret Bekele Toma
 Mihret Dananto Ulsido1
- 1Faculty of Biosystems and Water Resources Engineering, Hawassa University, Hawassa, Ethiopia
- 2Wolaita Zone Water, Irrigation and Mines Department, Wolaita Sodo, Ethiopia
- 3South Ethiopia Regional Government Policy Studies and Research Institute, Wolaita Sodo, Ethiopia
The purpose of this study was to investigate the rainfall and temperature changes for the projected periods of (2021–2050) and (2051–2080) under two Representative Concentration Pathways (RCP4.5 and RCP8.5) at selected stations in the Ajora-Woybo watershed of Omo-Gibe basin, Ethiopia. CORDEX-Africa with the Coupled Models Intercomparison Project Phase 5 (CMIP5) has been used to downscale the future climate change (2021–2050 and 2051–2080). The RCPs scenarios RCP4.5 and RCP8.5 were considered for this study. The climate model data for hydrological modeling (CMhyd) were used for extraction of CORDEX-NetCDF and the rainfall and temperature bias correction. The monthly observational and reanalysis rainfall and temperature data were validated with ground observations using statistical measures such as the mean relative error (MRE), the correlation coefficient (CORR), and the Nash-Sutcliffe efficiency coefficient (NSE). The simulation performance evaluation revealed that all of the chosen global circulation models (GCMs) have good simulation capacity over the Ajora-Woybo watershed. The predicted mean annual RF shows a non-significant decline in the ensemble GCMs’ for the two time periods 2021–2050 and 2051–2080. In comparison to the RCP 8.5 emissions scenario, rainfall is expected to decline less under the RCP 4.5 climate change scenario. For ensemble GCMs, it is anticipated that mean annual Tmax and Tmin would both rise in comparison to the baseline at all stations. The Tmax and Tmin trends at the end of the 2040s and 2070s changed more in the highest emission scenario, RCP8.5, than in the RCP4.5 scenario. In order to reduce ongoing effects of climate change and create long-term water resource management plans for the Ajora-Woybo watershed, it will be helpful to consider projected changes in temperature and rainfall.
1 Introduction
Global climate change is a sensitive subject that affects the aspects of human existence, the socioeconomic and the biophysical environments that dictate the quality of life on the earth. Ethiopia is frequently regarded as one of the extreme examples of Africa’s vulnerability to future climate change (Conway and Schipper, 2011). The Intergovernmental Panel on Climate Change (IPCC) fifth assessment report has shown an increase of 0.85°C in the global mean temperature from 1880 until 2012 (IPCC, 2014). Different types of climate change have coincided with these shifts in the global temperature (Ouhamdouch and Bahir, 2017).
Precipitation and temperature gradients throughout the landscape are two of the many effects that climate has on the landscape and its river basins (Abed-Elmdoust et al., 2016). Several studies have argued that shift in spatiotemporal patterns of precipitation result in a major change in the geomorphology of the basin (Singhal et al., 2023). In the past, basin-scale water resource systems have been planned and managed under the assumption of stationary hydrologic conditions (Abed-Elmdoust et al., 2016; Orkodjo et al., 2022). This method makes the assumption that historical hydrologic conditions will be adequate to direct the operation and development of infrastructures and systems related to water resources in the future (Singhal et al., 2023). Climate change and the idea that hydrology and climate will change in the future pose a danger to this premise today. For this reason, it is increasingly thought that planning water resources under the assumption of a fixed climate is insufficient for managing water resources sustainably (Sarker, 2020).
The main causes for the vulnerability of Ethiopia to climate variability and change are very highly dependent on rain-fed agriculture and underdevelopment of water resources (NMA, 2014). In Ethiopia, a significant warming trend is projected, with a high level of confidence (Ayana et al., 2017; Chaemiso et al., 2016). Comparatively, rainfall projections remain difficult across the country; therefore, it should be necessary to check and adjust in order to draw the same conclusions about the contentious findings [e.g., by Ayana et al. (2017); Chaemiso et al. (2016)].
For prediction of future climate, in 2009, World Climate Research Program (WCRP) has initiated CORDEX with the intention of producing an ensemble of high-resolution climate change projections by downscaling global circulation model (GCM) simulations from Coupled Model Inter-comparison Project Phase 5 (CMIP5) data archive on 25 Km and 50 Km grid spacing for 14 regions of the Globe (IPCC, 2014). Africa was selected as the first target region for the World Climate Research programs (WCRPs) in CORDEX. In order to estimate the effects of climate change, GCMs are helpful in providing climate change scenarios. The coarse global grid scale used by GCMs, which are able to provide reliable projections of climate change for the next 100 years, has a resolution of 2–4 degrees latitude and longitude and 10–20 layers in the vertical (IPCC, 2014). The spatial analysis of GCMs provides satisfactory results for the characteristics of various climatic parameters on a broad scale as well as for the global circulation across the planet (Demissie and Sime, 2021; Gebrechorkos et al., 2019; Orkodjo et al., 2022; Shrestha et al., 2021). The climate model is a mathematical breakdown of the atmosphere, ocean, and land levels and grid boxes that make up the Earth’s climate system. Equations describing the large-scale balances of the momentum, heat, and moisture are solved at each of these grid points (IPCC, 2014). Results from GCMs can be incorporated into hydrological models to provide scenarios of water resources and extremes to determine the effects of climate change (Orkodjo et al., 2022).
Kim et al. (2014) evaluates the ability of 10 regional climate models (RCMs) over Africa and concludes that all RCMs simulate the seasonal mean and annual cycle quite accurately. Likewise, it is verified that the mean of multi-model outputs do better than individual simulation. This study specifically strengthen the achievement of models in Ethiopia (Ayana et al., 2017; Dibaba et al., 2020; Gadissa et al., 2018; Orkodjo et al., 2022). In their study report, CORDEX simulations succeed in reproducing the average distribution of precipitation and temperature. These models have been developed to estimate and project climate change and for assessing the impact of climate change at regional and global levels. The models used a set of four new climate scenarios known as Representative Concentration Paths (RCPs) to project climate variables and change (IPCC, 2014). These scenarios were designed for the climate change assessment and modeling community as a foundation for long- and short-term climate change assessment and modeling investigations by the year 2100.
This review concludes that GCMs have an advantage over the use of hypothetical scenarios in climate impact studies. It has been recognized as highly versatile and most suitable for global climate modeling. Sonali and Nagesh Kumar (2020) imply that it is the main tool available for examining how the climate system reacts to different forcing, for forecasting the climate on seasonal to decadal time scales, and for making climate projections for the next century and beyond. Numerous climate models are currently used to forecast crucial climatic variables. The Couple Model Intercomparison Project Phase 5 (CMIP5) dataset from the World Climate Research Program (WCRP) contains more than 40 different GCMs. However, due to local conditions and peculiarities, such as complex topography, coastlines, lakes, and small islands, it is impossible to precisely simulate phenomena related to the effect of topography on a local and regional scale (Shrestha et al., 2021).
Regional climate models offer a better description of orographic effects, land-sea surface contrast, and land-surface characteristics because of the higher spatial domain (Orkodjo et al., 2022; Teutschbein and Seibert, 2012; Worku, 2018). Additionally, they improve the simulation of atmospheric circulations and climatic variables at fine spatial scales, demonstrating their enhanced capacity to replicate the current climate (Xu, 1999). However, there are still some limitations according to Xu (1999) such as: (i) the transmission of systematic errors in the driving fields provided by global models, (ii) lack of two-way interactions between regional and global climate (iii) the algorithmic restrictions, (iv) computationally demanding, and (v) requirement for further downscaling. The RCMs that are currently in use, for various regions, were created at various modeling centers around the world. The uncertainty problems, however, continue to be a limitation of RCM use. As a result, there have been numerous international initiatives to quantify uncertainties through model inter-comparison. Numerous studies have been carried out in the past because of the abundance of such RCMs (e.g., Demissie and Sime, 2021; Emiru et al., 2021; Orkodjo et al., 2022; Tarekegn et al., 2022; Zhou et al., 2017). Recently, Orkodjo et al. (2022), the results of 15 regional climate models (RCMs) from the Coordinated Regional Climate Reduction Experiment (CORDEX)-Africa were used to project climate change in the Omo-Gibe basin. Temperature and precipitation projections were made using the RCP 8.5 and 4.5 scenarios in the near (2025–2050), mid (2051–2075), and far future (2076–2100). Teutschbein and Seibert (2012) gave a recent analysis of RCM use in hydrological models. They advise against using the outputs of any hydrological models without first applying a bias correction because RCMs are prone to systematic model errors brought on by inadequate conceptualization, discretization, and spatial averaging within grid cells. Inaccurate estimates of extreme temperatures in RCM simulations or an excessive number of wet days with low-intensity rain are the usual causes of these biases.
There are various bias correction techniques, including Variance scaling (VARI), Linear Scaling (LS), Local Intensity scaling (LOCI), Power transformation (PT), Distribution mapping (DM), and Quantile Mapping (QM). Various studies were conducted to compare these bias correction techniques (e.g., Emiru et al., 2021; Gadissa et al., 2018; Teshome et al., 2021; Teutschbein and Seibert, 2012; Wu and Gao, 2020). They conducted studies to contrast various bias correction techniques when downscaling meteorological variables for the study watershed’s hydrologic impact analysis. They discovered that all bias correction methods for temperature correction are equally plausible for correcting raw temperature, whereas for both temperature and precipitation correction, the most effective methods were linear scaling (LS), distribution mapping (DM), and quantile mapping (QM).
The Omo-Gibe basin is also one of the significant surface water resources of Ethiopia (Toma et al., 2023b). However, the water resources of the Omo-Gibe Basin are under severe stress due to changing climatic conditions and competing demands on the resources by the downstream hydropower structure, irrigation, and investment group (Chaemiso et al., 2021). Climatic conditions in the region are such that there is high variability in both temporal and spatial distribution of rainfall over the basin causing a corresponding high variability in stream flow. Consequently, there is a need to quantify and assess climate change on water resources of the basin in general and the Ajora-Woybo watershed in particular, because it faced with multiple water problems. Understanding the impacts of future climate change on rainfall, temperature, and its seasonal distribution, is key to developing appropriate and effective climate change adaptation strategies. Therefore, the goal of this study was to examine changes in temperature and rainfall at chosen stations in the Omo-Gibe basin of Ethiopia’s Ajora-Woybo watershed under two Representative Concentration Pathways (RCP4.5 and RCP8.5) during the anticipated periods of 2021–2050 and 2051–2080. This enables planners, politicians, and policymakers, as well as water managers, river basin planners, government agencies, and engineers to make better decisions and plan future projects to mitigate the future effects of climate change within the watershed.
2 Materials and methods
2.1 Description of the study area
Ajora-Woybo watershed selected as case study for this research is one of the major watersheds in Omo-Gibe basin and is situated in the eastern side of the middle Omo-Gibe basin of Ethiopia. The study regions, i.e., Ajora-Woybo watershed contain five perennial rivers (Ajancho, Soke, Shapa, Woybo, and Baliya Rivers) that are flowing downstream lower valley eventually joins Omo-Gibe River. It is drained by streams named as Ajora Rivers (Ajancho, Soke, and Shapa) and Woybo River from where the name of watershed is given flowing into Gibe III reservoir from east direction. In addition, many small intermittent tributaries drain into the Ajora-Woybo Rivers. The watershed covers an area of some 1723.7 km2 with a perimeter of 336.8 km and an average width of 47 km. The watershed lies between 7°2′0″N and 7°26′0″N latitude and between 37°32′0″ E and 37°58′0″E longitude (Figure 1). Agriculture is the watershed’s most important economic activity and its primary source of income.
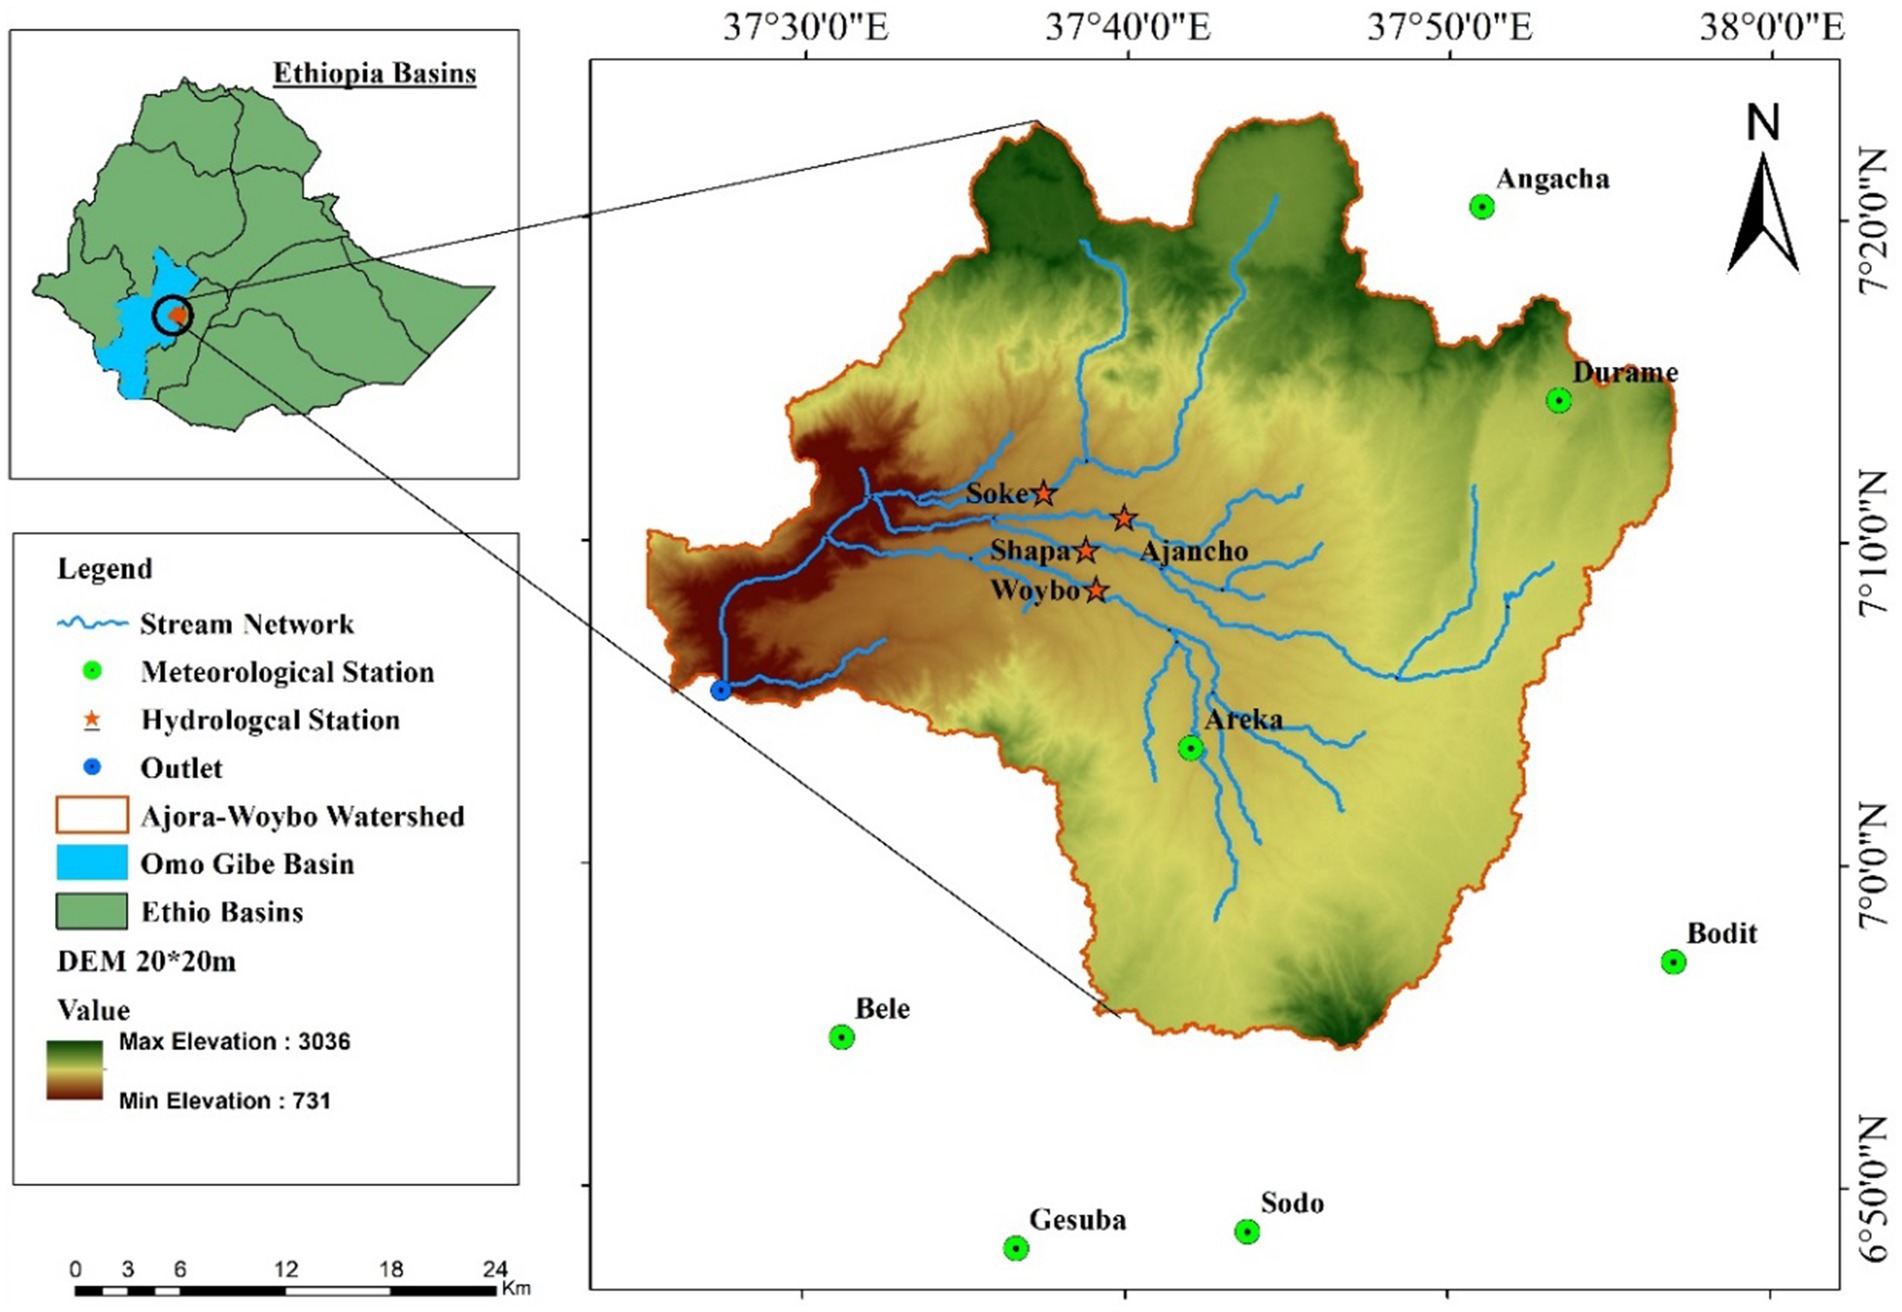
Figure 1. Location map of the study area.
The Ajora-Woybo watershed has a variety of climates, ranging from a hot, arid climate in the southern portion of the floodplain to a tropical, humid climate in the highlands, which include the watershed’s extreme north and northeastern regions. Between these two extremes, the climate is in the middle, and for the majority of the watershed, it is tropical sub-humid. The annual rainfall ranges from more than 1,300 mm in the north-central regions to less than 500 mm in the southern regions. Additionally, the rainfall regime is bimodal in the northern and central parts of the watershed and unimodal in the southern parts. In the watershed, the mean annual temperature ranges from 16°C in the northern highlands to over 29°C in the southern lowlands [WIEB (Water Irrigation and Energy Bureau), 2020].
The study area’s principal land use/cover types, population, socioeconomic circumstances, and a map illustrating the geography and river network mentioned in Toma et al. (2022, 2023a,b) are all described in further detail.
2.2 Data
Meteorological stations were considered are located within and adjacent to the Ajora-Woybo watershed of Omo-Gibe basin. Usually, climate analysis requires complete datasets with no gaps and missing records. In this regard, continuous missing data of more than 10% was not estimated and, such stations excluded from analysis and not be considered for evaluation. Seven stations for daily rainfall data and five stations for daily maximum and minimum temperatures in and near by the watershed was selected, which have relatively long periods of data records (at least 30 years) and have no more than 10% missing values (Table 1) based on Baddoo et al. (2021) and Woldesenbet and Elagib (2021). As a result, the historical data (1990–2020) were displayed in detail by Toma et al. (2023a,b) and utilized in this study. The Ethiopian National Meteorological Agency provided historical rainfall and temperature data.
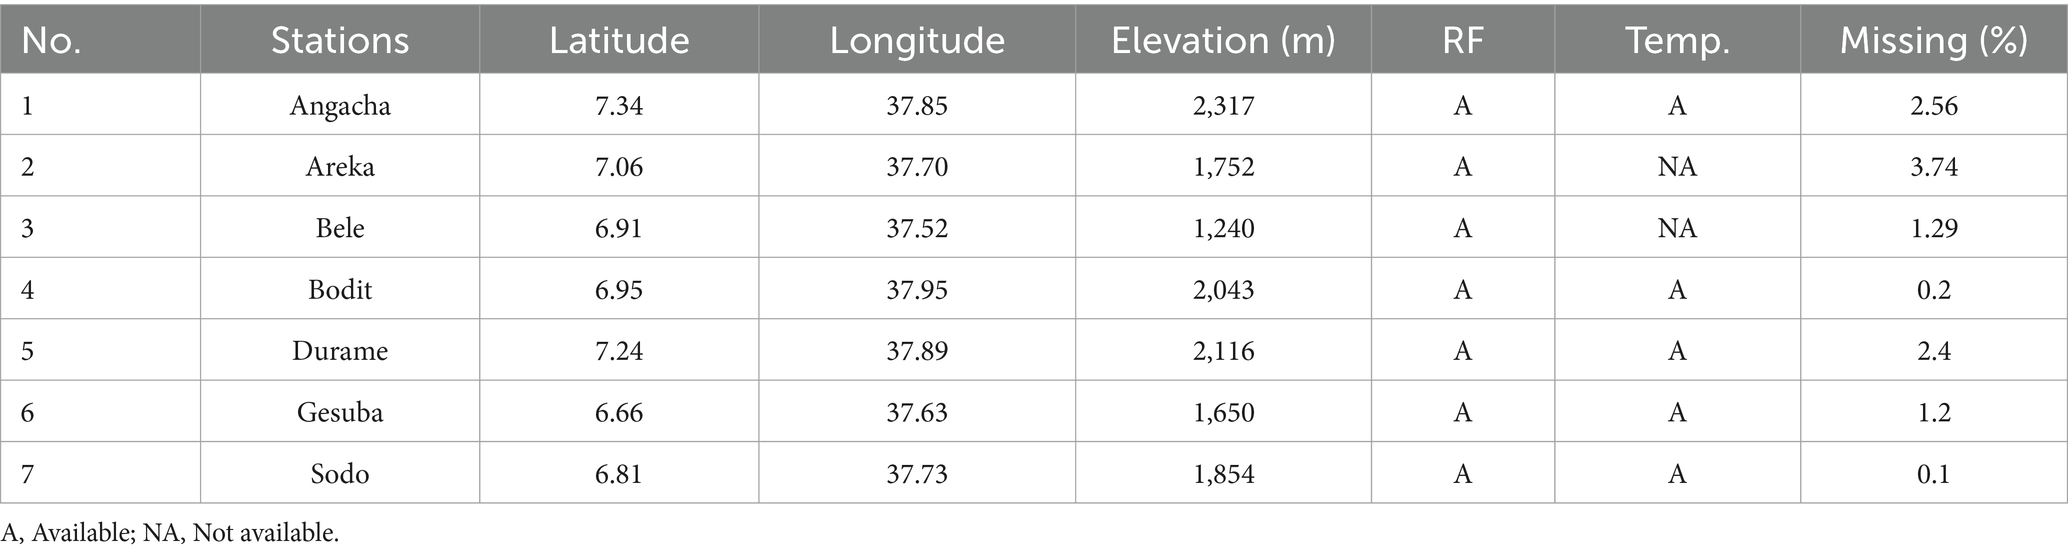
Table 1. General characteristics of meteorological stations.
Data quality check primarily made by time series plotting to identify outliers (Woldesenbet and Elagib, 2021). Double mass curve (DMC) analysis made to check continuity and consistency of the weather station data. Therefore, in this study, DMC analysis was done by plotting rainfall-rainfall pattern and relationships to check the consistency of precipitation records. While the existence of breaks in the slope of the plots signify inconsistency, time of the breaks indicate the time of change. This method can also suggest whether further statistical analysis is appropriate. According to the DMC, the observed rainfall data of the stations shows consistence (Figure 2). It is apparent that the more homogeneous the base station records are the more accurate will be the corrected values (Patakamuri et al., 2020; Woldesenbet and Elagib, 2021).
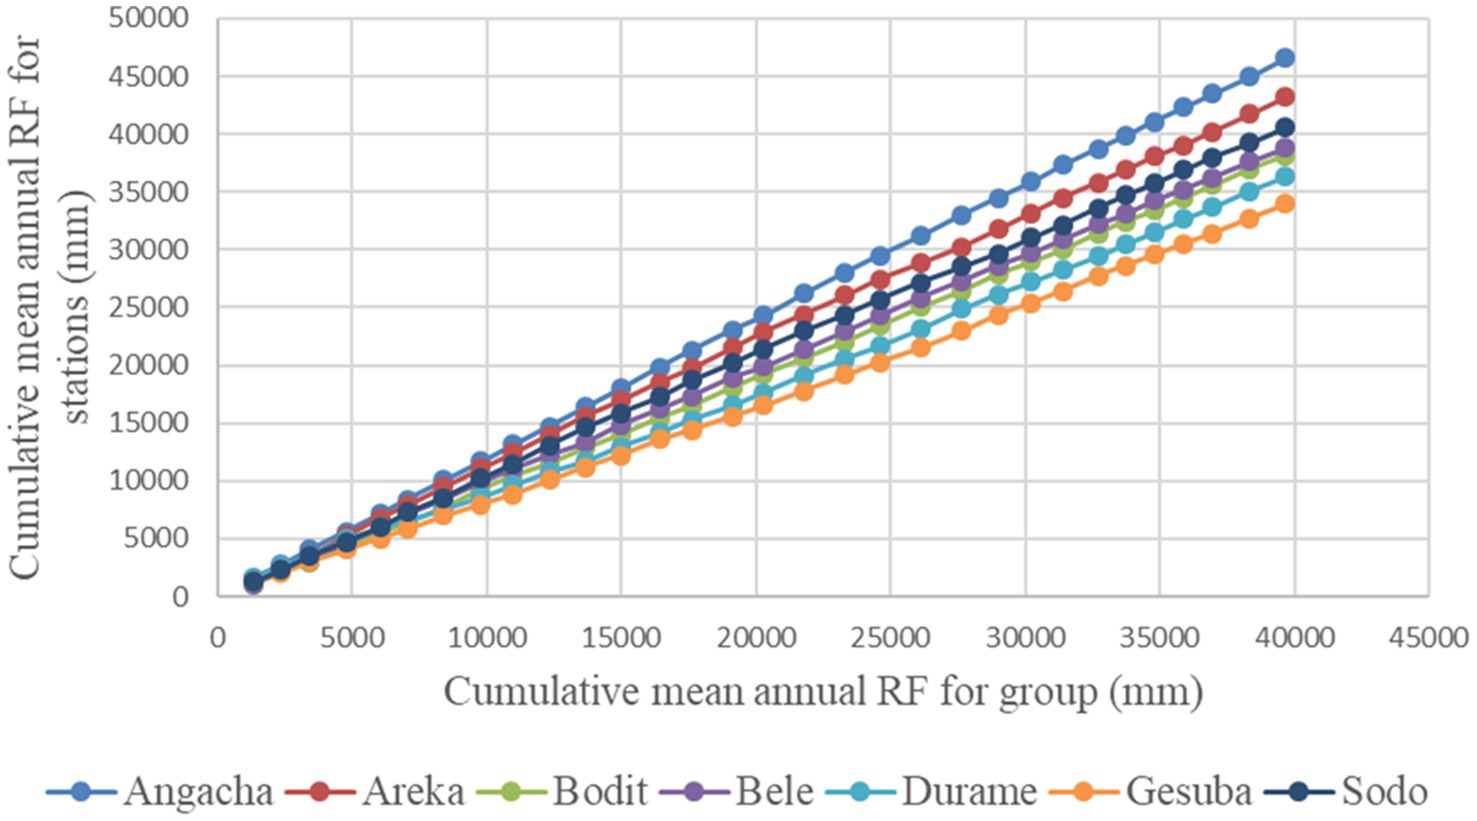
Figure 2. Double mass curves of rainfall for stations versus cumulative rainfall pattern.
2.3 Methods
2.3.1 Projection of future rainfall and temperature
Climate scenarios were created in order to assess the effects of upcoming climate change. Through the creation of climate scenarios and time horizons, RCM is the most popular model for simulating local climate trends in relation to global scale (Emiru et al., 2021; Osima et al., 2018). RCM includes Rossby Center Regional Climate Model (RCA4), Max Planck Institute Regional model (REMO2009), COnsortium for Small-scale MOdeling (COSMO), High Resolution Limited Area Model (HIRHAM5), and Climate Limited-Area Model (CCLM) version 4.8 driven by different GCMs included in the Coupled Models Intercomparison Project Phase 5 (CMIP5) (IPCC, 2014).
The CORDEX Africa was established due to the variety of climate regimes and to enhance simulations and projections (Khan and Koch, 2018). It is used to support international downscaling coordination and make it simpler for scientists and end-user groups to analyze local climate changes (Gadissa et al., 2018) CORDEX-Africa is one of the CORDEX program’s special concerns as a result. The necessity of fully utilizing the ensemble of CORDEX-Africa multi-GCMs has been emphasized (Gyamfi et al., 2021). This aids in evaluating the climate change signal and may help to pinpoint and account for the various sources of uncertainty (Gadissa et al., 2018). The data were derived from the outputs of the following five GCMs (Table 2) which are dynamically downscaled by nesting the RCM into GCMs by the CORDEX-Africa program using RCA4 with a spatial resolution of 25–50 km (0.44°). The representative concentration pathways (RCPs) scenarios RCP4.5 and RCP8.5 were considered for this study, because CORDEX-Africa prioritizes the RCP4.5 and RCP8.5 scenarios (Demissie and Sime, 2021; Emiru et al., 2021).
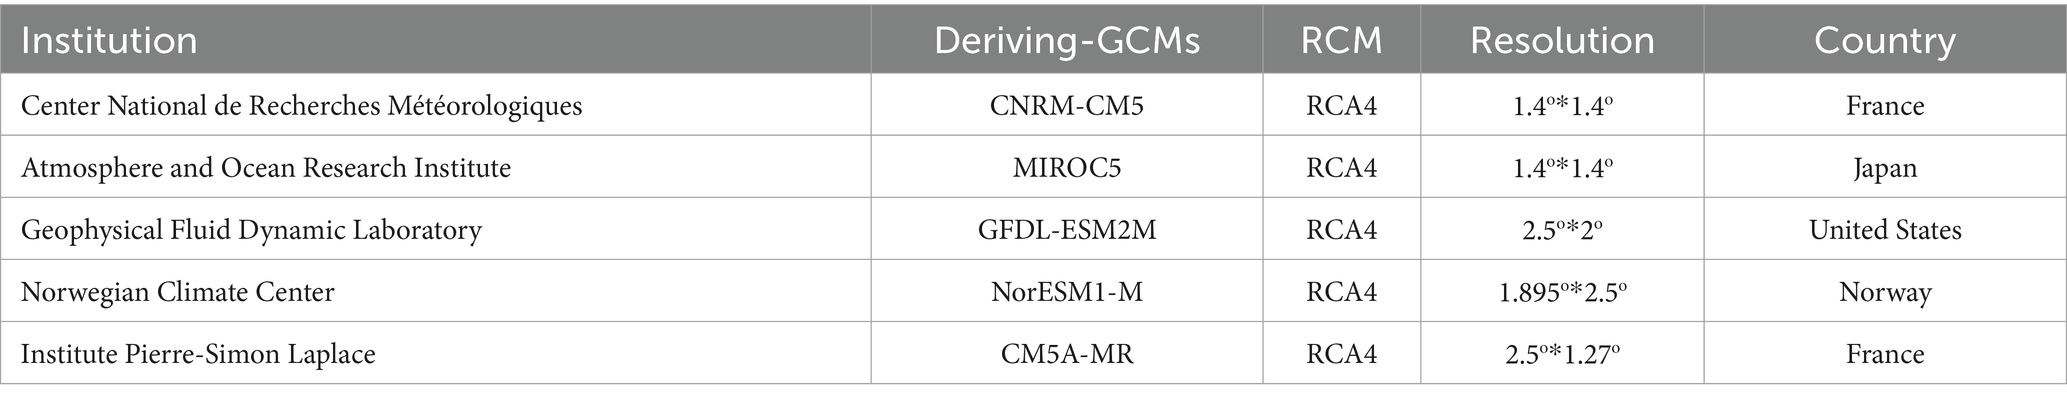
Table 2. List of RCM-GCMs used for this study.
Therefore, in this study, the ensemble mean of five driving-GCM models was used to assess the climate change in near future of 2040’s (2021–2050) and mid-future scenarios 2070’s (2051–2080) with respect to the base/historical period 2010’s (1990–2020) for seven stations of rainfall and five stations of temperature in the Ajora-Woybo watershed. The daily climate data, which included rainfall and maximum and minimum temperatures, were downscaled to the resolution of the stations. The model was chosen based on the likelihood of climatic mean variations, climatic limit changes, and the model’s capacity to simulate past climate. Numerous studies on Africa have evaluated these models, and it has been discovered that they are effective at simulating rainfall and air temperature (Emiru et al., 2021; Gyamfi et al., 2021; Worku, 2018). Based on earlier research carried out in Ethiopia, these climate models were chosen for this investigation (Orkodjo et al., 2022; Worku, 2018), the Great Horn of Africa (Osima et al., 2018), and models that have been used in different hydrological research (Chimdessa et al., 2018; Dibaba et al., 2020). Other weather factors, such as solar radiation, relative humidity, and wind speed from the past were taken into account in the future scenarios without being altered because changes in these factors might not significantly affect how local hydrology is impacted by climate change scenarios (Dibaba et al., 2020; Gadissa et al., 2018).
2.3.2 Bias correction of downscaled climate data
Global circulation model (GCM) and RCM outputs are generally biased (Wu and Gao, 2020), which makes it difficult to directly assess how climate change will affect hydrological processes using GCM or RCM data (Teutschbein and Seibert, 2012). Therefore, before they can be used for regional impact studies, these outputs need to be corrected. Therefore, bias correction is used to account for any propensity to over- or under-estimate the mean of downscaled variables. Bias correction techniques are based on the assumption that they are stationary, meaning that the correction algorithm and its parameterization for the current climate are also assumed to be valid for the future climate (Wu and Gao, 2020). Therefore, additional corrections to the temperature and precipitation data were made in order to use the GCM outputs in the hydrological model. Despite the RCMs’ reasonable performance, including the ensemble mean, all driving-GCMs exhibited noticeable biases (Teshome et al., 2021). When a hydrologic model is forced with biased driving-GCMs, using downscaled regional climate data for impact assessment without any bias correction may result in significant deviation (Mendez et al., 2020; Teutschbein and Seibert, 2012). Therefore, a bias correction method was used to reduce the systematic statistical deviation of the climate input data from the observational one prior to the climate change analysis and impact study for each daily rainfall and temperature dataset derived from CORDEX-Africa.
The RCM-GCMs climate model’s historical and projected data were corrected using a bias correction method. The climate model data for hydrological modeling (CMhyd) obtained from https://swat.tamu.edu/software/ was used for extraction of CORDEX-NetCDF and the rainfall and temperature bias correction (Dibaba et al., 2020; Rathjens et al., 2016; Teutschbein and Seibert, 2012). Rathjens et al. (2016) created Climate Model for Hydrologic Modeling (CMhyd) to perform bias correction of rainfall and temperature data from several climate models. In this study, downscaled rainfall and temperature data were biased-corrected using linear scaling (LS) of the data. This method was selected after reviewing the research on Teutschbein and Seibert (2012), they evaluated five bias correction methods for rainfall and four bias correction techniques for temperature. According to Teutschbein and Seibert (2012), all the bias correction techniques have improved the simulation of rainfall and temperature. From them according to the authors, linear-scaling (LS) method is suitable for both rainfall and temperature.
The linear-scaling method employs monthly correction values based on differences between observed and simulated values. Corrected driving-GCM simulations will, by definition, agree perfectly in their monthly mean values with the observations (Osima et al., 2018; Worku, 2018). Rainfall is corrected using a factor determined by the ratio of long-term monthly mean observed to control run data. The temperature is corrected using an additive term based on the difference between the long-term monthly mean observed and the control run data: The correction factors and addends used are assumed to remain constant even under future conditions (Emiru et al., 2021; Orkodjo et al., 2022; Teshome et al., 2021; Teutschbein and Seibert, 2012).
This method was also employed in upper Awash river basin by Emiru et al. (2021), Baro-Akobo river basin by Muleta (2021), south western Omo-Gibe basin by Orkodjo et al. (2022), and central rift valley basin of Ethiopia by Gadissa et al. (2018).
2.3.3 Performance evaluation of climate models
Different models have their own strengths and weaknesses. The performance of each model was evaluated against observation. Additionally, an ensemble of the models was computed, and its performance was assessed against the observation along with the models (Emiru et al., 2021; Teshome et al., 2021). Some statistical measures were used to compare model outputs to observations. By plotting the simulated and observed data on the same coordinate system, the systematic and dynamic behavior of the models was made visible. Due to the influence of factors like land features, not all models could accurately simulate the climate data (Ayana et al., 2017; Emiru et al., 2021; Gyamfi et al., 2021; Teshome et al., 2021).
The simulation performance of each GCM was evaluated before downscaling the climate variables for each station to validate its accuracy in representing observed climate. We used observed and historical daily data from 1990 to 2005 for this purpose. The monthly observational and reanalysis rainfall and temperature data were validated with ground observations using statistical measures such as the mean relative error (MRE) (Equation 5), the correlation coefficient (CORR) (Equation 6), and the Nash-Sutcliffe efficiency coefficient (NSE) (Equation 6). The smaller the value of the MRE is, the higher the GCM simulation capability is, while the closer the NSE value is to 1, the better is the model simulation performance (Emiru et al., 2021).
where Pi and Oi are the values at the ith time step (daily) in the downscaled driving-GCM simulation and observational time series, respectively, P and O are the mean value of the downscaled driving-GCM simulation and observational sequence, and N is the total sample number.
3 Results and discussion
3.1 Simulation performance of the models
The simulation performance evaluation revealed that all of the chosen RCM (RCA4) driving-GCMs have adequate simulation capacity over the Ajora-Woybo watershed. The MREs for all driving-GCMs are all less than 5% for rainfall, except ESM2M at Gesuba station (18.4) and NorESM1-M at Sodo station (16.3). The MREs for all driving-GCMs are all less than 5% for maximum and minimum temperature. The CORR and NSE values for rainfall are all greater than 0.85 at Gesuba (NorESM1-M) and 0.63 at Gesuba (NorESM1-M), respectively. The values of these statistics for air temperatures are similarly high and indicate superior driving-GCMs performance. The minimum value started at 0.73 at Angacha (for MIROC5) and 0.71 at Sodo (for CNRM-CM5) for maximum temperature, and between 0.68 at Sodo (for MIROC5) and 0.56 at Gesuba (for CNRM-CM5) for minimum temperature, respectively (Tables 3, 4).
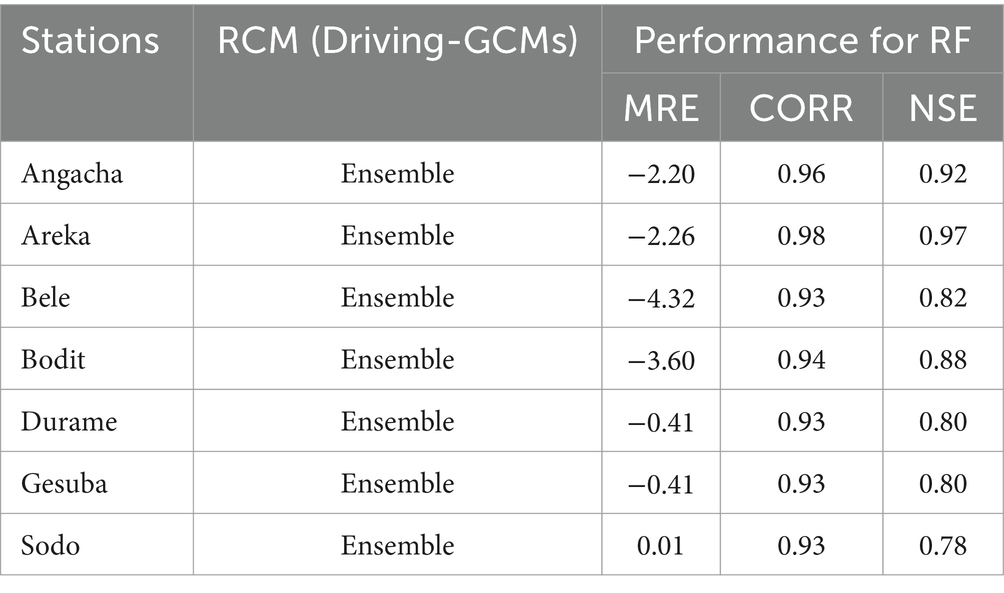
Table 3. Simulation performance of RCM with different driving-GCMs for rainfall.
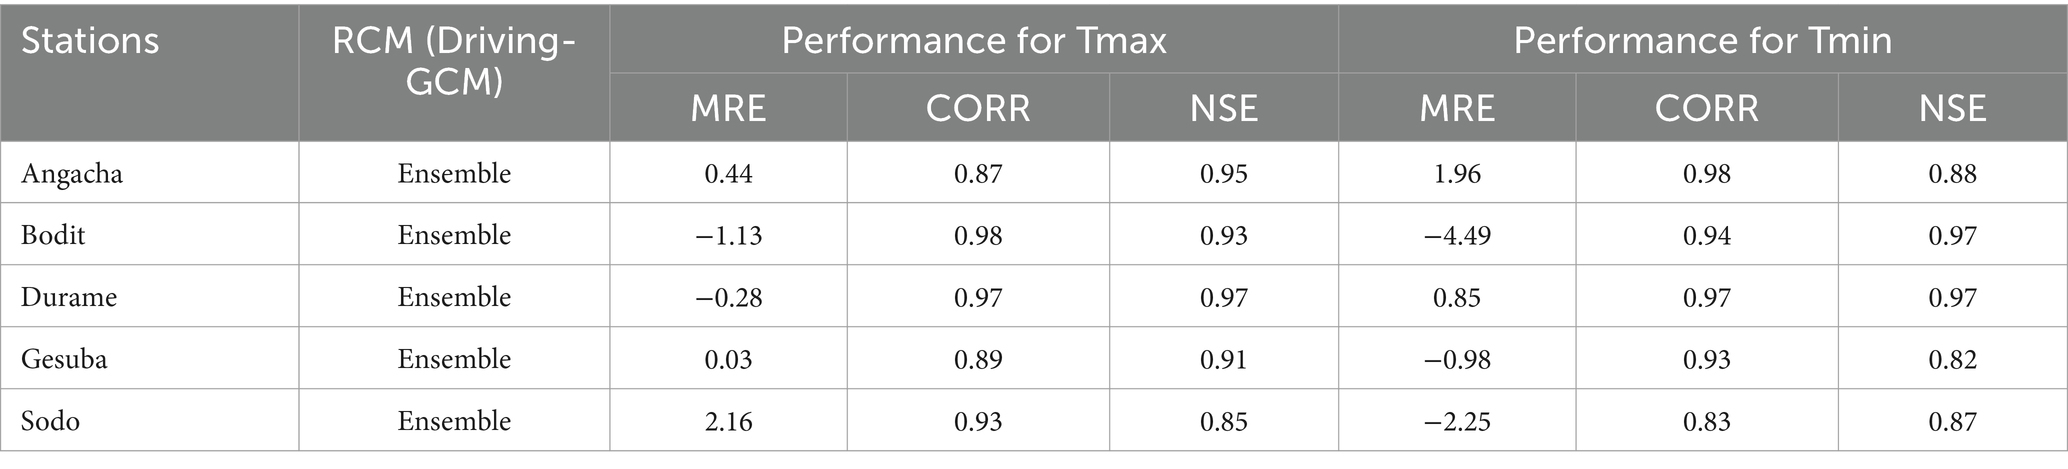
Table 4. Simulation performance RCM with different driving-GCMs for temperature.
A positive correlation value indicates a positive linear relationship, while a negative correlation value indicates a negative linear relationship (Emiru et al., 2021). All models, including ensemble, displayed a positive relation in the findings. The best data set that performed well against the observed when using the correlation analysis method was the ensemble. All driving-GCM models best captured the observed rainfall. The ensemble of models, rather than a single model, performs better at simulating rainfall than any single model does across the board. Despite minor under and overestimation in model simulation, the ensemble mean of monthly and annual rainfall from observed and model output showed good relationships. The average result was dynamically downscaled with rainfall, maximum and minimum temperature, and virtually showed a good relationship with the observed data. As a result, comparisons between observed and simulated RCP data were consistent (Figures 3–5).
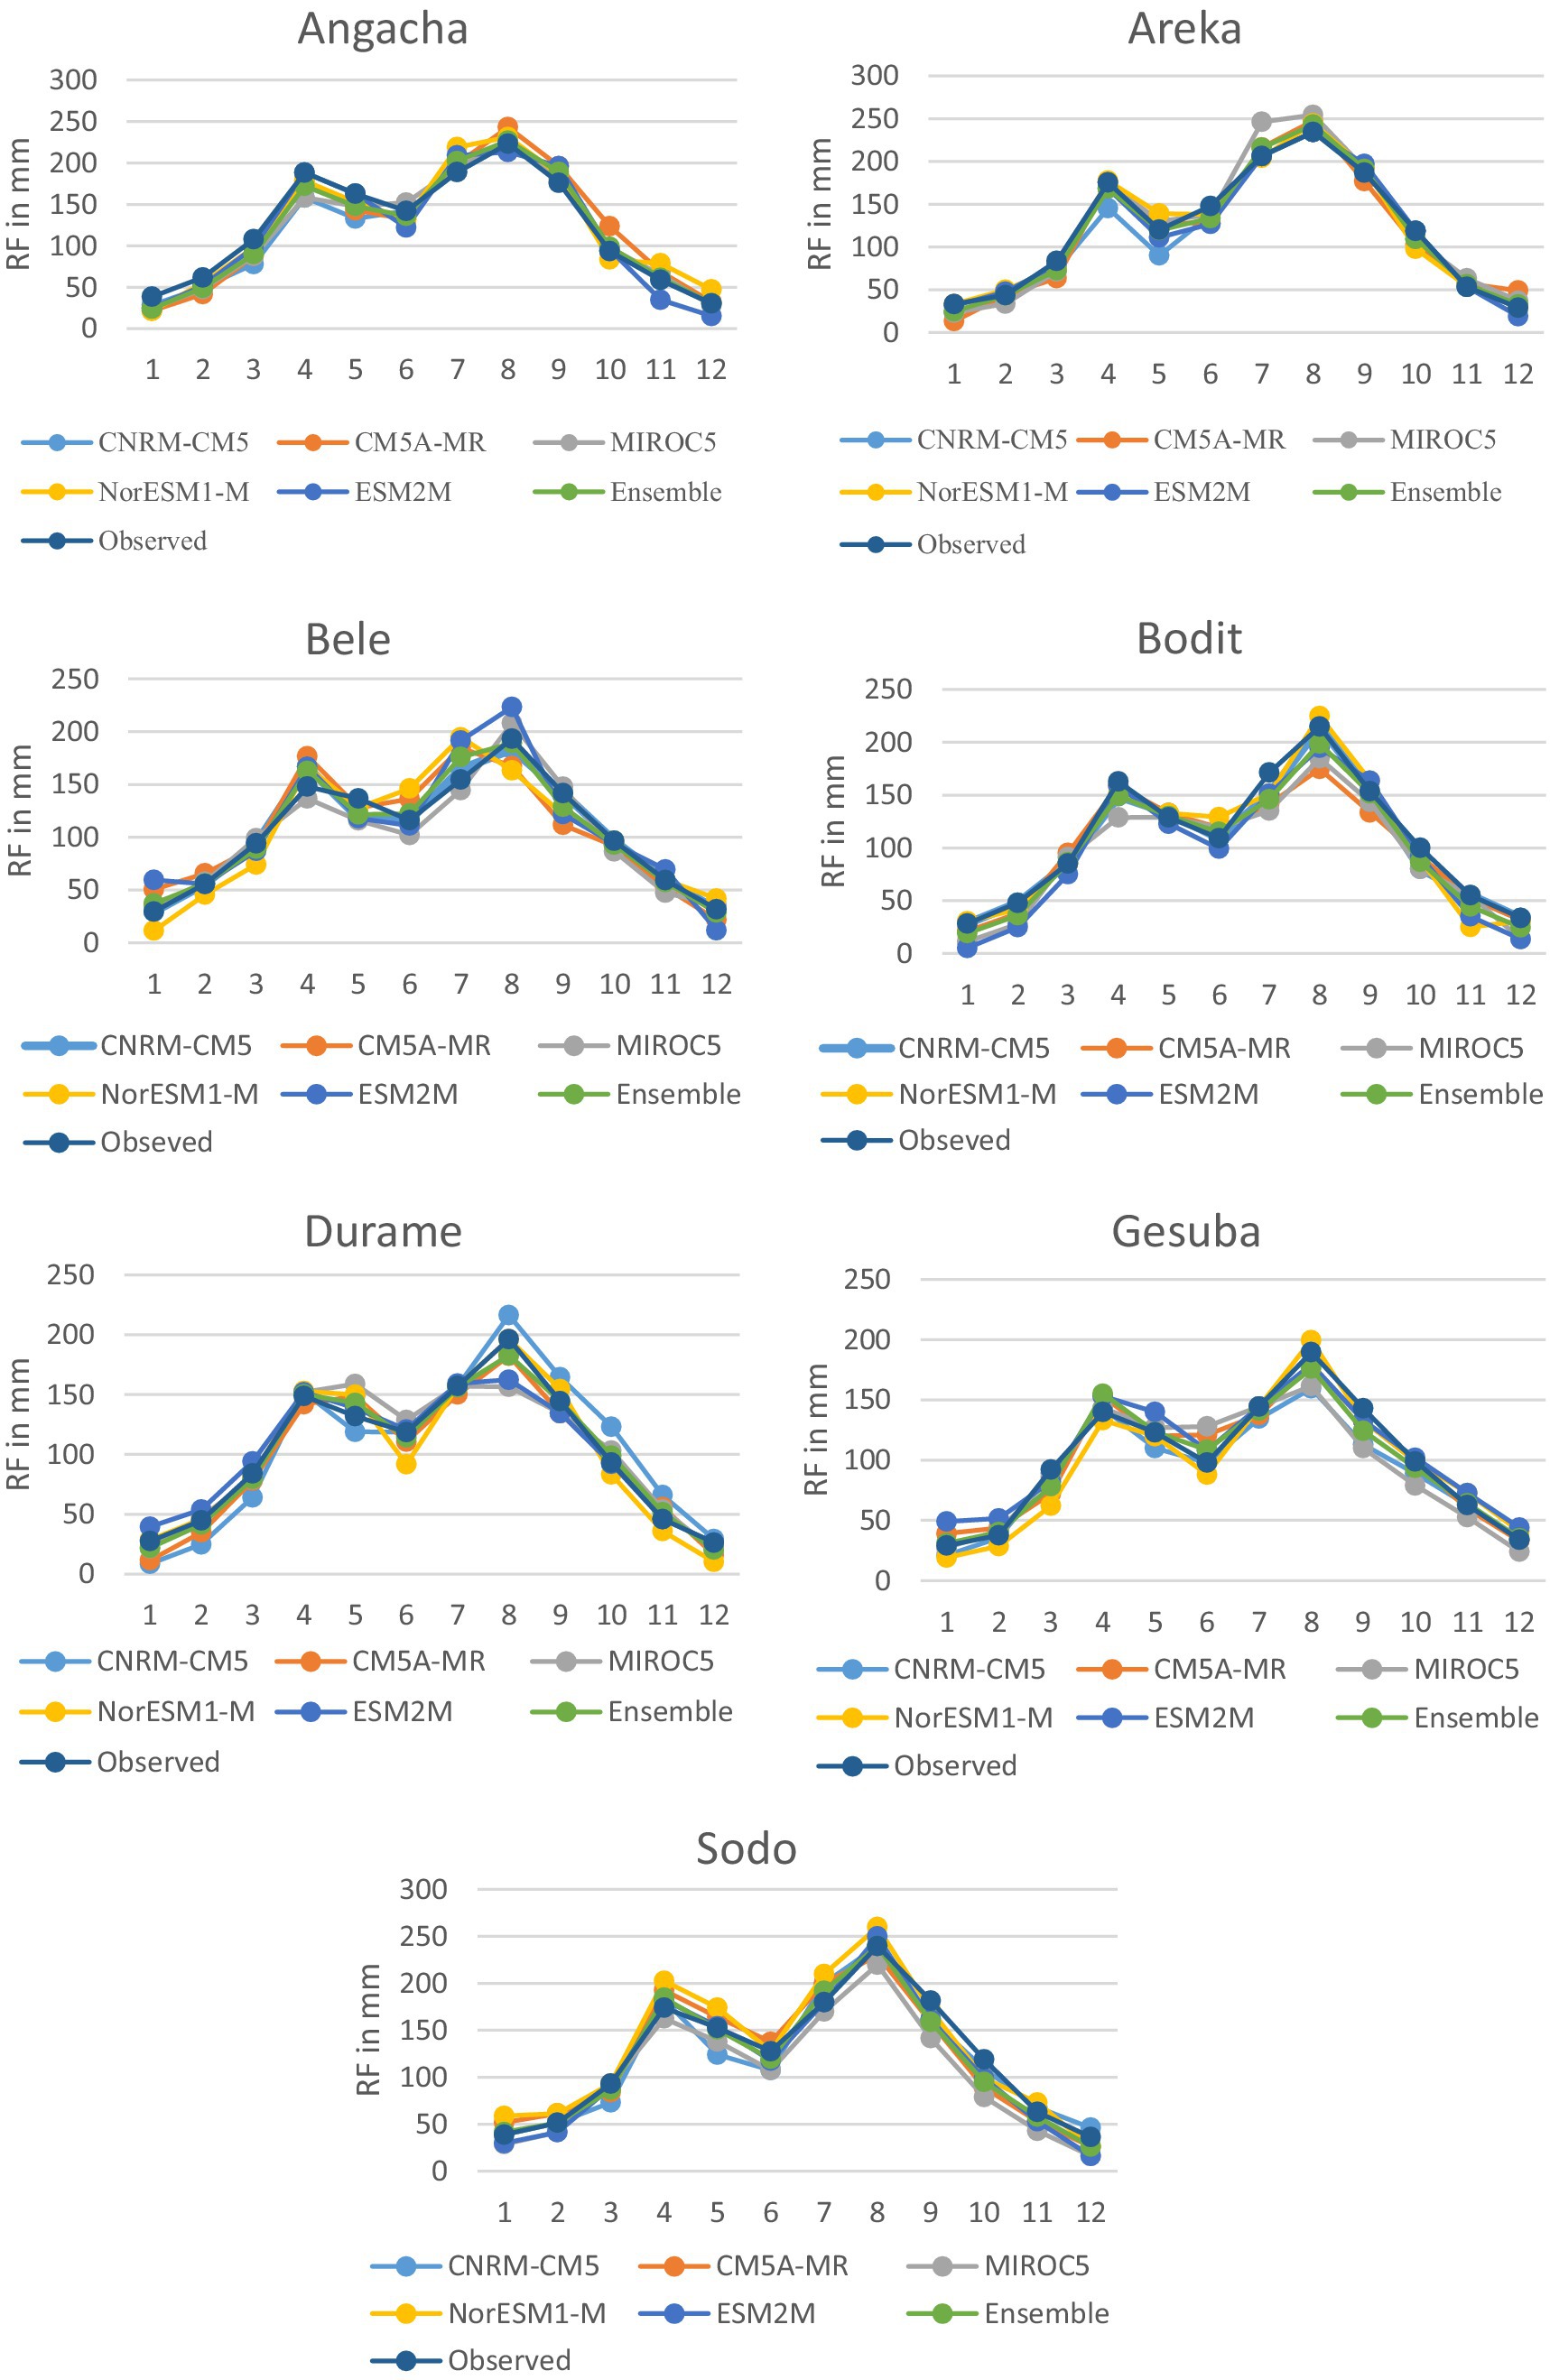
Figure 3. Mean monthly rainfall for the baseline and five driving-GCMs for seven meteorological stations.
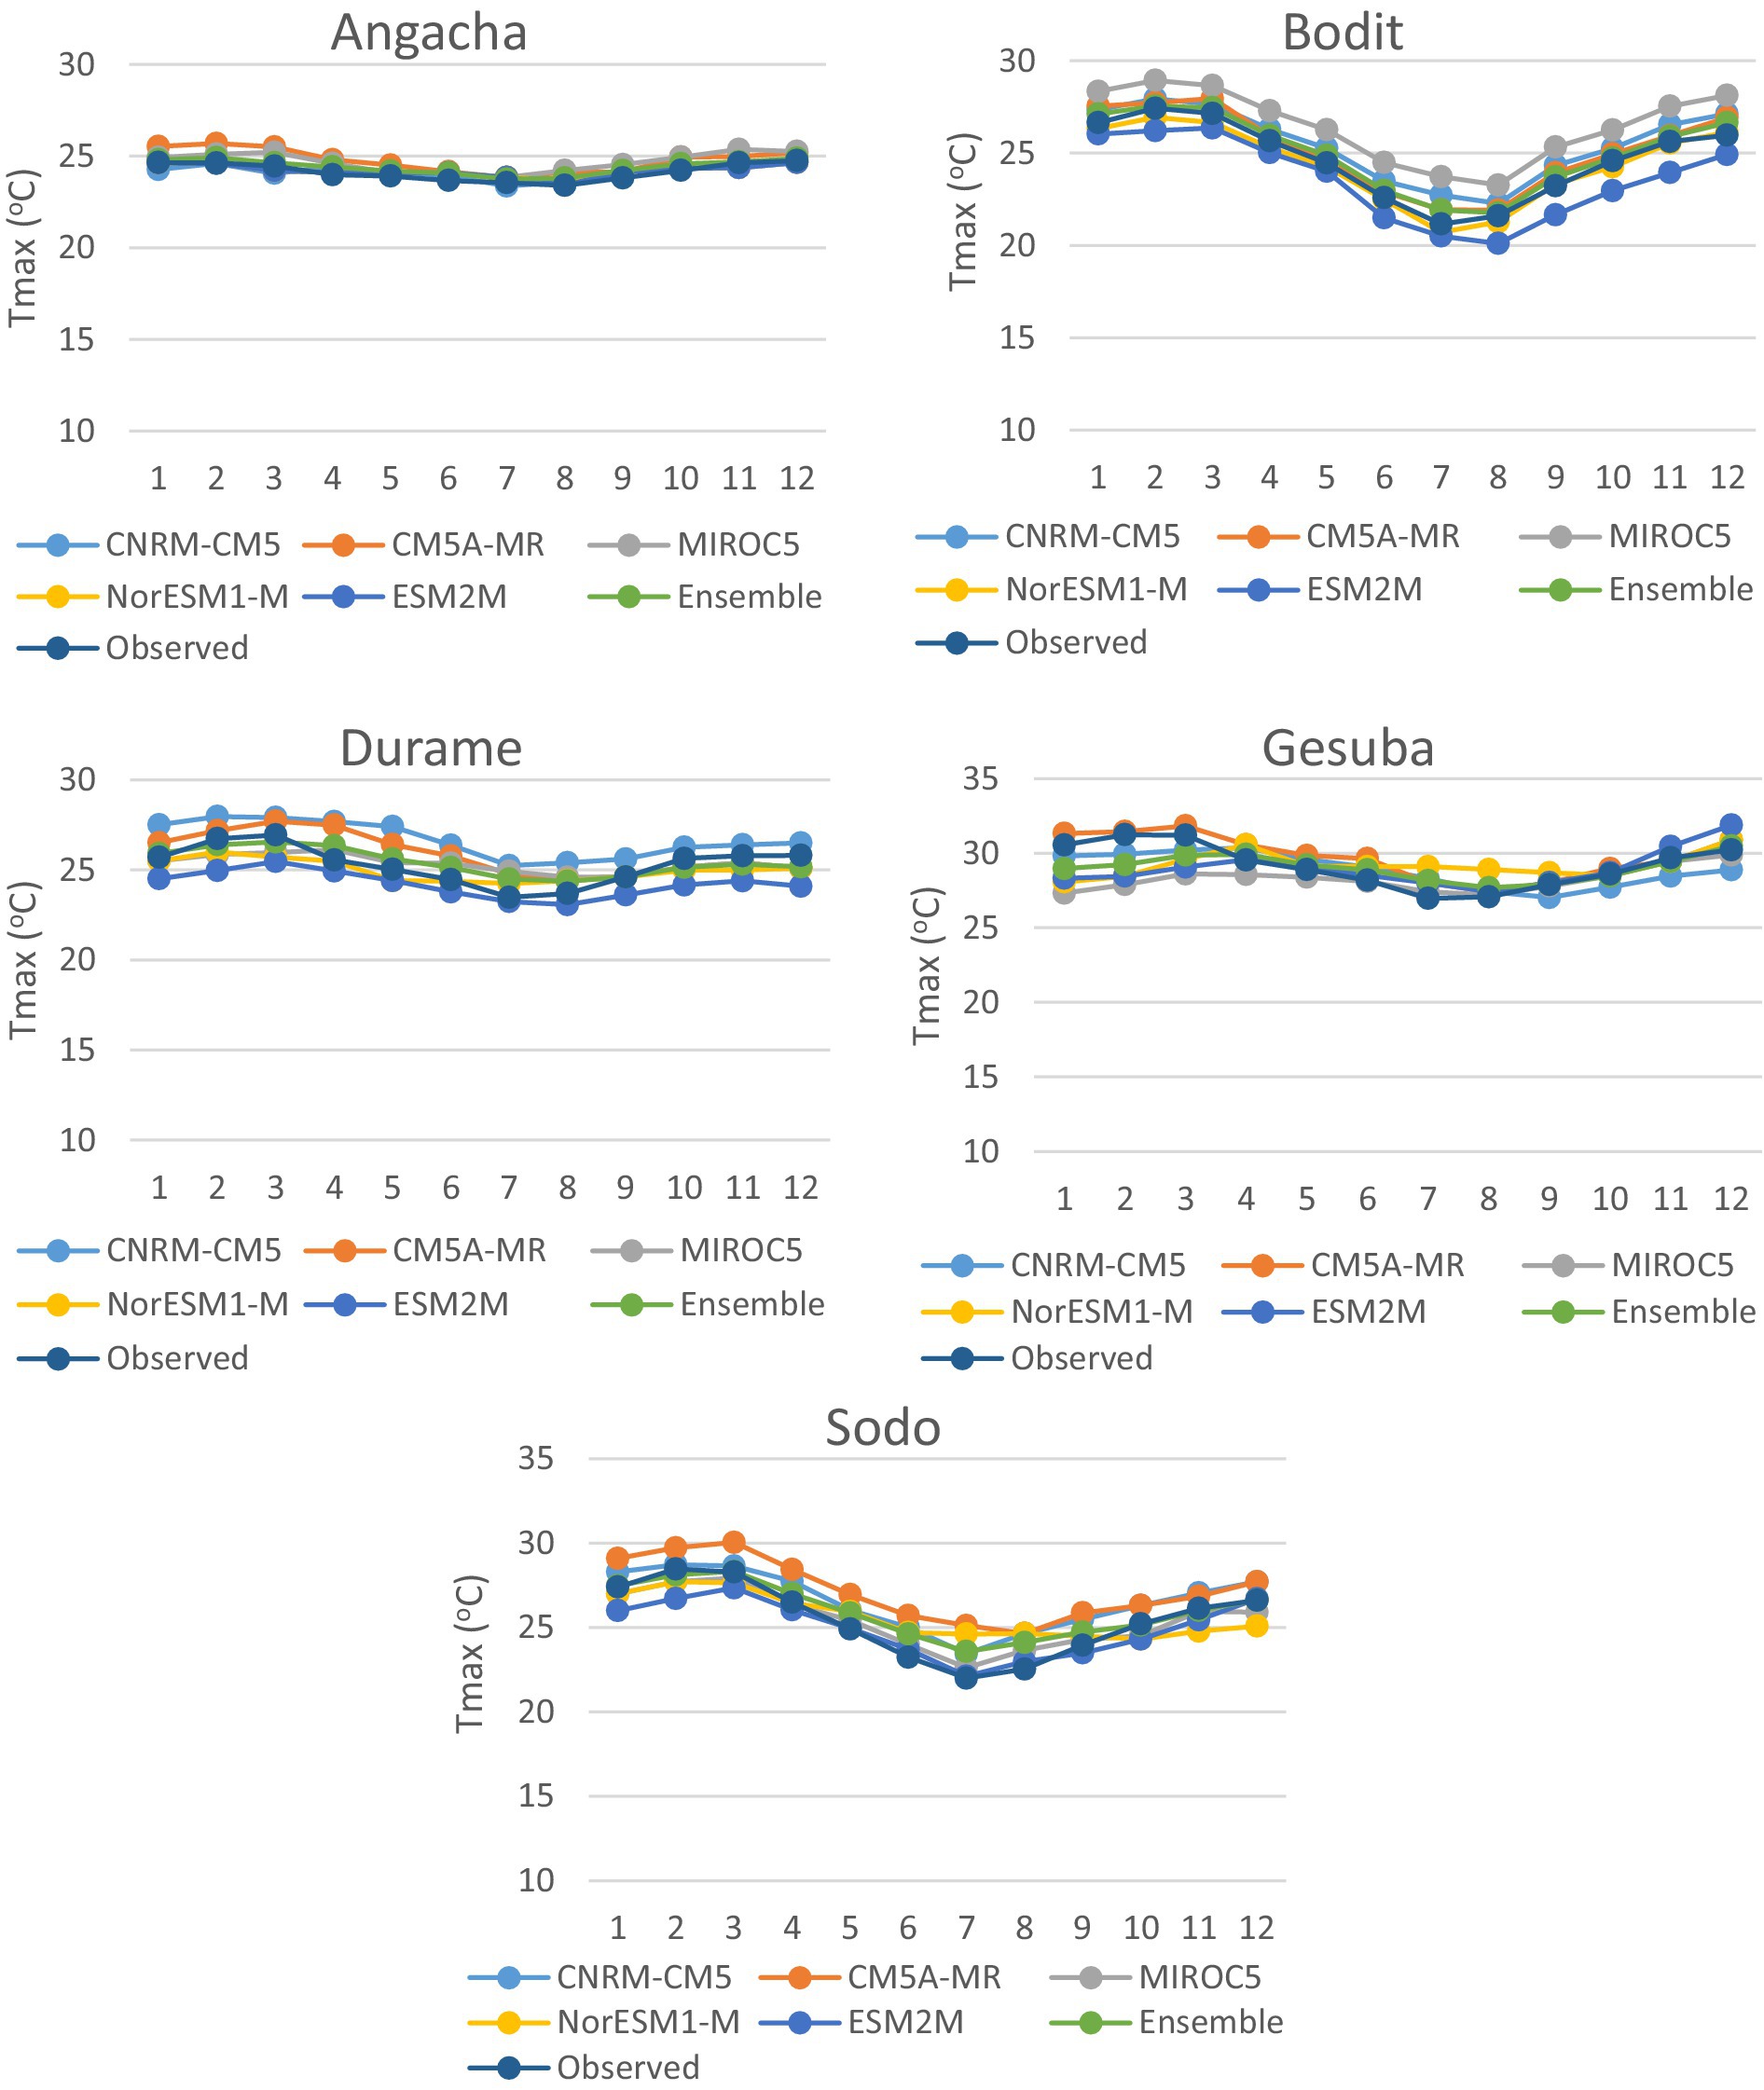
Figure 4. Mean monthly maximum temperature for baseline and five driving-GCMs for five meteorological stations.
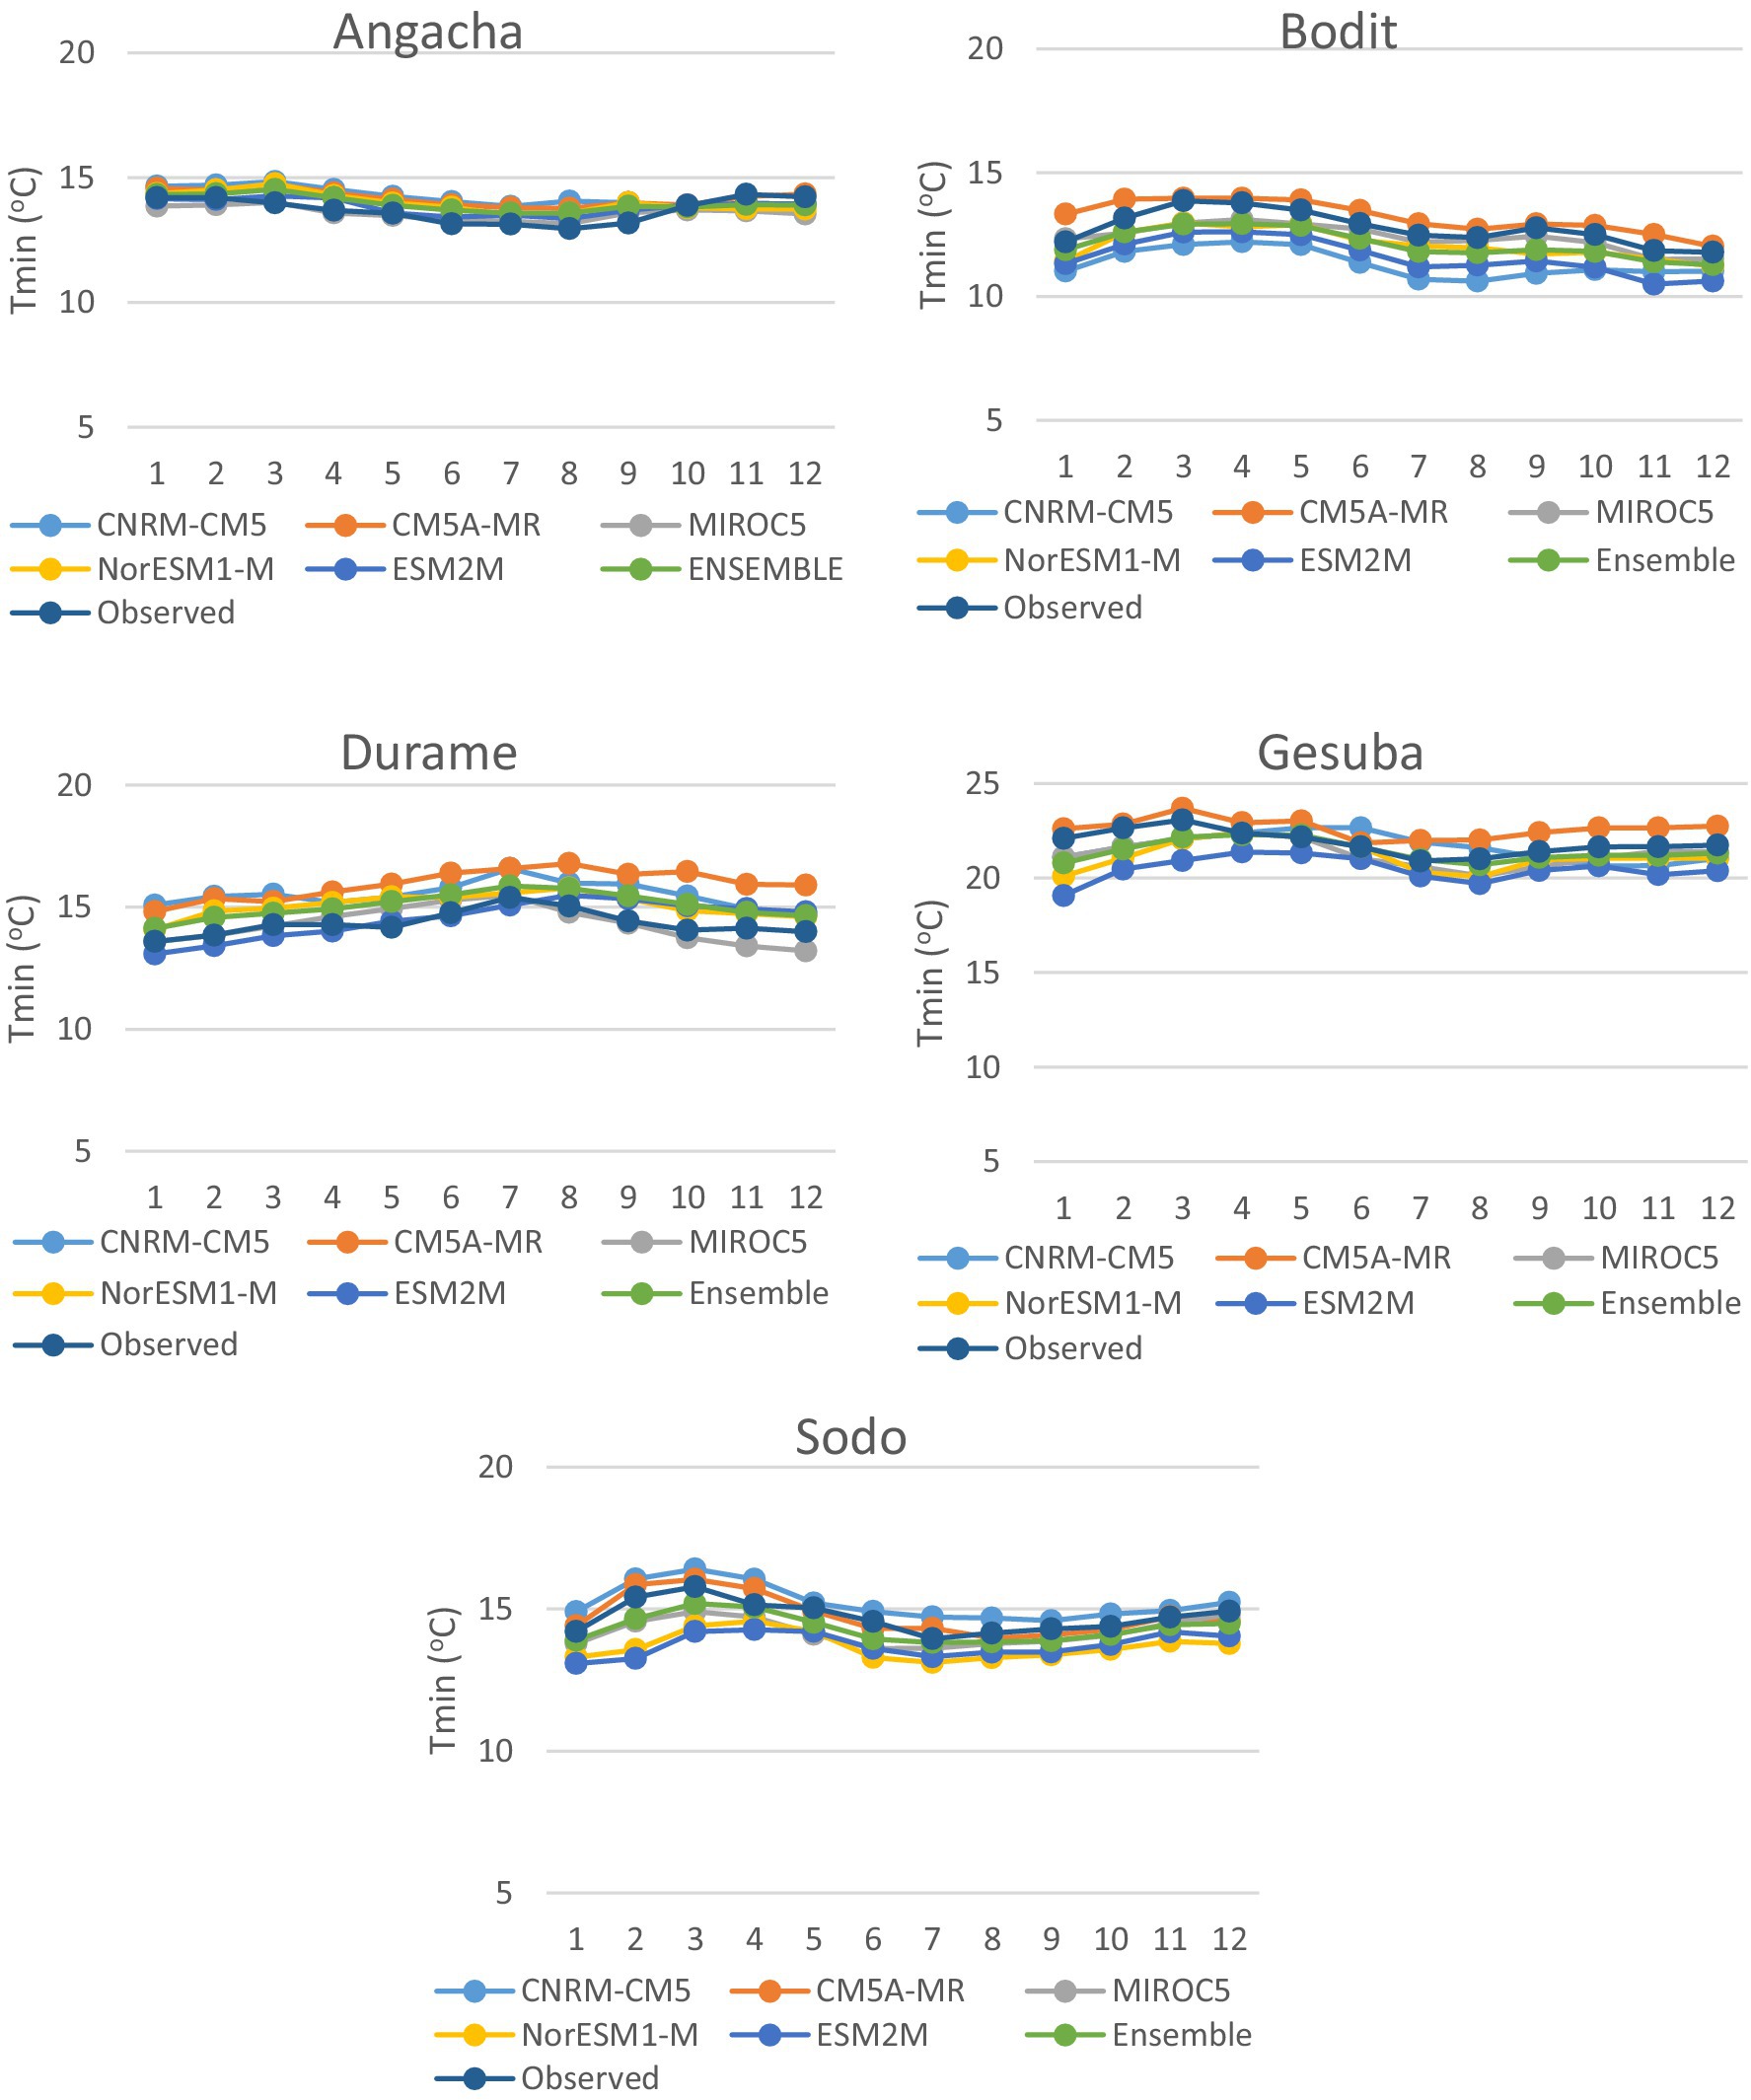
Figure 5. Mean monthly minimum temperature for baseline and five driving-GCMs for five meteorological stations.
Most studies used the reanalysis and monthly observation products without validating them with ground observational data (Okkan et al., 2024). Choosing a specific model for a given study area is subjective and difficult. Five driving-GCM models were evaluated in this study for the Ajora-Woybo watershed, and it was found that the rainfall and temperature data were in very good agreement with the baseline period observational datasets. Five driving-GCM model outputs were compared, and it was found that they had similar trends to the observed rainfall and temperature. As a result, the representation of the evaluated rainfall characteristics in the watershed is improved by the use of the ensemble mean rainfall and temperature simulation (Okkan et al., 2023). Based on the findings, multi-model simulations may be useful for climate change studies. For example, Demissie and Sime (2021) estimating multi-model averages of four GCMs revealed that, compared to the individual GCMs, the ensemble data fit the observed data more closely for both simulations of rainfall and air temperature. The study area experienced only minor inter-annual and seasonal variations in rainfall and air temperature.
3.2 The changes in predicted rainfall
In two upcoming study periods, projected annual rainfall under RCP4.5 and RCP8.5 emission scenarios was examined. The projected annual rainfall under the RCP4.5 and RCP8.5 emission scenarios showed an insignificantly declining trend (Figure 6). The majority of the climate change scenarios simulated a decrease in mean annual rainfall of the ensemble driving-GCMs with a consistent agreement for two periods of the 2040’s and 2070’s. A non-significant (p > 0.05) change of total annual rainfall is projected in all stations under both RCPs periods. Results show that at some stations annual rainfall decreased by up to 8.4% (at Bele) during RCP8.5 (2040’s), 3.8% (at Gesuba) during RCP4.5 (2040’s), and 3.7% (at Angacha) during RCP4.5 (2070’s) (Tables 5, 6). Rainfall is predicted to decrease less under the RCP 4.5 climate change scenario than it is under the RCP 8.5 emissions scenario. The projected annual rainfall is also expected to decrease over the period 2070’s in RCP8.5, then in RCP4.5. However, different GCMs exhibit different levels and patterns of change.
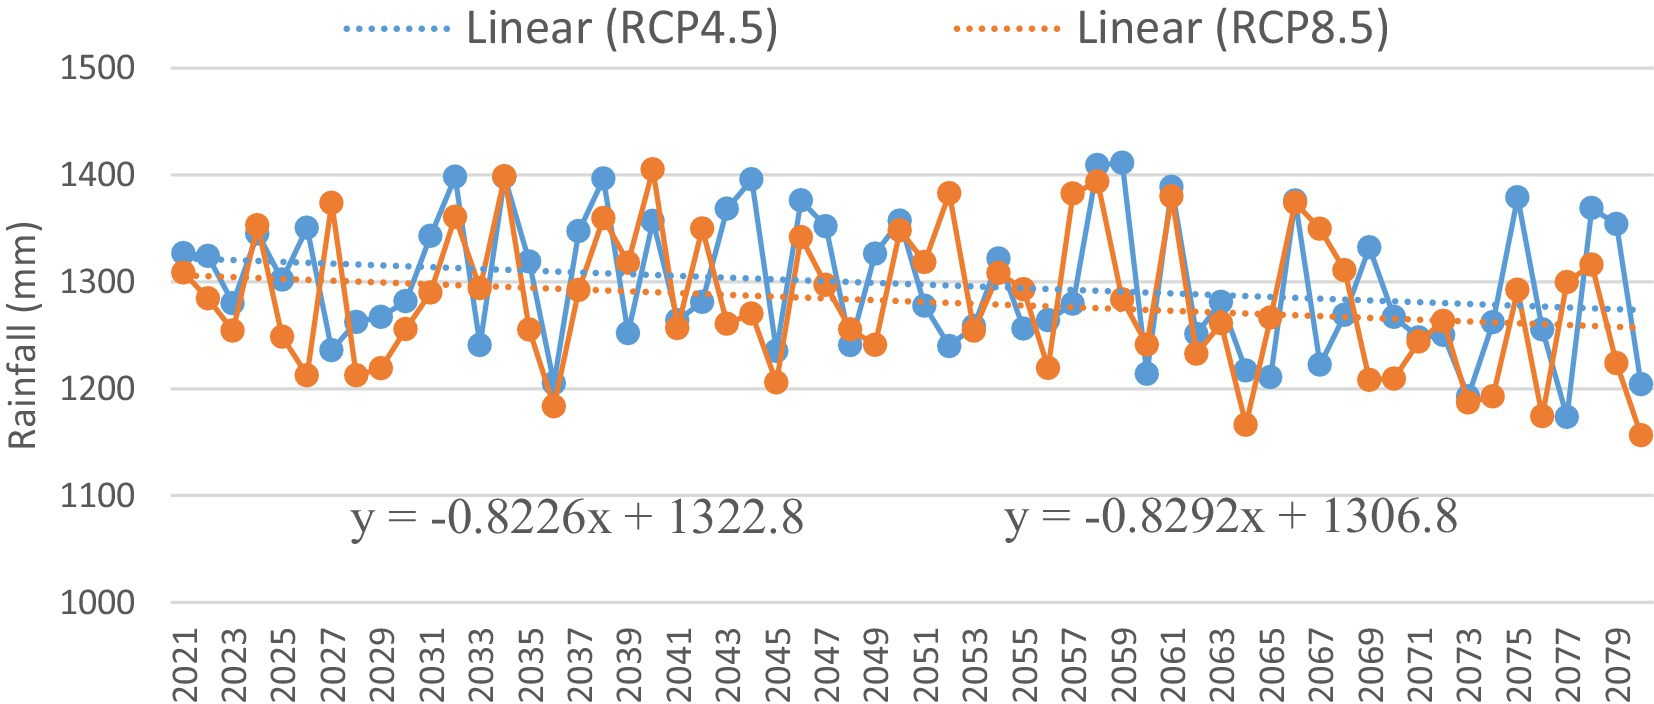
Figure 6. Projected change in mean annual RF under RCP4.5 and 8.5 emission scenarios during 2021–2080.
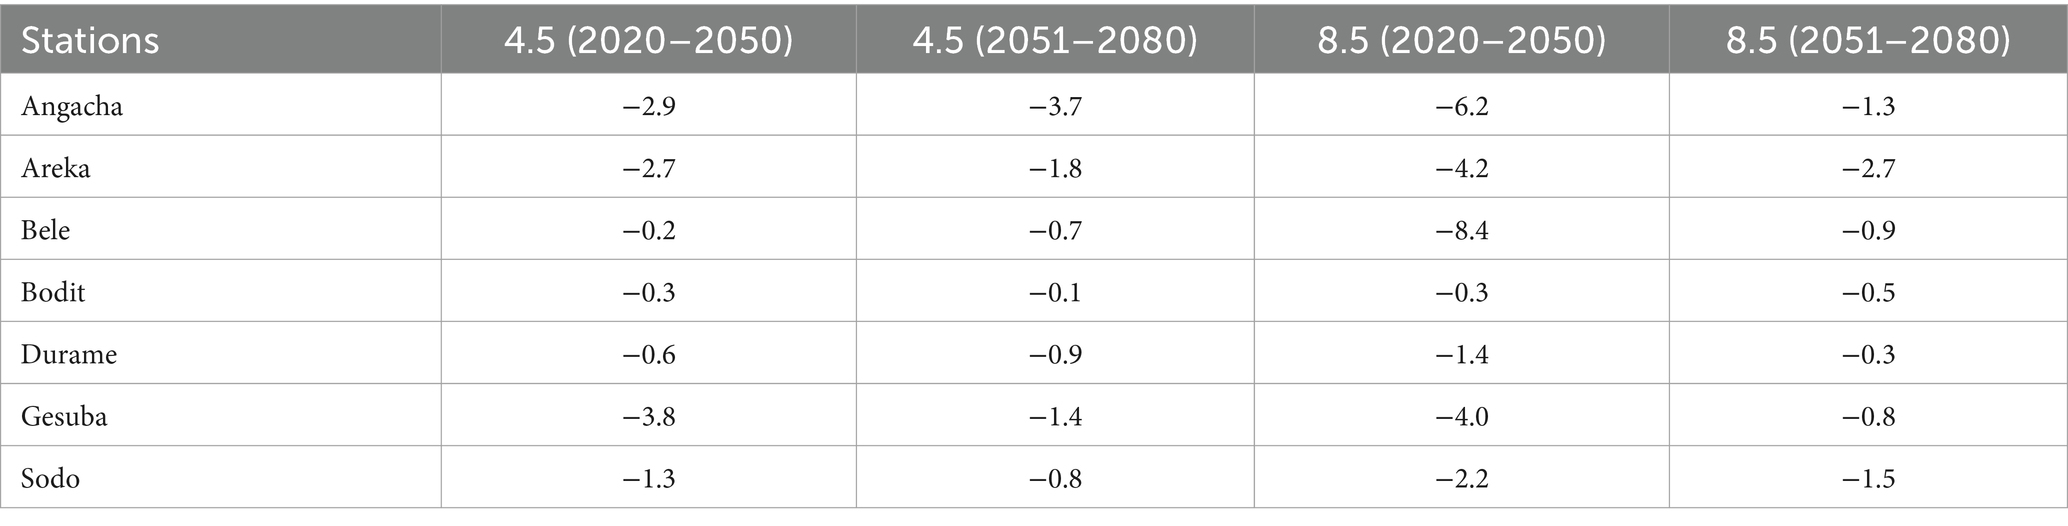
Table 5. Mean annual percentage of RF under RCP 4.5 and RCP 8.5 scenario as compared to the baseline period.
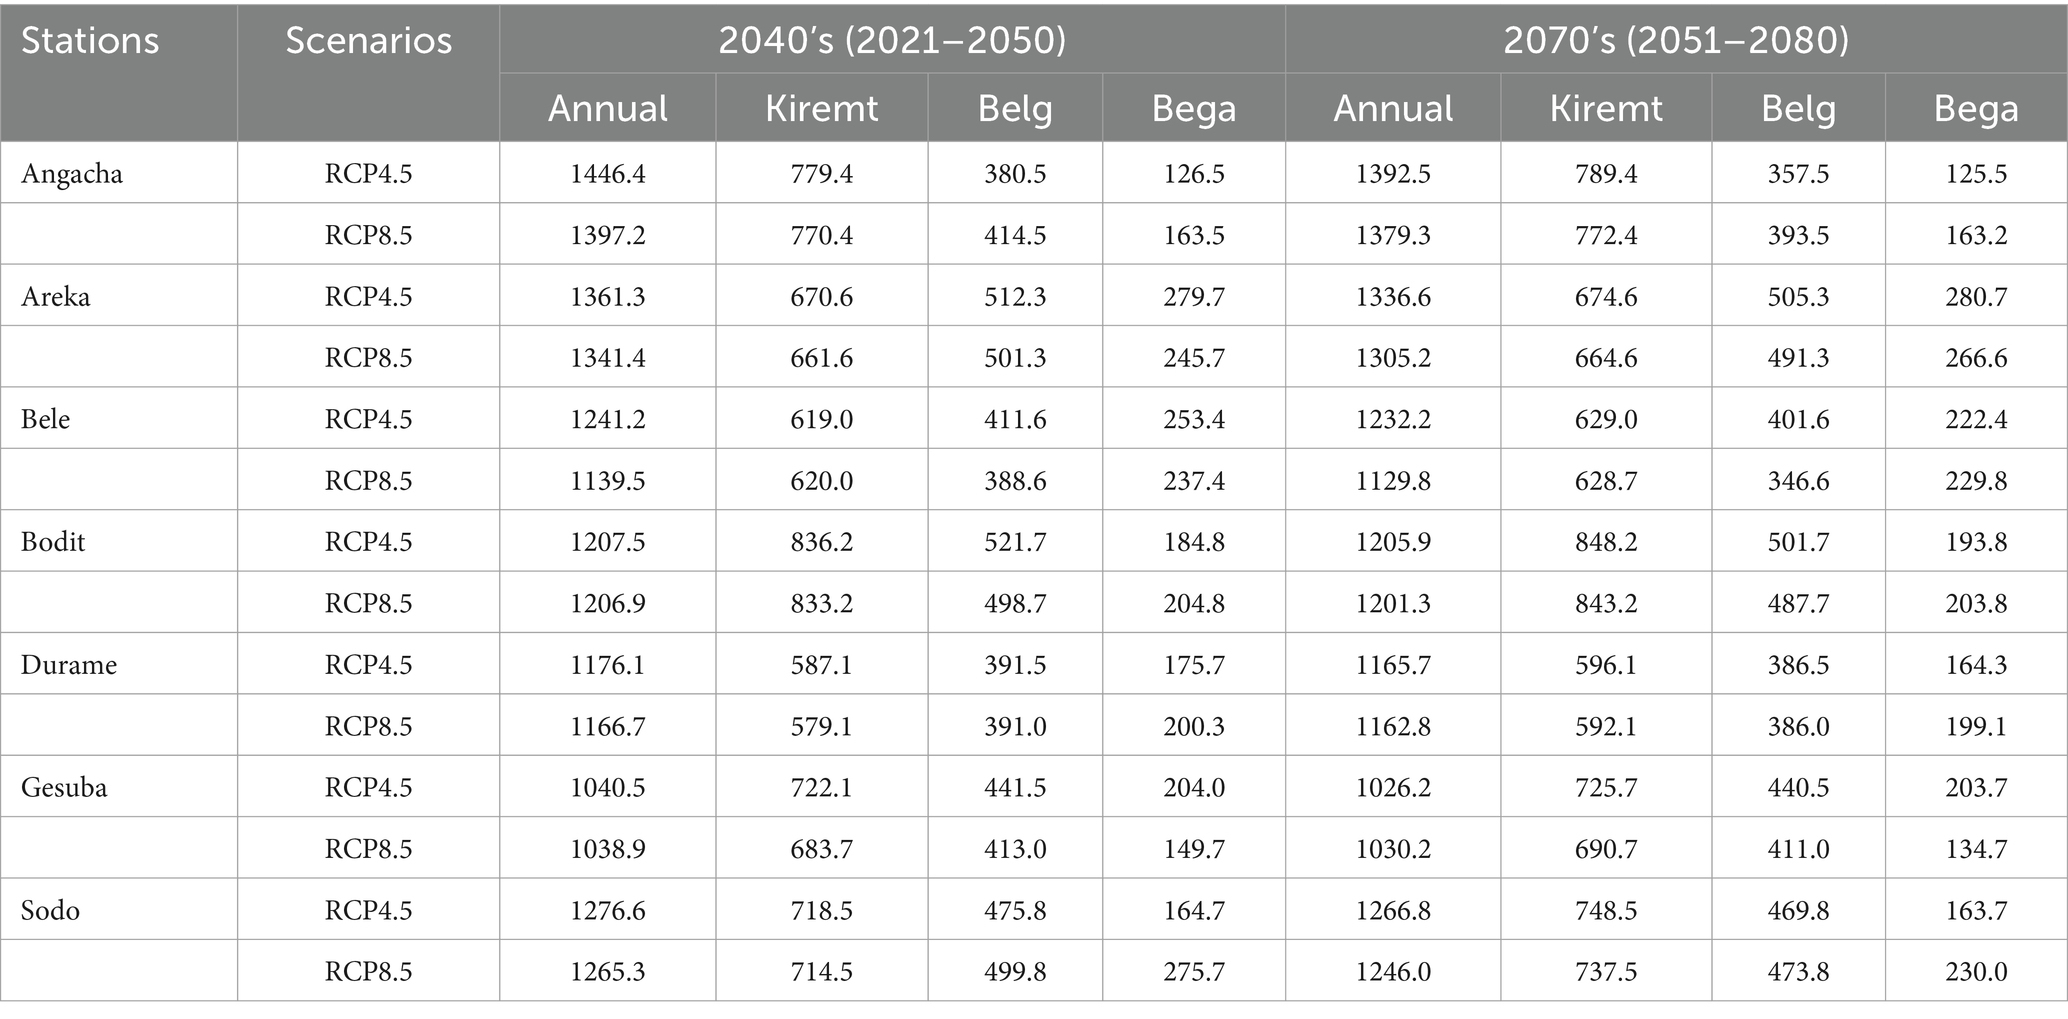
Table 6. Projected mean annual and seasonal RF (mm) across stations in Ajora-Woybo watershed.
During the 2040’s and 2070’s, a decrease in mean monthly rainfall was observed in the months of February, March, April, May, June, October, and November for the RCP 4.5 and 8.5. In the 2040’s and 2070’s, ensemble driving-GCMs scenarios showed an increase in rainfall in the months of July, August, and September in all stations for the RCP 4.5 and 8.5 scenarios. On the other hand, the reduction of ensemble GCMs scenarios showed a decrease in rainfall in the Belg and Bega (except at Areka and Bodit stations) seasons (Figures 7–9). In the Ajora-Woybo watershed, the main rainy season lasts from June to August, and the minor rainy season is from February to May. The most significant rainy seasons in the watershed are those mentioned above. They have a significant impact on current annual rainfall and seasonal distribution, as well as acting as a major precipitation source and hydrological driver. Besides, the results pointed out that the alteration of rainfall patterns depended on the seasonality of the watershed. Supporting the present study’s findings, Intergovernmental Panel on Climate Change (IPCC) reported an increase of precipitation in rainy seasons with heavy precipitation events over the world (IPCC, 2014).
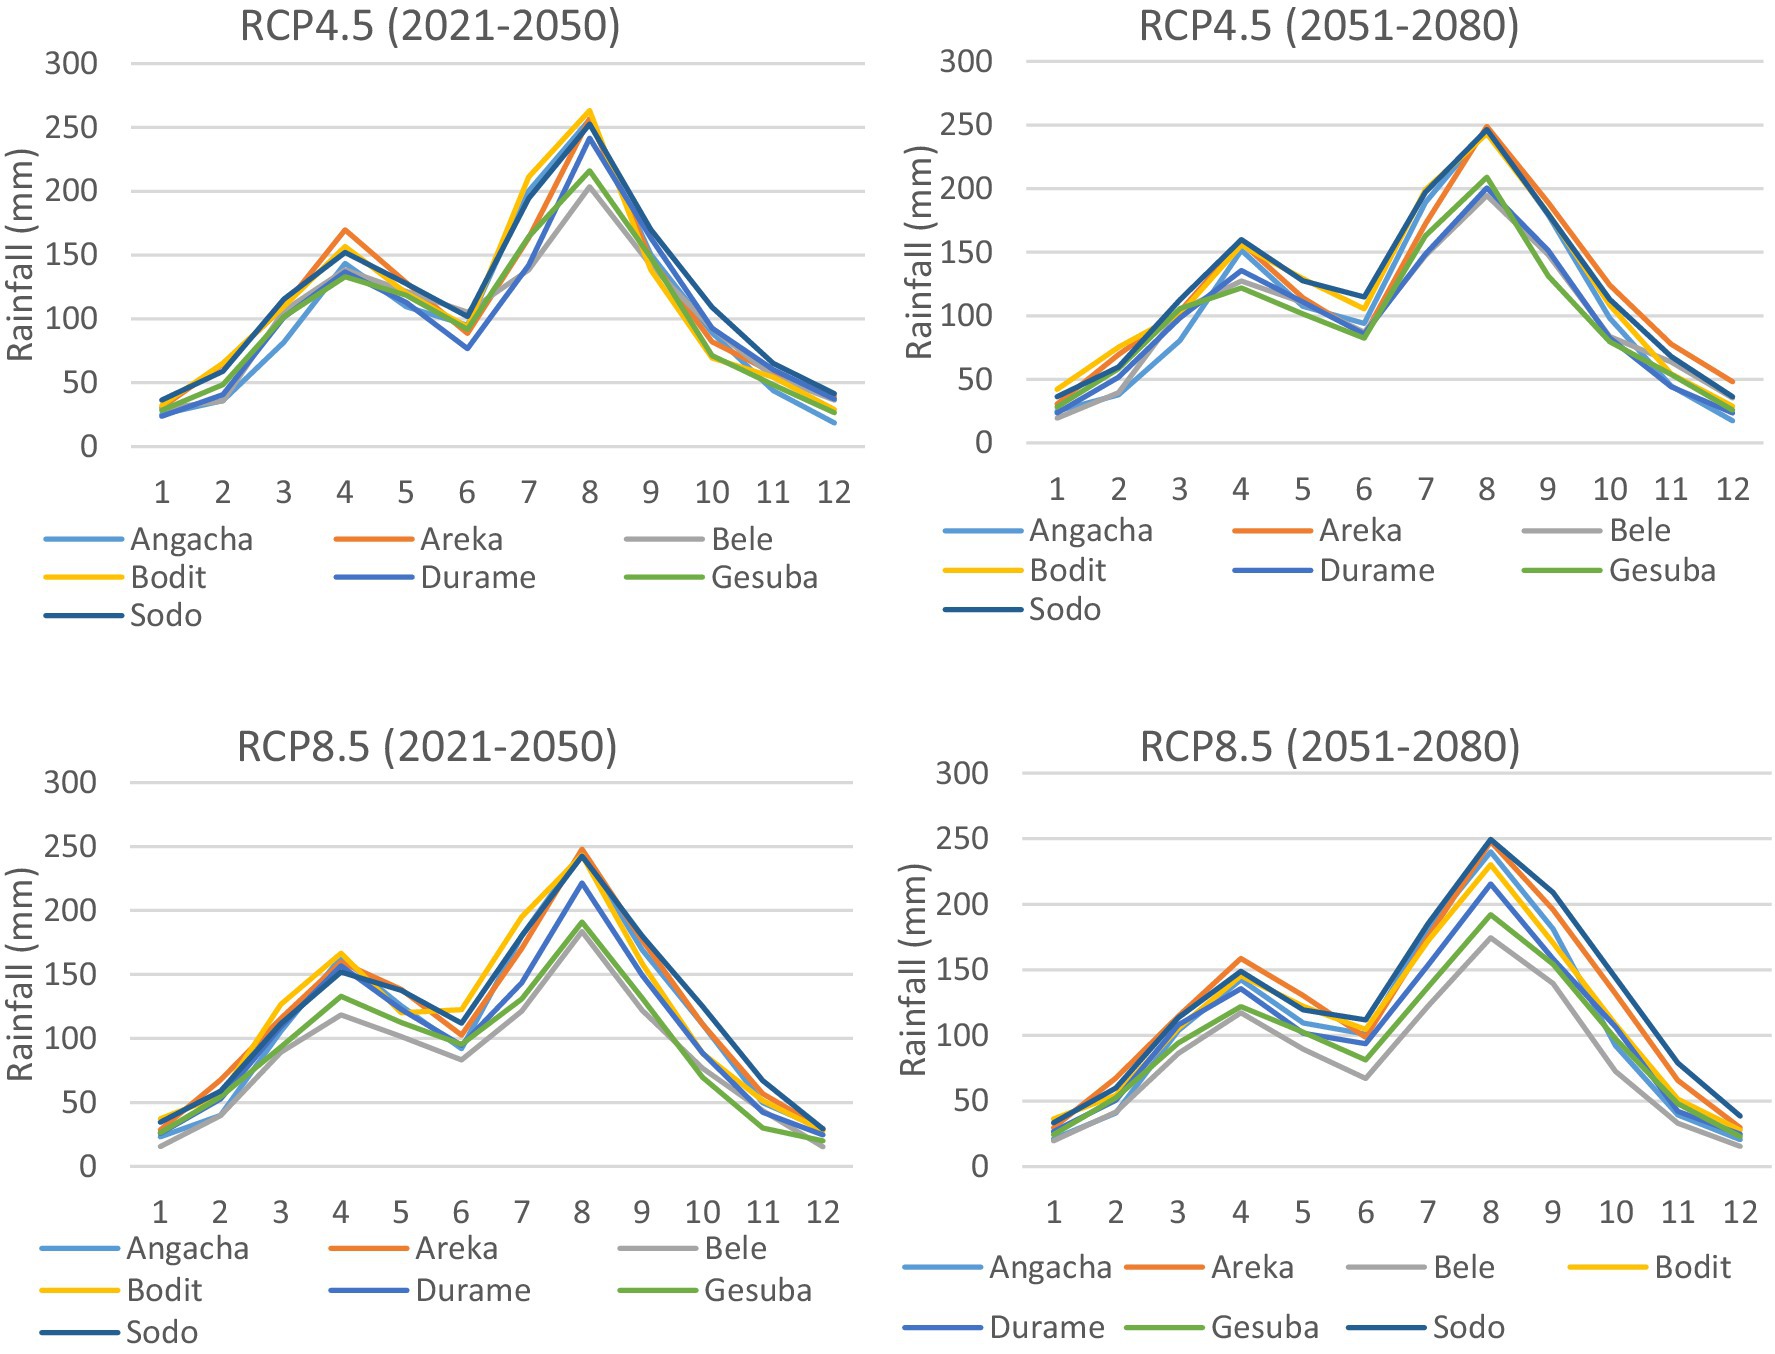
Figure 7. Projected change in mean monthly cycle of rainfall under RCP4.5 and 8.5 emission scenarios during 2021–2080.
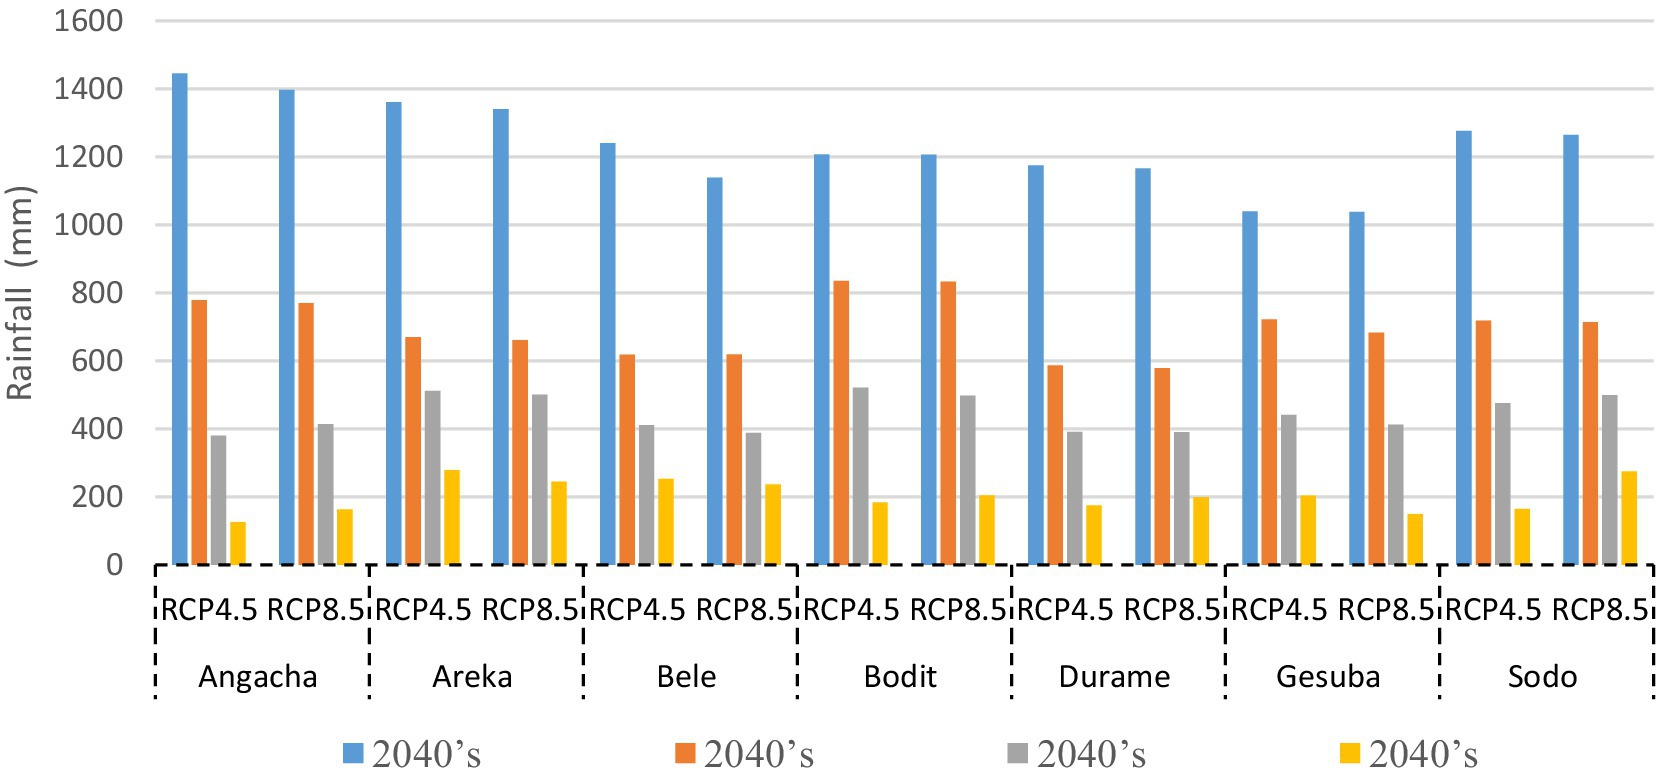
Figure 8. Projected mean annual and seasonal RF (2040’s) across stations in Ajora-Woybo watershed.
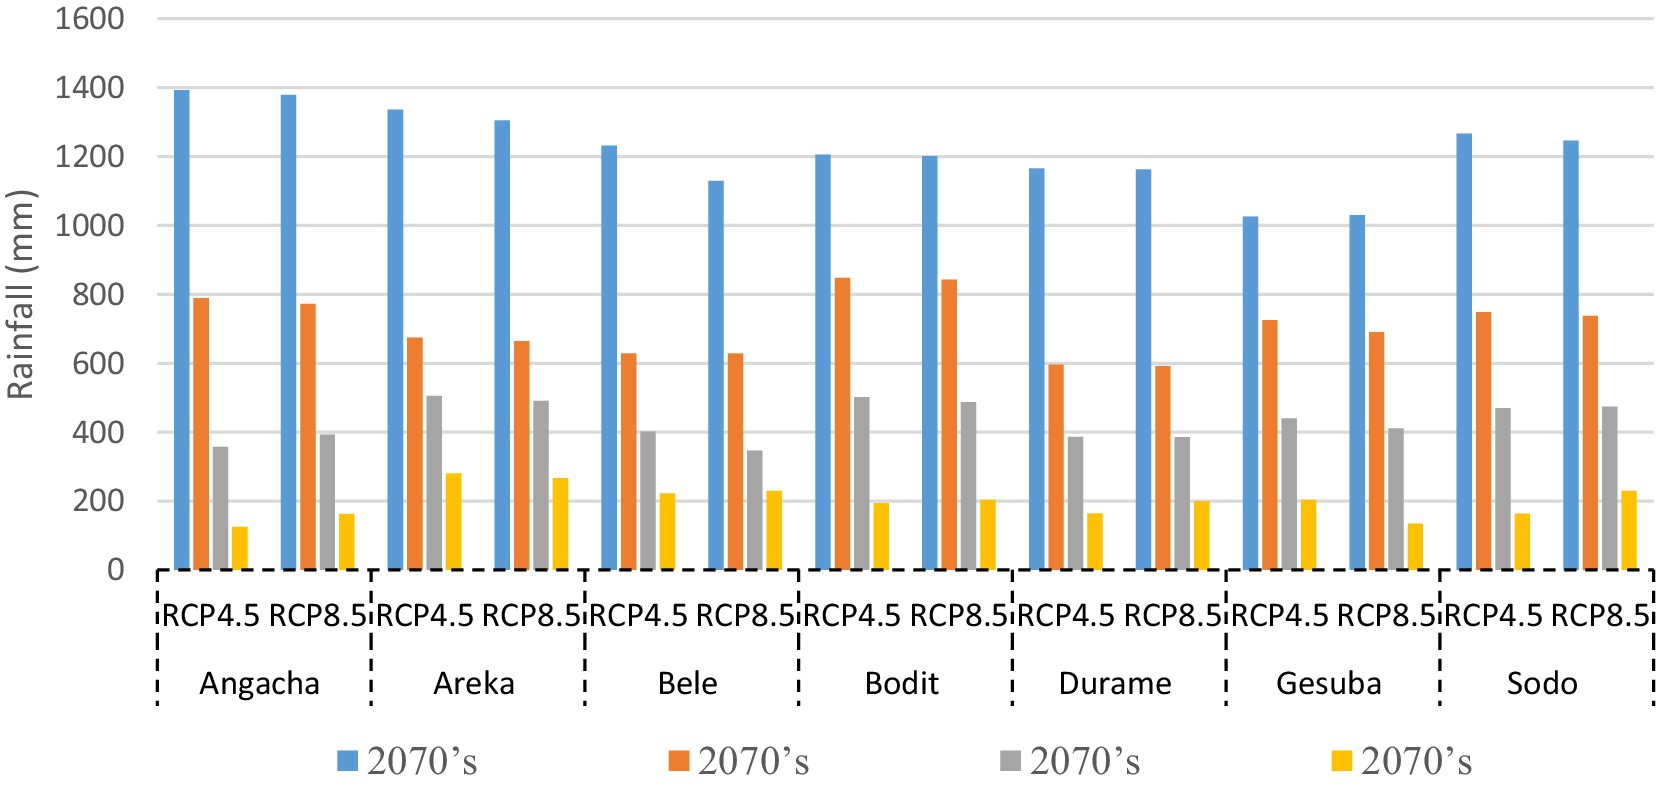
Figure 9. Projected mean annual and seasonal RF (2070’s) across stations in Ajora-Woybo watershed.
Because there have been few studies in the Ajora-Woybo watershed, it was difficult to compare the findings to previous research. There are some climate change studies in the Omo-Gibe basin, which includes the Ajora-Woybo watershed, which provide some insight into how climate change may unfold in the Ajora-Woybo watershed. Climate change studies in the Omo-Gibe basin, on the other hand, produced conflicting results in terms of future rainfall. This is because predicting rainfall is difficult due to the complex atmospheric processes that influence it. To combat such uncertainties we used multi-model to hydro-climatic change study in the Ajora-Woybo watershed. Some authors (e.g., Ayana et al., 2017; Orkodjo et al., 2022) used similar methods as we did, but they argue that determining the direction and magnitude of rainfall change in the basin at the regional and sub-basin scales is difficult. For example, Orkodjo et al. (2022) and Ayana et al. (2017) showed decreasing trend of rainfall in the future using RCP scenarios of 4.5 and 8.5. Contrariwise, Chaemiso et al. (2016) showed increasing trend of rainfall in the future with percentage change of 2000–2030’s by 5.6 and 2030–2090’s by 11.4 in Omo-Gibe basin. In other basins of Ethiopia, by Emiru et al. (2021) showed increasing trend of rainfall in the future in all projected stations in the upper Awash basin. They conclude increases in mean annual rainfall range from 1.8% at Addis Ababa to 45.5% over the Hombole area station.
We can learn more about what to anticipate and how to manage the effects of climate change, the available water resources, and future water availability by analyzing changes in trends in past, present, and future climate variable data. Except for the Kiremt season, which shows an increasing trend with a statistically insignificant level, the annual and seasonal rainfall projections for the two-time windows near (2021–2050) and mid future (2051–2080) generally show a decreasing trend. Belg, as one of Ethiopia’s major agricultural regions, is overwhelmingly important in the Ajora-Woybo watershed because it produces more than 65% of crop production at this time of year [CSA (Central Statistical Agency), 2020]. The declining rainfall pattern will have serious consequences for agricultural productivity and environmental sustainability. Rainfall reductions, combined with the highly variable nature of rainfall, are expected to have a significant impact on agricultural production as well as the water sector of the watershed. Furthermore, the area’s economic reliance on agriculture, combined with the predominant rain-fed nature of the farming system, makes it particularly vulnerable to climate variability and change.
3.3 The changes in predicted temperature
The mean annual maximum temperature (Tmax) and minimum temperature (Tmin) for each driving-GCM, as well as the ensemble mean based on all of the driving-GCMs, are presented in Figures 10, 11 and Tables 7–9. According to all five and ensemble driving-GCMs, the mean annual Tmax and Tmin are expected to rise relative to the baseline at all stations. Additionally, in this study, the RCP4.5 and RCP8.5 scenarios both predict that the average monthly temperature will rise. In comparison to the baseline (1990–2020), mean monthly temperatures are anticipated to rise in the near (2021–2050) and mid (2051–2080) centuries. The highest emission scenario, RCP8.5, had a greater change in the trend of the Tmax and Tmin at the end of the 2040’s and 2070’s than the RCP4.5 scenario. As can be seen, under RCP4.5 and RCP8.5, the Tmax and Tmin of the Ajora-Woybo watershed are likely to warm up more than they did in the 2010’s.
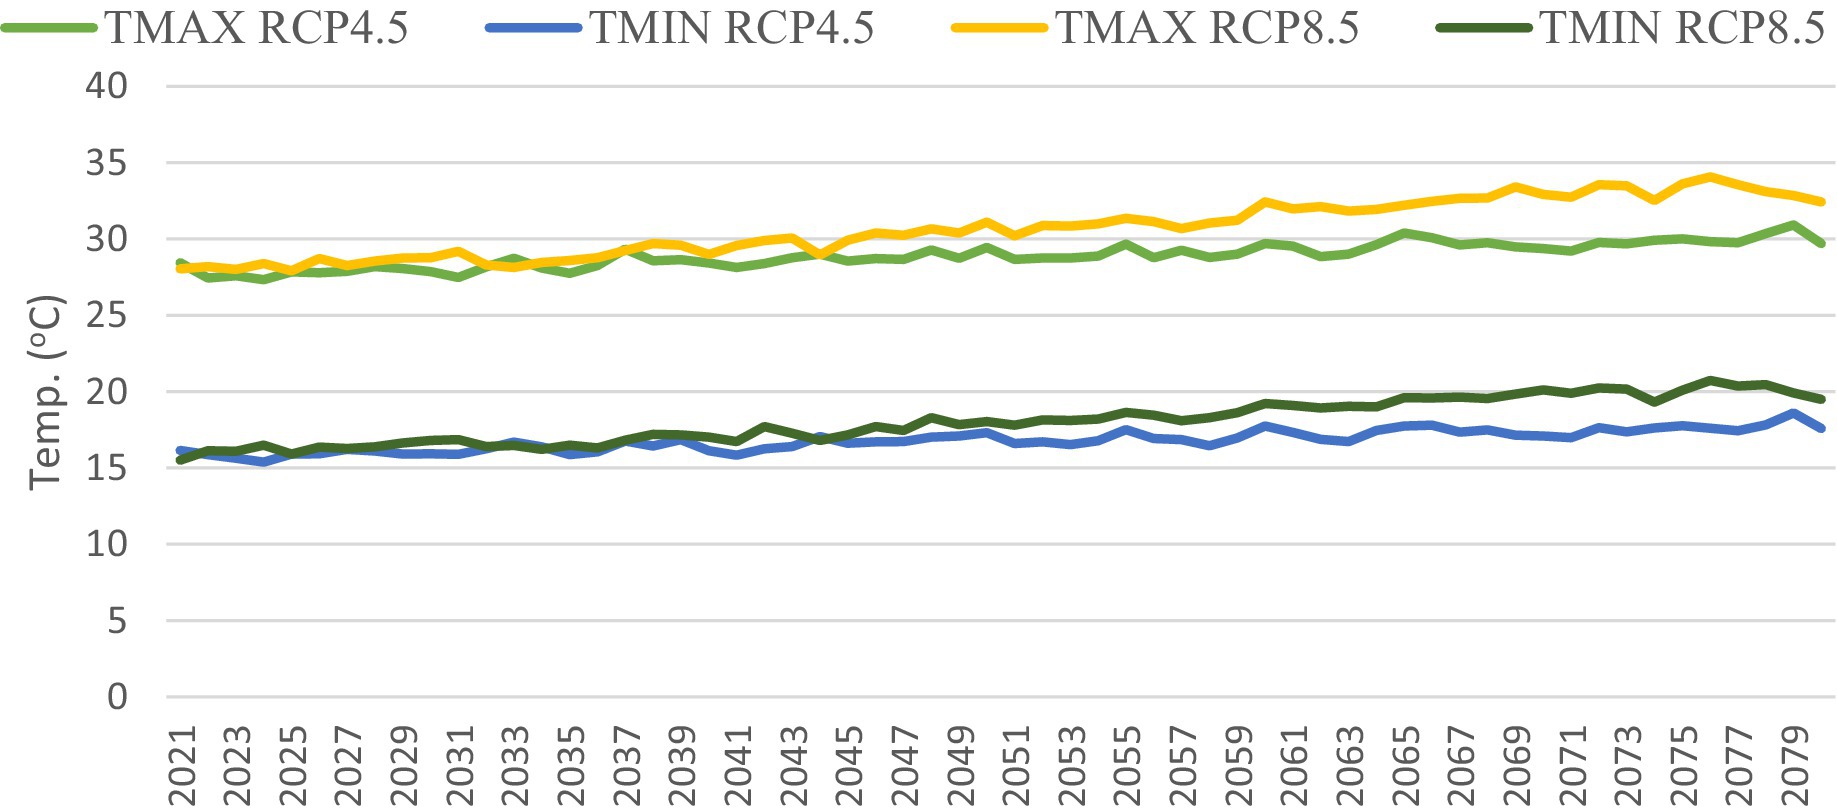
Figure 10. Projected change in mean annual Tmax and Tmin under RCP4.5 and 8.5 emission scenarios during 2021–2080.
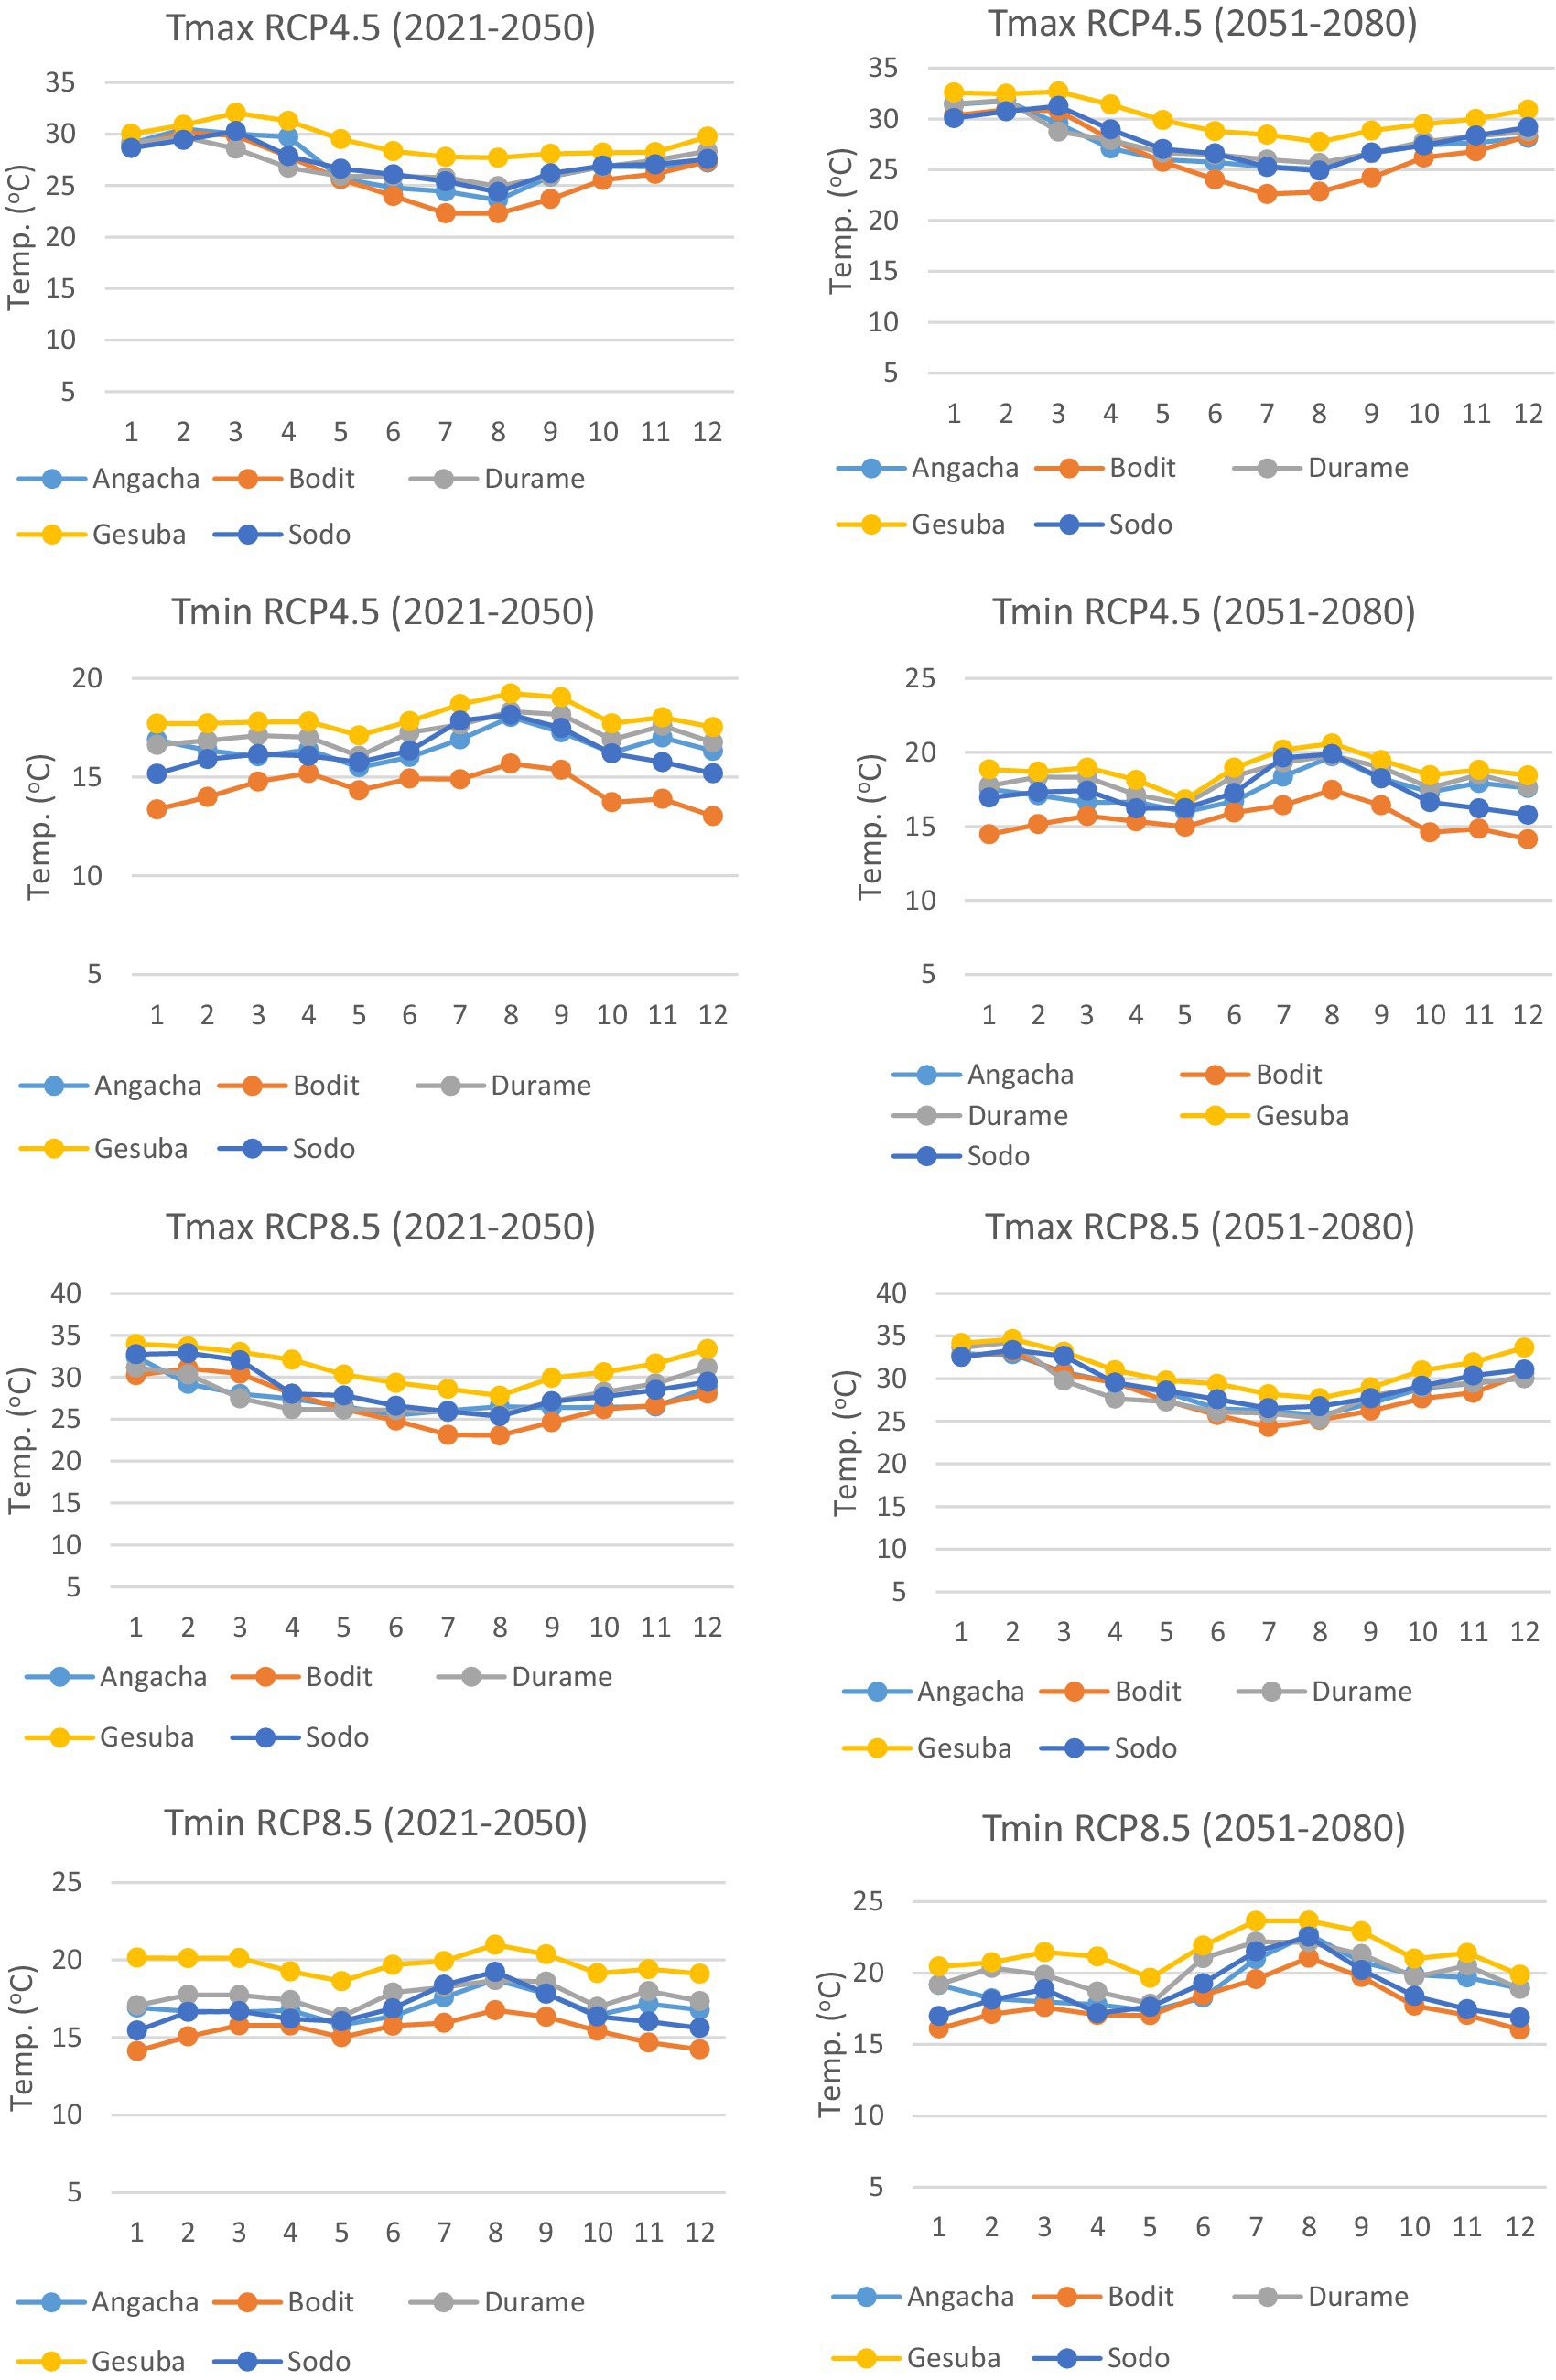
Figure 11. Projected change in mean monthly temperature under RCP4.5 and 8.5 emission scenarios during 2021–2050 and 2051–2080.
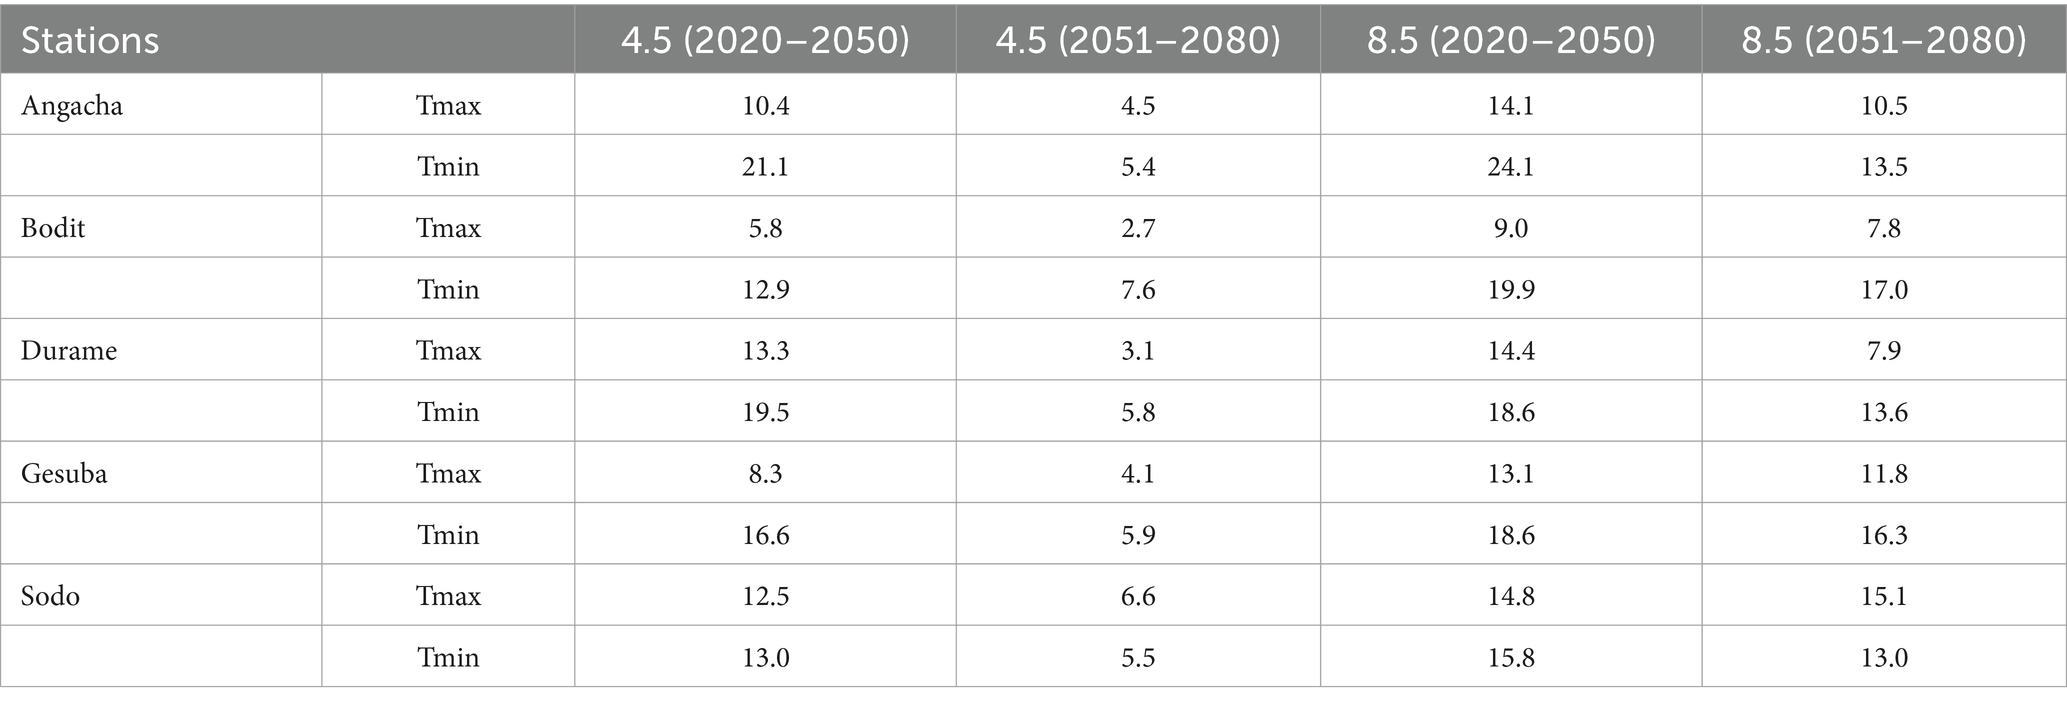
Table 7. Projected mean annual percentage of temperature under RCP 4.5 and RCP 8.5 scenario as compared to the baseline period.
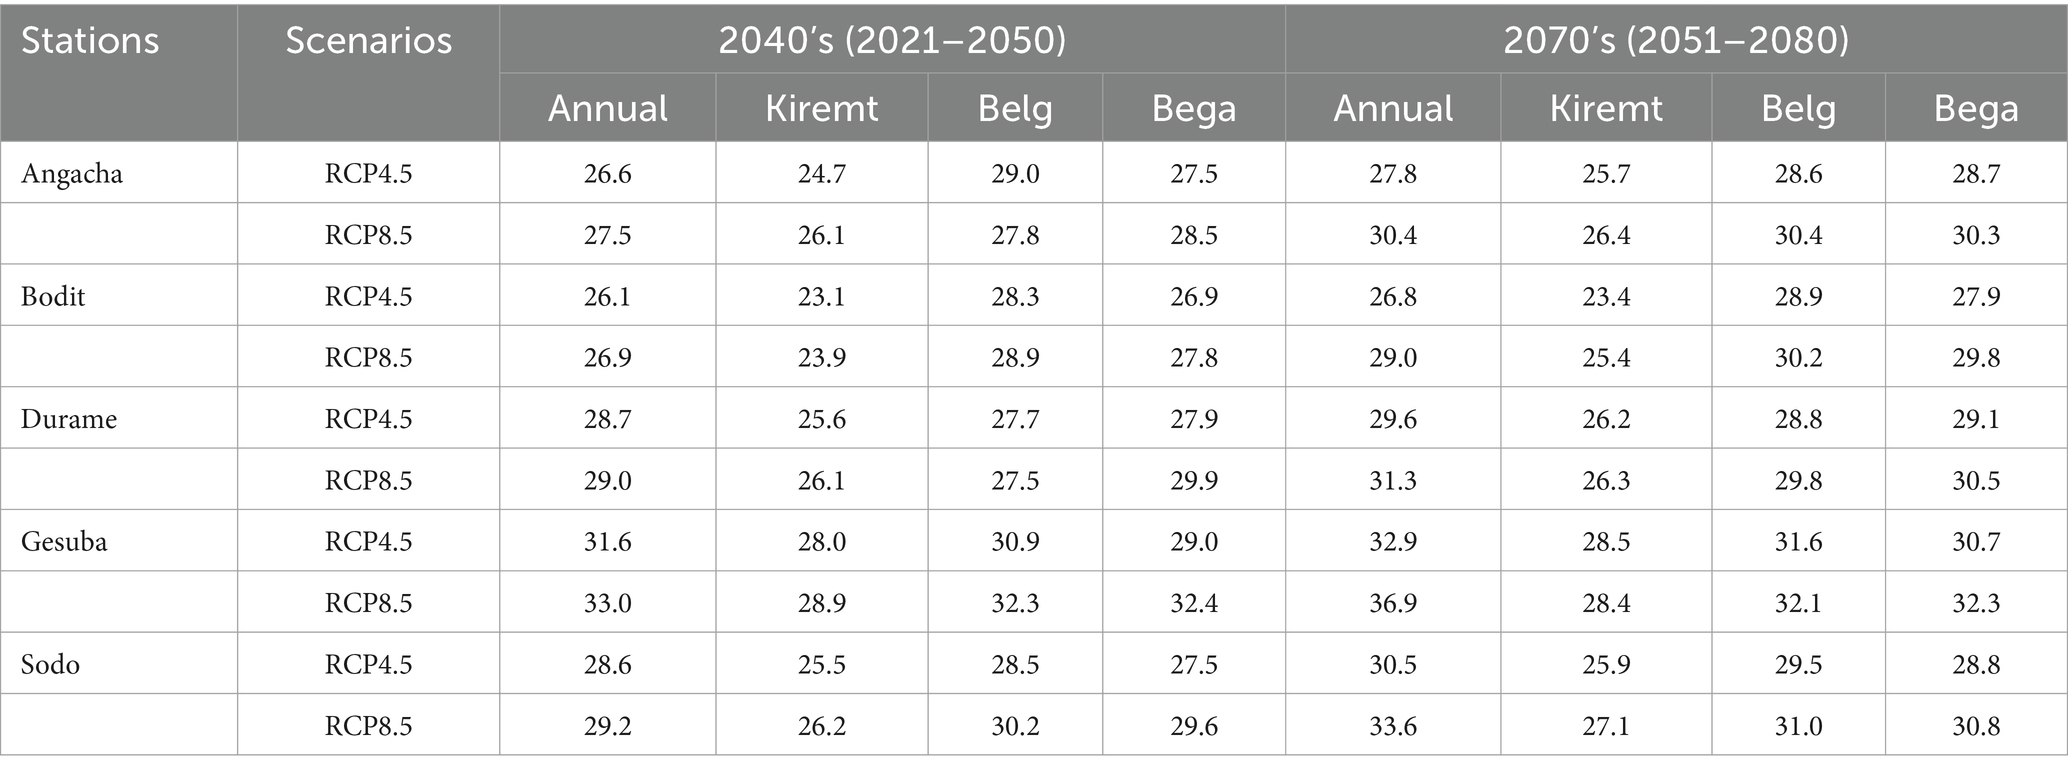
Table 8. Mean annual and seasonal maximum temperature (°C) across stations in Ajora-Woybo watershed.
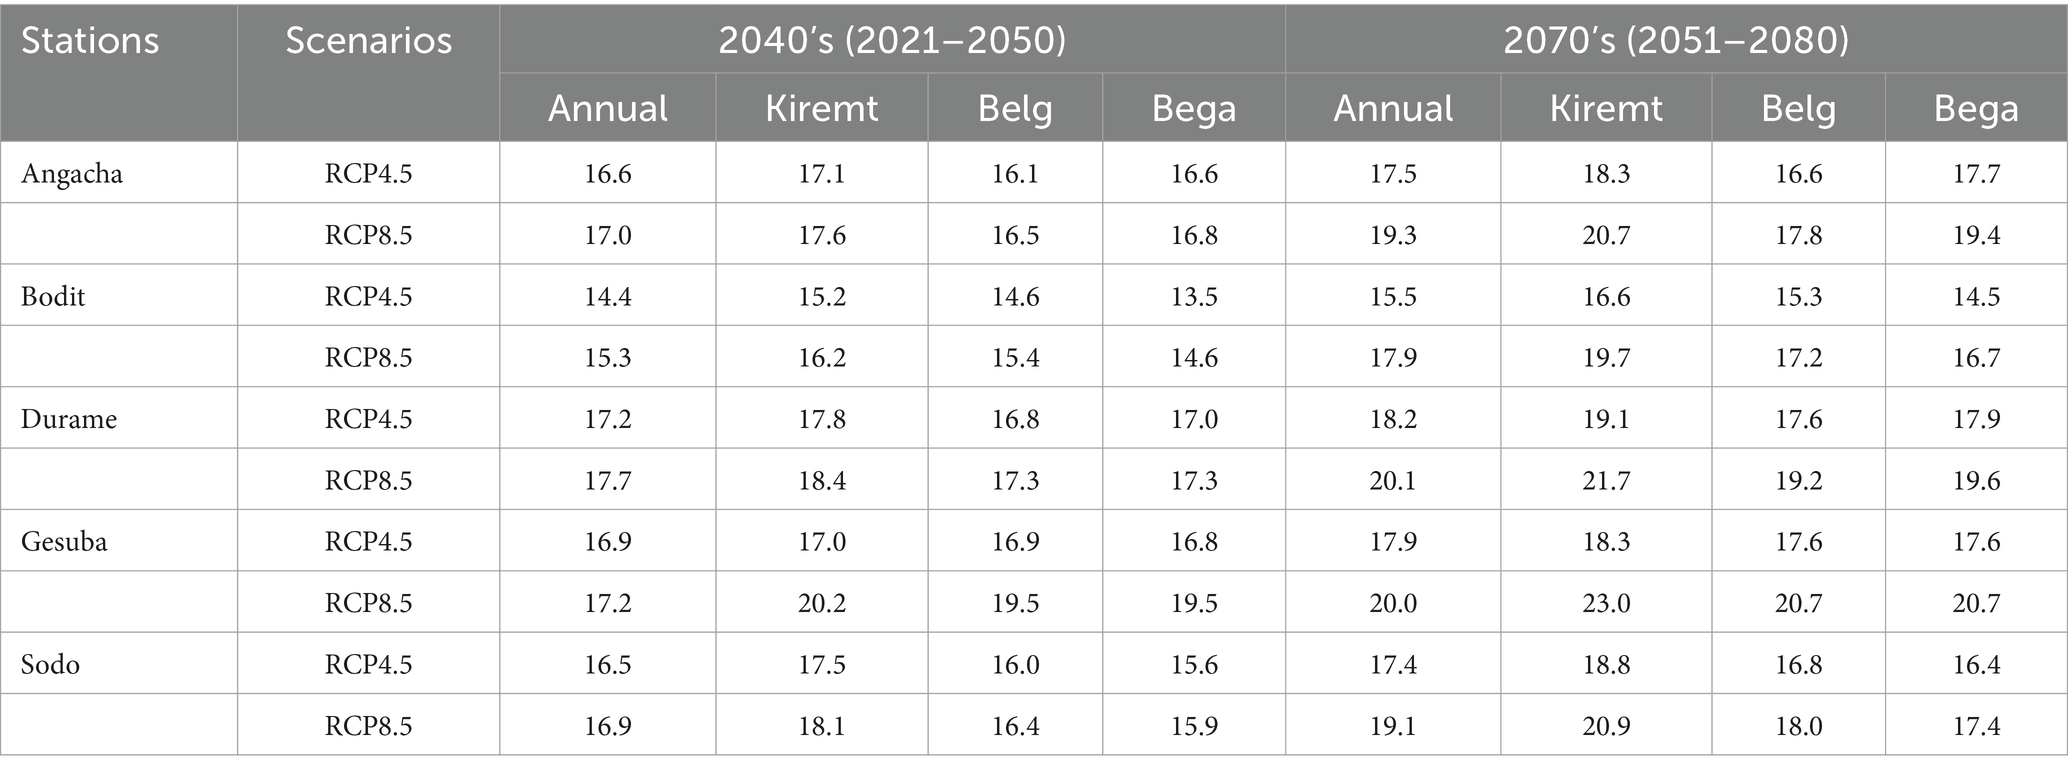
Table 9. Mean annual and seasonal minimum temperature (°C) across stations in Ajora-Woybo watershed.
All the driving-GCMs showed a similar change in projected annual, seasonal, and monthly mean Tmax and Tmin (Figure 10). The lowest annual mean Tmax (2.7%) projected in Bodit station by 2070’s under RCP4.5 and the highest (15.1%) by 2070’s under RCP8.5 in Sodo station. The lowest annual mean Tmin (5.4%) is projected in Angacha station by 2070’s under RCP4.5 and the highest (21.1%) by 2040’s under RCP4.5 in Angacha station (Table 9). Some previous works projected the future climate of the Omo-Gibe basin using various generation of models and came up with similar results (Ayana et al., 2017; Chaemiso et al., 2016; Demissie and Sime, 2021; Orkodjo et al., 2022). Most studies project a clear increase in temperature by the end of the 21st century. Despite the fact that each of these studies used distinct time scales, sample sizes, types of climate models, emission scenarios, and scaling techniques, generalizing is still straightforward.
A prior study in the Omo Gibe by Orkodjo et al. (2022) has been suggested that the projected ranges for the average temperature increase under the RCP4.5 and the RCP8.5 emission scenarios are 2.4–3.34°C and 2.6–4.5°C, respectively. Another study in Ethiopia’s Awash river basin by Emiru et al. (2021) as well as studies in the Ethiopian central rift valley by Upper Blue-Nile basin by Worku et al. (2021), all produced similar results. On the other hand, the finding in this study was consistent with some regional studies in East Africa by Osima et al. (2018). They used a large, 25-member regional climate model ensemble from the CORDEX and show that, compared to the control period of 1971–2000, annual mean near-surface temperature is projected to increase by more than 1°C and 1.5°C over most parts of the Greater Horn of Africa.
Overall, the results of the trend test showed that there is a statistically significant trend of rising temperatures over the two upcoming periods in the Ajora-Woybo watershed. This is because the future evolution of the trend change in the hydro-climatic variables of the watershed will be influenced by climate change. Future water supplies for the reservoir’s hydroelectricity, irrigation, rain-fed agriculture, and other uses are anticipated to be impacted.
3.4 Potential implications
Sea levels rise, precipitation patterns shift, evaporation rises, glaciers melt, and the climate heats up. Each of these elements affects fresh water availability. It is anticipated that rising water temperatures and more frequent and severe droughts will result in decreased water quality (Sarker, 2022). The impact is expected to worsen in the upcoming days as the temperature rises and the amount of precipitation drops. The watershed is particularly vulnerable to the effects of climate change for a number of reasons, such as its steep topography, delicate geology, exposure to a wide range of weather, reliance on rain and nature for a large portion of its livelihood, lack of human resources, and weak economy. As a result, some coping and adaptation strategies should be included, such as the management of water resources, the conservation of forests and land, the management of agriculture and livestock, the repair of local infrastructure, awareness and education campaigns, and institutional development. The ultimate goal is to increase community capacity to adapt to and deal with the effects of climate change through the preservation of soil and water resources, diversification of sources of income, and lower risk of climate-related disasters.
4 Conclusion
In this study, the performance of CORDEX regional climate models in simulating the rainfall and temperature characteristics over Ajora-Woybo watershed was evaluated. The dataset output downloaded from five GCM climate models (CNRM-CM5, MIROC5, GFDL-ESM2M, NorESM1-M, and CM5A-MR), spatially covering the watershed area for different climate stations, were used to project the future climate condition and predict future. The LS approach is a suitable bias correction tool for temperature and rainfall projections because it reduces the discrepancies between observations and climate model simulations throughout the control period. Furthermore, the LS approach had a distinct scaling character throughout the season of heavy rainfall and performed remarkably well in terms of frequency-based metrics (mean).
The mean annual maximum and minimum temperatures are expected to rise, but the mean annual rainfall is predicted to decline, according to the results of the forecasted GCMs. The simulation performance evaluation showed that the selected rainfall and air temperature MREs, CORR, and NSE values are all high and suggest better driving-GCM performance. When utilizing the correlation analysis method, the ensemble data set outperformed the observed. Comparisons between the simulated and observed RCP data were so consistent. Multi-model simulations could be helpful for studies on climate change, according to the findings.
Future climate change will result in significant annual, seasonal, and monthly temperature increases as well as decreases in rainfall in the Ajora-Woybo watershed. Therefore, the whole watershed will tend to be drier in the future in both scenarios (RCP4.5 and RCP8.5). Finally, in order to lessen the effects of climate change in the Ajora-Woybo watershed in the future, we advise putting into place practical and appropriate adaptation and mitigation techniques and measures as soon as possible. If this watershed does not take the proper adaptation and mitigation measures, future watershed resources for hydroelectric power generation, irrigation, rain-fed agriculture, and other sectors may be impacted.
It was anticipated that this study would demonstrate the trend of future climate change on the watershed, enabling managers to create plans for preventive action aimed at maintaining the potential of the watershed’s soil and water resources.
Data availability statement
The raw data supporting the conclusions of this article will be made available by the authors, without undue reservation.
Author contributions
MT: Conceptualization, Data curation, Formal analysis, Investigation, Methodology, Software, Validation, Visualization, Writing – original draft, Writing – review & editing. MU: Conceptualization, Data curation, Investigation, Methodology, Supervision, Validation, Visualization, Writing – original draft, Writing – review & editing. AB: Conceptualization, Investigation, Methodology, Software, Supervision, Validation, Visualization, Writing – original draft, Writing – review & editing. MM: Conceptualization, Data curation, Investigation, Supervision, Validation, Visualization, Writing – original draft, Writing – review & editing.
Funding
The author(s) declare that no financial support was received for the research, authorship, and/or publication of this article.
Acknowledgments
The authors thank the National Meteorological Agency of Ethiopia for providing the climate data and the CORDEX-AFRICA databank for the projected future climate data.
Conflict of interest
The authors declare that the research was conducted in the absence of any commercial or financial relationships that could be construed as a potential conflict of interest.
Publisher’s note
All claims expressed in this article are solely those of the authors and do not necessarily represent those of their affiliated organizations, or those of the publisher, the editors and the reviewers. Any product that may be evaluated in this article, or claim that may be made by its manufacturer, is not guaranteed or endorsed by the publisher.
Supplementary material
The Supplementary material for this article can be found online at: https://www.frontiersin.org/articles/10.3389/frwa.2024.1444638/full#supplementary-material
References
Abed-Elmdoust, A., Miri, M., and Singh, A. (2016). Reorganization of river networks under changing spatiotemporal precipitation patterns: an optimal channel network approach. Water Resour. Res. 52, 8845–8860. doi: 10.1002/2015WR018391
Ayana, M., Amencho, N. W., and Mohammed, A. K. (2017). Assessment of the impacts of climate change on gibe-III reservoir using reliability, resilience and vulnerability (RRV). Indices 8:24.
Baddoo, T. D., Li, Z., Odai, S. N., Boni, K. R. C., Nooni, I. K., and Andam-Akorful, S. A. (2021). Comparison of missing data infilling mechanisms for recovering a real-world Single Station streamflow observation. Int. J. Environ. Res. Public Health 18:8375. doi: 10.3390/ijerph18168375
Chaemiso, S. E., Abebe, A., and Pingale, S. M. (2016). Assessment of the impact of climate change on surface hydrological processes using SWAT: a case study of Omo-gibe river basin, Ethiopia. Model. Earth Syst. Environ. 2, 1–15. doi: 10.1007/s40808-016-0257-9
Chaemiso, S. E., Kartha, S. A., and Pingale, S. M. (2021). Effect of land use/land cover changes on surface water availability in the Omo-Gibe basin, Ethiopia. Hydrol. Sci. J. 66, 1936–1962. doi: 10.1080/02626667.2021.1963442
Chimdessa, K., Quraishi, S., Kebede, A., and Alamirew, T. (2018). Effect of land use land cover and climate change on river flow and soil loss in Didessa River basin, south West Blue Nile, Ethiopia. Hydrology 6:2. doi: 10.3390/hydrology6010002
CSA (Central Statistical Agency) (2020). (Central Statistical Agency) Central statistical Agency of Ethiopia survey result. Addia Ababa, Ethiopia.
Conway, D., and Schipper, E. L. F. (2011). Adaptation to climate change in Africa: challenges and opportunities identified from Ethiopia. Glob. Environ. Chang. 21, 227–237. doi: 10.1016/j.gloenvcha.2010.07.013
Demissie, T. A., and Sime, C. H. (2021). Assessment of the performance of CORDEX regional climate models in simulating rainfall and air temperature over Southwest Ethiopia. Heliyon 7:e07791. doi: 10.1016/j.heliyon.2021.e07791
Dibaba, W. T., Demissie, T. A., and Miegel, K. (2020). Watershed hydrological response to combined land use/land cover and climate change in Highland Ethiopia: Finchaa catchment. WaterSA 12:1801. doi: 10.3390/w12061801
Emiru, N. C., Recha, J. W., Thompson, J. R., Belay, A., Aynekulu, E., Manyevere, A., et al. (2021). Impact of climate change on the hydrology of the upper Awash River basin, Ethiopia. Hydrology 9:3. doi: 10.3390/hydrology9010003
Gadissa, T., Nyadawa, M., Behulu, F., and Mutua, B. (2018). The effect of climate change on loss of Lake volume: case of sedimentation in central Rift Valley basin, Ethiopia. Hydrology 5:67. doi: 10.3390/hydrology5040067
Gebrechorkos, S. H., Hülsmann, S., and Bernhofer, C. (2019). Regional climate projections for impact assessment studies in East Africa. Environ. Res. Lett. 14:044031. doi: 10.1088/1748-9326/ab055a
Gyamfi, C., Tindan, J. Z.-O., and Kifanyi, G. E. (2021). Evaluation of CORDEX Africa multi-model precipitation simulations over the Pra River Basin, Ghana. J. Hydrol. Reg. Stud. 35:100815. doi: 10.1016/j.ejrh.2021.100815
IPCC (2014). AR5 climate change 2014: Impacts, adaptation, and vulnerability—IPCC. Available at: https://www.ipcc.ch/report/ar5/wg2/
Khan, A., and Koch, M. (2018). Selecting and downscaling a set of climate models for projecting climatic change for impact assessment in the upper Indus Basin (UIB). Climate 6:89. doi: 10.3390/cli6040089
Kim, J., Waliser, D. E., Mattmann, C. A., Goodale, C. E., Hart, A. F., Zimdars, P. A., et al. (2014). Evaluation of the CORDEX-Africa multi-RCM hindcast: systematic model errors. Clim. Dyn. 42, 1189–1202. doi: 10.1007/s00382-013-1751-7
Mendez, M., Maathuis, B., Hein-Griggs, D., and Alvarado-Gamboa, L.-F. (2020). Performance evaluation of Bias correction methods for climate change monthly precipitation projections over Costa Rica. WaterSA 12:482. doi: 10.3390/w12020482
Muleta, T. N. (2021). Climate change scenario analysis for Baro-Akobo river basin, Southwestern Ethiopia. Environ. Syst. Res. 10:24. doi: 10.1186/s40068-021-00225-5
Okkan, U., Fistikoglu, O., Ersoy, Z. B., and Noori, A. T. (2023). Investigating adaptive hedging policies for reservoir operation under climate change impacts. J. Hydrol. 619:129286. doi: 10.1016/j.jhydrol.2023.129286
Okkan, U., Fistikoglu, O., Ersoy, Z., and Noori, A. (2024). Analyzing the uncertainty of potential evapotranspiration models in drought projections derived for a semi-arid watershed. Theor. Appl. Climatol. 155, 2329–2346. doi: 10.1007/s00704-023-04817-2
Orkodjo, T. P., Kranjac-Berisavijevic, G., and Abagale, F. K. (2022). Impact of climate change on future precipitation amounts, seasonal distribution, and streamflow in the Omo-gibe basin, Ethiopia. Heliyon 8:e09711. doi: 10.1016/j.heliyon.2022.e09711
Osima, S., Indasi, V. S., Zaroug, M., Endris, H. S., Gudoshava, M., Misiani, H. O., et al. (2018). Projected climate over the greater horn of Africa under 1.5 °C and 2 °C global warming. Environ. Res. Lett. 13:065004. doi: 10.1088/1748-9326/aaba1b
Ouhamdouch, S., and Bahir, M. (2017). Climate change impact on future rainfall and temperature in semi-arid areas (Essaouira Basin, Morocco). Environ. Process. 4, 975–990. doi: 10.1007/s40710-017-0265-4
Patakamuri, S. K., Muthiah, K., and Sridhar, V. (2020). Long-term homogeneity, trend, and change-point analysis of rainfall in the Arid District of Ananthapuramu, Andhra Pradesh state, India. WaterSA 12:211. doi: 10.3390/w12010211
Rathjens, H., Katrin, B., Aghavan, S., Indrajeet, C., and Jeffrey, G. A. (2016). CMhyd User Manual, vol. 17.
Sarker, S. (2020). Investigating topologic and geometric properties of synthetic and Natural River networks under changing climate. Electronic Theses and Dissertations, 2020, 965.
Sarker, S. (2022). Fundamentals of climatology for engineers: lecture note. Engineering 3, 573–595. doi: 10.3390/eng3040040
Shrestha, S., Bae, D.-H., Hok, P., Ghimire, S., and Pokhrel, Y. (2021). Future hydrology and hydrological extremes under climate change in Asian river basins. Sci. Rep. 11:17089. doi: 10.1038/s41598-021-96656-2
Singhal, A., Jaseem, P. A., Divya, M., Sarker, S., Prajapati, P., Singh, A., et al. (2023). Identifying potential locations of hydrologic monitoring stations based on topographical and hydrological information. Water Resour. Manag. 38, 369–384. doi: 10.1007/s11269-023-03675-x
Sonali, P., and Nagesh Kumar, D. (2020). Review of recent advances in climate change detection and attribution studies: a large-scale hydroclimatological perspective. J. Water Clim. Change 11, 1–29. doi: 10.2166/wcc.2020.091
Tarekegn, N., Abate, B., Muluneh, A., and Dile, Y. (2022). Modeling the impact of climate change on the hydrology of Andasa watershed. Model. Earth Syst. Environ. 8, 103–119. doi: 10.1007/s40808-020-01063-7
Teshome, H., Tesfaye, K., Dechassa, N., Tana, T., and Huber, M. (2021). Analysis of past and projected trends of rainfall and temperature parameters in eastern and Western Hararghe zones, Ethiopia. Atmosphere 13:67. doi: 10.3390/atmos13010067
Teutschbein, C., and Seibert, J. (2012). Bias correction of regional climate model simulations for hydrological climate-change impact studies: review and evaluation of different methods. J. Hydrol. 456-457, 12–29. doi: 10.1016/j.jhydrol.2012.05.052
Toma, M. B., Belete, M. D., and Ulsido, M. D. (2022). Historical and future dynamics of land use land cover and its drivers in Ajora-Woybo watershed, Omo-gibe basin, Ethiopia. Nat. Resour. Model. 36:e12353. doi: 10.1111/nrm.12353
Toma, M. B., Belete, M. D., and Ulsido, M. D. (2023a). Hydrological components and sediment yield response to land use land cover change in the Ajora-Woybo watershed of Omo-Gibe Basin, Ethiopia. Air, Soil Water Res. 16:117862212211501. doi: 10.1177/11786221221150186
Toma, M. B., Belete, M. D., and Ulsido, M. D. (2023b). Trends in climatic and hydrological parameters in the Ajora-Woybo watershed, Omo-Gibe River basin, Ethiopia. SN Appl. Sci. 5:45. doi: 10.1007/s42452-022-05270-y
Woldesenbet, T. A., and Elagib, N. (2021). Analysis of climatic trends in the upper Blue Nile basin based on homogenized data. Theor. Appl. Climatol. 146, 767–780. doi: 10.1007/s00704-021-03767-x
Worku, G. (2018). Evaluation of regional climate models performance in simulating rainfall climatology of Jemma sub-basin, upper Blue Nile Basin, Ethiopia. Dyn. Atmos. Oceans 83, 53–63. doi: 10.1016/j.dynatmoce.2018.06.002
Worku, G., Teferi, E., Bantider, A., and Dile, Y. T. (2021). Modelling hydrological processes under climate change scenarios in the Jemma sub-basin of upper Blue Nile Basin. Clim. Risk Manag. 31:100272. doi: 10.1016/j.crm.2021.100272
Wu, J., and Gao, X. (2020). Present day bias and future change signal of temperature over China in a series of multi-GCM driven RCM simulations. Clim. Dyn. 54, 1113–1130. doi: 10.1007/s00382-019-05047-x
WIEB (Water Irrigation and Energy Bureau) (2020). (Water Irrigation and Energy Bureau) Annual report of Southern Ethiopia Water Irrigation and Energy Bureau. Hawassa Ethiopia.
Xu, C. (1999). From GCMs to river flow: a review of downscaling methods and hydrologic modelling approaches. Progress Phys. Geogr. Earth Environ. 23, 229–249. doi: 10.1177/030913339902300204
Keywords: climate change, RCM-GCMs, CORDEX, CMhyd, Ajora-Woybo watershed
Citation: Toma MB, Ulsido MD, Bitew AM and Meja MF (2024) Downscaling, projection, and analysis of expected future climate change in a watershed of Omo-Gibe basin of Ethiopia. Front. Water. 6:1444638. doi: 10.3389/frwa.2024.1444638
Edited by:
Carlos De Mello, Universidade Federal de Lavras, BrazilReviewed by:
Shiblu Sarker, Virginia Department of Conservation and Recreation, United StatesVinicius Silva, Universidade Federal de Lavras, Brazil
Copyright © 2024 Toma, Ulsido, Bitew and Meja. This is an open-access article distributed under the terms of the Creative Commons Attribution License (CC BY). The use, distribution or reproduction in other forums is permitted, provided the original author(s) and the copyright owner(s) are credited and that the original publication in this journal is cited, in accordance with accepted academic practice. No use, distribution or reproduction is permitted which does not comply with these terms.
*Correspondence: Meseret Bekele Toma, bWVzZXJldGJla2VsZXRAZ21haWwuY29t