- Department of Hydrological, Centre for Water Resources Research, University of KwaZulu Natal, Pietermaritzburg, South Africa
This study investigates the impact of climate variability on groundwater quality in Mauritius. This is achieved by analyzing the physical and chemical water quality of the five main aquifers over eleven years. Temporal variations in water quality properties were compared to the Standardised Precipitation Index (SPI), Dry Spells, the Standardised Evapotranspiration Index (SPEI), and other climate variables to gain insights into how precipitation controls groundwater quality. The results reveal that the SPI and the SPEI correlate minimally with water quality indicators. Sulphate is the only water quality indicator that showed correlations above 0.4 in aquifers 2 and 3 against a 12-month SPI. Sulphate, alongside chloride, showed what is termed ”notable correlation,” a concept defined in this paper to accommodate correlations that fall above 0.3 when assessed against global climate modes ENSO and AAO, respectively. These results signify that sulphate is the most sensitive water quality indicator to water quantity changes, notwithstanding the modesty of the correlations. Heavy storms occurring during cyclones impact groundwater quality with respect to conductivity, TDS, salinity, and nitrate, although this could not be statistically tested given the lack of water quality indicators collected on the days surrounding the storm. Therefore, the conclusion is made based on one storm event. The study revealed that individual correlations between climate indices and water quality variables are present but weak. However, the long-term trend in water quality is visible.
1 Introduction
The contamination of freshwater resources is a global concern. According to the World Health Organization (WHO), waterborne illness has been the leading cause of death worldwide, making water resource management a top priority. Studies have shown that groundwater is increasingly being tapped for drinking water supplies, partly because of the growing scarcity of water resources and also because groundwater is preferred as a source of “clean” drinking water, which is particularly the case in Mauritius Island. There are various factors that can cause groundwater contamination through both natural and anthropogenic factors. Geogenic contamination of groundwater may result from the geochemical characteristics of the aquifer material, including high concentrations of the contaminant within the rock matrix.
Mauritius is a 2,040-square-kilometer Small Island Developing States in the south-east of the Indian Ocean with a population of slightly above a million citizens. According to Devi Nowbuth et al. (2012), 50% of the total domestic water consumption in Mauritius is sourced from groundwater reservoirs. The groundwater degradation in Mauritius is a critical challenge, given the level of dependency on groundwater. Therefore, the monitoring of groundwater quality is of high importance. The Water Quality Index (WQI) assessment conducted in the aquifer revealed that the aquifer was in good water quality condition (Gungoa, 2016). Gungoa (2016) further finds the state of water quality in Mauritius has been determined for one aquifer region located in the north of the country. However, an elevation in nitrate was also noted to be threatening the state of this WQI score. This paper seeks to revisit all the water quality indicators and evaluate their change in relation to perceived predictor variables such as drought indicators and climate variability modes across the entire island.
Sarker (2022) lays down a cliché that says, “Climatology and meteorology are closely connected, yet have different time scales.” This is a point considered in this paper as the desire to make it comprehensive led to assessments of both large-scale climate modes and a storm. The latter is climatological while the former is meteorological, and both contained potential answers to the aquifer recharge rates and overall water quality signals. When considering climate variability which Sarker (2022) describes as the deviation of climatic characteristics from the norm, El Niño–Southern Oscillation (ENSO), Antarctic Oscillation (AAO), Indian Ocean Dipole (IOD), and the Southern Oscillation Index (SOI) were selected as the climate variability modes to be considered against groundwater quality to gain an understanding of the climate impact on the groundwater.
Climate change has significant impacts on groundwater resources in Small Island Developing States (SIDS). Groundwater quality studies in relation to climate variability are very important in SIDS because of the risk of water quality changes in response to these climate variables and the large dependence on groundwater for water supply (Thomas et al., 2020); 90% of the SIDS are in the tropics. Many are seasonally affected by extreme weather events, tropical storms, cyclones, and hurricanes. Climate variability, droughts and flooding are also features of their weather patterns. El NiñoSouthern Oscillation (ENSO) events also produce dramatic changes in rainfall, rising sea levels and other weather-related events (UNFCCC, 2005). As sea levels rise, saltwater intrusion becomes a significant concern for groundwater resources (Thomas et al., 2020). Sea-level rise, storms, and changes in precipitation have affected these sources, leading to further stress on freshwater availability (Thomas et al., 2020). It is important to note that the specific impacts of climate variability on groundwater in SIDS can vary based on the geographical location, hydrogeological characteristics, and local climatic conditions of each island. Therefore, it is essential to conduct detailed studies and assessments specific to each island to fully understand the local context and develop targeted adaptation measures (Thomas et al., 2020). The relationship between groundwater and rainfall parameters such as drought indicators and climate variability modes has received little attention in the Island of Mauritius. This is potentially due to the limited nature of the long-term time-series data on water quality in this location as it is generally the case globally.
In the 20th century, the frequency of tropical cyclones in the vicinity of Mauritius has increased with a relative fall in intensity over the years, resulting in increased vulnerability for the communities exposed to these high occurrences of low- or average-intensity extreme events (Garnier and Desarthe, 2013). A significant increase in the frequency and intensity of other extreme weather events, including floods and droughts, has been reported over the years on the island (Chacowry et al., 2018; Seebocus et al., 2021). Additionally, Mauritius has experienced a relative rise in sea level of 4–6 mm per year over the past 30 years, corresponding to an increase of 2–3 times higher than the global average (Doorga, 2022). However, preparedness for scenarios would necessitate further understanding of the temporal evolution of climate impacts on the water quality on the island. The tropical climate of Mauritius provides an ideal case study, with potentially insightful results on how groundwater is vulnerable in Small Island Developing States due to the impacts of climate change.
The study is based on the five main Mauritius aquifers shown in Figure 1. The objective was to analyze the impacts of climate variability on groundwater over the period of 2010–2021. Correlation analysis between the various water quality variables and the climate variables has been used as the linkage between climate and water quality. The data used in this study are obtained through different sources based on the data type. The data are taken through processing before performing the relationship analysis. The first and most primary dataset used is the in situ borehole data, which are obtained from the Central Water Authority (CWA), from a total of 63 boreholes across the Island and monitors groundwater quality on a daily basis.
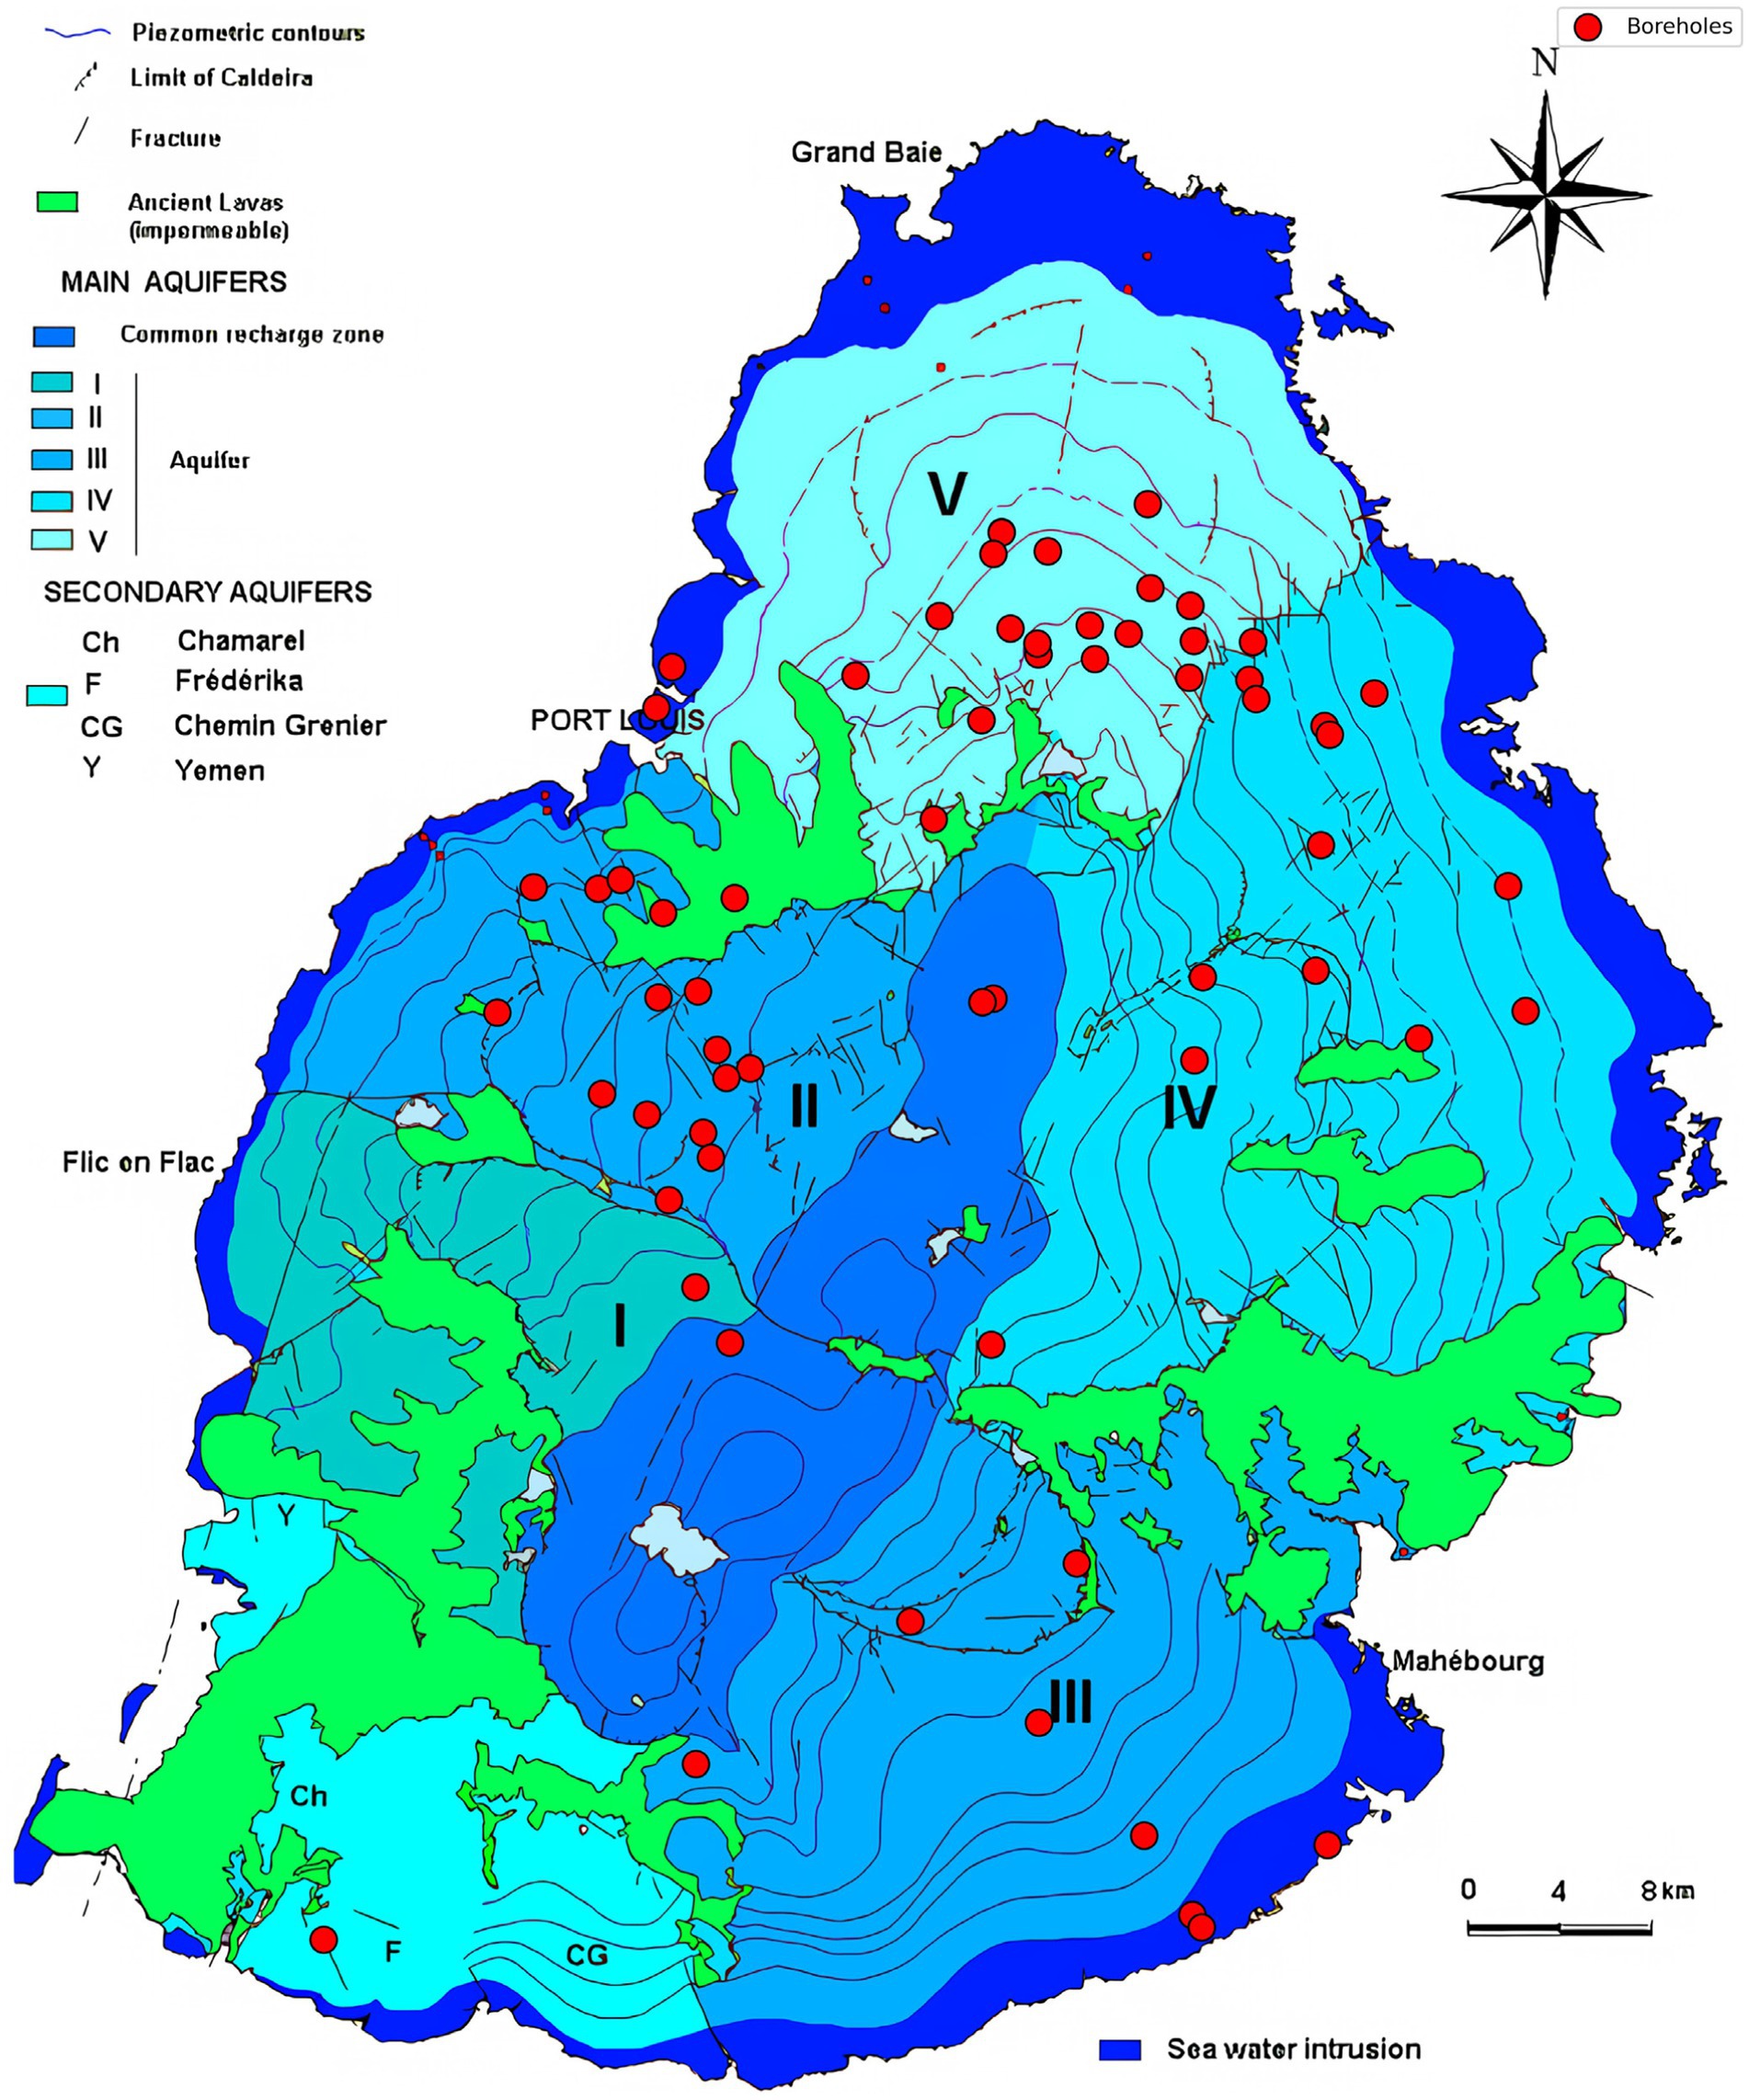
Figure 1. Five main aquifers of Mauritius Island are displayed. The secondary aquifers (Chamarel, Frederika, Chemin Grenier, and Yemen) in the South West are excluded from this study due to their lack of continuous data record. This illustration figure is courtesy of Devi Nowbuth et al. (2012).
Theoretically, aquifers are recharged under wetter conditions where SPI and SPEI index are high, wet spells are prevalent, and cyclones frequently lead to more dilute water chemistry and washing of polluted surface waters to groundwaters. Contrarily, groundwater recharge is limited during high SPEI index and when dry spells are predominant leading to higher ionic contents in the water. The high rainfall seen during cyclones is compared with the groundwater quality water parameters collected around the same time. The aim was to illustrate whether during a cyclone event, the ground water chemical, and physical state is affected or not.
According to UNFCC, SIDS have been recognized as being the most vulnerable to the impacts of climate change. Due to the geographic location of SIDS and the influences of oceanic circulation systems, natural precipitation varies from year to year, leading to various forms of extreme weather events, such as droughts, floods, and cyclones. Rainwater is the main source of water supply in SIDS and is highly influenced by rainfall patterns and extreme weather events. Changes in rainfall precipitation coupled with changes in El Niño intensity and frequency can put additional stress on water availability and quality in SIDS UNFCCC (UNFCCC, 2005).
2 Materials and methods
2.1 Data acquisition and preparation
2.1.1 In situ groundwater quality data
This study utilizes a rare, continuous 10-year dataset of monthly groundwater quality parameters, including pH, conductivity, TDS, salinity, chloride, sulfate, and nitrate, collected by the Central Water Authority (CWA). Originally, the water quality data were collected daily but were time-averaged to monthly composites to reduce temporal gaps. Although the water quality data are collected and managed by the CWA at a borehole level, visualized in Figure 1, this study spatially averages the borehole groundwater quality data and assesses it at the aquifer level, rather than using discrete borehole samples. This approach reduces noise and condenses independent spatial parameters to five main aquifers, which is also reflected in Figure 1, which displays both aquifers and boreholes for a comprehensive overview.
2.2 Rainfall data
The rainfall data are crucial for this study as it is used to compute drought indicators. These indicators are then statistically tested against the groundwater quality data to produce correlation coefficients and other indicative statistics. The rainfall data have been obtained from the ERA-5 dataset, provided by the Copernicus Climate Data Store, which offers hourly and monthly average rainfall records from 1979 to the present (Hersbach et al., 2020). ERA-5 is a platform for high-resolution reanalysis data with a spatial resolution of 0.25° × 0.25°. The data were accessed via an open-source API and downloaded as monthly average NetCDF files. Monthly rainfall frequency was chosen to match the time frequency of the borehole groundwater quality data as this would allow for correlation assessment.
2.3 Methods
2.3.1 Standardized precipitation index
The SPI computed in Equation (1) is a statistical, meteorological tool used to study droughts and wet periods. According to Guide et al. (2012) and Svoboda et al. (2012), the SPI tool was developed by McKee et al. (1993). It was developed to estimate droughts at a point in time over a region in relation to its historical context (the climate). McKee et al. (1993) proposed this indicator as a definition of drought, which could serve as a versatile tool in drought monitoring and analysis. The SPI is currently a widely used tool in agriculture, hydrology, and climatology across the world. The SPI is also highly regarded and recommended by the WMO as a tool for all nations to use to analyze drought. SPI is generated based on the following equation:
Pij refers to precipitation with ij subscript referring to the latitude and longitude geographical location in the study of interest. P¯ ij refers to average precipitation, while θij refers to the standard deviation of the rainfall time series with time (months) represented by the k th term. Paulo et al. (2003) performed a detailed derivation of the above equation.
2.3.2 Standardized precipitation evapotranspiration index
The SPEI is computed in a similar way as the SPI; however, for the SPEI, the analysis takes an additional parameter, the surface temperature. The surface temperature is used for performing an evaporation rate, which is believed to be a factor, especially when assessing vegetation as a parameter. The SPEI has been considered for this paper as it is known to usually predict with an elevated level of precision compared to the SPI in vegetation-covered environments. The evapotranspiration is the parameter considered on the computation of SPEI. The SPEI is quantified based on the following steps:
1. Computation of the potential evapotranspiration.
2. Determination of the deficit or surplus water budget based on the difference of precipitation and evapotranspiration.
3. Normalization of the water balance of the log-logistic probability to express the SPEI series (Potop and Možný, 2011). The detailed computation of the SPEI involves what is called the Hargreaves’ method and is detailed in Hargreaves and Samani (1985).
The SPEI and SPI can further be classified into the table categories depicted in Table 1, which each demonstrates the severity of the drought indicator in question. The value depicts in the table represents the number of standard deviations from the mean represented by each drought indicator.
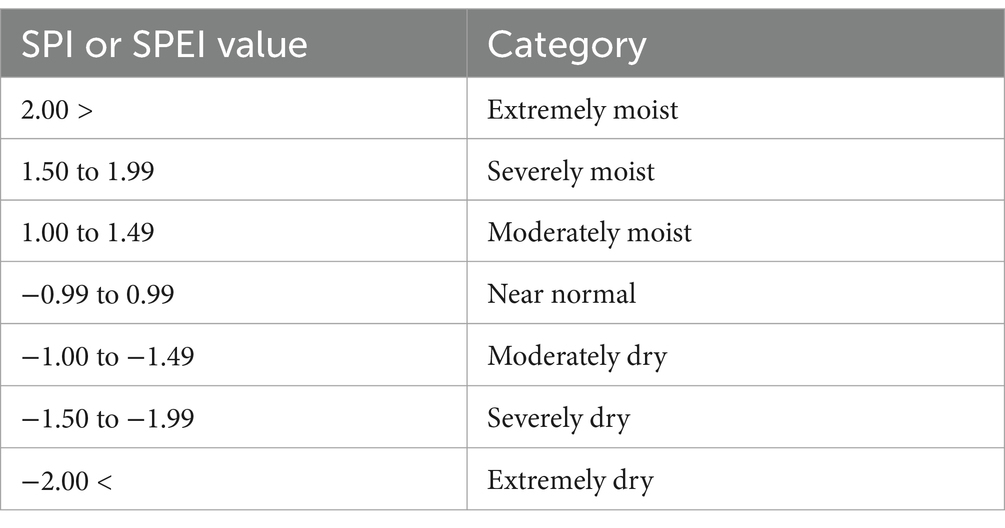
Table 1. The SPI and SPEI Table describes the meaning of the SPI anomaly index McKee et al. (1993).
2.3.3 Dry spells
The dry spells are periods of extended, several dry consecutive days. The dry spells represent days of little to no precipitation and periods of near-zero recharge to the aquifers. In this study, a “dry spell” is defined as a period of 7 or more days in a row that each received 5 mm of rainfall or less. This definition of a dry spell is given axiomatically as there is no universally agreed-upon definition that quantitatively defines a dry spell.
2.4 Climate oscillations and synoptic scale features
2.4.1 Large-scale oscillation indices
The Southern Oscillation Index (SOI), otherwise known as the El Niño–Southern Oscillation (ENSO), is a large-scale climatological feature that influences rainfall regimes through sea surface temperatures (SST) anomalies that support vertical fluxes. The SOI is obtained from the National Centers for Environmental Information (NCEI) online data repository. The Antarctic Oscillation index (AAO) otherwise also known as (AO) conversely is driven by sea-level pressure (SLP) dipole located in the southern ocean and mid-latitudes (Gong and Wang, 1999). These SLPs vary over the years and they are multi-annual or decadal scale oscillations similar to the SOI. During periods in which the higher SLPs are located further south, the AAO is positive, but when these SLPs weaken near Antarctica, this represents periods of low sea-ice expansion and thus a negative AAO period (Jevrejeva et al., 2003).
The Indian Ocean Dipole Index (IOD) similar to the AAO is driven by a dipole of SLPs. According to Ashok et al. (2004), the IOD is a phenomenon that occurs inter-annually due to ocean and atmosphere coupled dynamics. This phenomenon is characterized by warmer SSTs on the west of the basin or lower pressures, while simultaneously cooler SSTs or higher pressures on the east are observed. This arrangement of the atmospheric pressures is called a dipole. These data were obtained from the National Oceanic and Atmospheric Administration Physical Sciences Laboratory and at the Global Climate Observing System (GCOS) Working Group on Surface Pressure—Timeseries Data NOAA Physical Sciences Laboratory.
2.4.2 Tropical cyclones
Tropical cyclones are storms formed in areas with a tropical climate located between 10° and 20° North or South Latitudes. Mauritius Island being located in the tropical zone is prone to cyclonic visits during summer seasons bringing heavy rainfall onto the island. This study aimed to determine the effect of extreme rainfall intensity during cyclonic conditions on groundwater quality. Cyclone Esami which occurred in January 2020 is selected for correlation analysis against groundwater quality. Cyclonic data are obtained from the worlddata.info website.
2.5 Computation of the correlation heat maps
The global climatic forcing data in the form of AAO, IOD, and SOI as well as the drought indicators data in the form of SPI, SPEI, and dry spells are compared against the in situ water quality data (nitrate, sulfate, conductivity, salinity, chloride, TDS, and pH) via correlation analysis. The correlation analysis is performed by means of comparing the time-series records of each of the predictor variables with the in situ water quality data using statistical, python tools. The output of this correlation analysis is shown as correlation heat-map figures in the Results section. The SPI, SPEI, and dry spells are methods of estimating the accumulative water budget based on rainfall and water loss. They are evaluated over a 1-, 3-, 6-, and 12-month period to assess monthly, quarterly, biannual, or annual water budgets (Figure 2).
The response of groundwater parameters to changes in the water budget is influenced by factors, such as aquifer permeability and recharge rates. Faster recharge rates might correlate more closely with one-month SPI and SPEI values, while slower recharge rates could result in a more delayed reaction in groundwater quality indicators to variation in drought indicators. The correlation matrices shown in Figures 3–6 are derived from the time-series data of the correlated parameters (shown in Supplementary Appendix) and are based on in situ data not fully presented in this paper as time series. Figure 6 shows the correlation heat maps between water quality parameters and climate variability modes. The aim was to observe the impact of these modes on the groundwater quality parameters in each aquifer as aquifers may experience a different impact.
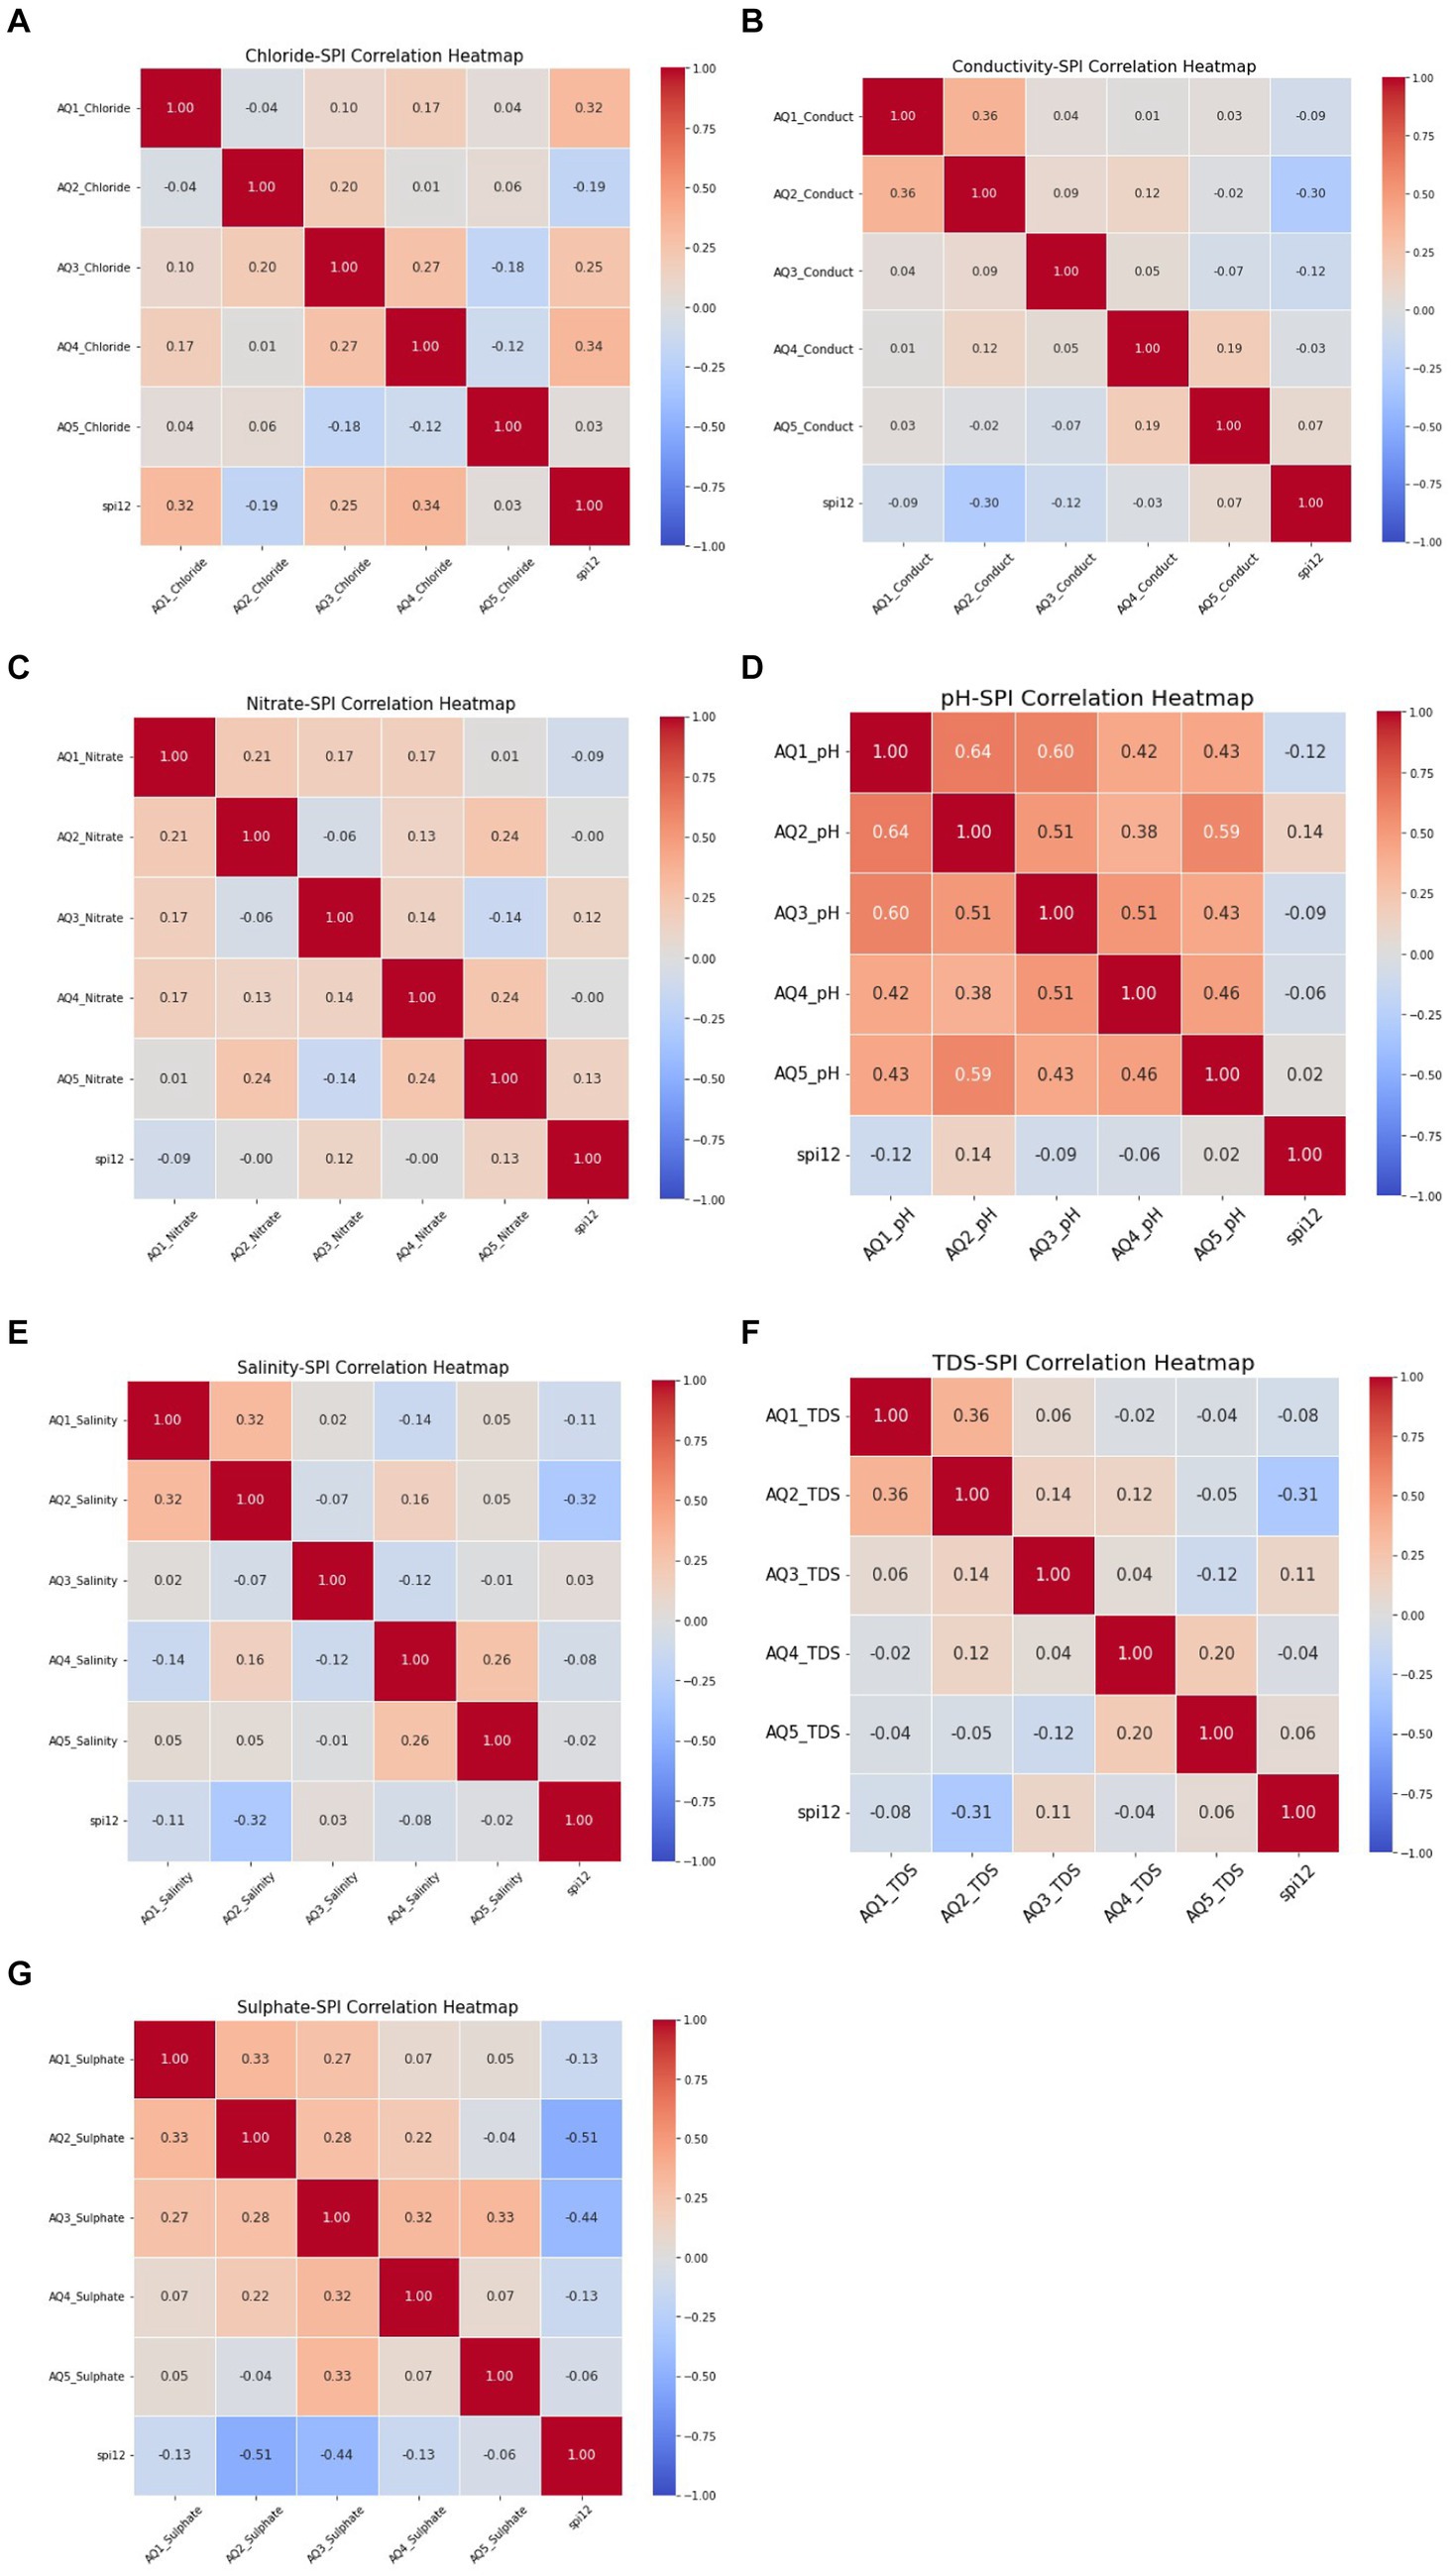
Figure 4. The correlation matrix plot showing relationship strength of the water quality indicators vs the 12-month SPI. Aquifer correlation plots vs (A) Chloride, (B) Conductivity, (C) Nitrate, (D) pH, (E) Salinity, (F) TDS and (G) TDS heatmap plots.
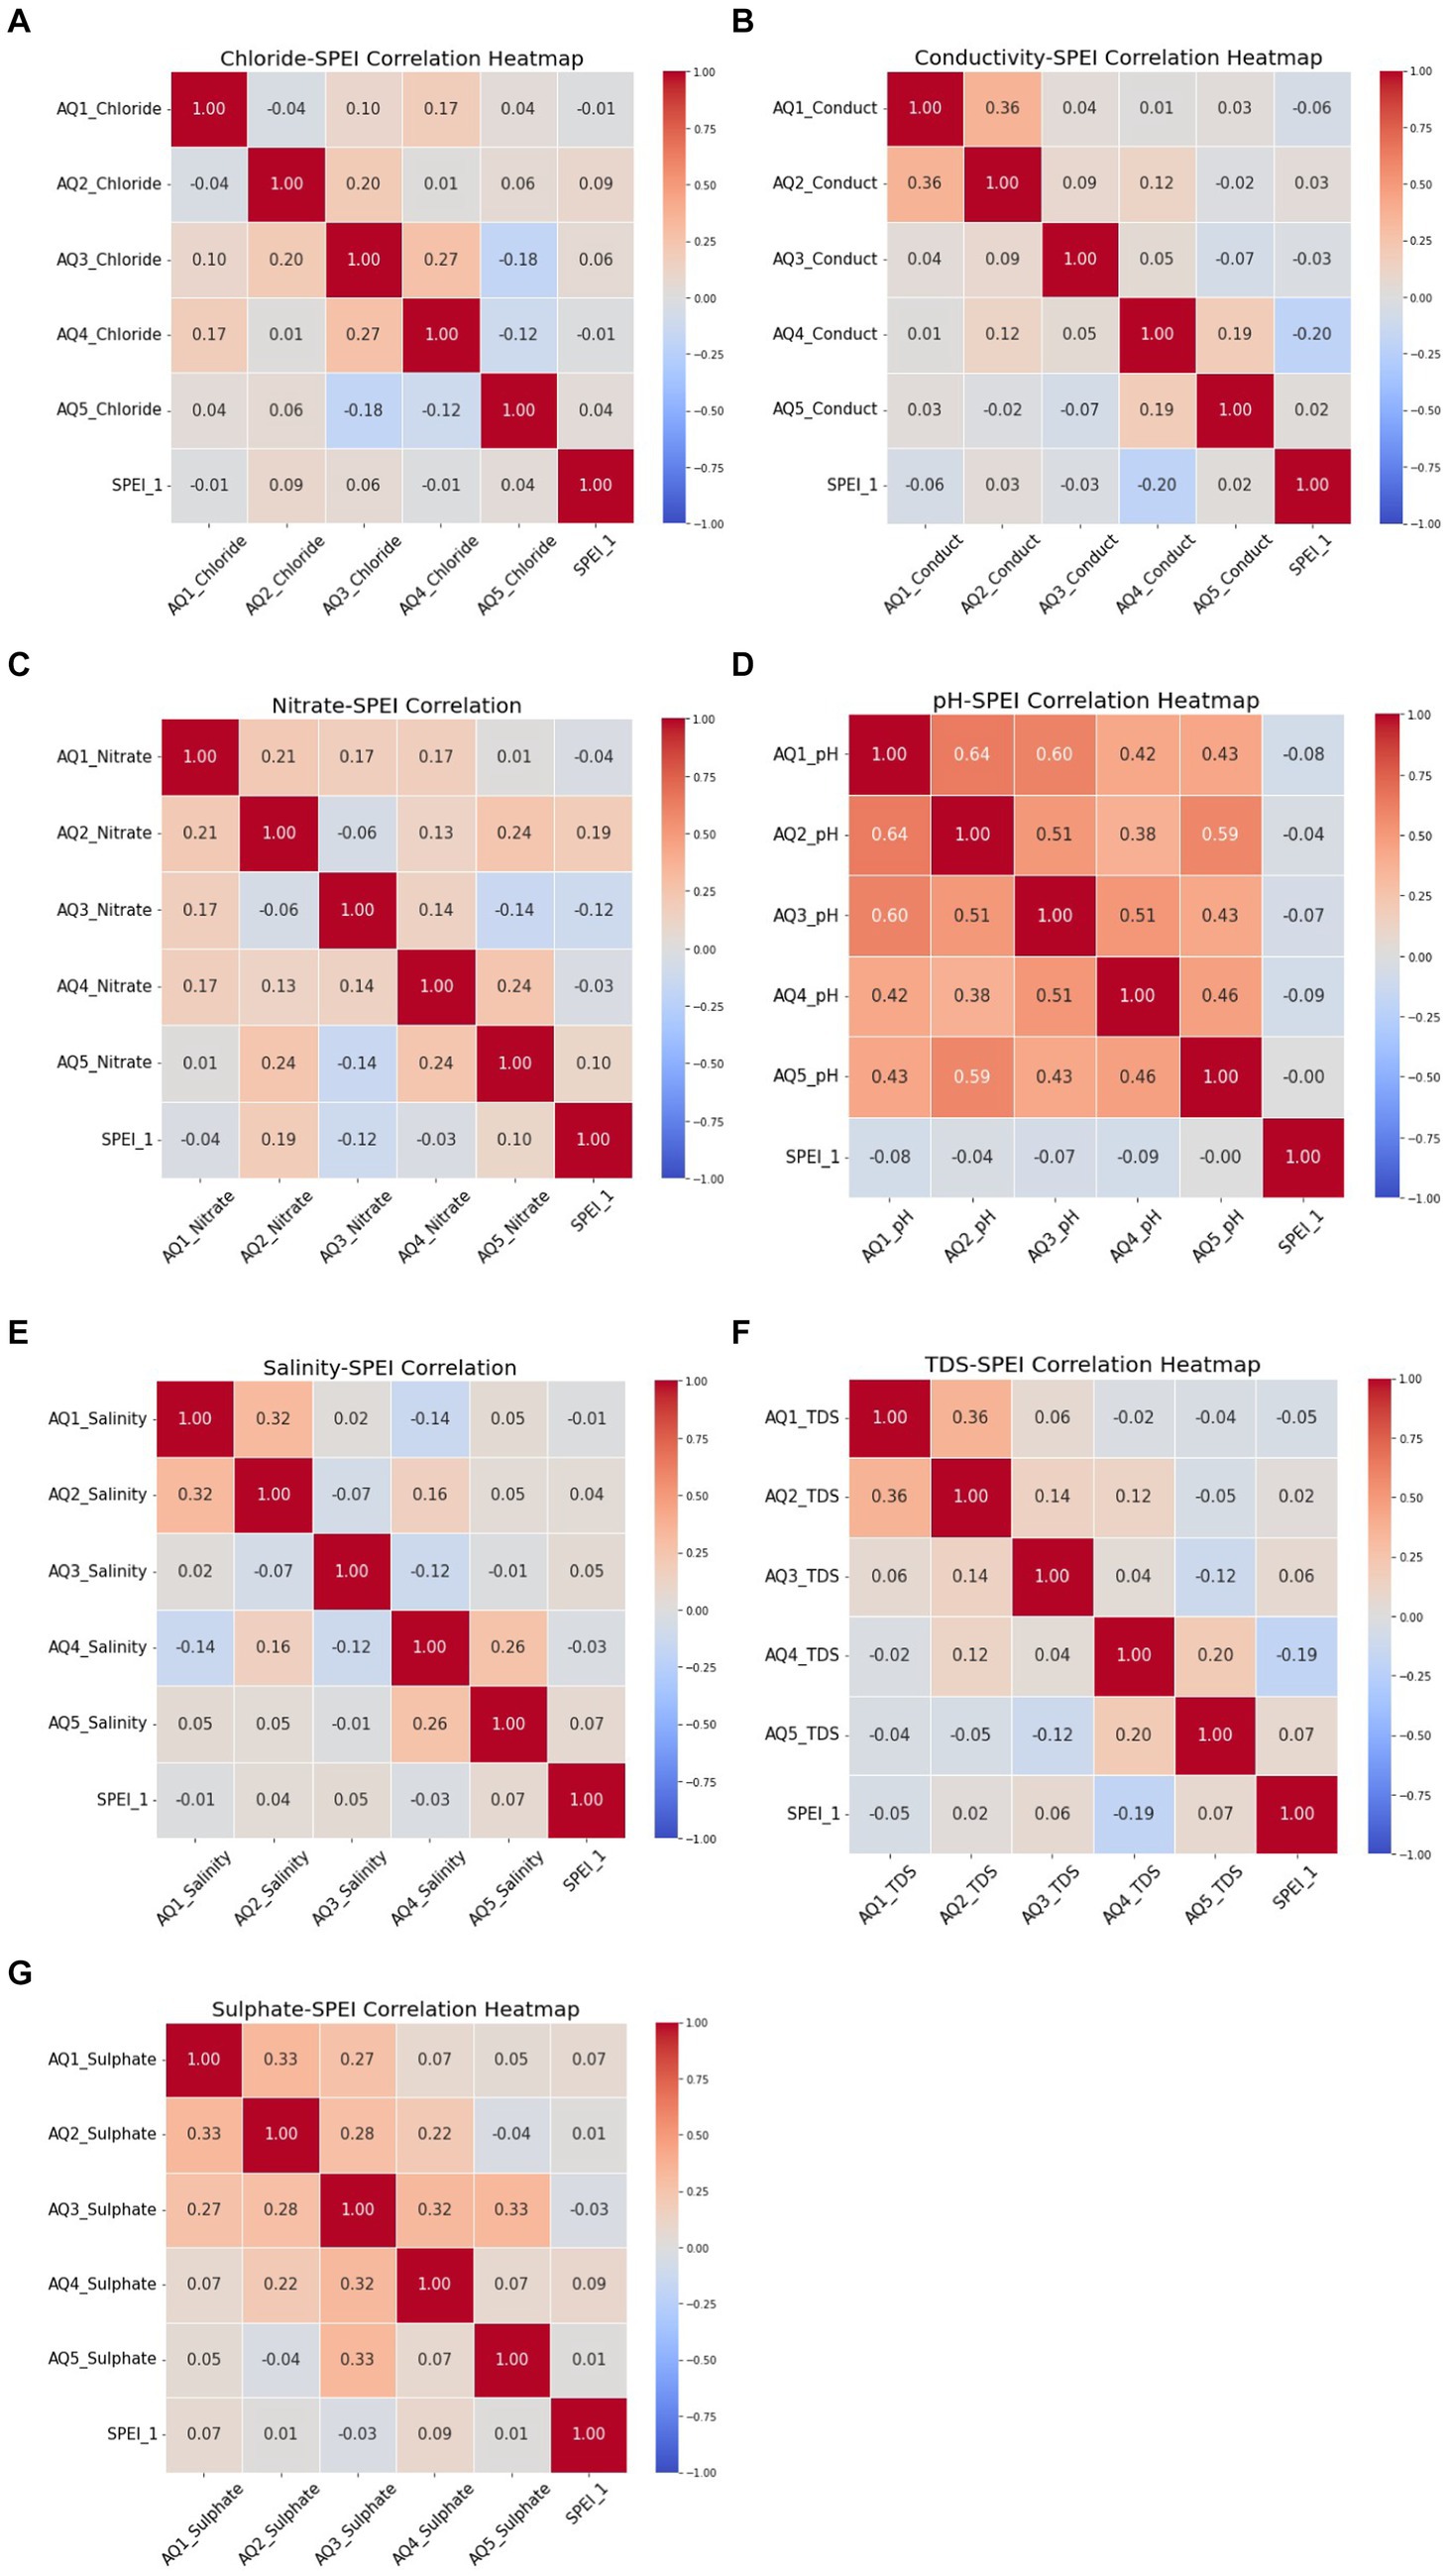
Figure 5. The correlation matrix plot showing relationship strength of the water quality indicators vs the 1-month SPEI. Aquifer correlation vs (A) Chloride, (B) Conductivity, (C) Nitrate, (D) pH, (E) Salinity, (F) TDS and (G) TDS heatmap plots.
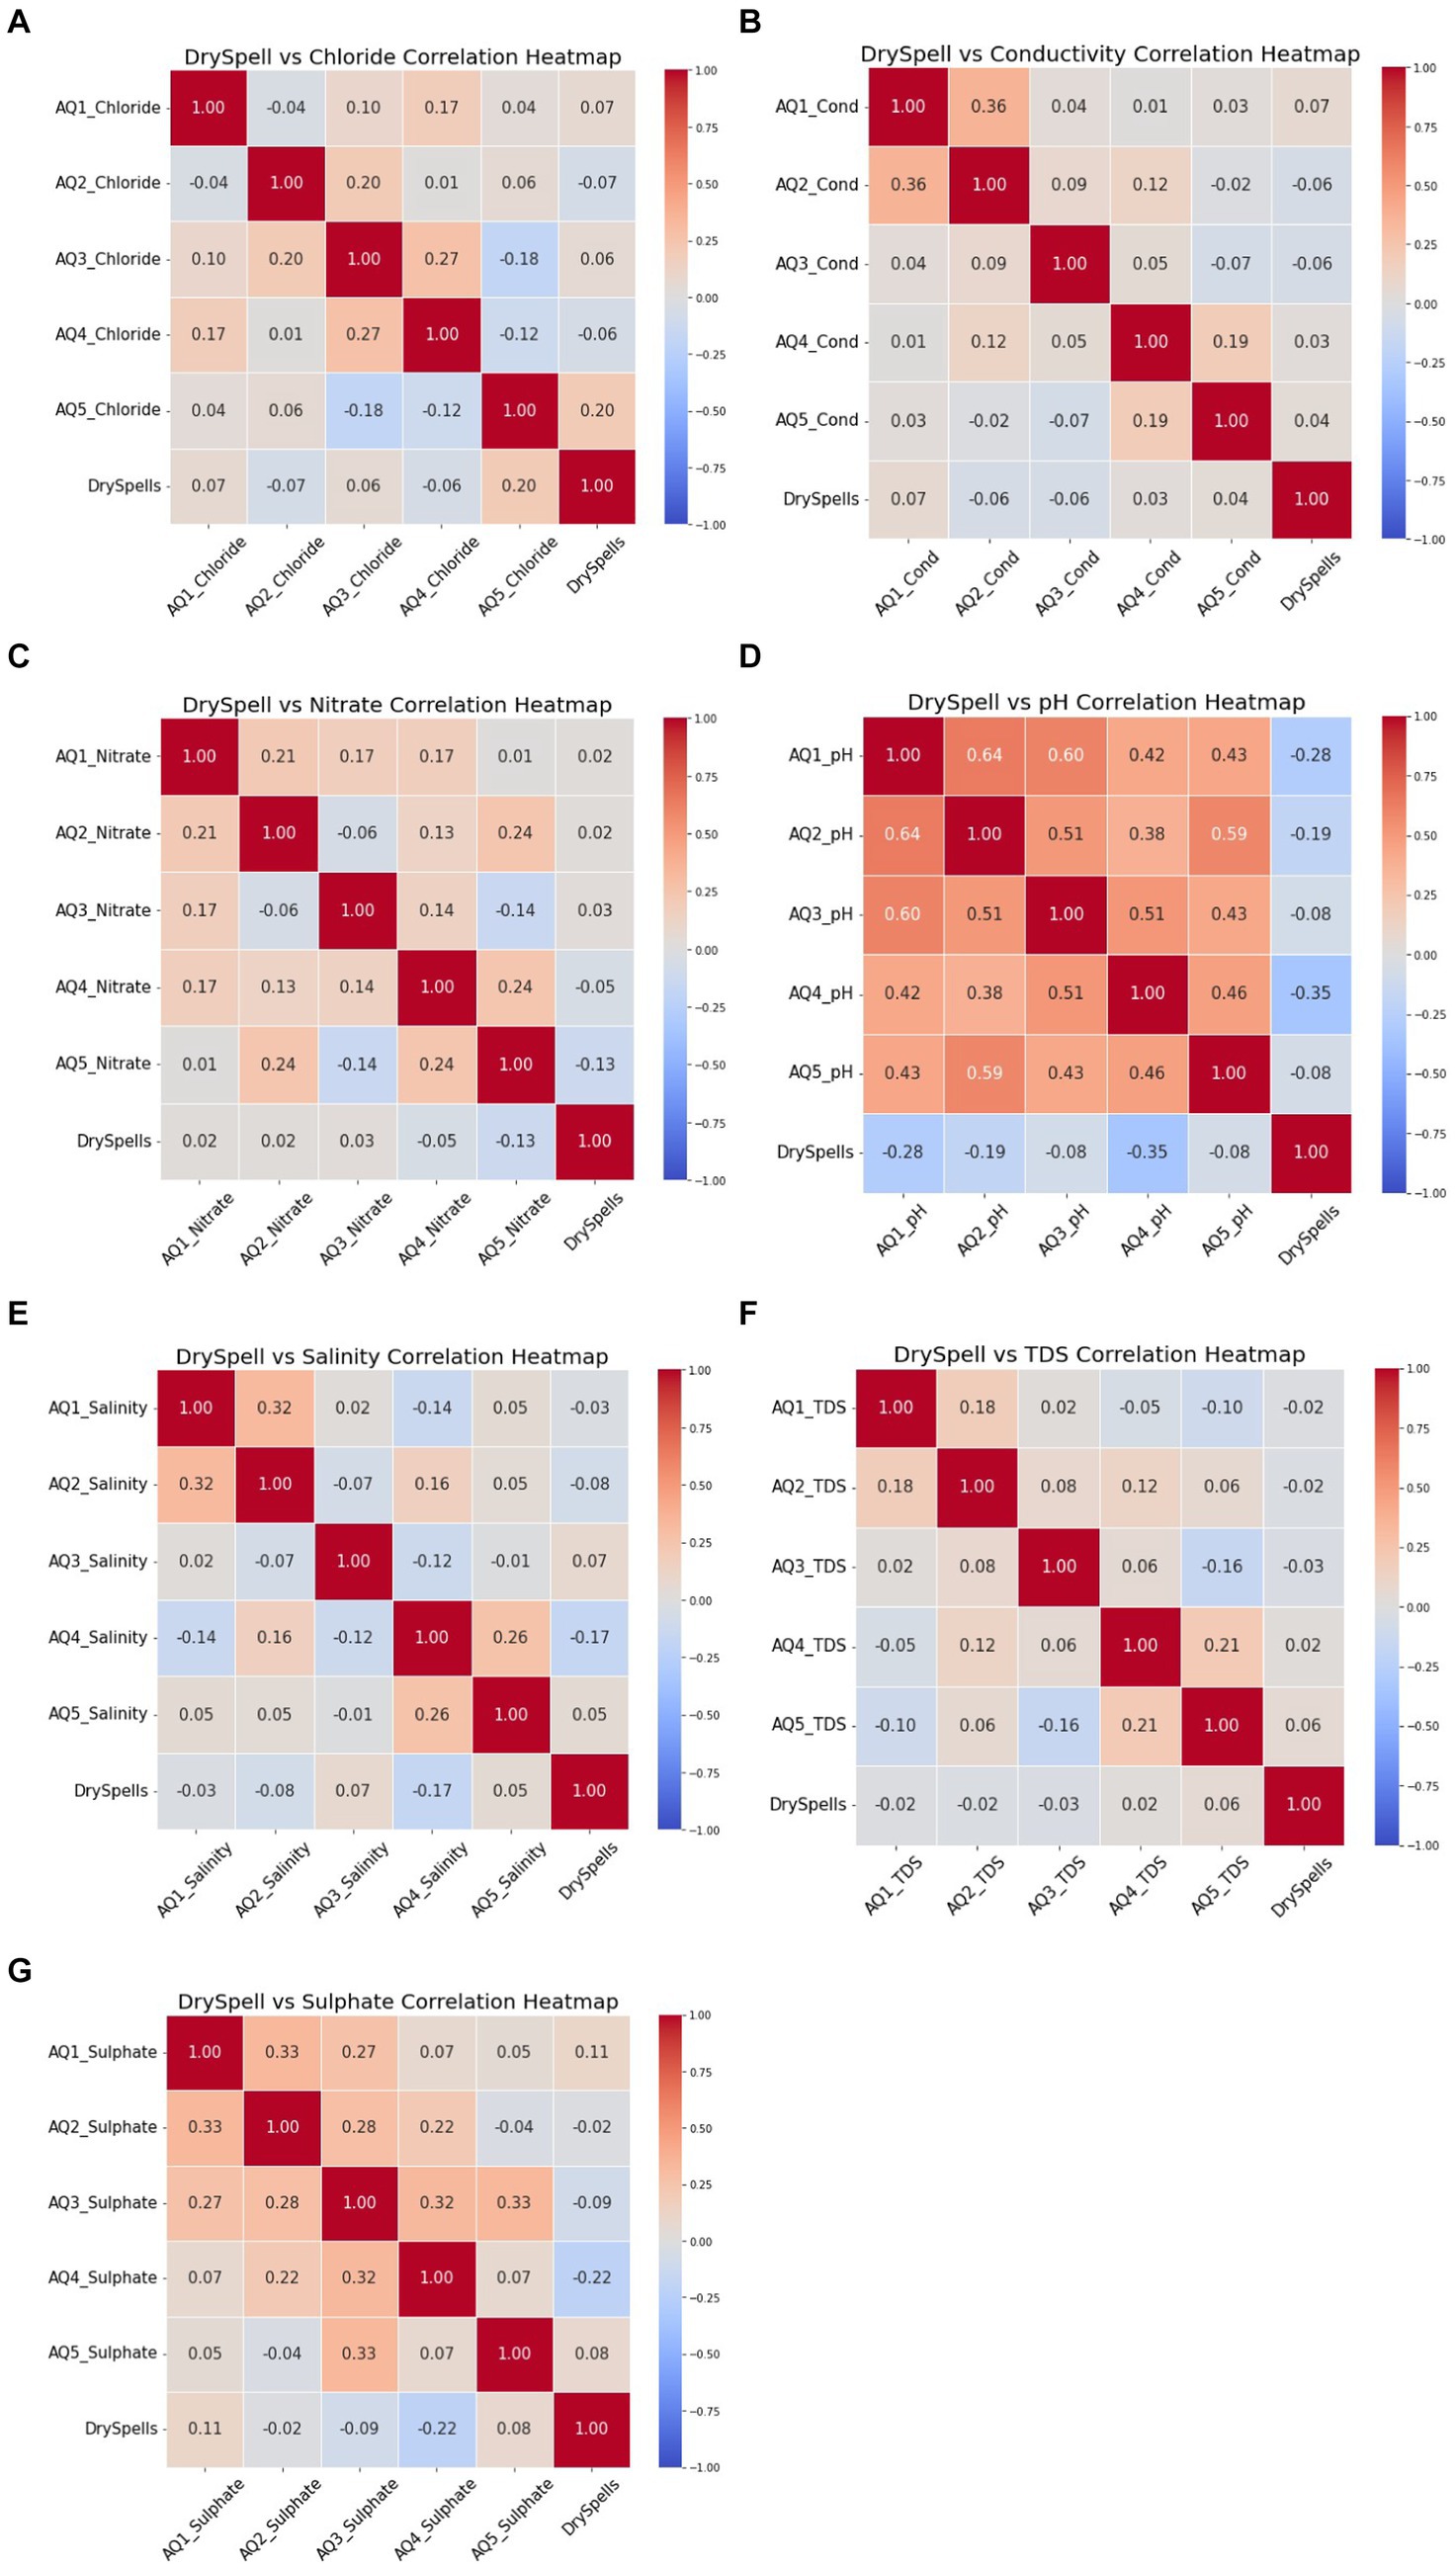
Figure 6. The correlation matrix plot showing relationship strength of the water quality indicators vs the Dry-Spells SPI. Aquifer correlation vs (A) Chloride, (b) Conductivity, (C) Nitrate, (D) pH, (E) Salinity, (F) TDS and (G) TDS heatmap plots.
3 Results
3.1 Water quality time-series data
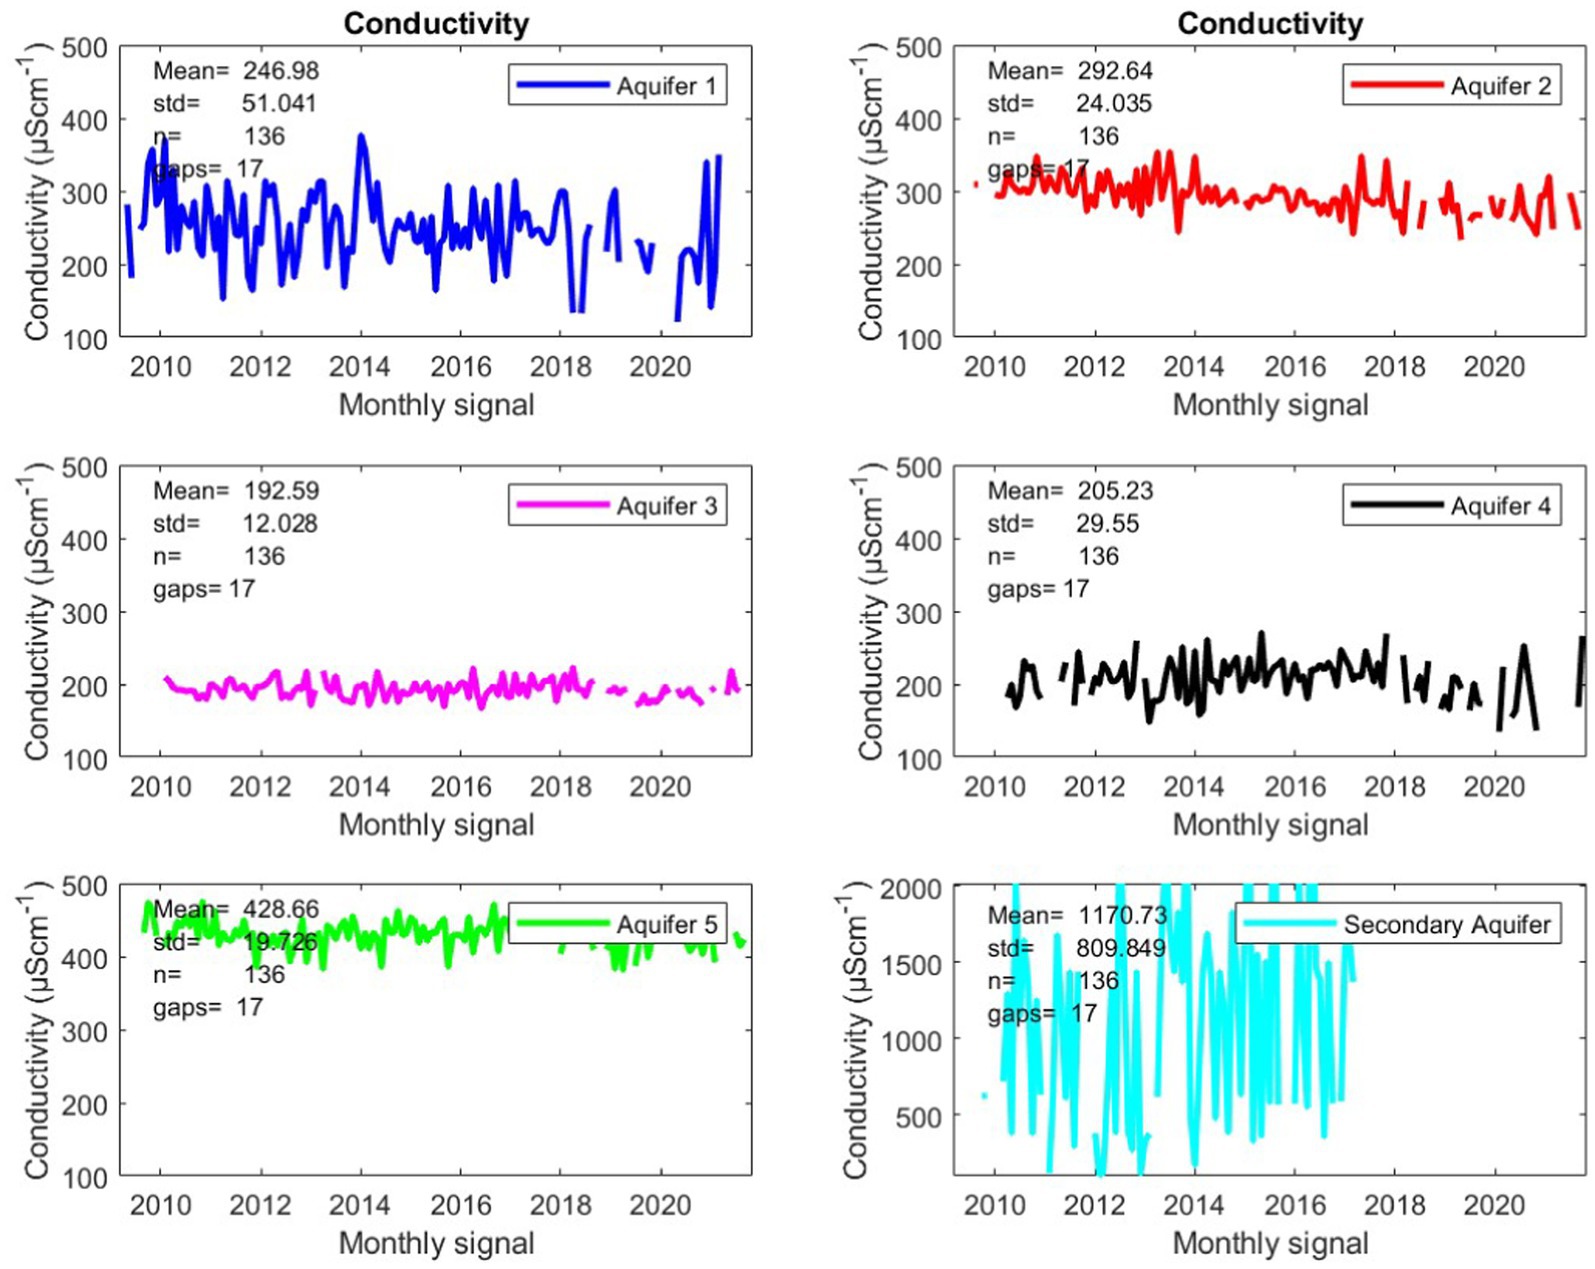
The water quality time-series data represented for nitrate, sulfate, conductivity, salinity, chloride, TDS, and pH will only be demonstrated by the time series of conductivity visually in Figure 2. However, all other indicators including conductivity have been analyzed for correlation against the predictor variables. In addition to the clear trends shown here using the conductivity parameter, where signals vary from aquifer to aquifer, trends have also been captured on other parameters and have also been noted to have varying signals across aquifers similarly (not shown in this paper). The electrical conductivity in the groundwater of Mauritius varies between 172 and 1,166 μS/cm (Izadi et al., 2021). This makes the results obtained in the secondary aquifer suspect and combined with their extreme variance, they seem less well managed or collected; therefore, they carry little prospect of bringing a deterministic value to the overall investigation; hence, the secondary aquifer is excluded from this study.
3.2 Trend analysis and hypothesis testing
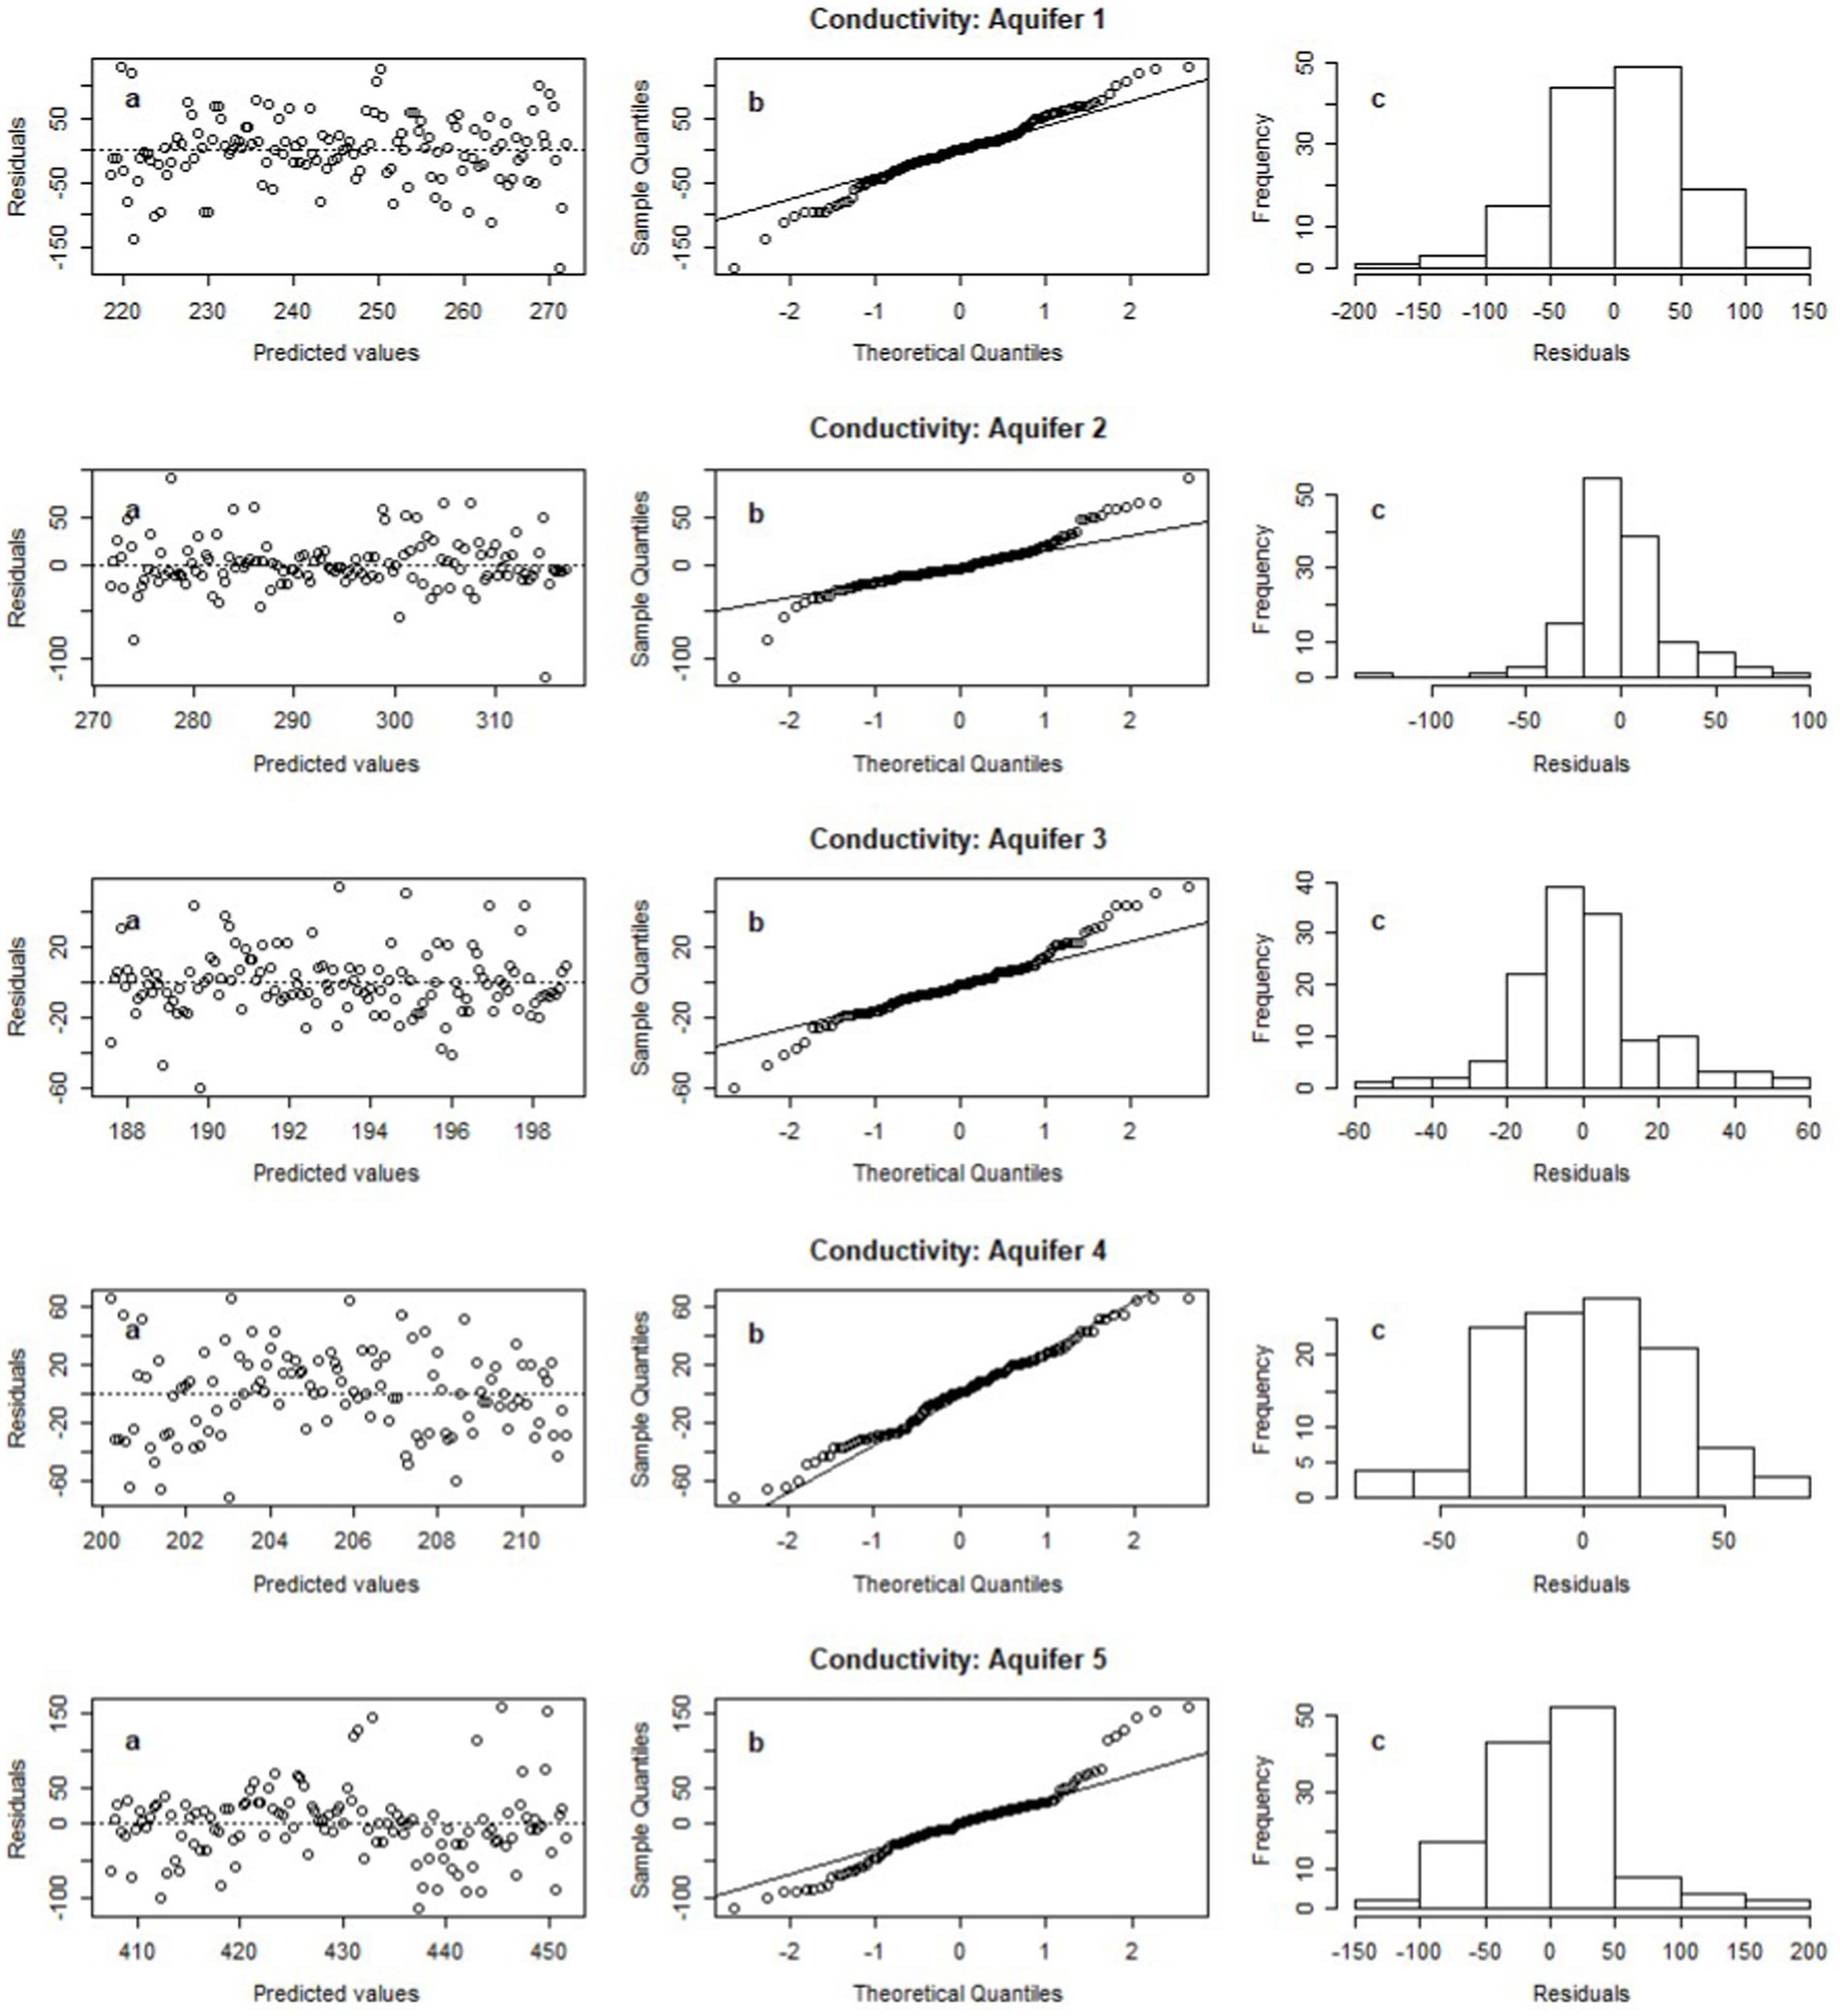
Regression analysis on each of the water quality indicators is undertaken to assess the long-term change through the time series. A simple linear regression is conducted based on parametric statistical methods (which means they depend on the normality of the data). The regression model is always preceded by a model validation. This is a process of testing underlying model assumptions which are as follows:
1. Test for normality of residual distribution,
2. Test for normality of its theoretical quantiles compared to observation quantiles, and
3. Test for the randomness of distribution in the residuals across predicted values.
Figure 3 shows the model validation plots for conductivity and validates the models for each aquifer against the underlying assumptions. Similar validation for each parameter was undertaken before regression on each of them. The Q-Q plots show a relatively straight line along the q-q line of the axis, which satisfies the second assumption, as it demonstrates the normality of quantiles. The quantiles are the groups generated by dividing a frequency distribution into equal groups, sometimes are also referred to as percentiles. The histogram shows a bell-shaped curve distribution, which closely resembles a normal distribution, which satisfies the first assumption in each aquifer. The randomness of the residuals observed in plot a’s demonstrates a correct conformity to the third assumption in each aquifer.
3.2.1 Conductivity hypothesis test
Model validation paves the way for statistical analysis of the linear regression model. The regression statistics displayed in Table 2 show the coefficients of variation of the displayed conductivity time series shown in Figure 2 with additional details such as the standard error, t-value, and the p-values for each aquifer. The coefficient is the trend. The standard error is the sample-adjusted standard deviation, and the p-value is the probability of success where success is the rejection of the null hypothesis. Therefore, hypothesis testing is part of this section where each aquifer regression will be tested for change across time. If the change is significant based on the 95% confidence level, observed through the p-value, then that change is concluded to be statistically significant. However, a change denoted by p-values >0.05 is regarded as insignificant over this time period as it falls outside the 95% confidence level.
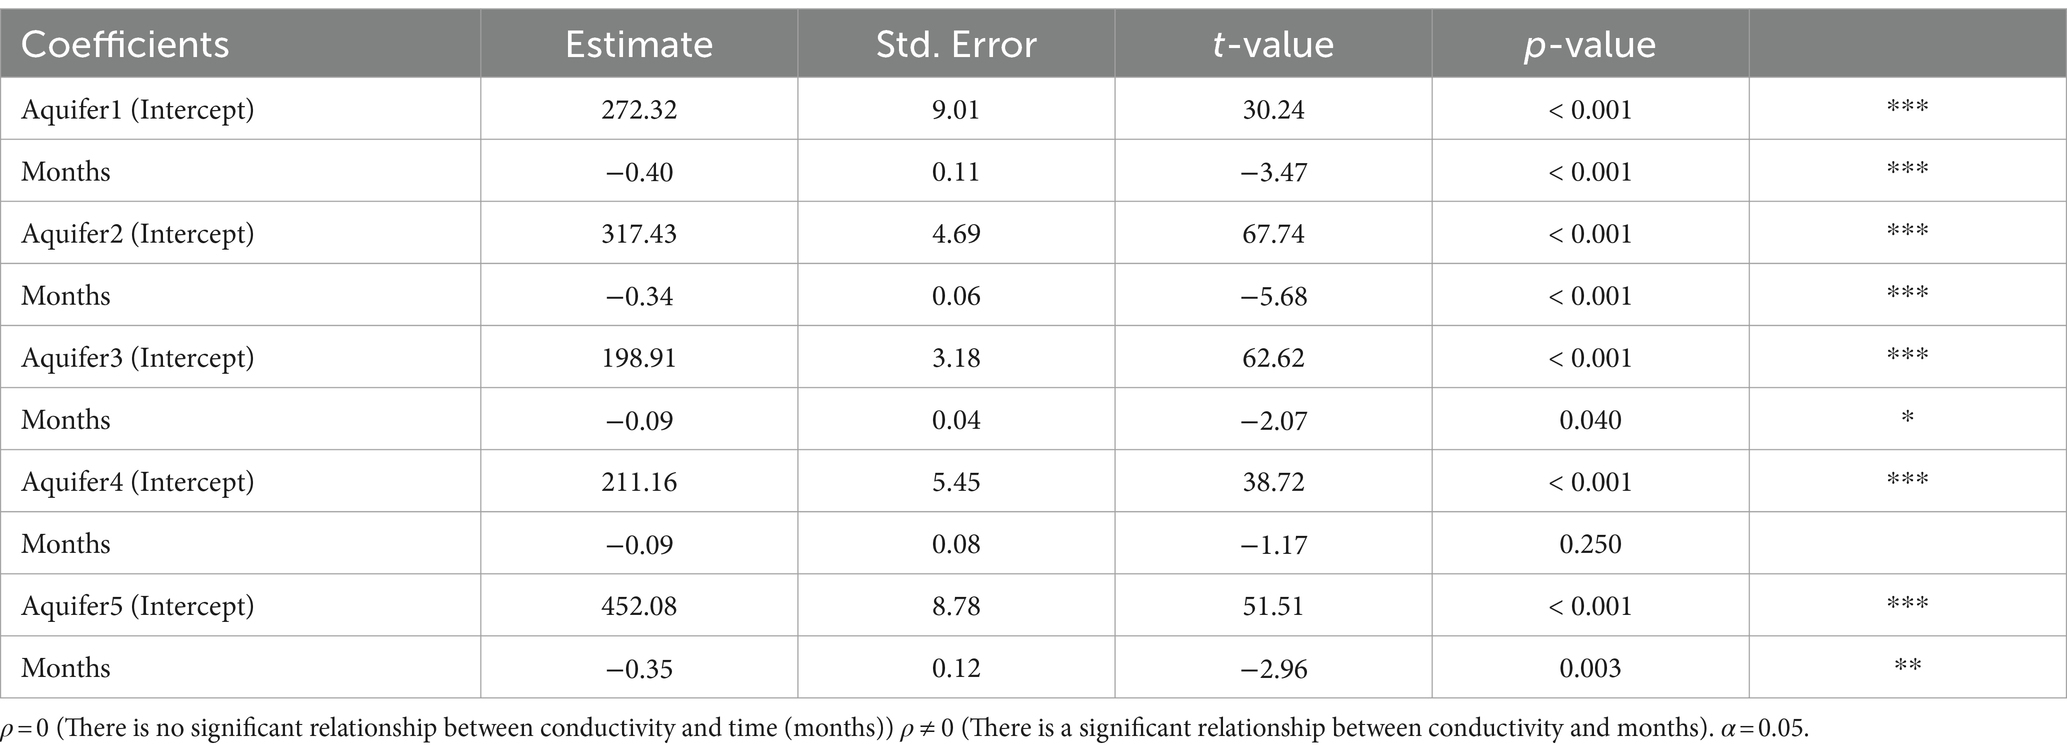
Table 2. Summary of results of a linear regression model of conductivity displays the coefficient of variation, standard error, t-value, p-value, and significance at a 95% confidence level.
The conductivity regression model is given based on the equation:
The β(Conductivity) is the dependent variable (conductivity). The β0 is the intercept, β1 is the coefficient of variation, and ϵi is the error term. It can be observed in Table 2 that aquifers 1, 2, 3, and 5 have significant changes over the period of study with coefficients of −0.40, −0.34, −0.09, and − 0.35 μS/cm per month, respectively. The negative change in each case represents an improvement in the conductivity (lowering of electrical conductivity and dissolved inorganic material ions) state of these aquifers across time. Aquifers 4 and 5 are also negative but are not significantly changing.
The results shown in Table 2 indicate a p-value for aquifer 4 that is greater than α, and therefore, there is no sufficient evidence to reject the null hypothesis in that aquifer as it does not fall within the rejection region of the t-statistic. For the rest of the aquifers, we reject the null hypothesis and conclude that there is a change in conductivity in the Mauritius aquifers over the period of study.
3.3 SPI correlation with aquifer groundwater quality
The correlation coefficients of drought indicators versus each water quality parameter are assessed in each aquifer. The 12-month SPI indicator signal is shown in Supplementary Figure S1, while the water parameter data not shown for the rest of the parameters are exemplified by the conductivity parameter signal shown in Figure 2. The best obtainable results in SPI are observed in the 12-month SPI as shown in Figure 4. The 12-month SPI displays a − 0.40 and − 0.33 sulfate correlation in aquifers 2 and 3; this is to highlight the notable correlations that are above 0.3. These coefficients indicate a potentially significant relationship between the predictor and response variable. The correlation observed after a 12-month lag indicates a much-delayed impact, which could be due to a slow recharge rate.
Figure 4 displays correlation coefficients that are better than correlation coefficients shown by a 1-month SPI, 3-month SPI, and 6-month SPI. The higher frequency SPIs were assessed (results not shown in this paper) and displayed even lower correlation coefficients than the 12-month SPI. The assessment of various frequency SPIs was performed to assess the lag time frame at which drought impacts the aquifers based on this drought indicator. The overall conclusion reached is that it takes an entire year for the effects of the SPI drought to receive maximum response from some of the water quality parameters that appeared to respond to it.
3.4 SPEI correlation with aquifer groundwater quality
The SPEI indicator signal is shown in Supplementary Figure S2 displays the SPEI signal across time. The 1-month SPEI index is considered because it exhibits the highest correlation coefficients compared to other time-span SPEIs. This does not mean the SPEI values were high in absolute terms, only in relation to other SPEI indexes. Figure 5 displays correlation coefficients; nitrate has peak correlations at 0.20 and − 0.18 for aquifers 2 and 3, respectively. These correlations are highlighted as they appear to be the highest in this correlation matrix, but they may not be high enough to suggest a relationship that can be considered strong or meaningful.
Figure 5 displays 1-month SPEI, which is a striking contrast to what was presented by the SPI. The reason for a 1-month SPEI is that similarly after all frequency SPEIs were assessed (results not included for the other SPEIs), the 1-month SPEI was found to be the stronger correlated on this drought indicator notwithstanding the low strength correlations it exhibits.
3.5 Dry spell correlation with aquifer groundwater quality
The dry spell indicator signal is shown in Supplementary Figure S3 with dry spells being brought into the picture. It is visible that there is a really low correlation relationship that can be established between water quality indicators in each aquifer and the dry spells assessed every month. The strongest correlation coefficient seen in Figure 6 is seen in pH at the value of −0.35 in aquifer 4. The dry spells are computed and defined as a series of 7 consecutive days with less than 5 mm of rainfall. These occurrences seem to take place mostly one time a month as shown in Supplementary Figure S3.
3.6 Global climatic forcing
The global climatic forcing indices assessed are AAO, IOS, and ENSO. They are then correlated with water quality parameters to estimate their driving impact on the Mauritius aquifers as shown in Figure 7. Their impact is moderate to weak when assessed against the seven water quality measures studied in this paper. Figure 7 displays their correlations where it can be noted on the correlation matrix that the strongest matches exist among some variables of interest (predicted variables) such as conductivity and TDS as well as salinity and conductivity, etc. These can be expected because some of these variables are derived/computed from each other. However, there is a weak relationship between these global indices and water quality parameters observed in each aquifer.
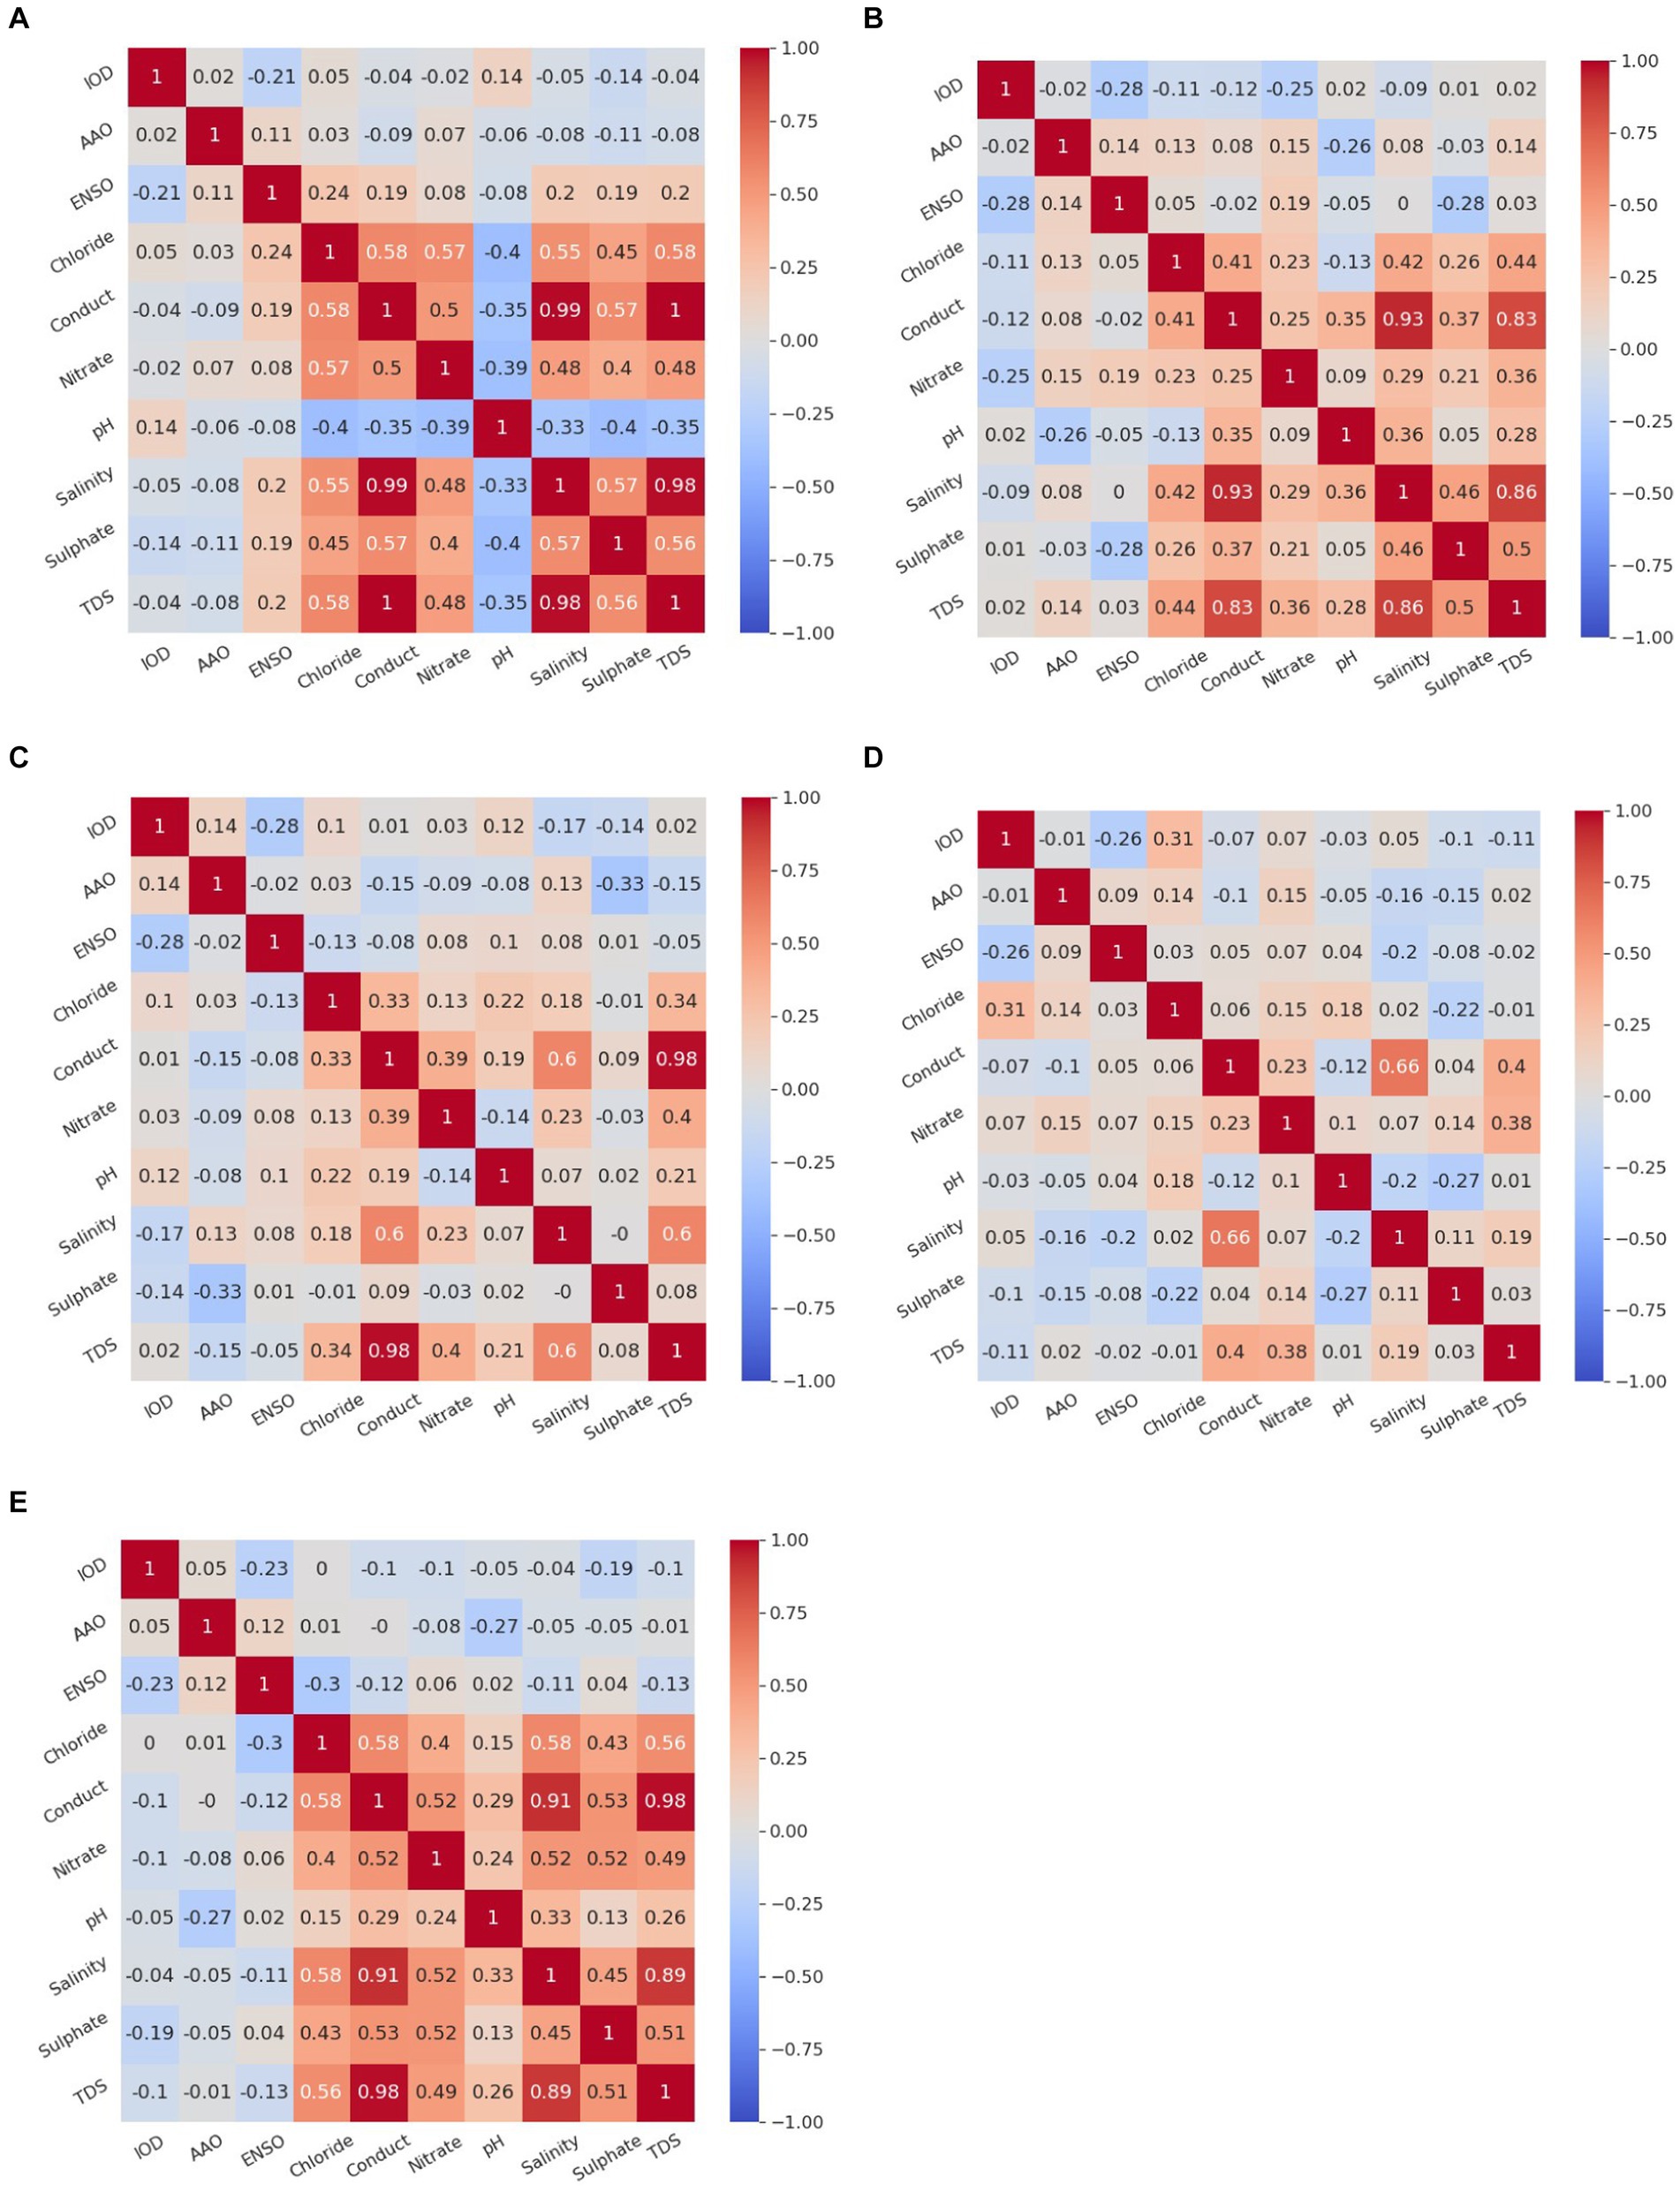
Figure 7. The correlation heatmap plot showing relationship between the environmental factors (IOD, AAO, and ENSO) and the water quality indicators. Global climate modes and water quality parameter correlation vs (A) Aquifer 1, (B) Aquifer 2, (C) Aquifer 3, (D) Aquifer 4 and (E) Aquifer 5 heatmap plots.
Some positive correlations (approximately 0.2) observed in aquifer 7 are between IOD and nitrate, between pH and AAO, and between sulfate and ENSO. In aquifer 4, a relationship of similar proportion is observable between AAO and sulfate. In aquifers 2 and 3, there are no notable correlations between global indices and water quality parameters. In aquifer 1 however, the pH appears positively correlated to AAO also at approximately a low 0.2. Further correlations that are even stronger than the ones highlighted above also exist in this correlation matrix but they are not between the variables we are interested to compare. Therefore, there is no note made about them. These correlations are often predictor versus predictor variable or predicted versus predicted variables, i.e., TDS versus conductivity. The actual monthly signals of AAO, IOS, and ENSO are computed but not shown in this paper as they are generally available in many open-source atmospheric data repositories such as Copernicus data store and NASA data.
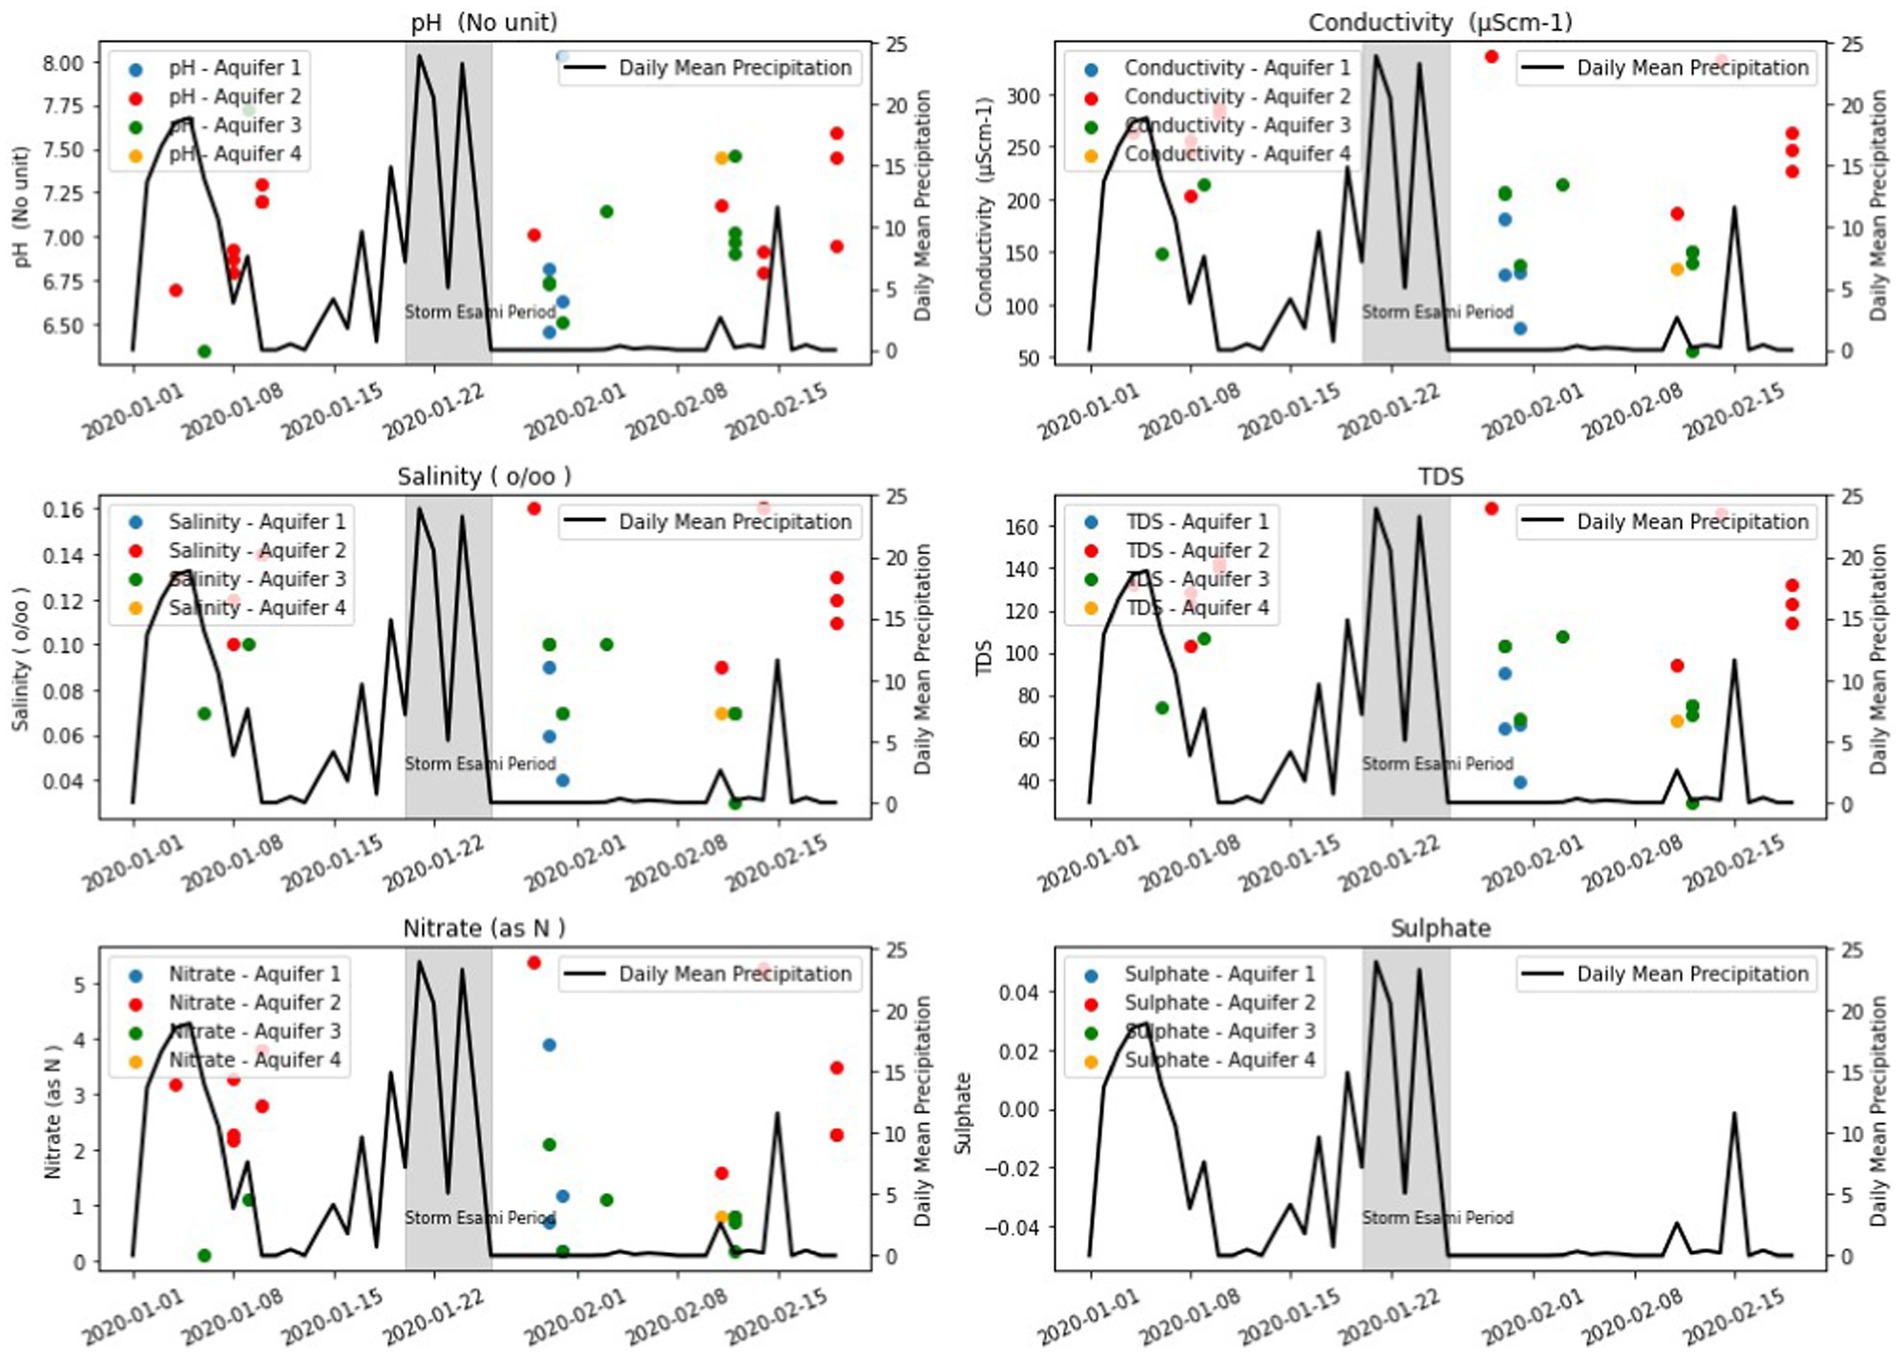
3.7 Rainfall spikes or tropical cyclone impact
The rainfall spikes such cyclones are to be viewed directly in contrast to dry spells as they bring about excessive rainfall over a short period of time potentially elevating the recharge of the aquifers. The selection of a cyclone is made on the basis that it overlaps the in situ data record and directly impacts the island around the time of good in situ observations. Tropical cyclone Esami occurred during the period 21st to the 26th of January as shown in gray highlight in Figure 8. The figure displays rainfall in and around the period of the tropical cyclone and compares the water volumes generated by the storm with groundwater parameter measured quantities. This is done for determining the possibility of short-term rainfall influence on the state of groundwater quality in the assessed aquifers. It is apparent in Figure 8 that pH is only assessed on few occasions after the storm; on the 29th and 30th of January, the quantities are below 7 as shown for aquifer 1 (blue dots). For aquifer 2 (red dots), 3 days after the storm, the pH is in medium quantities of round 7 but after the 8th of February, a period of 2 weeks after the storm, the quantities appear to have increased to approximately 7.25. The pH appears to generally increase after the storm overall as also seen in aquifer 3 (green dots). Assessing a period before the storm is not easy as there was a high rainfall event again that preceded cyclone Esami. However, a comment can be made that during that high rainfall event itself, the pH recorded in aquifers 2 and 3 was low, but after the event, they gradually inclined as shown around the 8th of January. For conductivity, TDS, and salinity after cyclone Esami, they showed a decrease in aquifers 1, 2, and 3. There was only one information available for aquifer 4, and so no comparison could be made. For nitrate, for aquifers 1 and 4, no comparison could be made due to insufficient data. However, a decrease in the level of nitrate could be seen. No data were available for chloride, sulfate, and aquifer 5, this is why the sulfate plot has no data points and the chloride plot was not generated for having the same results as sulfate during this period. Aquifer 5 made no observations during the storm period.
4 Discussion
The conductivity regression computed based on equation (2) has been tested against various aquifers and it showed that there is a base case for assessing the conductivity in all aquifers excluding aquifer 4 as they are changing in time. The study is based on testing the possible drivers of this change. Other variables such as nitrate, pH, phosphate are also assumed to be changing with time but the test done on conductivity will be performed on them on a future study.
The dry and wet spells are periods of extended dry days and extended rainfall days, respectively. The dry spells represent days of little to no precipitation. During this period, the water table receives no recharge and runs low on the solvent. This is expected to contribute to higher chemical and nutrient concentrations within aquifers. On the other hand, wet periods represent days of non-stop precipitation for days in a row or high-volume event precipitations. This theoretically leads to an aquifer recharge, which is important for replenishing the water table and serves to lower the chemical concentration of the ground water. This relationship has been tested in the statistical section to ascertain the strength of this theoretical relationship. In this study, a “dry spell” is defined as a period of 7 days or more in a row that each received 5 mm of rainfall or less. In this assessment, dry spells are analyzed at a monthly level, like the SPI and SPEI even though dry spells tend to be seasonally analyzed in most literature. This was done in order to standardize the temporal component of evaluation across all parameters. As depicted in 7, the global climate modes all appear to detect at below 0.3 in correlation except in the AAO-sulfate where a correlation of −0.33 was detected in aquifer3 and the 0.3 ENSO-chloride correlation in aquifer 5. This signifies a very limited influence of global climate features on aquifer water quality.
The observable pattern shows a high density of dry spells during the years 2019 and 2020. This could potentially explain the reason for cyclone Esami’s detected effect on the aquifers. The aquifers might have been running significantly dryer than usual due to the density of dry spells; therefore, a storm event brought a sudden solvent to the aquifers that was deprived extensively. It was unexpected that the SPI and the SPEI indexes displayed no strong month-to-month correlation with groundwater quality parameters. This study was conducted based on the hypothesis that the amount of available precipitation is the leading indicator of groundwater quality as far as the concentrations of the water quality parameters are concerned. In Figure 4, this relationship was only observed in the 12-month SPI shown, making the meaning of that outcome rather hard to interpret. The global climatic forcing indices showed weak correlations with groundwater chemical/physical properties, making it hard to positively conclude any existence of a direct connection.
There is more that can be said about the different SIDS beyond Mauritius. For example, different SIDS, focussing on their unique issues, employ strategies to address groundwater quality and availability. In the Caribbean, groundwater is a critical resource due to limited surface water availability. Studies indicate that these islands face significant challenges related to over-extraction and pollution. For instance, in the English-speaking Caribbean, groundwater resources are heavily relied upon, yet their management is often hindered by inadequate infrastructure and policy frameworks (Mycoo and Roopnarine, 2024). Additionally, the intrusion of seawater due to over-pumping and climate-induced sea-level rise exacerbates the quality of groundwater, posing severe risks to water security (Hernandez-Delgado et al., 2024). The Pacific region presents a different set of challenges primarily due to its geographic dispersion and climatic conditions.
Many islands in the Pacific, such as those in the Maldives and the Solomon Islands, experience severe droughts, which significantly impact groundwater recharge rates (Jaleel et al., 2020; Dorevella et al., 2021). Furthermore, the limited land area of the islands means that any contamination can rapidly affect the entire freshwater supply. In response, Pacific SIDS have adopted innovative strategies such as rainwater harvesting and the use of desalination plants. These technologies are often combined with traditional knowledge and practices to enhance their effectiveness (Ahmed and Mishra, 2020). Community involvement in these initiatives is crucial, as highlighted by MacDonald et al. (2020), who emphasize the role of local communities in managing and maintaining water infrastructure to ensure long-term sustainability. SIDS in the Indian Ocean, such as Mauritius and Seychelles, also grapple with significant groundwater challenges. These islands face issues related to both quality and quantity, with agricultural runoff and industrial activities being primary contaminants (Majidipour et al., 2021). The limited availability of freshwater resources necessitates stringent management practices to prevent over-extraction and pollution.
The implications of this research on environment and climate change are that groundwater quality can be severely impacted by agricultural fertilizers, which would induce nutrients such as nitrates through ammonia groundwater leaching. This study played a role in investigating whether such has taken place and to what degree. This is an important question as it informs water management and touches on the food security of the Island. The climate impact assessment is handled by the evaluation of the climate modes against the water quality. The low correlations observed show that the impact of climate change is not detected on the groundwater at a remarkable scale.
5 Conclusion
It has been established in this paper that correlations are not very strong between the water quality indicators and the rainfall indicators, which are separated into two categories: drought indicators and global climate modes. However, there were notable correlations in the case where we have axiomatically set a 0.3 correlation as a baseline for a notable correlation. In this case, a 12-month SPI versus sulfate in aquifers 2 and 3 was notable with correlation coefficients of −51 and − 44, respectively. Apart from sulfate, pH was the only other water quality parameter that exhibited a response.
The meaning of the 12-month SPI correlation symbolize a delayed response to water abundance by aquifer’s water quality indicators. Much as it is unfathomable that there can be a 12-month delay in the response to a rainfall event by an aquifer, it is apparent based on observed outcomes that a potentially slow recharge rate in aquifers 3 and 4 might be giving rise to water availability related responses seen in nutrients such as sulfate, chloride, and even nitrate to a lesser extent in the said aquifers. It is further concluded that high storm events such as tropical cyclone Esami result in shorter-term recharge that is observable by a change in water quality parameter concentration days after the storm. The conclusion is that it is possible to observe the impact of storm water in the aquifers though not statistically evaluated, but it is less apparent to see these changes when using a time-series data array as exemplified by drought indicators where any relationships were only observable on longer timescales.
There is no strongly detectable influence of global climate modes on the water quality indicators. The global climate modes all appear to detect low correlations with the aquifers although aquifers 3 and 5 showed some notable yet modest relationships in AAO and sulfate as well as in ENSO and Chloride, respectively. It is worth mentioning that even against the SPI drought indicator, the sulfate showed a notable response to the indicator signal. This can lead to the conclusion that sulfate has a seemingly higher response to water availability than the other water quality indicators. Heavy storms occurring during cyclones impact the groundwater quality with respect to conductivity, TDS, salinity, and nitrate, although this could not be statistically tested given the lack of water quality indicators collected on the days that surround the storm; therefore, the conclusion is made based on one storm event.
The comparative analysis of groundwater challenges in different SIDS highlights the diversity of issues and responses across regions. While Caribbean SIDS emphasize policy interventions and community-based monitoring, Pacific SIDS focus on integrating traditional knowledge with modern technologies. Indian Ocean SIDS, on the other hand, benefit from advanced monitoring systems and participatory governance. Despite these regional differences, the common thread across all SIDS is the crucial role of community involvement in ensuring sustainable groundwater management. By leveraging local knowledge and fostering stakeholder engagement, SIDS can effectively address their unique groundwater challenges and enhance water security.
Future research on this topic can strongly benefit from an assessment done against higher resolution rainfall. The 0.25° × 0.25° resolution precipitation from ERA-5 used in this study for computing drought indicators is not very suitable for this location as Mauritius Island is quite a small geographical location. This results in the rainfall variation getting poorly captured and could have been a factor in the correlation scores. Additionally, the paucity of observations on the boreholes around storm events made storm analysis harder to assess.
Data availability statement
The raw data supporting the conclusions of this article will be made available by the authors, without undue reservation.
Author contributions
VG: Conceptualization, Data curation, Formal analysis, Investigation, Methodology, Resources, Software, Validation, Writing – original draft. SK: Conceptualization, Project administration, Supervision, Visualization, Writing – review & editing.
Funding
The author(s) declare that no financial support was received for the research, authorship, and/or publication of this article.
Conflict of interest
The authors declare that the research was conducted in the absence of any commercial or financial relationships that could be construed as a potential conflict of interest.
The author(s) declared that they were an editorial board member of Frontiers, at the time of submission. This had no impact on the peer review process and the final decision.
Publisher’s note
All claims expressed in this article are solely those of the authors and do not necessarily represent those of their affiliated organizations, or those of the publisher, the editors and the reviewers. Any product that may be evaluated in this article, or claim that may be made by its manufacturer, is not guaranteed or endorsed by the publisher.
Supplementary material
The Supplementary material for this article can be found online at: https://www.frontiersin.org/articles/10.3389/frwa.2024.1432908/full#supplementary-material
References
Ahmed, F., and Mishra, V. (2020). Estimating relative immediacy of water-related challenges in Small Island Developing States (SIDS) of the pacific ocean using ahp modeling. Model. Earth Syst. Environ. 6, 201–214. doi: 10.1007/s40808-019-00671-2
Ashok, K., Chan, W.-L., Motoi, T., and Yamagata, T. (2004). Decadal variability of the indian ocean dipole. Geophys. Res. Lett. 31. doi: 10.1029/2004GL021345
Chacowry, A., McEwen, L. J., and Lynch, K. (2018). Recovery and resilience of communities in flood risk zones in a small island developing state: a case study from a suburban settlement of Port Louis, Mauritius. Int. J. Disast. Risk Reduct. 28, 826–838. doi: 10.1016/j.ijdrr.2018.03.019
Devi Nowbuth, M., Rambhojun, P., and Umrikar, B. (2012). Numerical groundwater flow and contaminant transport modelling of the southern aquifer, Mauritius. Earth Sci. India 5, 79–91.
Doorga, J. R. S. (2022). Climate change and the fate of small islands: the case of Mauritius. Environ. Sci. Pol. 136, 282–290. doi: 10.1016/j.envsci.2022.06.012
Dorevella, N., Waqa-Sakiti, H., and Tabe, T. (2021). Climate change adaptation programmes on water security in the pacific: a focus on the Solomon Islands.
Garnier, E., and Desarthe, J. (2013). Cyclones and societies in the Mascarene Islands 17th-20th centuries
Gong, D., and Wang, S. (1999). Definition of antarctic oscillation index. Geophys. Res. Lett. 26, 459–462. doi: 10.1029/1999GL900003
Guide, W. S. P. I. U., Svoboda, M., Hayes, M., and Wood, D. (2012). World meteorological organization. Geneva.
Gungoa, V. (2016). Use of water quality indices for water quality assessment in small island state: a case study in the northern aquifer of Mauritius. Am. Sci. Res. J. Eng. Technol. Sci.
Hargreaves, G. H., and Samani, Z. A. (1985). Reference crop evapotranspiration from temperature. Appl. Eng. Agric. 1, 96–99. doi: 10.13031/2013.26773
Hernandez-Delgado, E. A., Alejandro-Camis, P., Cabrera-Beauchamp, G., Fonseca-Miranda, J. S., G’omez-Andujar, N. X., Gomez, P., et al. (2024). Stronger hurricanes and climate change in the caribbean sea: threats to the sustainability of endangered coral species. Sustain. For. 16:1506. doi: 10.3390/su16041506
Hersbach, H., Bell, B., Berrisford, P., Hirahara, S., Horanyi, A., Munoz-Sabater, J., et al. (2020). The era5˜ global reanalysis. Q. J. R. Meteorol. Soc. 146, 1999–2049. doi: 10.1002/qj.3803
Izadi, N., Karakani, E. G., Saadatabadi, A. R., Shamsipour, A., Fattahi, E., and Habibi, M. (2021). Evaluation of era5 precipitation accuracy based on various time scales over Iran during 2000–2018. Water 13:2538. doi: 10.3390/w13182538
Jaleel, M. I., Ibrahim, S. A., Hussain, A., Mustafa, M., and Pathirana, A. (2020). A screening approach for assessing groundwater quality for consumption in small islands: case study of 45 inhabited islands in the Maldives. Water 12:2209. doi: 10.3390/w12082209
Jevrejeva, S., Moore, J., and Grinsted, A. (2003). Influence of the arctic oscillation and el nino-southern˜ oscillation (enso) on ice conditions in the Baltic Sea: the wavelet approach. J. Geophys. Res. Atmos. 108. doi: 10.1029/2003JD003417
MacDonald, M. C., Elliott, M., Langidrik, D., Chan, T., Saunders, A., Stewart-Koster, B., et al. (2020). Mitigating drought impacts in remote island atolls with traditional water usage behaviors and modern technology. Sci. Total Environ. 741:140230. doi: 10.1016/j.scitotenv.2020.140230
Majidipour, F., Najafi, S. M. B., Taheri, K., Fathollahi, J., and Missimer, T. M. (2021). Index-based groundwater sustainability assessment in the socio-economic context: a case study in the western Iran. Environ. Manag. 67, 648–666. doi: 10.1007/s00267-021-01424-7
McKee, T. B., Doesken, N. J., Kleist, J., et al. (1993). “The relationship of drought frequency and duration to time scales” in Proceedings of the 8th conference on applied climatology (Boston), 179–183.
Mycoo, M. A., and Roopnarine, R. R. (2024). Water resource sustainability: challenges, opportunities and research gaps in the english-speaking caribbean Small Island Developing States. PLoS Water 3:e0000222. doi: 10.1371/journal.pwat.0000222
Paulo, A., Pereira, L., and Matias, P. (2003). “Analysis of local and regional droughts in southern Portugal using the theory of runs and the standardised precipitation index” in Tools for drought mitigation in Mediterranean regions, 55–78.
Potop, V., and Možný, M. (2011). “The application a new drought index–standardized precipitation evapotranspiration index in the Czech Republic” in Mikroklima a mezoklima krajinnych structur a` antropogenn’ıch prostredˇ, 1–12.
Sarker, S. (2022). Fundamentals of climatology for engineers: lecture note. Eng 3, 573–595. doi: 10.3390/eng3040040
Seebocus, R. H., Lollchund, M. R., and Bessafi, M. (2021). Analysis of extreme rainfall and drought events using statistical and fractal methods: a case study of Mauritius. S. Afr. J. Sci. 117, 1–9.
Svoboda, M., Hayes, M., and Wood, D. (2012). Standardized precipitation index: user guide. World Meteorological Organization.
Thomas, A., Baptiste, A., Martyr-Koller, R., Pringle, P., and Rhiney, K. (2020). Climate change and Small Island Developing States. Annu. Rev. Environ. Resour. 45, 1–27. doi: 10.1146/annurev-environ-012320-083355
Keywords: groundwater quality, precipitation, drought indices, climate change, cyclones
Citation: Gungoa V and Kebede S (2024) Climate variability impact on groundwater quality in Small Island Developing States: Mauritius Island as a case study. Front. Water. 6:1432908. doi: 10.3389/frwa.2024.1432908
Edited by:
Soumendra Nath Bhanja, Oak Ridge National Laboratory (DOE), United StatesReviewed by:
Pankaj K. Gupta, University of Waterloo, CanadaShiblu Sarker, Virginia Department of Conservation and Recreation, United States
Copyright © 2024 Gungoa and Kebede. This is an open-access article distributed under the terms of the Creative Commons Attribution License (CC BY). The use, distribution or reproduction in other forums is permitted, provided the original author(s) and the copyright owner(s) are credited and that the original publication in this journal is cited, in accordance with accepted academic practice. No use, distribution or reproduction is permitted which does not comply with these terms.
*Correspondence: Varsha Gungoa, dmFyc2hhLmd1bmdvYUBnbWFpbC5jb20=
 Varsha Gungoa
 Seifu Kebede