 Matthew Daniel Stocker
 Jaclyn Elizabeth Smith
 Yakov Pachepsky
- 1Environmental Microbial and Food Safety Laboratory, United States Department of Agriculture, Agricultural Research Service, Beltsville, MD, United States
- 2Oak Ridge Institute for Science and Education, Oak Ridge, TN, United States
The presence of fecal bacteria in irrigation waters is well documented in causing human and animal illnesses, with the potential for antibiotic-resistant pathogens to increase the seriousness of these infections. Approaches to sampling fecal and antibiotic-resistant bacteria (ARB) in irrigation waters used in raw food production require standardization to quantify and discern potential spatiotemporal trends in antibiotic-resistant bacteria. Composite sampling is widely used to reduce the cost and time of processing samples while estimating spatial or temporal variation in contaminant concentrations. The objectives of this work were to evaluate the spatial variation in generic and ARB in several irrigation ponds and assess the effectiveness of composite sampling in estimating the average of individual samples. In a grid-like fashion, five irrigation ponds were sampled for generic and antibiotic-resistant E. coli and total coliforms using the Colilert Quanti-Tray/2000 system with and without tetracycline and cefotaxime added. Individual samples were composited in sample sets including all samples, only bank samples, and only interior samples. Coefficients of variations in general were high (> 100%) for generic bacteria and higher for ARB (140%−290%). Concentrations of all measured bacteria were lower in the pond interior locations than the banks. The percentage of tetracycline-resistant E. coli varied among ponds from averages of 0% to 23%. No cefotaxime-resistant E. coli were detected in any of the ponds whereas cefotaxime-resistant total coliforms were detected at each site. The average percentage of cefotaxime-resistant total coliforms varied from 1.1 to 13.8% among ponds. E. coli concentrations in composite samples did not significantly differ from either the mean or median of the individual sample sets in 89% and 83% of cases, respectively, indicating composite sampling to be effective in capturing spatial variation of both generic and ARB. Results of this work can be used to aid in the development of better strategies for surveilling antibiotic resistance in aquatic environments.
1 Introduction
Irrigation water quality is a major worldwide health issue as microbial contamination of these waters has been implicated in major foodborne outbreaks (Uyttendaele et al., 2015; Gurtler and Gibson, 2022). Microbial pathogens such as Salmonella and Shiga toxin-producing E. coli (STEC) can be transferred from contaminated waters to crops which are later consumed by humans and animals resulting in major health and economic burdens associated with foodborne illnesses (Hussain and Dawson, 2013; Hoffman et al., 2015; IFSAC, 2021; WHO, 2022). Therefore, it is critical to develop effective monitoring strategies which accurately characterize the risk of using specific water sources for crop irrigation. Fecal indicator bacteria (FIB) (i.e., E. coli and enterococci) are often used in such monitoring programs (USEPA, 2010).
Densities of FIB can exhibit large spatial variation across irrigation water sources. For example, Murphy et al. (2023) studied spatial variation of total coliform and E. coli concentrations in nine ponds and reported that observed concentrations were spatially independent within those ponds when sampling sites were 56–87 m apart. The authors noted that the observed spatial independence led to different water quality outcomes for risk management. Similarly, significant differences in E. coli concentrations between samples collected at the bank and the interior, as well as the detection of hot- and cold-spots in concentration data, were commonly found in Maryland irrigation ponds (Pachepsky et al., 2018; Stocker et al., 2022). If substantial spatial variation can exist for fecal microorganisms in irrigation water sources and an insufficient number of samples are collected, then this may lead to drastic under- or overestimation of the risk of irrigating from a specific waterbody.
In addition to pathogen contamination in irrigation waters, the presence of antibiotic-resistant bacteria (ARB) is an emerging worldwide health concern. Irrigation waters provide means of dissemination of ARB and antibiotic resistance genes (ARG) to humans, animals, and the environment (Blaustein et al., 2016; Araujo et al., 2017; Pan and Chu, 2018; Amato et al., 2021). Recently there have been calls for standardization of monitoring antimicrobial resistance (AMR) in aquatic environments (Berendonk et al., 2015; Huijbers et al., 2020; Liguori et al., 2022; Bengtsson-Palme et al., 2023). However, at the present time there is a lack of information regarding the extent of the spatial variation in AMR in waterbodies and the available literature is constrained to lacustrine and riverine environments (Nnadozie and Odume, 2019). Small ponds are the most numerous waterbody size on the planet and are a common source of water for irrigation on farms (Downing et al., 2006). Therefore, given the ubiquity of these water type, its importance for food safety, and the lack of information on spatial variations within them, research is needed to better characterize the potential spatial variations which may influence results of monitoring endeavors.
Assessing the presence of both FIB and AMR in surface waters has been acknowledged as a major economic burden (Gerdes et al., 2022; Gurtler and Gibson, 2022; Miłobedzka et al., 2022; Bengtsson-Palme et al., 2023). As a result, in many cases only a single sample is collected from a waterbody to make an assessment albeit over several observation dates. The consequence of this is a loss of information regarding spatial variations in target bacterial populations which may be extensive and have a large bearing on a water quality assessment. One proposed solution for this issue is the creation of composite samples which combine water collected at several locations within a waterbody. The primary goals of the composite sampling are 2-fold: (1) to reduce the sampling and processing burdens while (2) to produce a sample which should better approximate the spatial average than a single sample (USEPA, 2010; Lothrop et al., 2018). The tradeoff with composite samples is the inability to detect site-specific variations in bacteria concentrations and therefore the inability to establish accurate confidence intervals based on empirical distributions.
The use of and theory of composite samples in environmental research is well documented (Lovison et al., 1994; Lancaster and Keller-McNulty, 1998; Keith, 2017; Sousa et al., 2018). However, within the field of microbial water quality, there has been scarce evaluation of composite sampling. Composite water sampling appears to be conducted in larger water bodies such as lakes which may be expected to exhibit a large degree of spatial heterogeneity in fecal bacteria concentrations given their size and diversity of fecal inputs (USEPA, 2010; Phillips et al., 2011; Kinzelman et al., 2020). Bertke (2007) sampled three Lake Erie beaches and found no statistical differences in E. coli concentrations between composite samples and the average of the multiple sampling points which led to similar management outcomes between sampling methods on whether the beach should be closed or remain open. Similarly, Reicherts and Emerson (2010) compared the composited sample of three water samples taken from different locations along a Lake Michigan beach across several events to that of the sample arithmetic mean and found no significant difference in E. coli densities. Converse et al. (2012) compared enterococci concentrations in composite samples and individual samples in South Carolina beach waters and found good agreement between both sample types (average R2 = 0.67 to 0.79). The authors reported that in 15% of cases the composite concentration was higher than the maximum of the individual samples while in 2.5% it was lower than the minimum but ultimately concluded composite sampling to be an effective alternative to taking many discrete samples. Therefore, composite sampling appears to be an effective approach for estimating fecal bacteria concentrations at larger spatial scales.
Compared to lakes and lake beach water, a much smaller volume of research has been conducted for irrigation water sources. Lothrop et al. (2018) evaluated composite sampling within irrigation canals in the Southwestern U.S. They found that the composite samples were significantly different from single samples in terms of both the arithmetic and geometric means and concluded that the composite sample provided the most representative sampling option of the water quality within the canals. Lee et al. (2018) compared discrete and composite water sampling for the measurement of Salmonella and E. coli from three bank locations within 5 irrigation ponds in southern Georgia. The authors found that there were no significant differences in the concentration or prevalence of Salmonella or E. coli in composite samples vs. discrete samples yet concluded that aggregating data from multiple samples (compared with a composite) improved the agreement in results obtained from the bank locations and the water directly above the irrigation intake.
Measurement of antibiotic-resistant E. coli concentrations has been proposed to study resistance in surface waters due to its extensive characterization as a model organism, ubiquity in the environment, and relevance in food safety (Berendonk et al., 2015; Anjum et al., 2021; WHO, 2021; Liguori et al., 2022; Bengtsson-Palme et al., 2023; Li et al., 2023). Antibiotic resistance is also frequently assessed for specific pathogenic microorganisms (e.g., Salmonella and Campylobacter) as well as larger bacterial populations such as total coliforms and heterotrophs with the latter two groups giving an indication of broader levels of resistance present as well as being capable of participating in horizontal gene transfer (Silva et al., 2006; Akiyama and Savin, 2010; Blaustein et al., 2016; Givens et al., 2023; Molale-Tom et al., 2024). While regulations currently exist for determining acceptable levels of fecal contamination in irrigation sources, no such rules have been developed for allowable levels of ARB or ARG and the lack of knowledge on what baseline resistance is present in different environments has been acknowledged as a major research need (Bengtsson-Palme et al., 2023). Information pertaining to where or when to sample a waterbody or how many samples to collect to determine the level of antibiotic resistance present is not available, possibly due to a lack of studies addressing these specific questions. Preliminary work has been performed to assess spatial variation in tetracycline-resistant E. coli across a growing season in a Maryland irrigation pond. It was found that the results of assessments were dependent on where a sample was collected (Stocker et al., 2023). Additional information is needed to better generalize the results of that preliminary study.
The objectives of this work were to (1) assess the spatial variations of antibiotic-resistant E. coli and total coliform populations across five irrigation ponds and (2) evaluate composite sampling as a way to estimate the spatial means and medians of the concentration data.
2 Materials and methods
Five ponds, three in Georgia (P1–P3) and two in Maryland (P4 and P5), were monitored in this study. Pond areas were 15,750, 32,000, 40,750, 41,000, and 4,000 m2 with average depths of 1.2, 1.2, 1.4, 1.3 m, and 2.7 for P1–P5, respectively. The ponds contained 18, 16, 18, 20, and 12 sampling locations for P1–P5, respectively (Figure 1).
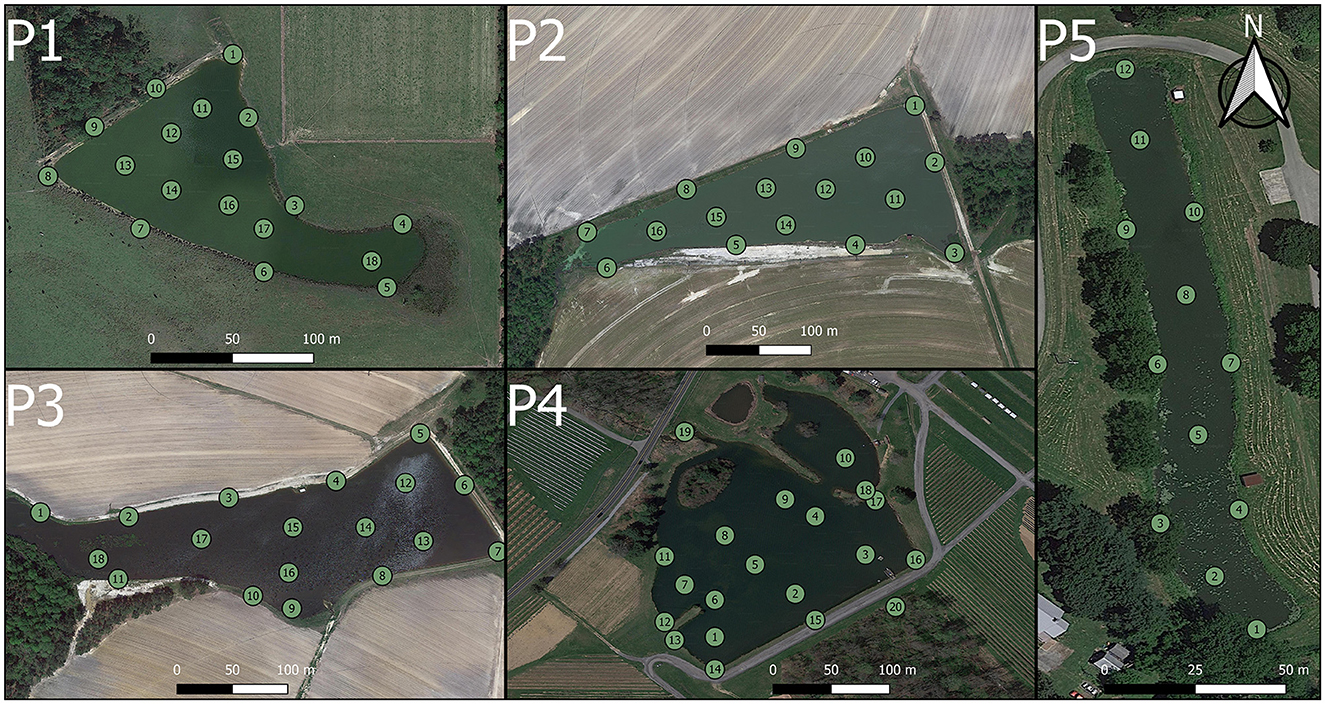
Figure 1. Sampling maps of the five irrigation ponds used in this study. P1–P3 are located in Georgia and P4 and P5 are located in Maryland.
P1 is a farm pond that sits recessed within its surrounding land and is primarily recharged by runoff. Cattle and donkeys are allowed access to the pond and are frequently found in the water with primary entry ways near locations 1, between 4 and 5, and along the western bank between locations 6 and 8. P2 is an actively used irrigation pond which provides water to a rotation of corn and soybeans planted in the surrounding fields. P2 is primarily recharged by the operators via a groundwater pump. P3 is an irrigation pond on the same property as P2 and is located roughly 450 m north of that pond and is primarily recharged by runoff. P4 is an irrigation pond which provides water to surrounding berry and apple fields. This pond is fed from a stream located at sampling position 19. This pond has a level-dependent outflow located near location 3 with location 20 being the outflow. P5 is an irrigation pond located on the Eastern Shore of Maryland at the Wye Research and Education Center (WREC) and has 12 sampling locations with locations 12 and 1 serving as the inflow and outflow locations, respectively. This pond is surrounded by fields planted with a corn-soybean rotation.
Water sampling occurred in the summer so that conditions were representative of when a farmer would need to irrigate. Specific sampling dates were 8/8/2023, 8/9/2023, 8/10/2023, 8/23/2023, and 9/21/2023 for P1 – P5, respectively. Sampling for all ponds was conducted between 9 am to 11 am. Bank samples were collected with a 500-mL sample rod while interior samples were collected by boat. In situ sensing of temperature (°C), dissolved oxygen (DO mg L−1), pH, conductivity (us/cm), fluorescent dissolved organic matter (f DOM μg L−1), chlorophyll-a (CHL, relative fluorescent unit; RFU), and phycocyanin (PC RFU) was performed in the same locations in which samples were collected using a YSI EXO2 multiparameter sonde (Yellow Springs Instruments, Yellow Springs, OH).
All samples were placed immediately in ice filled coolers upon collection and laboratory processing was initiated within 2 hours of collection. Laboratory measurements of subsamples included colored dissolved organic matter (cDOM), chlorophyll-a (CHL-Lab), and phycocyanin (PC-lab) using a fluorometer (Aquafluor, Turner Designs, CA). Filtered (0.45 μm) water samples were also processed on a SEAL AQ300 for orthophosphate (PO4) and Nitrate (NO3) (SEAL Analytical, Meconcin, WI) and a Scalar Formacs HT for total organic and inorganic carbon (TOC and TIC mg L−1), total nitrogen (TN mg L−1), and Nitrate (NN mg L−1).
E. coli and total coliforms were enumerated using the Colilert Quanti-tray 2000 system (IDEXX, Westbrook, ME). A low volume (~0.1 mL) and high volume (100 mL) of homogenized subsample was used to capture concentrations of total coliforms and E. coli, respectively. To determine antibiotic-resistant bacteria concentrations, antibiotic solutions (tetracycline and cefotaxime) were pipetted into respective 100-mL subsamples after the addition of the Colilert media and were then mixed thoroughly before the tray sealing step. Previous work has shown that the Colilert system is a suitable method for determining antibiotic resistance in aquatic microbe populations (Galvin et al., 2010; Boggs et al., 2023; Givens et al., 2023). Dosages of 4 μg mL−1 and 1 μg mL−1 were selected for tetracycline (Zymo Research, Irvine, CA) and cefotaxime (RPI Corp., Mount Prospect, IL), respectively, which corresponded to the low dosages for antibiotic resistance testing of E. coli according to the Clinical and Laboratory Standards Institute (CLSI) (2023). These dosages were chosen for the study because previous work and preliminary testing indicated that antibiotic resistance in non-anthropogenically affected farm ponds was generally low and more difficult to study if higher dosages were used (Stocker et al., 2023). Tetracycline was chosen due to the ubiquity of environmental bacteria which are resistant while cefotaxime was chosen due to its emergence as a clinically relevant antibiotic.
Composite samples were created using equal volumes of samples collected at each pond. A composite sample was created for bank-only samples, interior-only samples, and all samples for both total coliforms and E. coli to evaluate how results may be affected if samples where only collected at certain location types (i.e., bank or interior or both).
2.1 Data analysis
Significance of differences between cumulative probability distributions was evaluated using the non-parametric Kolmogorov-Smirnov test for equality in continuous distributions. Concentration distributions of bank only samples, interior only samples, and all samples were compared. Antibiotic resistance was calculated as the concentration of resistant bacteria in a sample divided by the concentration measured in the unamended sample multiplied by 100. Correlations were performed by calculating the non-parametric Spearman correlation coefficient (rs). To estimate the average and the standard deviation of the sample sets with large proportions (> 50%) of non-detects, the Kaplan-Meier non-parametric method was used (Helsel, 2005; USEPA, 2009). The R code for the Kaplan-Meier method application in this work is available upon request. Means and medians of discrete sample sets were statistically compared to composite values using a one-sample t-test and Wilcoxon signed-rank test, respectively. Statistical significance was evaluated at the α = 0.05 level of probability.
3 Results
3.1 Weather and water quality data
Rainfall totals of 1.1, 1.54, 1.54, 0, and 0 cm were recorded in the 48 h prior to the sampling events in P1–P5, respectively. P1–P3, given the close proximity, experienced similar average air temperatures of 27.2 °C in the 48 h prior to sampling while these values for P4 and P5 were 22 and 19.5 °C, respectively.
Average water quality parameter values of the full, bank, and interior sample sets are shown in Supplementary Table 1. In general, averages and medians of water quality variables did not significantly differ between the bank and interior locations (Supplementary Table 2). Significant differences in certain parameters appeared to be site-specific. For example, phycocyanin measured in the laboratory (PCLAB) was significantly higher at the bank locations of P2 and P4 but was similar among sampling location sets at the other study sites. Similarly, turbidity (NTU) was significantly higher at the bank locations at P4 than interior locations while all other study sites had more comparable levels. The variable showing the most consistency in being significantly different by location type was temperature (°C). In P1–P4, the mean and median water temperatures were significantly higher in the interior of the pond than at the banks whereas in P5 the water temperature was homogenous at the sensing/sampling depth (21.85 ± 0.05, 21.81 ± 0.05, and 21.92 ± 0.12°C for the full, bank, and interior sample sets).
3.2 Spatial variability of coliform concentrations
The average concentration of generic E. coli in bank samples across measurement sites varied from 208 MPN (100 mL−1) in P1 to 5.2 MPN (100 mL)−1 in P5 whereas average interior concentrations were lower with a narrower spread of 37.5 MPN (100 mL)−1 in P1 to 3.8 MPN (100 mL)−1 in P5 (Table 1). Figure 2 shows that substantial right skewness was observed in the majority of individual sample sets. In general, the concentrations of generic E. coli were in the order of P1 > P4 > P3 > P2 > P5. The coefficients of variation (CV) for generic E. coli in each pond were generally high (>100%) except for P2 which had CVs of 90%, 70%, and 22% for the full, bank, and interior sample sets, respectively, and the P4 interior set (85%). In all ponds, the CV was lower for the interior sets than the bank sets. Concentration standard deviations were higher than average concentrations in all ponds except P2 (Table 1).
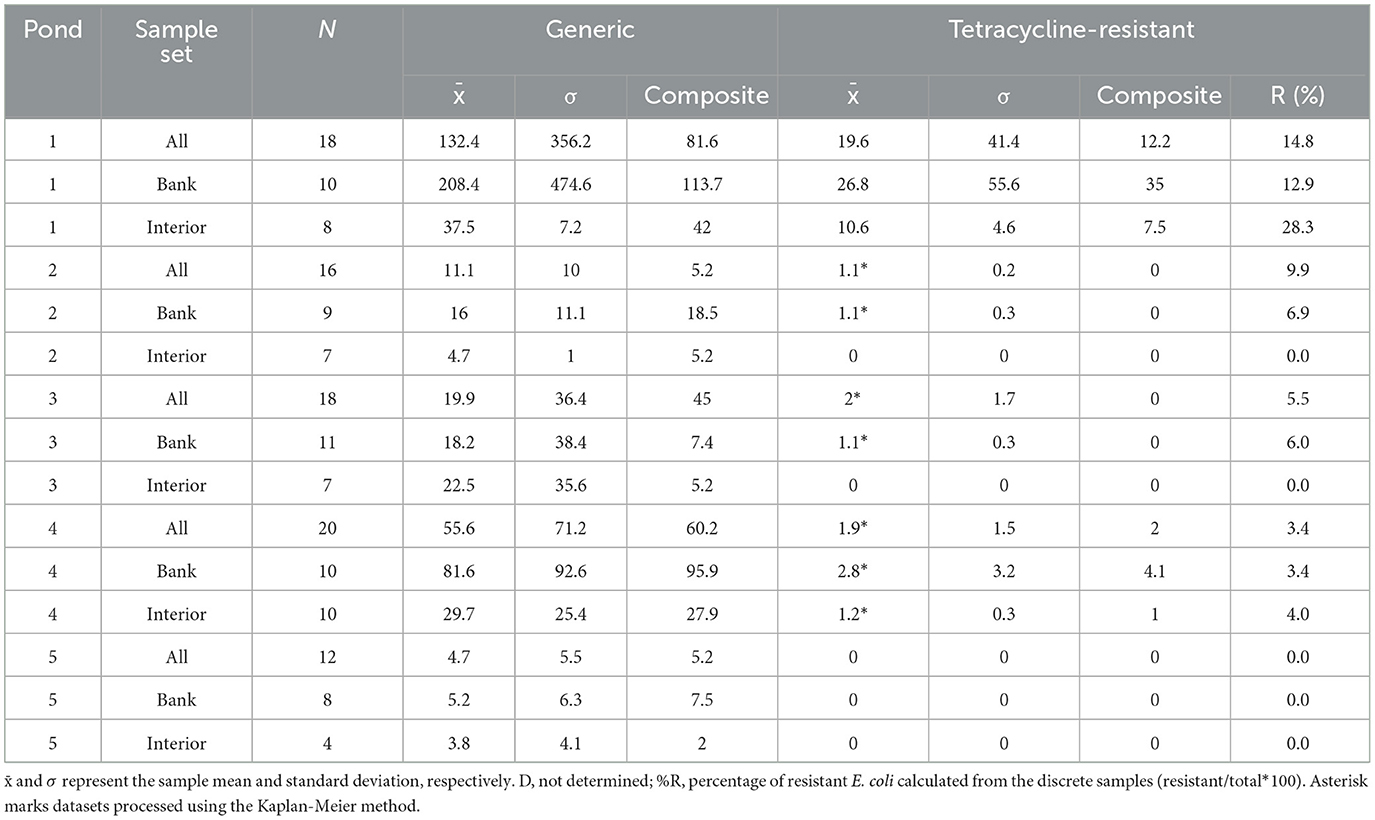
Table 1. Summary statistics for generic and tetracycline-resistant E. coli MPN (100 mL)−1.
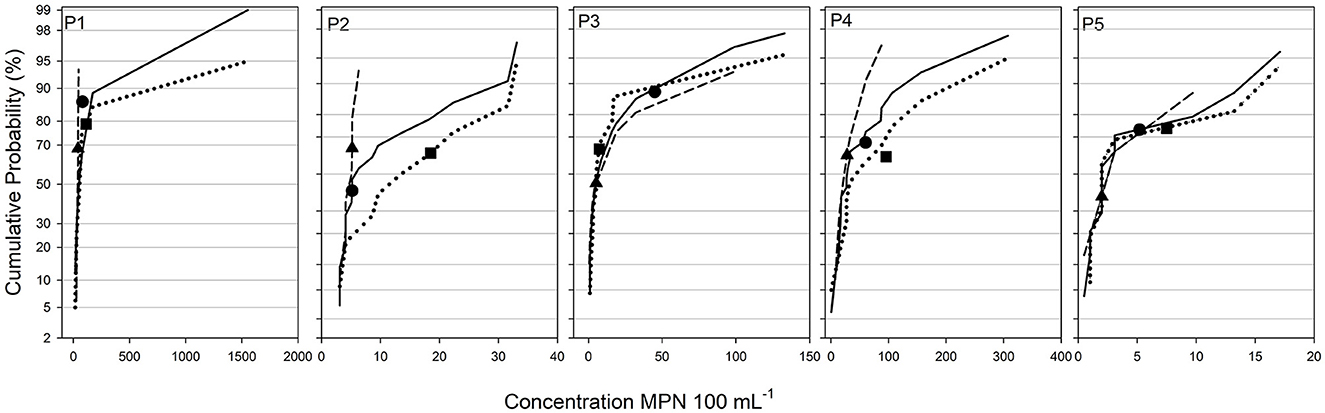
Figure 2. Cumulative probability distributions of generic E. coli concentrations measured in the five ponds. Solid, dotted, and dashed lines correspond to the full, bank, and interior sample sets. Black circles, squares, and triangles correspond to the composite value of the full, bank, and interior sample sets.
Tetracycline-resistant E. coli concentrations on average varied from 28% of the total E. coli populations in the interior of P1 to zero in the interiors of P2, P3, and P5, where no resistant E. coli was detected. P1 contained significantly higher tetracycline-resistant E. coli populations than any of the other ponds (t-test; p < 0.05) followed by P4. P2, P3, and P5 contained more than half of the sampling locations with non-detects. Correlations between concentrations of tetracycline-resistant E. coli and the total E. coli were generally low but positive (rs < 0.3) at P2 and P3 with significant moderate strength observed at P1 (rs = 0.542; p = 0.020) and P4 (rs = 0.492; p = 0.027). The correlation analysis could not be performed at P5 where no detectable tetracycline-resistant E. coli were found. The CVs for tetracycline-resistant E. coli were on average higher than that of generic E. coli ( = 128% and 192% for generic and resistant, respectively) and varied from 140% to 290% with the interior of P1 being an exception with CV = 43%. No cefotaxime-resistant E. coli was detected in any pond during this study.
Compared to E. coli concentrations, total coliforms concentrations showed less variation within each of the five study sites (Table 2; Figure 3). The average CV of the total coliform concentrations across sites and sample sets was 71% with 2 to 5 times lower variation observed in interior locations than bank locations with the exception being P5 (bank and interior CV of 51% and 81%, respectively). P4 had the highest CV for total coliforms with values of 131%, 144% and 44% for the full, bank, and interior sample sets. Average total coliforms concentrations were lower at P1 ( = 5744) MPN (100 mL)−1 than the other study sites which ranged from 9010 to 15606 MPN (100 mL)−1 despite having the highest average E. coli concentrations. Similar to E. coli, average total coliforms concentrations were lower in interior sampling locations than bank locations in all ponds with a range of 1.8 to 3.5 times lower across sites.
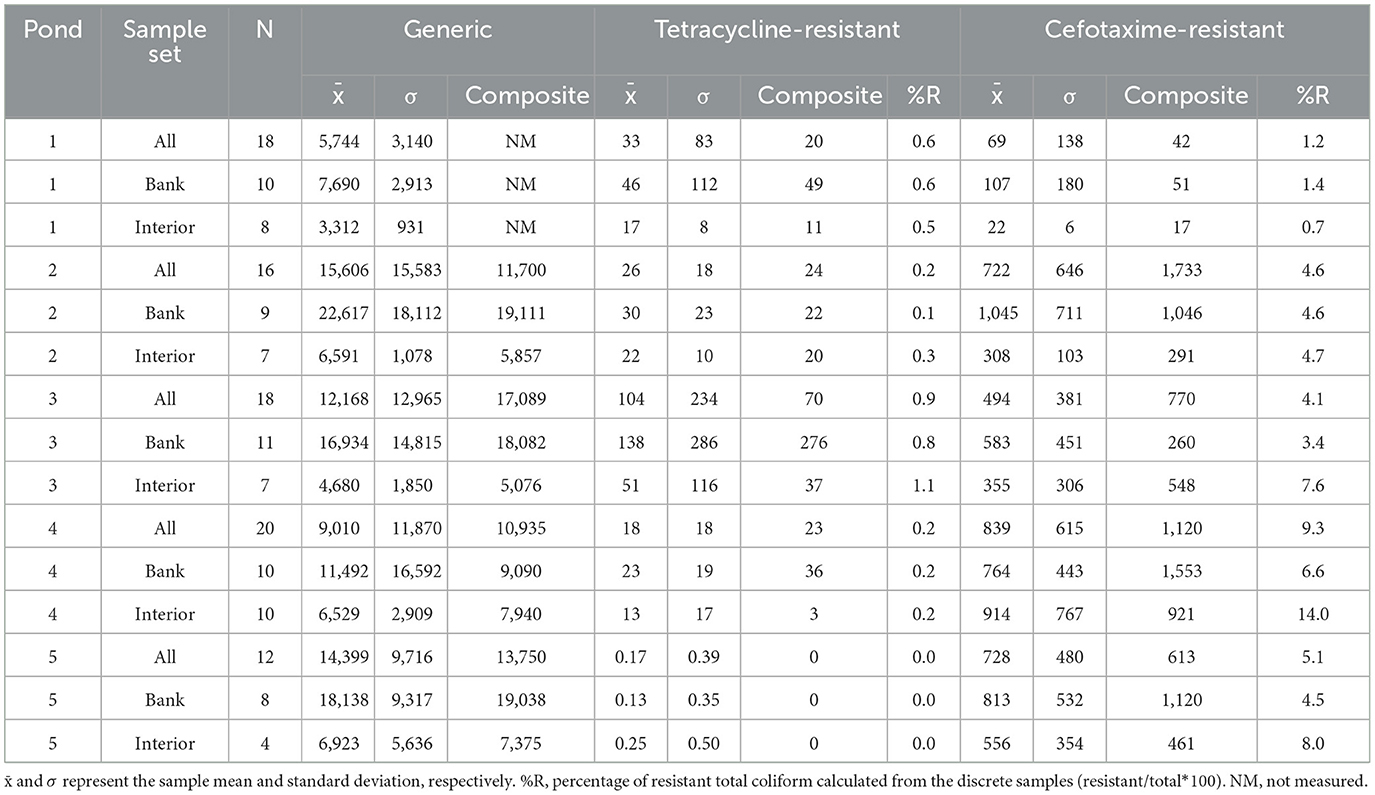
Table 2. Means and standard deviations of generic, tetracycline-resistant, and cefotaxime total coliforms MPN (100 ml)−1.
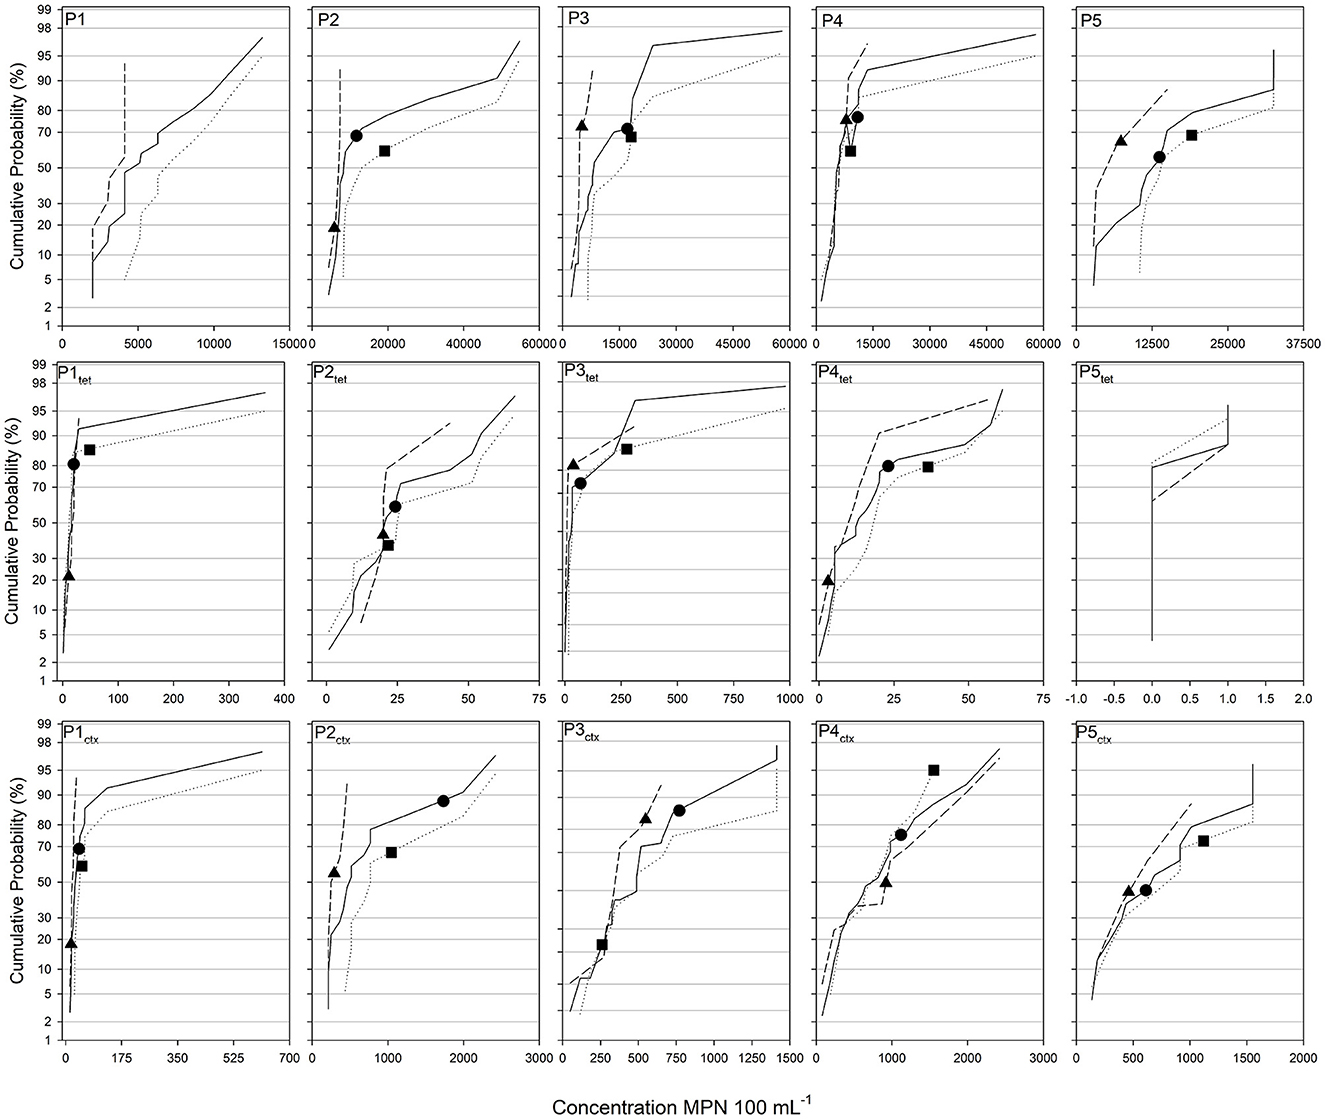
Figure 3. Cumulative probability distributions of generic total coliform concentrations measured in the five ponds. Solid, dotted, and dashed lines correspond to the full, bank, and interior sample sets. Black circles, squares, and triangles correspond to the composite value of the full, bank, and interior sample sets. The first, second, and third row of distribution graphs shows generic, tetracycline-, and cefotaxime-resistant total coliforms, respectively. Composite values were not created for P1 generic total coliforms.
Contrary to tetracycline-resistant E. coli, resistant total coliforms were highest at P3 with a sample-wide average of 104 MPN (100 mL)−1. Average tetracycline-resistant total coliforms concentrations were similar between P1, P2, and P4 with a range of 17.1 to 29.7 MPN (100 mL)−1. The average concentration of tetracycline-resistant total coliforms in P5 was 0.17 MPN (100 mL)−1 with detections only in locations 1 and 2 (Figure 1). CVs for concentrations of resistant total coliforms were very high (>200%) in P1, P3, and P5 whereas P2 had and P4 had CVs of 69% and 99% for the full sample sets, respectively. Although concentrations of tetracycline-resistant total coliforms were always higher than or equal to resistant E. coli (by nature of the Colilert system), the percentage of resistant total coliforms was typically lower than that of E. coli relative to the total population in individual samples when both groups were detected. Resistant members of both groups were not correlated in P2, P3, or P5 (rs < 0.1) but displayed significant positive correlations in P1 (rs= 0.890, p < 0.001) and P4 (0.496, p = 0.025) which were both the study sites which contained more detectable resistant E. coli than non-detects in individual samples.
Cefotaxime-resistant total coliform populations were detected in every study site (Table 2). Average concentrations were lower in P1 whereas the P2–P5 contained similar average values. Likewise, the CVs of cefotaxime-resistant total coliforms concentrations P2–P5 were similar (33%−89%) whereas that of P1 was 199, 167.7, and 28.5% for the full, bank, and interior sample sets. The average percentage of cefotaxime-resistant total coliforms relative to the total population was generally <10% and ranged from 0.66% to (P1 interior) to 14.01% (P4 interior). Correlations between cefotaxime-resistant total coliforms and total coliforms were low in P1, P3, and P4 (rs < 0.3). In P2 there was a significant positive correlation (rs = 0.966; p < 0.001) and in P5 there was a moderate correlation (rs = 0.515; p = 0.086). Interestingly, the CVBank/CVInterior for tetracycline and cefotaxime-resistant total coliforms were very similar at each study site. Concentrations of total coliforms resistant to the two antibiotics were highly correlated in P1 (rs = 0.972; p < 0.001) whereas in the other study sites the correlation was weak (rs < 0.3) or negative (rs = −0.225; p =0.369 in P3).
The similarity of concentration distributions between bank and interior datasets for generic and antibiotic-resistant E. coli and total coliforms was characterized using the Kolmogorov-Smirnov test (Supplementary Table 3). In almost all cases, the concentrations of measured bacteria were higher in samples collected at the pond bank than the interior although this difference was only significant in 8 of 75 (10.7%) cases across the entire dataset. Exemptions to the bank containing higher concentrations were generic E. coli concentrations in P3 (p = 0.489), cefotaxime-resistant total coliforms in P4 (p = 0.962), and tetracycline-resistant total coliforms in P5 all of which had similar or identical concentrations distributions between sampling location types (Tables 1, 2).
3.3 Evaluation of composite sampling for generic and antibiotic-resistant bacteria
Composite samples were created from full, bank, and interior sample sets and generic and antibiotic-resistant E. coli and total coliforms concentrations were assessed and compared to the corresponding individual sample sets. In general, the composite sample concentrations were higher on the cumulative probability distribution curves than the expected 50th percentile value (Figures 2, 3; Supplementary Table 4). For generic E. coli, the composite percentile ranged from 40.6% (P2 full set) to 87.8 (P3 full set) with an average of 65.1% across study sites. Generic total coliforms showed a wider range of 18.8% (P2 interior) to 77.1% (P4 full set) with an average of 61.3%. These ranges for antibiotic-resistant E. coli and total coliforms were similar to the generic total coliforms both in terms of the spread as well as the study wide averages. The average percentile for tetracycline-resistant E. coli in P1 and P4 was 65% while tetracycline and cefotaxime-resistant total coliforms were 62.4% and 62.1%, respectively (Figure 3; Supplementary Table 4). Tetracycline-resistant E. coli were not detected in any composite samples from P2, P3, or P5. Cefotaxime-resistant total coliforms showed the largest range of percentiles for composite sample values with the minimum and maximum occurring in P1 interior samples (18.1%) and P4 bank samples (95%).
In general, composite sample values were not significantly different from mean or median E. coli or total coliforms concentrations (Supplementary Tables 5, 6). One-sample tests of means and medians using the composite sample and the respective sample sets returned only two significant differences for generic E. coli. These were the full sample sets in P2 and P3 and the full sets for P1 and P3 for testing of significantly different means and medians, respectively. No significant differences in means were detected for composite sampling of generic total coliforms while the full sample sets in P3 and P4 contained composite values which were significantly different than the medians of those datasets. For tetracycline-resistant E. coli and total coliforms no composite sample was significantly different from the mean of any dataset. For medians, the full P4 and interior P4 and P5 composites were significantly different from the sample set medians. Cefotaxime-resistant total coliforms showed the largest number of significant differences between sample sets and composites for both mean (33% of cases) and medians (40% of cases) with a large amount of overlap on which sets were significantly different (Supplementary Tables 5, 6).
Linear regressions between the means of discrete sample sets and the corresponding composite sample values showed significant positive relationships (p < 0.05) for generic (R2 = 0.861) and tetracycline-resistant E. coli (R2 = 0.687) and tetracycline- (R2 = 0.767) and cefotaxime-resistant total coliforms (R2 = 0.914). Due to an outlier in the generic total coliform dataset (P3 interior set), a weaker relationship was observed for this group (R2 = 0.327). Removal of this outlier greatly improves the coefficient of determination (R2 = 0.785; p < 0.001). In all cases, regression results showed that the slopes (m) were significantly different than 0 (p < 0.05) and, in general, were close to 1 (m = 0.785 to 1.023) indicating a strong correspondence between the means of discrete samples and the composite values.
An examination of the Z-scores was performed to determine how many standard deviations the composite value was above or below the mean of the discrete samples sets. The average Z-score for generic E. coli and total coliforms was 1.23 ± 3.33 and 0.84 ± 2.02, respectively. In 93.3 and 91.7% of cases, generic E. coli and total coliforms composite sample concentrations fell within 1 SD of the mean, respectively (n = 30 cases across bacterial groups and sample sets). The lowest and highest Z–score was observed for the full sample set of E. coli in P4 and the interior set of E. coli in P2 with values of 0.06 and 13.24, respectively. Standard deviations of tetracycline-resistant E. coli and total coliforms were lower than generic with Z-score averages of 0.29 ± 0.25 and 0.28 ± 0.26, respectively. No Z-score for tetracycline composite samples was above a value of 1.0 for E. coli or total coliforms. For cefotaxime-resistant total coliforms, the average Z-score was 0.55 ± 0.44 and in 87.7% of cases the composite sample fell within 1 SD of the mean. The exceptions were P2 interior and P4 bank sample sets with values of 1.52 and 1.44, respectively.
4 Discussion
Across the five studied ponds, the interior sampling locations generally showed lower coefficients of variation relative to the bank samples. This reduced variability may be related to better mixing conditions in the interior of the pond and higher variability of bacteria influx and survival conditions along the banks. In addition to greater variability at the banks, samples in these locations contained consistently higher average concentrations of measured bacteria (Table 1) although in most cases the differences were not significant (Supplementary Table 3). Greater abundances of bacterioplankton in samples collected at the banks relative to interior locations have been previously reported in agricultural ponds. This has been attributed to flow stagnation occurring at bank sites which may have increased turbidity and improved solar shielding and to banks serving as the main entry way for runoff containing bacteria and nutrients as well as fauna (Smith et al., 2022; Stocker et al., 2022). In the present study, location 1 at P1, which serves as a major entryway for cattle into the water, contained the highest concentrations of generic and tetracycline-resistant E. coli. It is likely that fecal material associated with the cattle was shed in this location before they moved further into the pond center. It is important to note that the cattle on the property were located at an adjacent (not sampled in this study) pond on the day of the sampling event. This may indicate that the survival of shed bacteria in water may be an important factor influencing the fine-scale within-pond variations of generic and antibiotic-resistant bacteria observed during monitoring events.
In this work, most of the observed statistical distributions in datasets without non-detects were substantially right skewed and were better approximated using a lognormal rather than a normal distribution. Such distribution shapes have been commonly observed in water quality monitoring and recommendations on multiple composite sampling for concentration distributions which change in time were developed under the assumption of the applicability of the non-lognormal distribution (USEPA, 2010; Havelaar et al., 2017). In the areas with low concentrations of generic E. coli, conclusions about the type of distribution for tetracycline-resistant E. coli could not be made with certainty because of the substantial number of non-detects (ponds P2, P3, and P5). We realize that the assumption of lognormality used to estimate the mean and standard deviation in the presence of non-detects could introduce some uncertainty in the results regarding the low E. coli conditions. The EPA proposed several techniques for estimating these parameters, including the Kaplan-Meier method utilized in this work (USEPA, 2010). However, the use of statistical techniques for estimating population parameters in the presence of a large number of non-detects has not been tested for antibiotic-resistant bacteria which creates an interesting avenue for future study within the field of environmental AMR work.
Studies assessing the spatial distribution of aquatic ARB and ARG have been performed almost exclusively at the watershed scale or in large waterbodies such as lakes with high concentration areas usually associated with riverine inputs, adjacent land uses types (e.g., urban or agricultural), or proximity to wastewater treatment facilities (Huerta et al., 2013; Suzuki et al., 2013; Liang et al., 2020; Wang et al., 2020; Cho et al., 2023; Huijbers et al., 2023). Information regarding fine-scale variations in AMR in small waterbodies is usually constrained to urban, aquaculture, or wastewater treatment ponds where sampling of the influent, midpoint, and effluent are common but, in many cases, only a single sample is collected per sampling date (Tendencia and de la Peña, 2001; Mispagel and Gray, 2005; McKinney et al., 2010; Harmon et al., 2019; Craddock et al., 2020; Hou et al., 2021). In the cases where multiple samples are collected, they are often composited prior to analysis or have the results pooled during data analysis which makes determining the spatial variation across the waterbody impossible (e.g., Lopes et al., 2022; Yoneda et al., 2022). More work is needed to elucidate the spatial variation in AMR in not only irrigation waters but other surface waters as well as the collection of a single sample may result in the under- or overestimation of antibiotic microorganisms or genes present in a waterbody.
For total coliforms, variability as expressed with the CV was lower than that for E. coli. Such differences in variability were observed in various freshwater systems and may have been related to the multiplicity of sources of non-E. coli coliforms such as Klebsiella and Enterobacter (Francy et al., 1993; Noble et al., 2003; Fiello et al., 2014). This to some extent is corroborated by information shown in the EPA method 1604 where it was reported that the coefficients of variation for the total coliform group displayed a lower range than for E. coli in the results of multi-laboratory testing which may be related to the relatively more transient nature of E. coli in the environment (USEPA, 2002). The variability of antibiotic-resistant total coliforms was also generally smaller than that of generic E coli (Tables 1, 2).
The composite samples provided a reasonably accurate representation of averages over individual samples across all ponds (Figures 2–4). Such a result could be expected although combining samples changes habitat conditions for bacteria taken from different sampling locations, and that could impact the ‘composite-average' comparison results. The observed differences between composite and average might have both analytical and natural reasons. For example, the physical mixing of the individual samples may have changed the growth or survival conditions of bacteria in the water samples between collection and processing (USEPA, 1995). For example, if the pH (or other control parameter) levels are different across the pond and bacteria accustomed to certain conditions are mixed into a composite sample with differing pH then this rapid change may have adverse effects on the bacteria and our ability to enumerate them. However, in this work, composite samples were created in the laboratory near the time that discrete samples were being processed, and so conditions which may have affected survival or growth would not be expected to have a large effect given the short processing time. This brings up an interesting question on the effects of compositing in the field shortly after sample collection or in the laboratory shortly before sample processing and which method is preferable. Another possible reason for differences between composite concentrations and the average of the sample set may be due to imperfect mixing within the individual samples which were used to create the composite. For example, if the target bacteria were attached to particles in solution and those particles were allowed to settle, the subsampling of water closer to the bottom of the bottles would result in a higher composite value relative to sampling water toward the top or middle of the sampling bottle. This highlights the importance of thorough mixing prior to creation of the composite sample. The United States Geological Survey recommends the use of compositing devices such as “churn” or “cone” splitters, which mix discrete samples into homogenous composites which removes some of the error resulting from sampling of individual bottles (USGS, 2019).

Figure 4. Linear regressions between composite sample values and sample set averages. Panels (A–E) show data from generic E. coli, generic total coliforms, tetracycline-resistant E. coli, tetraycline-resistant total coliforms, and cefotaxime-resistant total coliforms, respectively. Red, green, yellow, blue, and cyan symbols indicate data from P1–P5, respectively, while circles, squares, and triangles indicate full, bank, and interior sample sets. Missing symbols indicate when the mean of the discrete samples or the composite value were zero. R2 and m indicate the coefficient of determination and the (zero intercept) slope of the linear regression, respectively.
The tetracycline resistance observed in this work is hypothetically related to cattle management. The cattle located on the P1 property are administered both chloro- and oxytetracycline when they are symptomatic for diseases (personal correspondence with farm managers) which likely explains the elevated levels of tetracycline-resistant E. coli measured at this site. Study site P4 had the second highest concentrations of tetracycline-resistant E. coli and total coliforms with the highest concentrations of the latter measured at the inflow (location 19) which receives water from a property upstream containing cattle. Ponds 2, 3, and 5 contained almost no tetracycline-resistant E. coli and do not have domesticated animals on the property indicating that relatively higher levels are related to animal husbandry which has previously been identified as a major source of this antibiotic in the environment (Daghrir and Drogui, 2013; Liguori et al., 2022). Interestingly, tetracycline-resistant E. coli were not detected in composite samples from P2 or P3 despite being detected in individual samples at these sites albeit in only a few samples and at low concentrations which was also observed for total coliforms in P5. It is probable that the dilution of the resistant bacteria occurred during compositing which caused the concentration to fall below the detection limit of the IDEXX system (1 MPN 100 mL−1). Dilutional effects have been acknowledged as an issue with regard to composite sampling (USEPA, 1995). One strategy to overcome this is selective retesting of individual samples if the composite sample results in a positive concentration and the goal is to identify “hot-spots” or sources of resistant bacteria.
While cefotaxime-resistant total coliforms were observed, cefotaxime-resistant E. coli were not detected at any study sites. Quantitative results on the resistance to cefotaxime or extended-spectrum beta-lactamase (ESBL) producing E. coli are scarce in the literature regarding antibiotic resistance in irrigation water as most studies report the results of susceptibility testing of isolates. Studies of ESBL-producing E. coli specific to irrigation waters from across the world have generally reported low percentages (0 to 2.9%) of resistance in the tested isolates (Holvoet et al., 2013; Jongman and Korsten, 2016; Dungan and Bjorneberg, 2021; Solaiman et al., 2022). One such quantitative study that assessed ESBL associated resistance across Iowa streams reported finding ESBL-producing total coliform bacteria in 94% of samples with an average resistance (to 1 μg mL−1 dose) of ~0.7% and 1.0% for total coliforms and E. coli, respectively (Givens et al., 2023). Another study of the Tama River in Japan reported cefotaxime-resistant (to 4 μg mL 1) E. coli comprised 2.9% to 5.3% of the total E. coli population (Tsutsui and Urase, 2019). Overall, information regarding quantitative estimates of ESBL-producing microorganisms, as well as those resistant to other antibiotics, in irrigation waters is largely absent in the literature as most studies appear to quantify resistant microorganisms in wastewaters or other heavily anthropogenically affected waters (Harris et al., 2014; Ribeiro et al., 2018; Sanderson et al., 2018; Marano et al., 2020). This quantitative information, which can be supplemented by the testing of individual isolates, will provide a better understanding of the overall prevalence of antibiotic resistance in aquatic environments and therefore should be a future area of research. One may anticipate a larger volume of quantitative data on ESBL-producing E. coli in response to the WHO's recent release of the “Tricycle Protocol” which proposed methods for measuring and monitoring cefotaxime-resistant E. coli in human, animal, and environmental sectors (Efadeswarni et al., 2021; WHO, 2021).
The concentration of antibiotic-resistant bacteria tended to positively correlate with the generic populations in this work. The general abundance of cultured E. coli has been shown to correlate with levels of antibiotic-resistant E. coli in riverine (Somerville et al., 2007; Ram and Kumar, 2020; Ott et al., 2021; Givens et al., 2023) and lacustrine (Stocker et al., 2023) systems however the ratios between the two groups is dependent on the local resistance in the human and animal populations (Huijbers et al., 2020; Givens et al., 2023). For example, no associations between anthropogenic markers and ARGs were found in a study using multi-nation sequencing data from pristine environments (Kampouris et al., 2022) whereas these associations are common in agriculture or anthropogenically affected ecosystems (Larsson and Flach, 2022; Bengtsson-Palme et al., 2023). The possibility of relationships between fecal pollution and antibiotic resistance has led to the idea that measuring the general abundance of E. coli in waterbodies, which is already routinely measured, may be a reasonable starting point for surveilling potential ARB risks without any additional antibiotic resistance testing (Berendonk et al., 2015; Anjum et al., 2021; Liguori et al., 2022; Bengtsson-Palme et al., 2023). In addition, similar relationships between fecal contamination of waterways and the presence of ARGs have also been reported (Karkman et al., 2019; Reynolds et al., 2020). However, it must be noted that some studies have reported no-, intermittent-, or site-specific-relationships between fecal indicators and antibiotic resistance which indicates that more work is needed to better understand the factors which control the fecal-antibiotic-resistance relationship (Somerville et al., 2007; Reynolds et al., 2020).
Many research questions remain regarding environmental aquatic AMR. For example, there are currently no recommendations for where or when to sample waterbodies to determine ARB/ARG concentrations. The results of this study indicate that sampling only at the pond banks may result in an overestimation of the average ARB concentrations, while sampling only at the interior may result in an underestimation. While this study did not delve into the temporal dynamics of ARB in the studied irrigation ponds, recent research has shown that the time of day in which samples are collected may also be a significant factor governing ARB/ARG concentrations in surface waters (Lou et al., 2022; Nguyen et al., 2022) which should be accounted for in design of monitoring programs. Additionally, future work should investigate how environmental compartments for AMR in aquatic systems, such as sediments or biofilms, impact the measured concentrations in the water column. Research has shown that antibiotic-resistant bacteria and associated genes can be present in much higher concentrations in these compartments than the water column, however, the exchange rates and factors governing the exchange (e.g., water velocity, bioturbation etc.) have yet to be elucidated (Devarajan et al., 2015; Liu et al., 2021).
Depending on the further use of data, routine monitoring or surveys into environmental aquatic AMR may have different goals that may require different sampling strategies. For example, if the objective is to determine the risk of ARB/ARG to be transferred to field produce, then it is likely that sampling of only the surface water is not sufficient as the water pulled for irrigation is usually from a subsurface location. One may sample the water which reaches the field, but recent work has shown this can be variable in time in response to 3-dimensional spatial heterogeneity of microorganism concentrations in irrigation water (Stocker et al., 2020). Other surveys into AMR may want to focus on sampling only of the bank/nearshore waters as these are the areas most recreational users occupy. Preliminary work has been recently performed to identify the risk of swimmers ingesting 3rd generation cephalosporin-resistant E. coli in the coastal waters of England and Wales (Leonard et al., 2015), but more work is needed to better generalize these results to a range of different antibiotic resistances, study sites, and types of waters (e.g., ponds, lakes, rivers) etc. Another interesting avenue for future work is the detection of spatiotemporal patterns in AMR in waterbodies which has been recently addressed as a knowledge gap (Bengtsson-Palme et al., 2023). If “hot” or “cold” locations are continuously sampled this may result in inaccurate assessments of AMR in aquatic ecosystems. Knowledge of such patterns can guide the development of sampling programs tailored to specific water usages and allow for a better estimation of the degree of AMR within waterbodies.
5 Conclusions
This work was the first to evaluate composite sampling for the assessment of antibiotic-resistant bacteria in surface waters. Results showed that within relatively small waterbodies there can be large variations in fecal and antibiotic-resistant bacteria concentrations. Across the five study sites, concentrations of fecal- and ARB were consistently higher at bank locations relative to the pond interior sites which was significant in several cases. Linear regressions between composite values and the averages of individual sample sets showed that there was moderate to very strong correspondence between the two sample types with slopes close to 1.0. Additional statistical testing revealed that the composite sample values were rarely significantly different from either the mean or median of the individual sample sets. We conclude that composite sampling is an effective approach to capturing the variations in fecal and antibiotic-resistant bacteria in irrigation waters, but more work is needed to expand the set of antibiotics tested and the tested doses as well as the study sites.
Data availability statement
The raw data supporting the conclusions of this article will be made available by the authors, without undue reservation.
Author contributions
MS: Conceptualization, Data curation, Formal analysis, Investigation, Methodology, Supervision, Visualization, Writing – original draft, Writing – review & editing. JS: Investigation, Methodology, Writing – original draft, Writing – review & editing. YP: Data curation, Formal analysis, Funding acquisition, Methodology, Project administration, Resources, Supervision, Writing – original draft, Writing – review & editing.
Funding
The author(s) declare that financial support was received for the research, authorship, and/or publication of this article. This work was supported through the USDA's Agricultural Research Service project number 8042-12630-011-00D.
Acknowledgments
We sincerely thank Ms. Lauren Wyatt-Brown for her assistance in the field and laboratory as well as with data entry.
Conflict of interest
The authors declare that the research was conducted in the absence of any commercial or financial relationships that could be construed as a potential conflict of interest.
Publisher's note
All claims expressed in this article are solely those of the authors and do not necessarily represent those of their affiliated organizations, or those of the publisher, the editors and the reviewers. Any product that may be evaluated in this article, or claim that may be made by its manufacturer, is not guaranteed or endorsed by the publisher.
Supplementary material
The Supplementary Material for this article can be found online at: https://www.frontiersin.org/articles/10.3389/frwa.2024.1397630/full#supplementary-material
References
Akiyama, T., and Savin, M. C. (2010). Populations of antibiotic-resistant coliform bacteria change rapidly in a wastewater effluent dominated stream. Sci. Total Environment 408, 6192–6201. doi: 10.1016/j.scitotenv.2010.08.055
Amato, M., Dasí, D., González, A., Ferrús, M. A., and Castillo, M. Á. (2021). Occurrence of antibiotic resistant bacteria and resistance genes in agricultural irrigation waters from Valencia city (Spain). Agric. Water Manage. 256:107097. doi: 10.1016/j.agwat.2021.107097
Anjum, M. F., Schmitt, H., Börjesson, S., Berendonk, T. U., Donner, E., Stehling, E. G., et al. (2021). The potential of using E. coli as an indicator for the surveillance of antimicrobial resistance (AMR) in the environment. Curr. Opin. Microbiol. 64, 152–158. doi: 10.1016/j.mib.2021.09.011
Araujo, S., Silva, I. A., Tacão, M., Patinha, C., Alves, A., Henriques, I., et al. (2017). Characterization of antibiotic resistant and pathogenic Escherichia coli in irrigation water and vegetables in household farms. Int. J. Food Microbiol. 257, 192–200. doi: 10.1016/j.ijfoodmicro.2017.06.020
Bengtsson-Palme, J., Abramova, A., Berendonk, T. U., Coelho, L. P., Forslund, S. K., Gschwind, R., et al. (2023). Towards monitoring of antimicrobial resistance in the environment: For what reasons, how to implement it, and what are the data needs? Environ. Int. 22:108089. doi: 10.1016/j.envint.2023.108089
Berendonk, T. U., Manaia, C. M., Merlin, C., Fatta-Kassinos, D., Cytryn, E., Walsh, F., et al. (2015). Tackling antibiotic resistance: the environmental framework. Nat. Rev. Microbiol. 13, 310–317. doi: 10.1038/nrmicro3439
Bertke, E. E. (2007). Composite analysis for Escherichia coli at coastal beaches. J. Great Lakes Res. 33, 335–341. doi: 10.3394/0380-1330(2007)33(335:CAFECA)2.0.CO;2
Blaustein, R. A., Shelton, D. R., Van Kessel, J. A. S., Karns, J. S., Stocker, M. D., Pachepsky, Y. A., et al. (2016). Irrigation waters and pipe-based biofilms as sources for antibiotic-resistant bacteria. Environ. Monit. Assess. 188, 1–12. doi: 10.1007/s10661-015-5067-4
Boggs, C., Shiferawe, K., Karsten, E., Hamlet, J., Altheide, S. T., Marion, J. W., et al. (2023). Evaluation of a tetracycline-resistant e. coli enumeration method for correctly classifying E. coli in environmental waters in Kentucky, USA. Pathogens 12:1090. doi: 10.3390/pathogens12091090
Cho, S., Hiott, L. M., Read, Q. D., Damashek, J., Westrich, J., Edwards, M., et al. (2023). Distribution of antibiotic resistance in a mixed-use watershed and the impact of wastewater treatment plants on antibiotic resistance in surface water. Antibiotics 12:1586. doi: 10.3390/antibiotics12111586
Clinical and Laboratory Standards Institute (CLSI) (2023). Performance Standards for Antimicrobial Susceptibility Testing, 33rd Edn. CLSI Supplement M100. Wayne, PA: CLSI.
Converse, R. R., Wymer, L. J., Dufour, A. P., and Wade, T. J. (2012). Comparison of the multiple-sample means with composite sample results for fecal indicator bacteria by quantitative PCR and culture. Appl. Environ. Microbiol. 78, 7166–7169. doi: 10.1128/AEM.01662-12
Craddock, H. A., Chattopadhyay, S., Rjoub, Y., Rosen, D., Greif, J., Lipchin, C., et al. (2020). Antibiotic-resistant Escherichia coli and Klebsiella spp. in greywater reuse systems and pond water used for agricultural irrigation in the West Bank, Palestinian Territories. Environ. Res. 188:109777. doi: 10.1016/j.envres.2020.109777
Daghrir, R., and Drogui, P. (2013). Tetracycline antibiotics in the environment: a review. Environ. Chem. Lett. 11, 209–227. doi: 10.1007/s10311-013-0404-8
Devarajan, N., Laffite, A., Graham, N. D., Meijer, M., Prabakar, K., Mubedi, J. I., et al. (2015). Accumulation of clinically relevant antibiotic-resistance genes, bacterial load, and metals in freshwater lake sediments in Central Europe. Environ. Sci. Technol. 49, 6528–6537. doi: 10.1021/acs.est.5b01031
Downing, J. A., Prairie, Y. T., Cole, J. J., Duarte, C. M., Tranvik, L. J., Striegl, R. G., et al. (2006). The global abundance and size distribution of lakes, ponds, and impoundments. Limnol. Oceanogr. 51, 2388–2397. doi: 10.4319/lo.2006.51.5.2388
Dungan, R. S., and Bjorneberg, D. L. (2021). Antimicrobial resistance in EEscherichia coli and enterococcal isolates from irrigation return flows in a high-desert watershed. Front. Microbiol. 12:660697. doi: 10.3389/fmicb.2021.660697
Efadeswarni, A. F. Y., Puspandari, N., and Aini, N. (2021). The effect of environmental factors on the abundance of cefotaxime-resistant Escherichia coli in the Sunter River. IOP Conf. Series Earth Environ. Sci. 909:012006. doi: 10.1088/1755-1315/909/1/012006
Fiello, M., Mikell, A. T., Moore, M. T., and Cooper, C. M. (2014). Variability in the characterization of total coliforms, fecal coliforms and Escherichia coli in recreational water supplies of north Mississippi, USA. Bull. Environ. Contam. Toxicol. 93, 133–137. doi: 10.1007/s00128-014-1299-1
Francy, D. S., Myers, D. N., and Metzker, K. D. (1993). Escherichia coli and Fecal-Coliform Bacteria as Indicators of recreational water quality (Vol. 93, No. 4083). New York, NY: US Department of the Interior, US Geological Survey.
Galvin, S., Boyle, F., Hickey, P., Vellinga, A., Morris, D., Cormican, M., et al. (2010). Enumeration and characterization of antimicrobial-resistant Escherichia coli bacteria in effluent from municipal, hospital, and secondary treatment facility sources. Appl. Environ. Microbiol. 76, 4772–4779. doi: 10.1128/AEM.02898-09
Gerdes, M. E., Cruz-Cano, R., Solaiman, S., Ammons, S., Allard, S. M., Sapkota, A. R., et al. (2022). Impact of irrigation water type and sampling frequency on microbial water quality profiles required for compliance with us food safety modernization act produce safety rule standards. Environ. Res. 205, 112480. doi: 10.1016/j.envres.2021.112480
Givens, C. E., Kolpin, D. W., Hubbard, L. E., Meppelink, S. M., Cwiertny, D. M., Thompson, D. A., et al. (2023). Simultaneous stream assessment of antibiotics, bacteria, antibiotic resistant bacteria, and antibiotic resistance genes in an agricultural region of the United States. Sci. Total Environ. 904:166753. doi: 10.1016/j.scitotenv.2023.166753
Gurtler, J. B., and Gibson, K. E. (2022). Irrigation water and contamination of fresh produce with bacterial foodborne pathogens. Curr. Opin. Food Sci. 12:100889. doi: 10.1016/j.cofs.2022.100889
Harmon, D. E., Miranda, O. A., McCarley, A., Eshaghian, M., Carlson, N., Ruiz, C., et al. (2019). Prevalence and characterization of carbapenem-resistant bacteria in water bodies in the Los Angeles–Southern California area. Microbiologyopen 8:e00692. doi: 10.1002/mbo3.692
Harris, S., Morris, C., Morris, D., Cormican, M., and Cummins, E. (2014). Antimicrobial resistant Escherichia coli in the municipal wastewater system: effect of hospital effluent and environmental fate. Sci. Total Environ. 468, 1078–1085. doi: 10.1016/j.scitotenv.2013.09.017
Havelaar, A. H., Vazquez, K. M., Topalcengiz, Z., Muñoz-Carpena, R., and Danyluk, M. D. (2017). Evaluating the US food safety modernization act produce safety rule standard for microbial quality of agricultural water for growing produce. J. Food Prot. 80, 1832–1841. doi: 10.4315/0362-028X.JFP-17-122
Helsel, D. R. (2005). Nondetects and Data Analysis. Statistics for Censored Environmental Data. New York, NY: Wiley-Interscience.
Hoffman, S., Maculloch, B., and Batz, M. (2015). Economic Burden of Major Foodborne Illnesses Acquired in the United States. Washington, DC: USDA-ERS.
Holvoet, K., Sampers, I., Callens, B., Dewulf, J., and Uyttendaele, M. (2013). Moderate prevalence of antimicrobial resistance in Escherichia coli isolates from lettuce, irrigation water, and soil. Appl. Environ. Microbiol. 79, 6677–6683. doi: 10.1128/AEM.01995-13
Hou, L., Zhang, L., Li, F., Huang, S., Yang, J., Ma, C., et al. (2021). Urban ponds as hotspots of antibiotic resistome in the urban environment. J. Hazard. Mater. 403:124008. doi: 10.1016/j.jhazmat.2020.124008
Huerta, B., Marti, E., Gros, M., López, P., Pompêo, M., Armengol, J., et al. (2013). Exploring the links between antibiotic occurrence, antibiotic resistance, and bacterial communities in water supply reservoirs. Sci. Total Environ. 456, 161–170. doi: 10.1016/j.scitotenv.2013.03.071
Huijbers, P. M., Bobis Camacho, J., Hutinel, M., Larsson, D. J., and Flach, C. F. (2023). Sampling considerations for wastewater surveillance of antibiotic resistance in fecal bacteria. Int. J. Environ. Res. Public Health 20:4555. doi: 10.3390/ijerph20054555
Huijbers, P. M., Larsson, D. J., and Flach, C. F. (2020). Surveillance of antibiotic resistant Escherichia coli in human populations through urban wastewater in ten European countries. Environ. Pollut. 261:114200. doi: 10.1016/j.envpol.2020.114200
Hussain, M. A., and Dawson, C. O. (2013). Economic impact of food safety outbreaks on food businesses. Foods 2, 585–589. doi: 10.3390/foods2040585
IFSAC (2021). Foodborne Illness Source Attribution Estimates for 2019 for Salmonella, Escherichia coli O157, Listeria monocytogenes, and Campylobacter Using Multi-Year Outbreak Surveillance Data, United States. Available online at: https://www.cdc.gov/foodsafety/ifsac/pdf/P19-2019-report-TriAgency-508.pdf (accessed March 1, 2024).
Jongman, M., and Korsten, L. (2016). Genetic diversity and antibiotic resistance of Escherichia coli isolates from different leafy green production systems. J. Food Prot. 79, 1846–1853. doi: 10.4315/0362-028X.JFP-16-117
Kampouris, I. D., Berendonk, T. U., Bengtsson-Palme, J., and Klümper, U. (2022). The global groundwater resistome: core ARGs and their dynamics-an in silico re-analysis of publicly available groundwater metagenomes. bioRxiv 2022.11.14.516424. doi: 10.1101/2022.11.14.516424
Karkman, A., Pärnänen, K., and Larsson, D. J. (2019). Fecal pollution can explain antibiotic resistance gene abundances in anthropogenically impacted environments. Nat. Commun. 10:80. doi: 10.1038/s41467-018-07992-3
Kinzelman, J., Byappanahalli, M. N., Nevers, M. B., Shively, D., Kurdas, S., Nakatsu, C., et al. (2020). Utilization of multiple microbial tools to evaluate efficacy of restoration strategies to improve recreational water quality at a Lake Michigan Beach (Racine, WI). J. Microbiol. Methods 178:106049. doi: 10.1016/j.mimet.2020.106049
Lancaster, V. A., and Keller-McNulty, S. (1998). A review of composite sampling methods. J. Am. Stat. Assoc. 93, 1216–1230. doi: 10.1080/01621459.1998.10473781
Larsson, D. G., and Flach, C. F. (2022). Antibiotic resistance in the environment. Nat. Rev. Microbiol. 20, 257–269. doi: 10.1038/s41579-021-00649-x
Lee, D., Tertuliano, M., Vellidis, G., Harris, C., Grossman, M. K., Rajeev, S., et al. (2018). Evaluation of grower-friendly, science-based sampling approaches for the detection of Salmonella in ponds used for irrigation of fresh produce. Foodborne Pathog. Dis. 15, 627–636. doi: 10.1089/fpd.2018.2441
Leonard, A. F., Zhang, L., Balfour, A. J., Garside, R., and Gaze, W. H. (2015). Human recreational exposure to antibiotic resistant bacteria in coastal bathing waters. Environ. Int. 82, 92–100. doi: 10.1016/j.envint.2015.02.013
Li, Q., Zou, H., Wang, D., Zhao, L., Meng, M., Wang, Z., et al. (2023). Tracking spatio-temporal distribution and transmission of antibiotic resistance in aquatic environments by using ESBL-producing Escherichia coli as an indicator. J. Environ. Manage. 344:118534. doi: 10.1016/j.jenvman.2023.118534
Liang, X., Guan, F., Chen, B., Luo, P., Guo, C., Wu, G., et al. (2020). Spatial and seasonal variations of antibiotic resistance genes and antibiotics in the surface waters of Poyang Lake in China. Ecotoxicol. Environ. Saf. 196:110543. doi: 10.1016/j.ecoenv.2020.110543
Liguori, K., Keenum, I., Davis, B. C., Calarco, J., Milligan, E., Harwood, V. J., et al. (2022). Antimicrobial resistance monitoring of water environments: a framework for standardized methods and quality control. Environ. Sci. Technol. 56, 9149–9160. doi: 10.1021/acs.est.1c08918
Liu, C., Yan, H., Sun, Y., and Chen, B. (2021). Contribution of enrofloxacin and Cu2+ to the antibiotic resistance of bacterial community in a river biofilm. Environ. Pollut. 291:118156. doi: 10.1016/j.envpol.2021.118156
Lopes, E. S., Parente, C. E., Picão, R. C., and Seldin, L. (2022). Irrigation ponds as sources of antimicrobial-resistant bacteria in agricultural areas with intensive use of poultry litter. Antibiotics 11:1650. doi: 10.3390/antibiotics11111650
Lothrop, N., Bright, K. R., Sexton, J., Pearce-Walker, J., Reynolds, K. A., Verhougstraete, M. P., et al. (2018). Optimal strategies for monitoring irrigation water quality. Agric. Water Manage. 199, 86–92. doi: 10.1016/j.agwat.2017.12.018
Lou, E. G., Ali, P., Lu, K., Kalvapalle, P., and Stadler, L. B. (2022). Snapshot ARG removal rates across wastewater treatment plants are not representative due to diurnal variations. ACS EST Water 3, 166–175. doi: 10.1021/acsestwater.2c00467
Lovison, G., Gore, S. D., and Patil, G. P. (1994). Design and analysis of composite sampling procedures: a review. Handb. Stat. 12, 103–166. doi: 10.1016/S0169-7161(05)80006-9
Marano, R. B., Fernandes, T., Manaia, C. M., Nunes, O., Morrison, D., Berendonk, T. U., et al. (2020). A global multinational survey of cefotaxime-resistant coliforms in urban wastewater treatment plants. Environ. Int. 144:106035. doi: 10.1016/j.envint.2020.106035
McKinney, C. W., Loftin, K. A., Meyer, M. T., Davis, J. G., and Pruden, A. (2010). Tet and sul antibiotic resistance genes in livestock lagoons of various operation type, configuration, and antibiotic occurrence. Environ. Sci. Technol. 44, 6102–6109. doi: 10.1021/es9038165
Miłobedzka, A., Ferreira, C., Vaz-Moreira, I., Calderón-Franco, D., Gorecki, A., Purkrtova, S., et al. (2022). Monitoring antibiotic resistance genes in wastewater environments: the challenges of filling a gap in the One-Health cycle. J. Hazard. Mater. 424:127407. doi: 10.1016/j.jhazmat.2021.127407
Mispagel, H., and Gray, J. T. (2005). Antibiotic resistance from wastewater oxidation ponds. Water Environ. Res. 77, 2996–3002. doi: 10.2175/106143005X73875
Molale-Tom, L. G., Olanrewaju, O. S., Kritzinger, R. K., Fri, J., and Bezuidenhout, C. C. (2024). Heterotrophic bacteria in drinking water: evaluating antibiotic resistance and the presence of virulence genes. Microbiol. Spectr. 12, e03359–e03323. doi: 10.1128/spectrum.03359-23
Murphy, C. M., Weller, D. L., Ovissipour, R., Boyer, R., and Strawn, L. K. (2023). Spatial versus nonspatial variance in fecal indicator bacteria differs within and between ponds. J. Food Prot. 86:100045. doi: 10.1016/j.jfp.2023.100045
Nguyen, K., Smith, S., Roundtree, A., Feistel, D. J., Kirby, A. E., Levy, K., et al. (2022). Fecal indicators and antibiotic resistance genes exhibit diurnal trends in the Chattahoochee River: Implications for water quality monitoring. Front. Microbiol. 13:1029176. doi: 10.3389/fmicb.2022.1029176
Nnadozie, C. F., and Odume, O. N. (2019). Freshwater environments as reservoirs of antibiotic resistant bacteria and their role in the dissemination of antibiotic resistance genes. Environ. Pollut. 254:113067. doi: 10.1016/j.envpol.2019.113067
Noble, R. T., Moore, D. F., Leecaster, M. K., McGee, C. D., and Weisberg, S. B. (2003). Comparison of total coliform, fecal coliform, and enterococcus bacterial indicator response for ocean recreational water quality testing. Water Res. 37, 1637–1643. doi: 10.1016/S0043-1354(02)00496-7
Ott, A., O'Donnell, G., Tran, N. H., Mohd Haniffah, M. R., Su, J. Q., Zealand, A. M., et al. (2021). Developing surrogate markers for predicting antibiotic resistance “hot spots” in rivers where limited data are available. Environ. Sci. Technol. 55, 7466–7478. doi: 10.1021/acs.est.1c00939
Pachepsky, Y., Kierzewski, R., Stocker, M., Sellner, K., Mulbry, W., Lee, H., et al. (2018). Temporal stability of Escherichia coli concentrations in waters of two irrigation ponds in Maryland. Appl. Environ. Microbiol. 84, e01876–e01817. doi: 10.1128/AEM.01876-17
Pan, M., and Chu, L. M. (2018). Occurrence of antibiotics and antibiotic resistance genes in soils from wastewater irrigation areas in the Pearl River Delta region, southern China. Sci. Total Environ. 624, 145–152. doi: 10.1016/j.scitotenv.2017.12.008
Phillips, M. C., Solo-Gabriele, H. M., Piggot, A. M., Klaus, J. S., and Zhang, Y. (2011). Relationships between sand and water quality at recreational beaches. Water Res. 45, 6763–6769. doi: 10.1016/j.watres.2011.10.028
Ram, B., and Kumar, M. (2020). Correlation appraisal of antibiotic resistance with fecal, metal and microplastic contamination in a tropical Indian river, lakes and sewage. NPJ Clean Water 3:3. doi: 10.1038/s41545-020-0050-1
Reicherts, J. D., and Emerson, C. W. (2010). Monitoring bathing beach water quality using composite sampling. Environ. Monit. Assess. 168, 33–43. doi: 10.1007/s10661-009-1089-0
Reynolds, L. J., Sala-Comorera, L., Martin, N. A., Nolan, T. M., Stephens, J. H., Gitto, A., et al. (2020). Correlation between antimicrobial resistance and faecal contamination in small urban streams and bathing waters. Sci. Total Environ. 739:140242. doi: 10.1016/j.scitotenv.2020.140242
Ribeiro, A. R., Sures, B., and Schmidt, T. C. (2018). Cephalosporin antibiotics in the aquatic environment: a critical review of occurrence, fate, ecotoxicity and removal technologies. Environ. Pollut. 241, 1153–1166. doi: 10.1016/j.envpol.2018.06.040
Sanderson, C. E., Fox, J. T., Dougherty, E. R., Cameron, A. D., and Alexander, K. A. (2018). The changing face of water: a dynamic reflection of antibiotic resistance across landscapes. Front. Microbiol. 9:1894. doi: 10.3389/fmicb.2018.01894
Silva, J., Castillo, G., Callejas, L., López, H., and Olmos, J. (2006). Frequency of transferable multiple antibiotic resistance amongst coliform bacteria isolated from a treated sewage effluent in Antofagasta, Chile. Electr. J. Biotechnol. 9, 1–15. doi: 10.2225/vol9-issue5-fulltext-7
Smith, J. E., Wolny, J. L., Hill, R. L., Stocker, M. D., and Pachepsky, Y. (2022). Examining the relationship between phytoplankton community structure and water quality measurements in agricultural waters: a machine learning application. Environments 9:142. doi: 10.3390/environments9110142
Solaiman, S., Handy, E., Brinks, T., Goon, K., Bollinger, C., Sapkota, A. R., et al. (2022). Extended spectrum β-lactamase activity and cephalosporin resistance in Escherichia coli from US Mid-Atlantic surface and reclaimed water. Appl. Environ. Microbiol. 88, e00837–e00822. doi: 10.1128/aem.00837-22
Somerville, C. C., Sweeney, A. P., Chadwick, S. L., and Dotson, T. (2007). “Antibiotic resistant bacteria in the ohio river are not a subset of fecal indicator bacteria,” in Proceedings of the 107th General Meeting of the American Society for Microbiological, Toronto, ON, Canada, 21–25.
Sousa, J. C., Ribeiro, A. R., Barbosa, M. O., Pereira, M. F. R., and Silva, A. M. (2018). A review on environmental monitoring of water organic pollutants identified by EU guidelines. J. Hazard. Mater. 344, 146–162. doi: 10.1016/j.jhazmat.2017.09.058
Stocker, M., Smith, J., and Pachepsky, Y. (2023). Spatial variation of tetracycline-resistant E. coli and relationships with water quality variables in irrigation water: a pilot study. Appl. Microbiol. 3, 504–518. doi: 10.3390/applmicrobiol3020036
Stocker, M. D., Jeon, D. J., Sokolova, E., Lee, H., Kim, M. S., Pachepsky, Y. A., et al. (2020). Accounting for the three-dimensional distribution of Escherichia coli concentrations in pond water in simulations of the microbial quality of water withdrawn for irrigation. Water 12:1708. doi: 10.3390/w12061708
Stocker, M. D., Pachepsky, Y. A., Hill, R. L., and Kim, M. S. (2022). Elucidating spatial patterns of E. coli in two irrigation ponds with empirical orthogonal functions. J. Hydrol. 609:127770. doi: 10.1016/j.jhydrol.2022.127770
Suzuki, S., Ogo, M., Miller, T. W., Shimizu, A., Takada, H., Siringan, M. A. T., et al. (2013). Who possesses drug resistance genes in the aquatic environment?: sulfamethoxazole (SMX) resistance genes among the bacterial community in water environment of Metro-Manila, Philippines. Front. Microbiol. 4:102. doi: 10.3389/fmicb.2013.00102
Tendencia, E. A., and de la Peña, L. D. (2001). Antibiotic resistance of bacteria from shrimp ponds. Aquaculture 195, 193–204. doi: 10.1016/S0044-8486(00)00570-6
Tsutsui, H., and Urase, T. (2019). Characterization of extended spectrum β-lactamase-producing Escherichia coli in the environment isolated with different concentrations of cefotaxime. J. Water Environ. Technol. 17, 262–272. doi: 10.2965/jwet.18-091
USEPA (1995). Observational Economy Series. Volume 1: Composite Sampling. Environmental Protection Agency. EPA-230-R-95-005. Washington, DC: USEPA.
USEPA (2002). Method 1604: Total Coliforms and Escherichia coli in Water by Membrane Filtration Using a Simultaneous Detection Technique (MI Medium). Washington, DC: US Environmental Protection Agency.
USEPA (2009). Statistical Analysis of Groundwater Monitoring Data at RCRA Facilities. Unified Guidance. EPA 530 R-09-007. Washington, DC: Office of Resource Conservation and Recovery.
USEPA (2010). Sampling and Consideration of Variability (Temporal and Spatial) For Monitoring of Recreational Waters. Office of Water. EPA-823-R-10-005. Washington, DC: USEPA
USGS (2019). National Field Manual for the Collection of Water-Quality Data. United States Geological Survey. Available online at: https://www.usgs.gov/mission-areas/water-resources/science/national-field-manual-collection-water-quality-data-nfm (accessed March 4, 2024).
Uyttendaele, M., Jaykus, L. A., Amoah, P., Chiodini, A., Cunliffe, D., Jacxsens, L., et al. (2015). Microbial hazards in irrigation water: standards, norms, and testing to manage use of water in fresh produce primary production. Comp. Rev. Food Sci. Safety 14, 336–356. doi: 10.1111/1541-4337.12133
Wang, Z., Han, M., Li, E., Liu, X., Wei, H., Yang, C., et al. (2020). Distribution of antibiotic resistance genes in an agriculturally disturbed lake in China: their links with microbial communities, antibiotics, and water quality. J. Hazard. Mater. 393:122426. doi: 10.1016/j.jhazmat.2020.122426
WHO (2021). Integrated Global Surveillance on ESBL-Producing E. coli Using a “One Health” Approach: Implementation and Opportunities. Available online at: https://www.who.int/publications/i/item/9789240021402 (accessed March 7, 2024).
WHO (2022). Food Safety. Available online at: https://www.who.int/news-room/fact-sheets/detail/food-safety (accessed May 19, 2024).
Yoneda, I., Rozanah, U. N., Nishiyama, M., Mith, H., and Watanabe, T. (2022). Detection and genetic analysis of Escherichia coli from Tonle Sap Lake and its tributaries in Cambodia: Spatial distribution, seasonal variation, pathogenicity, and antimicrobial resistance. Environ. Pollut. 315:120406. doi: 10.1016/j.envpol.2022.120406
Keywords: composite sample, E. coli, antibiotic resistance, irrigation water, tetracycline, cefotaxime
Citation: Stocker MD, Smith JE and Pachepsky Y (2024) On composite sampling for monitoring generic and antibiotic-resistant coliforms in irrigation ponds. Front. Water 6:1397630. doi: 10.3389/frwa.2024.1397630
Received: 07 March 2024; Accepted: 08 April 2024;
Published: 18 April 2024.
Edited by:
Petros Kokkinos, Hellenic Open University, GreeceReviewed by:
Nicholas John Ashbolt, University of South Australia, AustraliaMohamed Azab El-Liethy, National Research Centre, Egypt
Copyright © 2024 Stocker, Smith and Pachepsky. This is an open-access article distributed under the terms of the Creative Commons Attribution License (CC BY). The use, distribution or reproduction in other forums is permitted, provided the original author(s) and the copyright owner(s) are credited and that the original publication in this journal is cited, in accordance with accepted academic practice. No use, distribution or reproduction is permitted which does not comply with these terms.
*Correspondence: Matthew Daniel Stocker, TWF0dGhldy5TdG9ja2VyQHVzZGEuZ292