- 1Department of Plant Science and Landscape Architecture, University of Maryland, College Park, MD, United States
- 2Department of Agricultural Education and Communication, University of Florida, Gainesville, FL, United States
- 3Program for Resource Efficient Communities, UF/IFAS Extension, University of Florida, Gainesville, FL, United States
Escalating demands on urban water sources present a formidable challenge to practitioners in environmental and social change to more effectively promote water conservation strategies. This study was based on pilot project learnings and aimed to determine whether a sign displaying weekly local rainfall data and turfgrass water needs could effectively influence a Florida (USA) community’s water conservation. Three core data sources/methods were used: pre- and post-surveys, water utility data compared between treatment and control communities, and qualitative post-intervention feedback. The findings illustrate nuanced outcomes including the adoption of the rainfall sign as a central information source and some knowledge increases, contrasted with decreased engagement in the target conservation practice, no significant changes in water usage, and unfavorable perceptions of project approaches. Successes and failures of this pilot can guide professionals leading future residential conservation initiatives, which should better engage the target community and incorporate their ideas and needs into the project design.
1 Introduction
Over the past century, the world has witnessed a threefold increase in its population, coupled with a six-fold surge in water usage, putting immense pressure on available freshwater sources (Food and Agriculture Organization, 2017; Guppy and Anderson, 2017). Projections indicate that by 2030, global water demand will soar by 50%, further exacerbating the already tenuous balance between water supply and demand (United Nations Water, 2012; UNESCO World Water Program, 2022). This growing disparity between demand and availability could expand up to 40% if significant improvements are not made in water management on a global scale (Guppy and Anderson, 2017). Groundwater, a vital component of the world’s freshwater resources, faces over-extraction challenges in multiple regions (Postel, 1999; Bates et al., 2008; Fielding et al., 2012; UNESCO World Water Program, 2022). With the compounding pressures of population growth and climate change, this issue is poised to intensify. Already, it is estimated that close to half of people globally face water scarcity for at least 1 month per year, with an increase projected over the current decade (Boretti and Rosa, 2019; UNESCO World Water Program, 2022). Human activities, including excessive groundwater extraction and river freshwater use, exacerbate these issues (Fielding et al., 2012). Coastal communities, including those in Florida, United States, where this study took place, are often characterized by dense and growing populations making them especially vulnerable to water deficiencies (Bichsel, 2011). Prioritizing water conservation strategies and exploring alternative water sources is crucial in addressing this crisis (Richter et al., 2020).
Escalating demands on urban water sources present a formidable challenge to educators and practitioners in social and environmental change, underscoring the need to better understand water usage patterns and more effective water conservation strategies. Residents with turfgrass lawns are a key stakeholder group for whom it is imperative to encourage behaviors that reduce water consumption in the lawn and landscape (McKenzie-Mohr and Schultz, 2014). Moreover, residents’ outdoor irrigation, known for its substantial draw on urban water sources (Hilaire et al., 2008), is a target practice for transitioning toward sustainable water resource management. Consequently, educational initiatives aimed at transforming the way residents approach their irrigation have become a central component of water conservation education (Postel, 2000; Steg and Vlek, 2009; McKenzie-Mohr and Schultz, 2014). Correspondingly, education professionals often promote conservation-oriented technologies (e.g., smart irrigation) for landscape decision-makers to better save water (Martini et al., 2014; Hayden et al., 2015; Warner et al., 2015).
Transforming water consumption patterns and management requires altering consumer behaviors (Fielding et al., 2012; Warner and Lamm, 2017). Yet, typical approaches such as providing information alone do not tend to successfully elicit conservation behaviors (Carrico and Riemer, 2011; Abrash Walton et al., 2022). To better understand and promote conservation-based behavior changes and technology adoption, it is crucial to consider people’s demographic, psychosocial, and behavioral characteristics, in conjunction with infrastructural factors, that influence their water usage (Fielding et al., 2012; Warner and Lamm, 2017). Although technologies hold potential to significantly reduce water consumption among residents (Cardenas-Lailhacar et al., 2008; McCready et al., 2009; Grabow et al., 2013), social barriers and norms can impede or delay their adoption (Kollmuss and Agyeman, 2002).
In the realm of studying water conservation, researchers have underscored the value of selecting target behaviors and crafting programs tailored to the perceptions and needs of the intended audience (Heimlich and Ardoin, 2008; McKenzie-Mohr et al., 2012; Freivogel et al., 2022). Moreover, experts recognize that barriers to behavior change can vary significantly based on both the audience and the specific activity in question (Freivogel et al., 2022). For example, the obstacles preventing somebody from regulating their irrigation system based on rainfall data will likely differ from those hindering them from converting their turf lawn from turf into a water friendly alternative.
Warner et al. (2023) focused their inquiry, also based in Florida, on the specific behavior of utilizing rainfall data to make irrigation decisions, recognizing its potential for achieving water conservation goals within residential landscapes. They used an audience segmentation approach to identify “intenders” who planned to adopt the behavior versus “non-intenders.” Their findings, directly linked to promoting the use of rainfall data to make irrigation decisions, suggest continuum of intent may exist, which warrants further inquiry (Warner et al., 2023). However, residents may encounter significant challenges in accessing and interpreting reliable rainfall data to inform irrigation practices. As Gusto et al. (2021) reported, many residents feel uncomfortable or unsure about how to access and apply rainfall data, which may hinder their ability to adjust systems based on recent rainfall. Beyond personal challenges, residents’ lawn and landscape practices may be shaped by social norms—the influences of neighbors, friends, and peers that often run counter to conservation needs (Locke et al., 2018; Larson et al., 2022). Within privatized planned communities (known as homeowner associations [HOAs] in the United States), research shows residents’ adoption of environmentally-friendly landscapes may be further inhibited by uncertainty about whether the HOA’s policies permit these practices (Silvert et al., 2023).
While significant progress has been made in advancing educational and behavior change approaches for lawn and landscape conservation, a need persists to test and adapt such approaches targeted towards residents adjusting irrigation based on rainfall, especially within planned community contexts (e.g., HOAs). The present study, based on the case of a planned community in Florida, addresses research gaps in understanding how to connect residents to information about local rainfall and whether their access to such information can be a prerequisite to outdoor water conservation. Our research design employs both technical and social scientific approaches, based on learnings from a multi-partner project that included The University of Florida, the Southwest Florida Water Management District (Water Management District) and a cooperating community, Hunter’s Green, located in Hillsborough County, Florida. Following a research design similar to Survis (2016), we tested a rainfall-based water conservation intervention to determine if providing residents with weekly local rainfall data could influence their application of supplemental irrigation and effectively reduce water consumption. The study included an experimental neighborhood where signage was installed aiming to educate residents about weekly water needs for healthy turfgrass and actual weekly rainfall amounts (inches) for a period of 52 weeks (November 2021 to November 2022). The signage was solar-powered (with a backup battery) and installed at inside the front entrance of the Hunter’s Green community and its data were remotely updated. Over the same period, water use was also monitored in a control neighborhood that received no weekly rainfall education.
2 Theoretical framework
The Transtheoretical Model of Change (TTM) (Prochaska and DiClemente, 1983) may provide insights on residents’ educational preferences and needs related to behavior change, and ultimately their adoption of a behavior (here, the adjustment of their irrigation according to local rainfall data). The TTM offers significant value in that it presents behavior change as a process that takes time rather than a discrete state of being, or not (Grimley et al., 1994). Thus, the TTM recognizes there are several stops along the route to fully adopting a practice (Doran et al., 2022). The TTM’s key components include five stages of change, the importance of people’s self-efficacy in the change process, the concept of decisional balance, and a prescription for processes of change that support progression. Each of the stages are described below along with the concept of decisional balance. Decisional balance is essentially a person’s assessment of the pros and cons associated with adoption of a behavior at any given point in the process; the benefits of making a change must increase relative to the barriers (or costs) in order for an individual to progress (Armitage et al., 2004; Abrash Walton et al., 2022).
The stages of change begin with pre-contemplation, during which a person is not considering making a change any time in the near future (Prochaska, 2008). People in the pre-contemplation stage perceive the barriers to change as far outweighing the benefits. They may not be aware of a problem that needs addressed (e.g., local drought), or they may have failed to change in the past and become discouraged (Abrash Walton et al., 2022). Contemplation follows, and at this time a person may be considering a change, but it is not accompanied by any sense of urgency. At this stage, the barriers to change are perceived as being approximately equal to the benefits, which creates hesitancy. At the next stage, preparation, an individual intends to act in the near future, partially fueled by a growing perception that the benefits of the change outweigh the barriers (Prochaska, 2008). Often individuals in the preparation stage are considered an important target for behavior change interventions given their inclination to act (Prochaska, 2008). When someone has made recent and distinct changes to their behavior, they are considered to be in the action stage. Once the new behavior becomes more a part of someone’s life and they are unlikely to give it up, they are said to be in the maintenance stage. At the action and maintenance stages, the benefits of change continue to exceed the barriers.
Another well-utilized behavior change theory, Diffusion of Innovations (DoI) (Rogers, 2003) offered a unique means of capturing the decisional balance component of the TTM for the present study. DoI outlines five characteristics of an innovation that an individual considers when forming an opinion of a new idea or technology, which precedes a decision to adopt or not. These characteristics are relative advantage (in comparison to the idea or technology being replaced), compatibility (with values, habits, needs, and infrastructure), complexity (how difficult or easy the innovation is to use), observability (the extent to which the results of adopting can be seen or experienced), and trialability (the extent to which the innovation can be tested before a commitment to adoption is made) (Rogers, 2003). Although other researchers have presented decisional balance measurement instruments specific to the TTM which are often like checklists of pros and cons e.g., (see Ward et al., 2004), we found the robust nature of these five characteristics drawn from the DoI to be salient to the study. When the theories were considered together and applied to the adjustment of residents’ irrigation according to local rainfall data, we hypothesized that decisional balance (overall strength of the five DoI characteristics) would exhibit a positive trend in later stages of change.
There is a dearth of research integrating the DoI characteristics with the TTM as we did here (illustrated by Figure 1). However, researchers have demonstrated variability in other behavior change theory variables (e.g., those of the Theory of Planned Behavior) between TTM stages (Armitage et al., 2004), which demonstrates the potential value in doing so. In their transportation-focused study, Nehme et al. (2016) compared the DoI characteristic of compatibility across TTM and DoI stages, suggesting DoI fit their context better than TTM, but leaving the potential of integrating DoI characteristics with the TTM for other researchers to consider.
The TTM has been lauded for its application within water conservation contexts (Hassell and Cary, 2007) and as both a formative and summative evaluation tool (Abrash Walton et al., 2022). Rather than considering people at the earliest stages, who may otherwise be labelled unmotivated, resistant, or simply non-adopters, the TTM can be used to detect the undercurrents which may eventually lead to change (Prochaska, 2008). Because those in later stages of the TTM are more likely to adopt, it is advantageous to understand a community’s perceptions surrounding the behavior in order to support advancement to a later stage (Doran et al., 2022). Our application in the present study allowed us to identify possible gradients in change that would have been overlooked with an absolute view of change.
3 Purpose and objectives
This study, based on pilot project learnings, aimed to determine whether a sign displaying weekly local rainfall data and turfgrass water needs at a Florida community’s entrance could effectively influence residents’ water conservation.
The objectives of the study were to evaluate residents’:
1. Shifts toward adjusting irrigation based on local rainfall during the intervention period
2. Decisional balance perceptions according to their stages of engagement in landscape water conservation
3. Changes in water use during the intervention period
4. Reactions to the project’s educational approach
4 Methods
We used a multi-method research design to collect, analyze, and interpret different types of data using distinct approaches without the integration process characteristic of a mixed methods design (Morse, 2003; Creswell and Plano Clark, 2018) (Figure 2). Before carrying out the study, the University of Florida Institutional Review Board reviewed and approved the protocol (Protocol # IRB202100988). We will now describe the research design, data collection, and analysis methods for the social science survey and qualitative components as well as the technical water use research component of the study.
4.1 Participants and data collection
During project planning, the Water Management District worked in coordination with the University of Florida to select Hunter’s Green as the experimental community based on the HOA leadership’s commitment to participation and the ability to monitor their water utility usage. The target population was the community’s 1,500 single-family households. The community is described by Niche (n.d.) as having a “dense suburban feel” with many families and young professionals as residents who own their homes. The Hunter’s Green Country Club and 18-hole golf course is also located on the property along with nature and park and recreation spaces (Hunter’s Green Master, 2024, p.1). Hunter’s Green is located in Southwest Florida within the city limits of Tampa with a full population (beyond the gated HOA community) of 24,433 per the 2020 Census—compared to a 2010 Census of 14,321 (United States Census Bureau, n.d.). Hunter’s Green is located in Hillsborough County, which is designated with the rural–urban continuum (RUC) code of 1 (Metro - Counties in metro areas of 1 million population or more), which corresponds to the highest degree of urbanization (Economic Research Service, 2024). The median age in Hillsborough County is 37.8 years, nearly five years less than the state’s median age (United States Census Bureau, n.d.). The median household income in the county is $74,308, which exceeds the state median. Hillsborough County’s employment rate (63.1%) exceeds the state’s (56.8%) while homeownership (61.2%) is below the state’s rate of 67.2% (United States Census Bureau, n.d.). Hunter’s Green has been recognized for high water use and also a high number of irrigation restriction citations (Ozan and Alsharif, 2013). The residents of this community have been described as being “in a difficult position” (Ozan and Alsharif, 2013, p. 380) because they must choose to adhere to local irrigation restrictions or face the fines set by the community for not meeting landscape aesthetic requirements.
For the social science focused components of the project (Objectives 1, 2, and 4), parallel pre- and post-surveys were disseminated in the experimental community before and after the 52-week rainfall sign intervention. The post-survey included open-ended feedback boxes for respondents to share how the project could have been improved to better inform turfgrass irrigation practices, which provided the qualitative findings in this study. We employed mixed-mode dissemination of the survey (electronic mail and postal mail) to improve the response rate and increase access to the study among people who were less likely to participate in one mode (Newberry and Israel, 2017). Multiple contacts (email reminders) were also used to increase response rates (Dillman et al., 2009).
The surveys were first disseminated using anonymous Qualtrics survey links that were sent out by the community association manager to the residents via a community listserv. Figure 2 illustrates when the pre-survey data collection was conducted between May and July 2021 and post-survey data collection between November 2022 and January 2023. Three email reminders were sent out during both data collection phases, and two to three weeks following the first communication of the online survey link, we mailed out paper versions of the survey. Mailed surveys included a QR code and web link to encourage respondents to complete the survey electronically, but they could also complete a hard copy of the survey and return it using a pre-paid envelope. In total, we received 440 electronic and 184 mailed/paper pre-surveys (total pre-surveys = 624) and 463 electronic post-surveys and 90 mailed/paper surveys (total post-surveys = 553). We applied settings within Qualtrics to prevent respondents from submitting duplicate online surveys.
4.2 Instrumentation
We designed the pre- and post-survey instrumentation to allow for comparative analysis to determine changes in residents’ self-reported perceptions, knowledge, and behaviors over the project that may be attributed to the educational intervention. Both surveys included two screening and background questions about whether respondents had a sprinkler or irrigation system for their lawn/landscape and whether they directly controlled how often the system runs (versus a contractor or the HOA). If a respondent answered No or Unsure to having a sprinkler or irrigation system, they were exited from the online survey and subsequent online or paper responses were not used for analysis.
Among the questions used for analysis in this study, we assessed residents’ frequency of obtaining information about irrigation and water use in their lawn and landscape. Nine sources (including an “other” write-in option) were included in both the pre- and post-surveys, but the post-survey included the addition of the Hunter’s Green rainfall sign as a source. The five-point frequency response scale for source frequency was: Never (1), Sometimes (2), About half the time (3), Most of the time (4), and Always (5). We also gauged knowledge pertaining to different ways residents could obtain rainfall data, analyze such data to make irrigation decisions, and operate their irrigation controller. Our five-point response scale for the knowledge items (and multiple other questions) was: Strongly disagree (1), Somewhat disagree (2), Neither agree nor disagree (3), Somewhat agree (4), and Strongly agree (5). A set of five questions were used to measure engagement in lawn/landscape conservation practices relevant to the focus of the project. We applied five five-point Likert-type response scales modified from the Transtheoretical Model stages of behavior change for these questions: Not important to me (1), I’m considering this (2), I’m doing this occasionally (3), I’m doing this regularly (4), and This is a consistent part of my life (5). Tests of reliability, using Cronbach’s alpha coefficient (α), indicated that the information sources, knowledge, and engagement measurement indices were sufficiently reliable for social science research (all >0.65) (Ary et al., 2019).
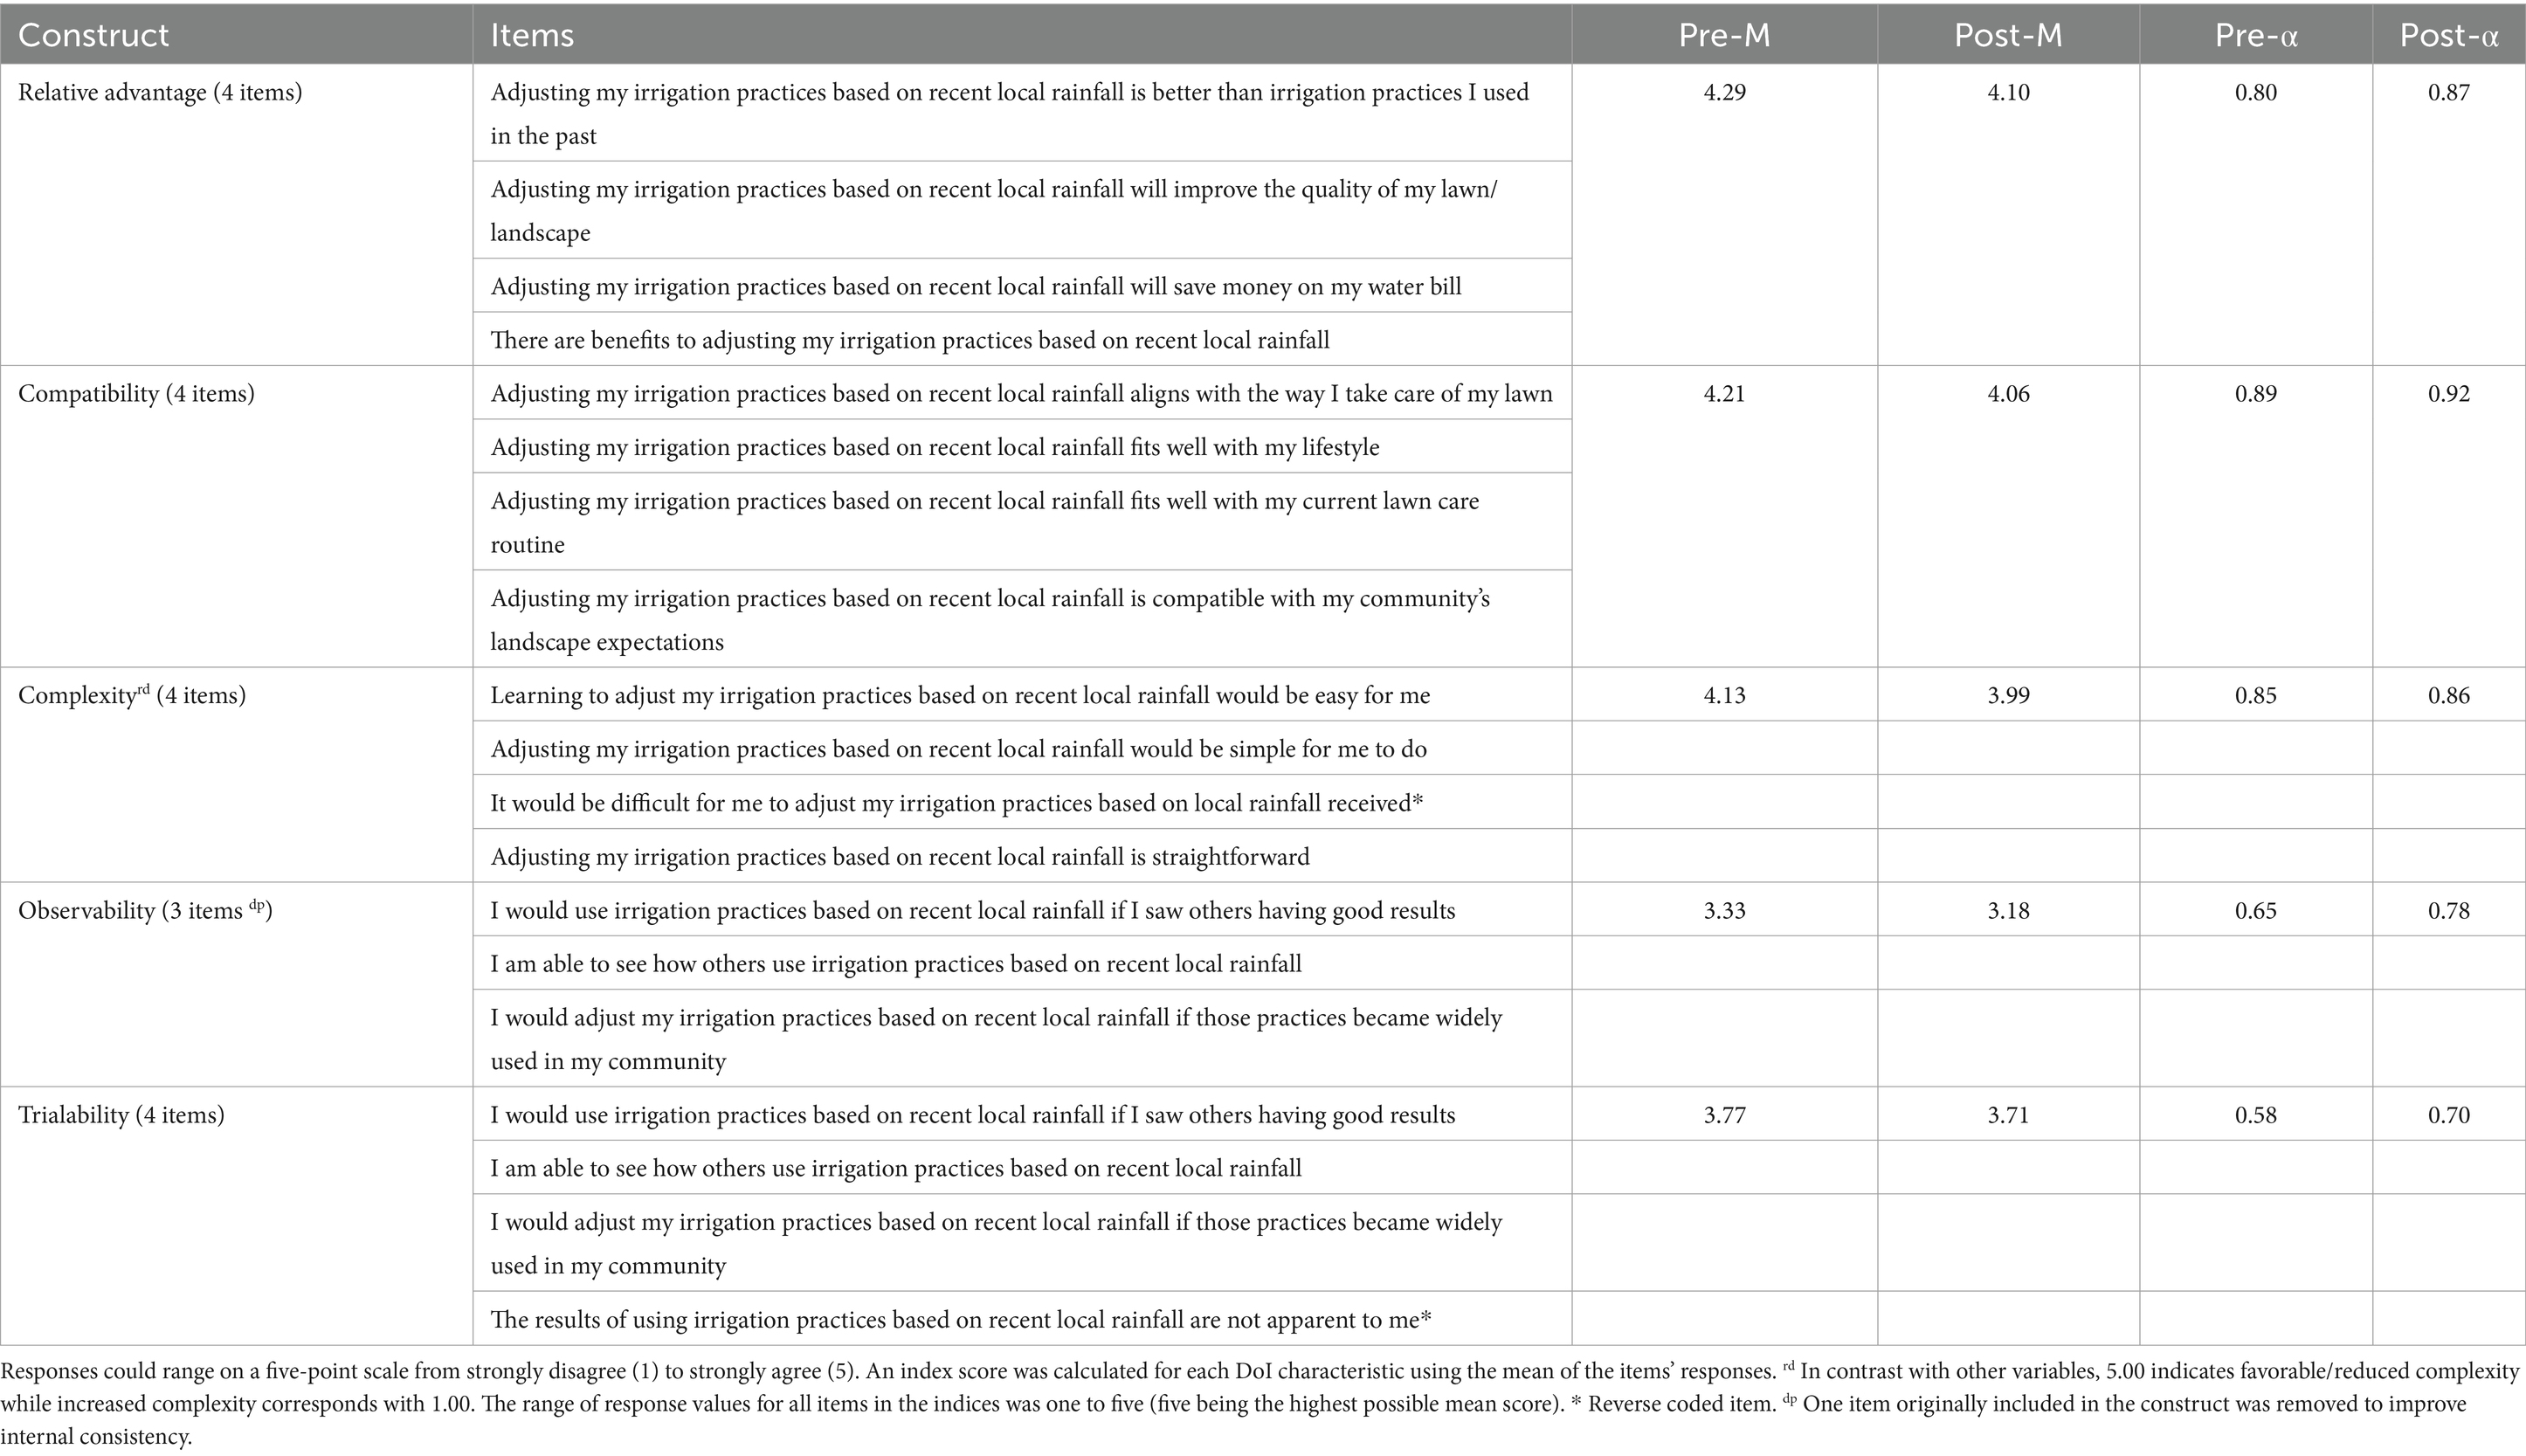
We determined residents’ decisional balance related to adjusting their irrigation based on rainfall using five sets of multiple-item questions—each designed to measure a different perceived characteristic of an innovation according to DoI (Rogers, 2003). Table 1 describes each of the DoI variables included in the analysis of the pre- and post-data. The pre and post mean (M) and reliability statistics are included. While most α coefficients are adequate, we believe the inclusion of reverse-coded items reduced reliability, especially in the observability and trialability indices. Accordingly, we removed one item from the original four items under observability to improve its reliability as a three-item scale.
Lastly, our qualitative findings were derived from two questions at the end of the post-survey: (a) How could the rainfall sign have been improved to better inform residents’ turfgrass irrigation practices? and (b) Share any feedback you would like to provide regarding your irrigation practices or water conservation in the lawn and landscape. While initially we planned to focus research outputs on the quantitative components of the project, it was determined the qualitative feedback should be equally considered and incorporated to more fully illustrate nuance and provide deeper explanations across the findings.
4.3 Data analysis
We employed the following three data analysis approaches based on the study objectives and the different types of data collected:
4.3.1 Pre- and post-survey data analysis
We used SPSS (version 29.0) to analyze the survey data in this study. We first cleaned, addressed missing data, and assigned appropriate values to the pre- and post-survey datasets following data collection. Then, the two datasets were merged to perform comparative analyses. We applied descriptive procedures to generate measures of central tendency and compare pre- and post- means. For the second objective, we disaggregated the data to calculate DoI perception means for the practice of adjusting irrigation based on weekly rainfall according to the five stages of change. Lastly, non-parametric tests (Mann–Whitney U) were conducted to determine statistically significant differences based on the data not adhering to all assumptions required for linear models (Ary et al., 2019).
4.3.2 Qualitative post-intervention data analysis
We applied qualitative thematic analysis (open coding and axial coding) to inductively group and designate themes for feedback collected post-intervention (Strauss, 1987; Creswell and Plano Clark, 2018). Three external reviewers provided feedback on the analysis outputs and process to enhance trustworthiness (Lincoln and Guba, 1985). Although only two open-ended questions were included in the survey to gather qualitative data, through our analysis, we found these findings provided rich, detailed insights relevant to understanding outcomes of the intervention, which would not be fully understood by relying only on our quantitative findings. The inductive analytical process we employed allowed the researchers to derive themes from the raw (cleaned) data through categorization based on commonalities and relevance to the project scope. Our analysis can be contrasted to a deductive process, which would pre-impose themes and/or a framework, which we determined would be less appreciative of community voice and agency in the present study (Creswell and Plano Clark, 2018).
4.3.3 Water use data analysis
We used SAS 9.4 to analyze the water use data in this study. Comparison neighborhoods were selected using Orange County Property Appraisal data based on geographic proximity, ranges of year built, lot size, home size, numbers of bedrooms and bathrooms to match the treatment group. Properties in the Hunter’s Green neighborhood are the Treatment Group and homes in the Arbor Green and Cory Lake neighborhoods serve as the Comparison Group (see Figure 3).
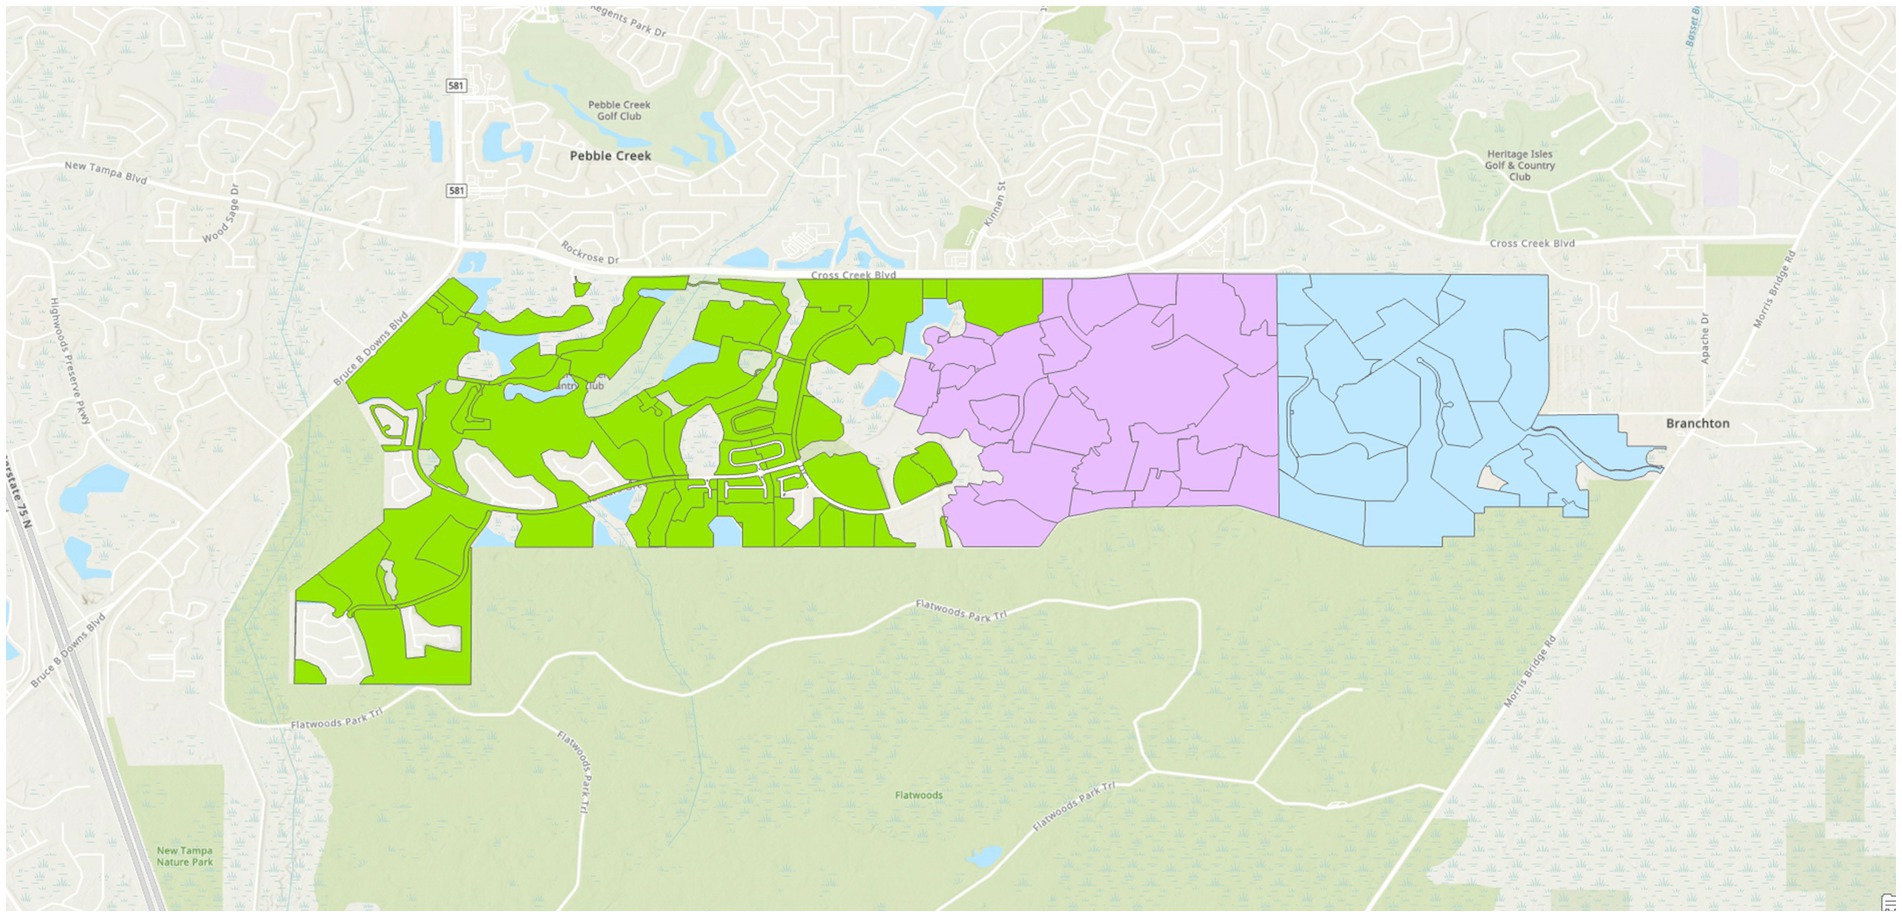
Figure 3. Map of treatment and comparison groups. Hunter’s Green is in green, Arbor Green is in pink, and Cory Lake is in blue. The green area is the treatment group. The pink and blue areas combined make up the comparison group.
To ensure that the comparison was matched to the treatment group, properties were removed based on the following criteria:
• Homes built after 2010 were excluded.
• Homes with more than 6 bedrooms or 6 bathrooms were excluded.
• Homes larger than 7,500 square feet were excluded.
• Rental homes were excluded to ensure a focus on homeowners who have the permission to adjust irrigation timers in response to rainfall.
• Monthly water use records that were greater than 3 times the median for each property, and greater than 13.5kgal, were removed as outliers/leaks. Monthly water use records that were greater than 75kgal were also removed as outliers.
Ranges, medians, and average values for property features in the treatment and comparison groups are listed in Table 2.
Lot size and home size are components that helped to determine the landscape portion of the property. The comparison group has slightly larger lots and slightly larger homes, resulting in similar landscape area. Metered monthly water use data was provided by the City of Tampa Water Department. For the water use analysis, the pre-intervention period was November 2020 through October 2021 and the post-intervention period was December 2021 through November 2022.
The upper threshold was 74,057 gal/month and the lower threshold was 748 gal/month. Daily rainfall data were collected from the Oregon State University’s PRISM Climate Group (Latitude = 28.1274, Longitude = −82.3471), which was also the source of rainfall data for the intervention sign. To ensure that the recorded rainfall was representative of the consumption period, daily rainfall was aggregated to match the meter read dates for each of monthly consumption records. Correlations between monthly water use and rainfall were analyzed for the treatment and comparison group using descriptive statistics, analysis of variance, and multiple regression.
5 Findings
5.1 Objective 1: shifts toward adjusting irrigation based on local rainfall during the intervention period
The majority of respondents reported that they controlled how often their irrigation was turned on and off, in both the pre- (89.2%) and post-survey (89.6%). A slightly greater portion of pre-survey respondents claimed that the HOA had a contractor who controlled turning their irrigation on and off (8.6%), compared to the post-survey (7.3%).
Figure 4 illustrates the shifts in residents’ use of different information sources to determine their landscape irrigation practices. Over the course of the intervention, many of the sources became slightly less frequented for information. However, more post-respondents indicated they used “other” source(s) than the specified sources listed, and the rainfall sign (only included in the post-survey) became the most used source.
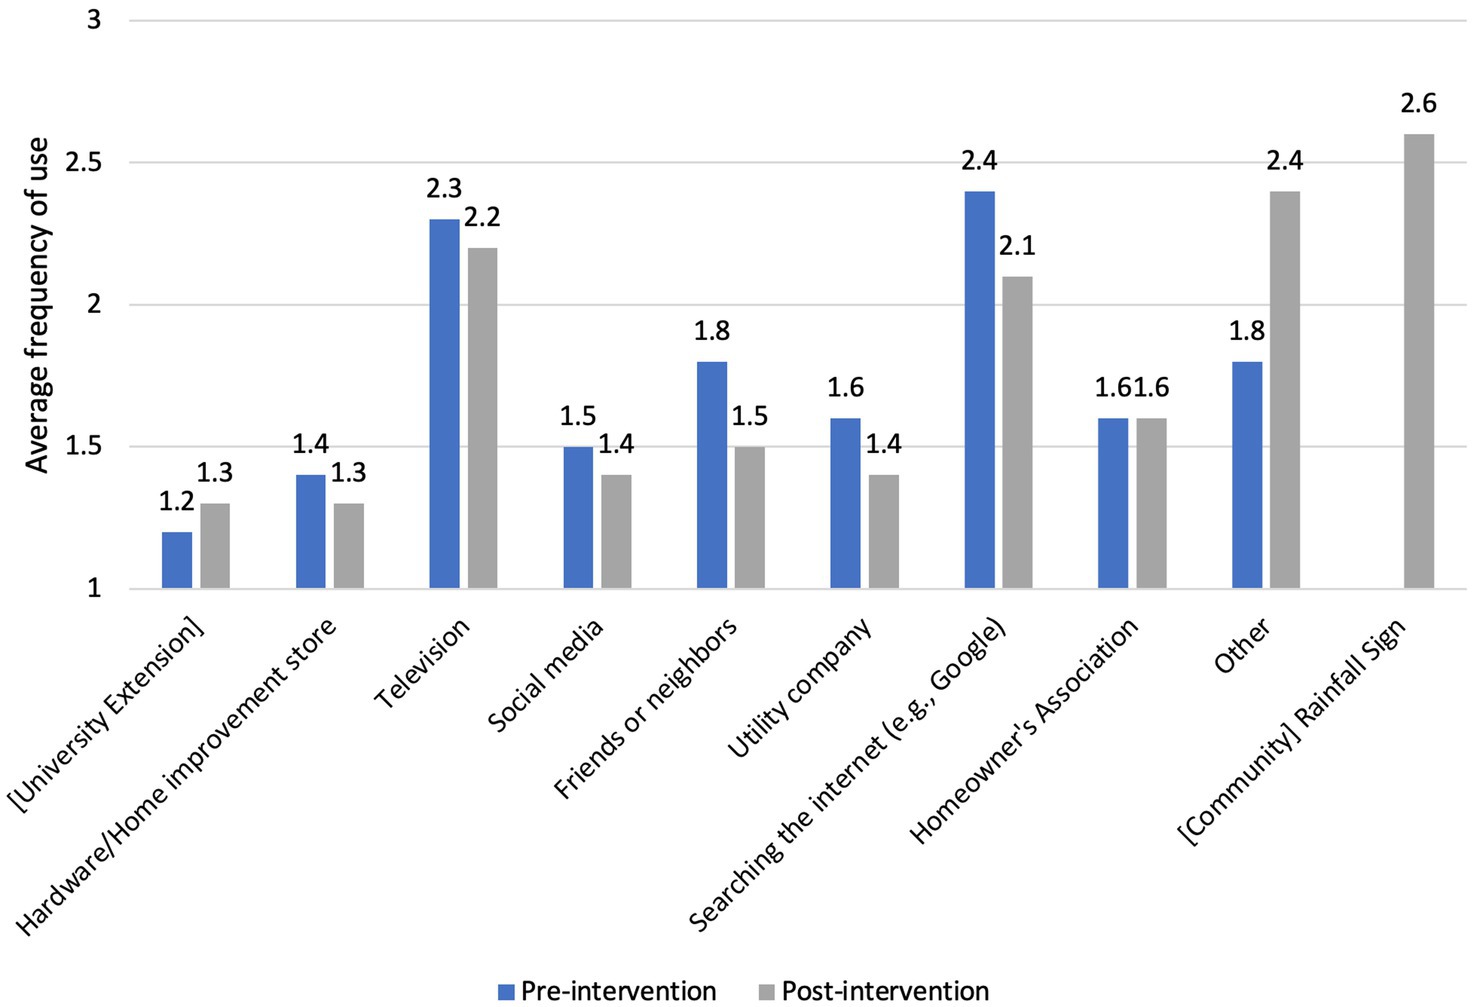
Figure 4. Residents’ frequency using various landscape irrigation and water use information sources. Pre-survey n = 450–456 and post-survey n = 426–431. Respondents were asked to indicate the frequency of their information-seeking from a variety of sources. The five-point frequency response scale was, Never (1), Sometimes (2), About half the time (3), Most of the time (4), and Always (5). Information sources provided by respondents for the ‘Other’ category included Lawn care contractors, Mobile weather apps, and Lawn self-inspection. The rainfall sign option was not included in the pre-survey as it had not yet been installed.
Residents’ self-reported knowledge related to determining their turfgrass irrigation needs and accessing local rainfall data slightly increased for most items between the pre- and post-intervention measurements (Figure 5). Using independent samples Mann–Whitney U tests, I know how to obtain information about local rainfall showed almost-significant increases between pre- and post-means (p = 0.074; U = 106,324) along with I know how recent local rainfall affects the amount of water my lawn/landscape needs significant (p = 0.075; U = 105,572).
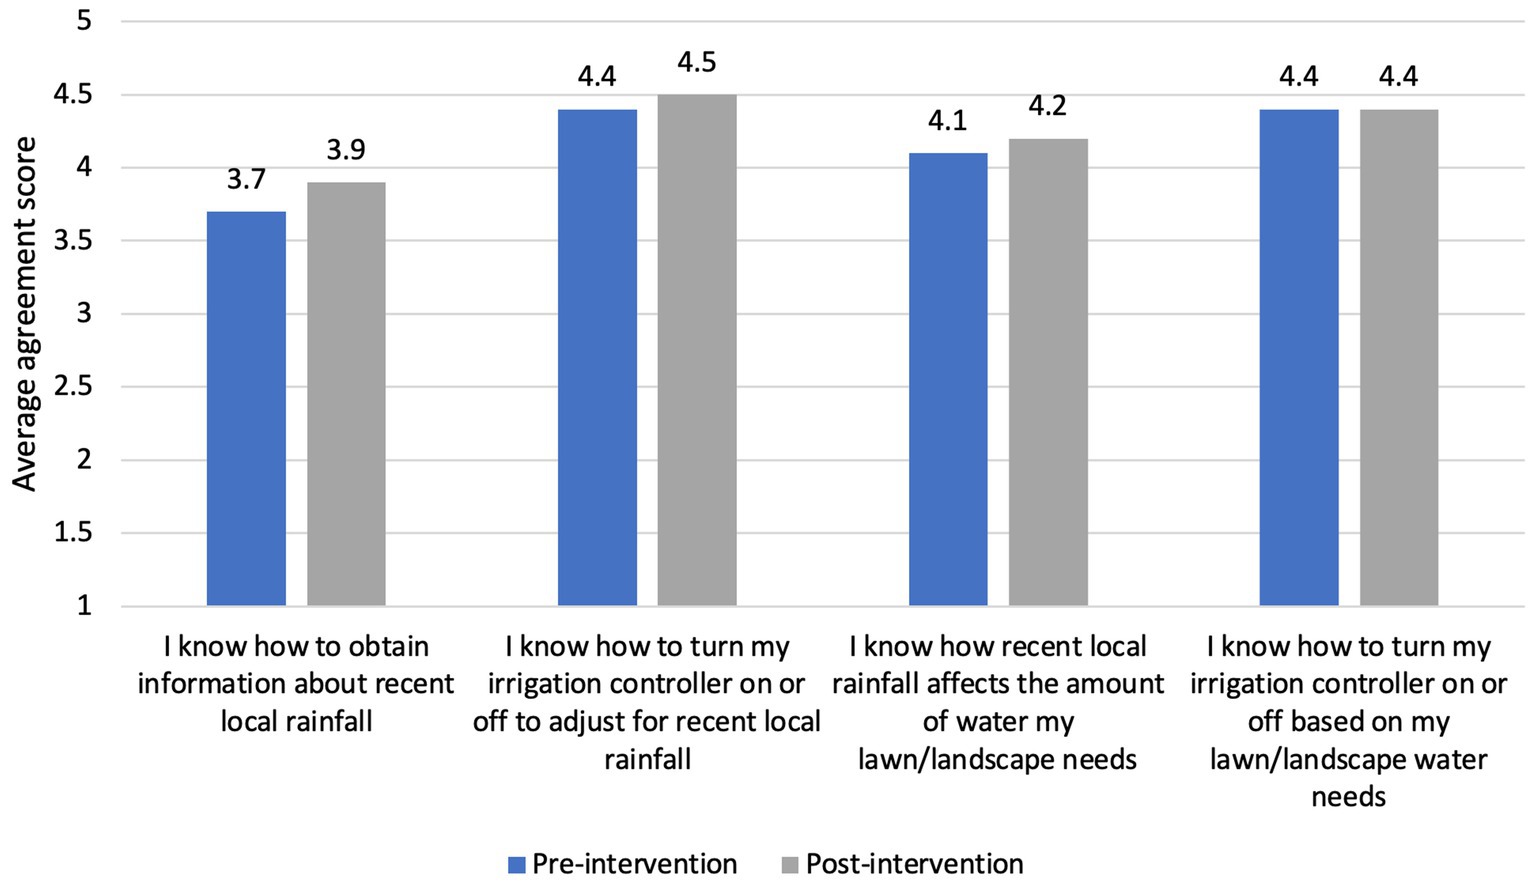
Figure 5. Residents’ knowledge about determining irrigation needs based on recent local rainfall. Pre-survey n = 461–463 and post-survey n = 430–435. Respondents were asked to rate their level of agreement with the four statements pertaining to their knowledge about obtaining or using information on recent local rainfall to determine landscape water needs and their knowledge on operating their irrigation controller based on watering needs. The five-point response scale was, Strongly disagree (1), Somewhat disagree (2), Neither agree nor disagree (3), Somewhat agree (4), and Strongly agree (5). Responses approaching a 5.0 score indicates greater knowledge of the behavior while those approaching a 1.0 score indicate lesser knowledge of the behavior.
Residents’ engagement in five landscape water conservation practices either stayed the same or dropped over the course of the sign intervention (Figure 6). There were significant decreases in reported engagement for two practices, including this study’s central practice of reducing lawn/landscape watering based on weekly rainfall (p = 0.006; U = 116,555). Additionally, Reduce how often I irrigate during the shorter and cooler months of fall and winter was significantly less post-intervention (p = 0.006; U = 116,400).
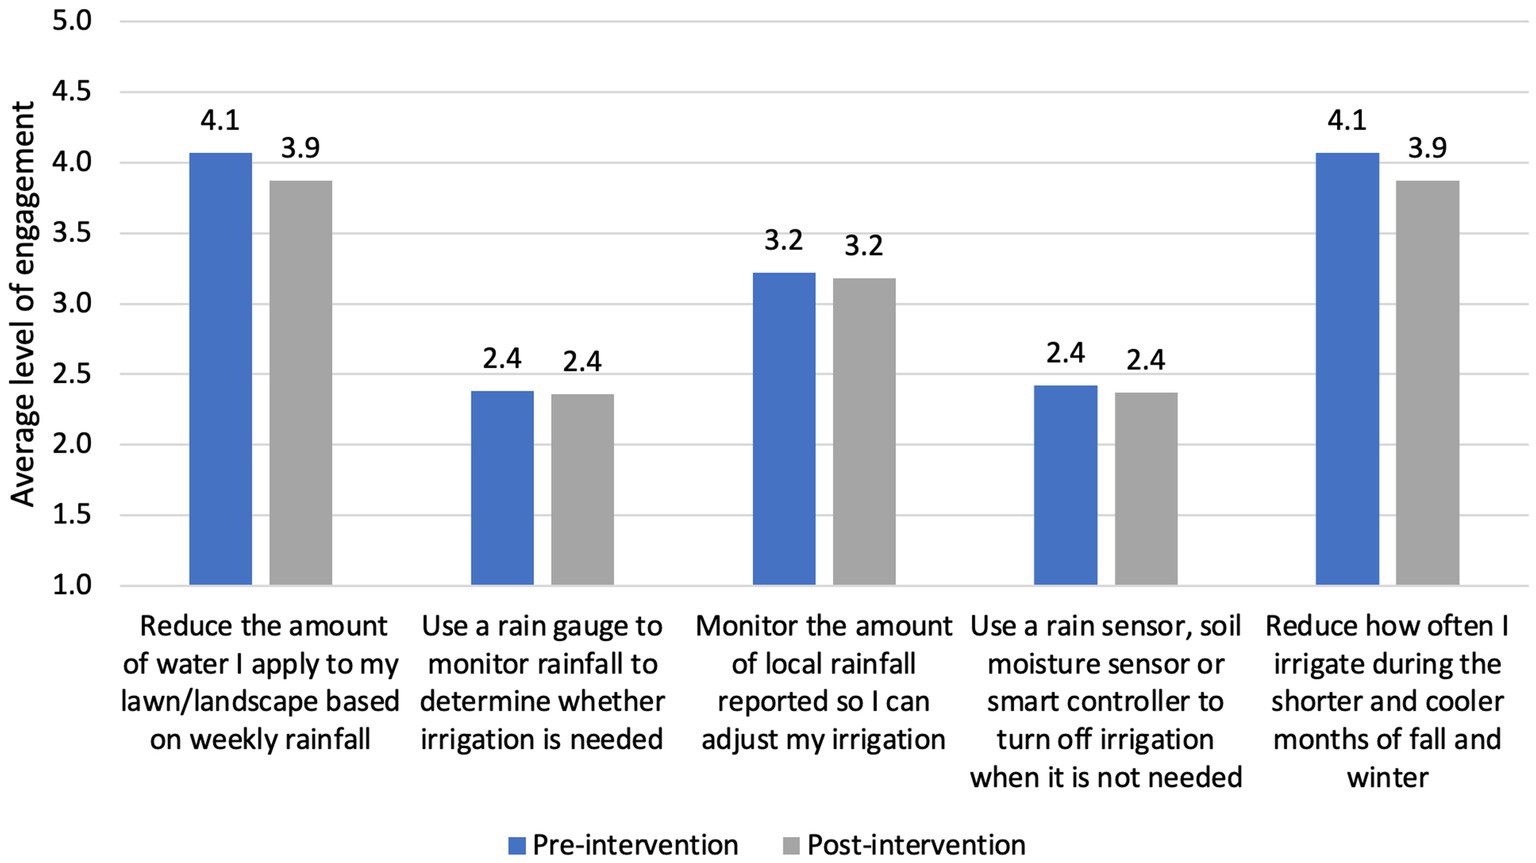
Figure 6. Residents’ engagement in landscape water conservation practices. Pre-survey n = 521–530 and post-survey n = 480–487. Residents were asked about their frequency engaging, if at all, with different landscape conservation practices. Possible responses and value scores assigned were Not important to me (1), I’m considering this (2), I’m doing this occasionally (3), I’m doing this regularly (4), and This is a consistent part of my life (5). A greater average response score (i.e., a value approaching 5.0) indicates more engagement with the behavior, while a lesser score (i.e., a value approaching 1.0) indicates less engagement with the behavior.
5.2 Objective 2: decisional balance perceptions according to their stages of engagement in landscape water conservation
When examined by stage, residents’ perceptions representing their decisional balance remained at similar levels pre- and post-intervention at the four latter stages of behavioral engagement in the practice of reducing irrigation based on weekly rainfall. However, visible decreases occurred for the first stage (Not important to me) (Figure 7): relative advantage showed the largest difference between its pre- and post-means (−0.90 ∆) and trialability had the smallest difference (−0.30 ∆).
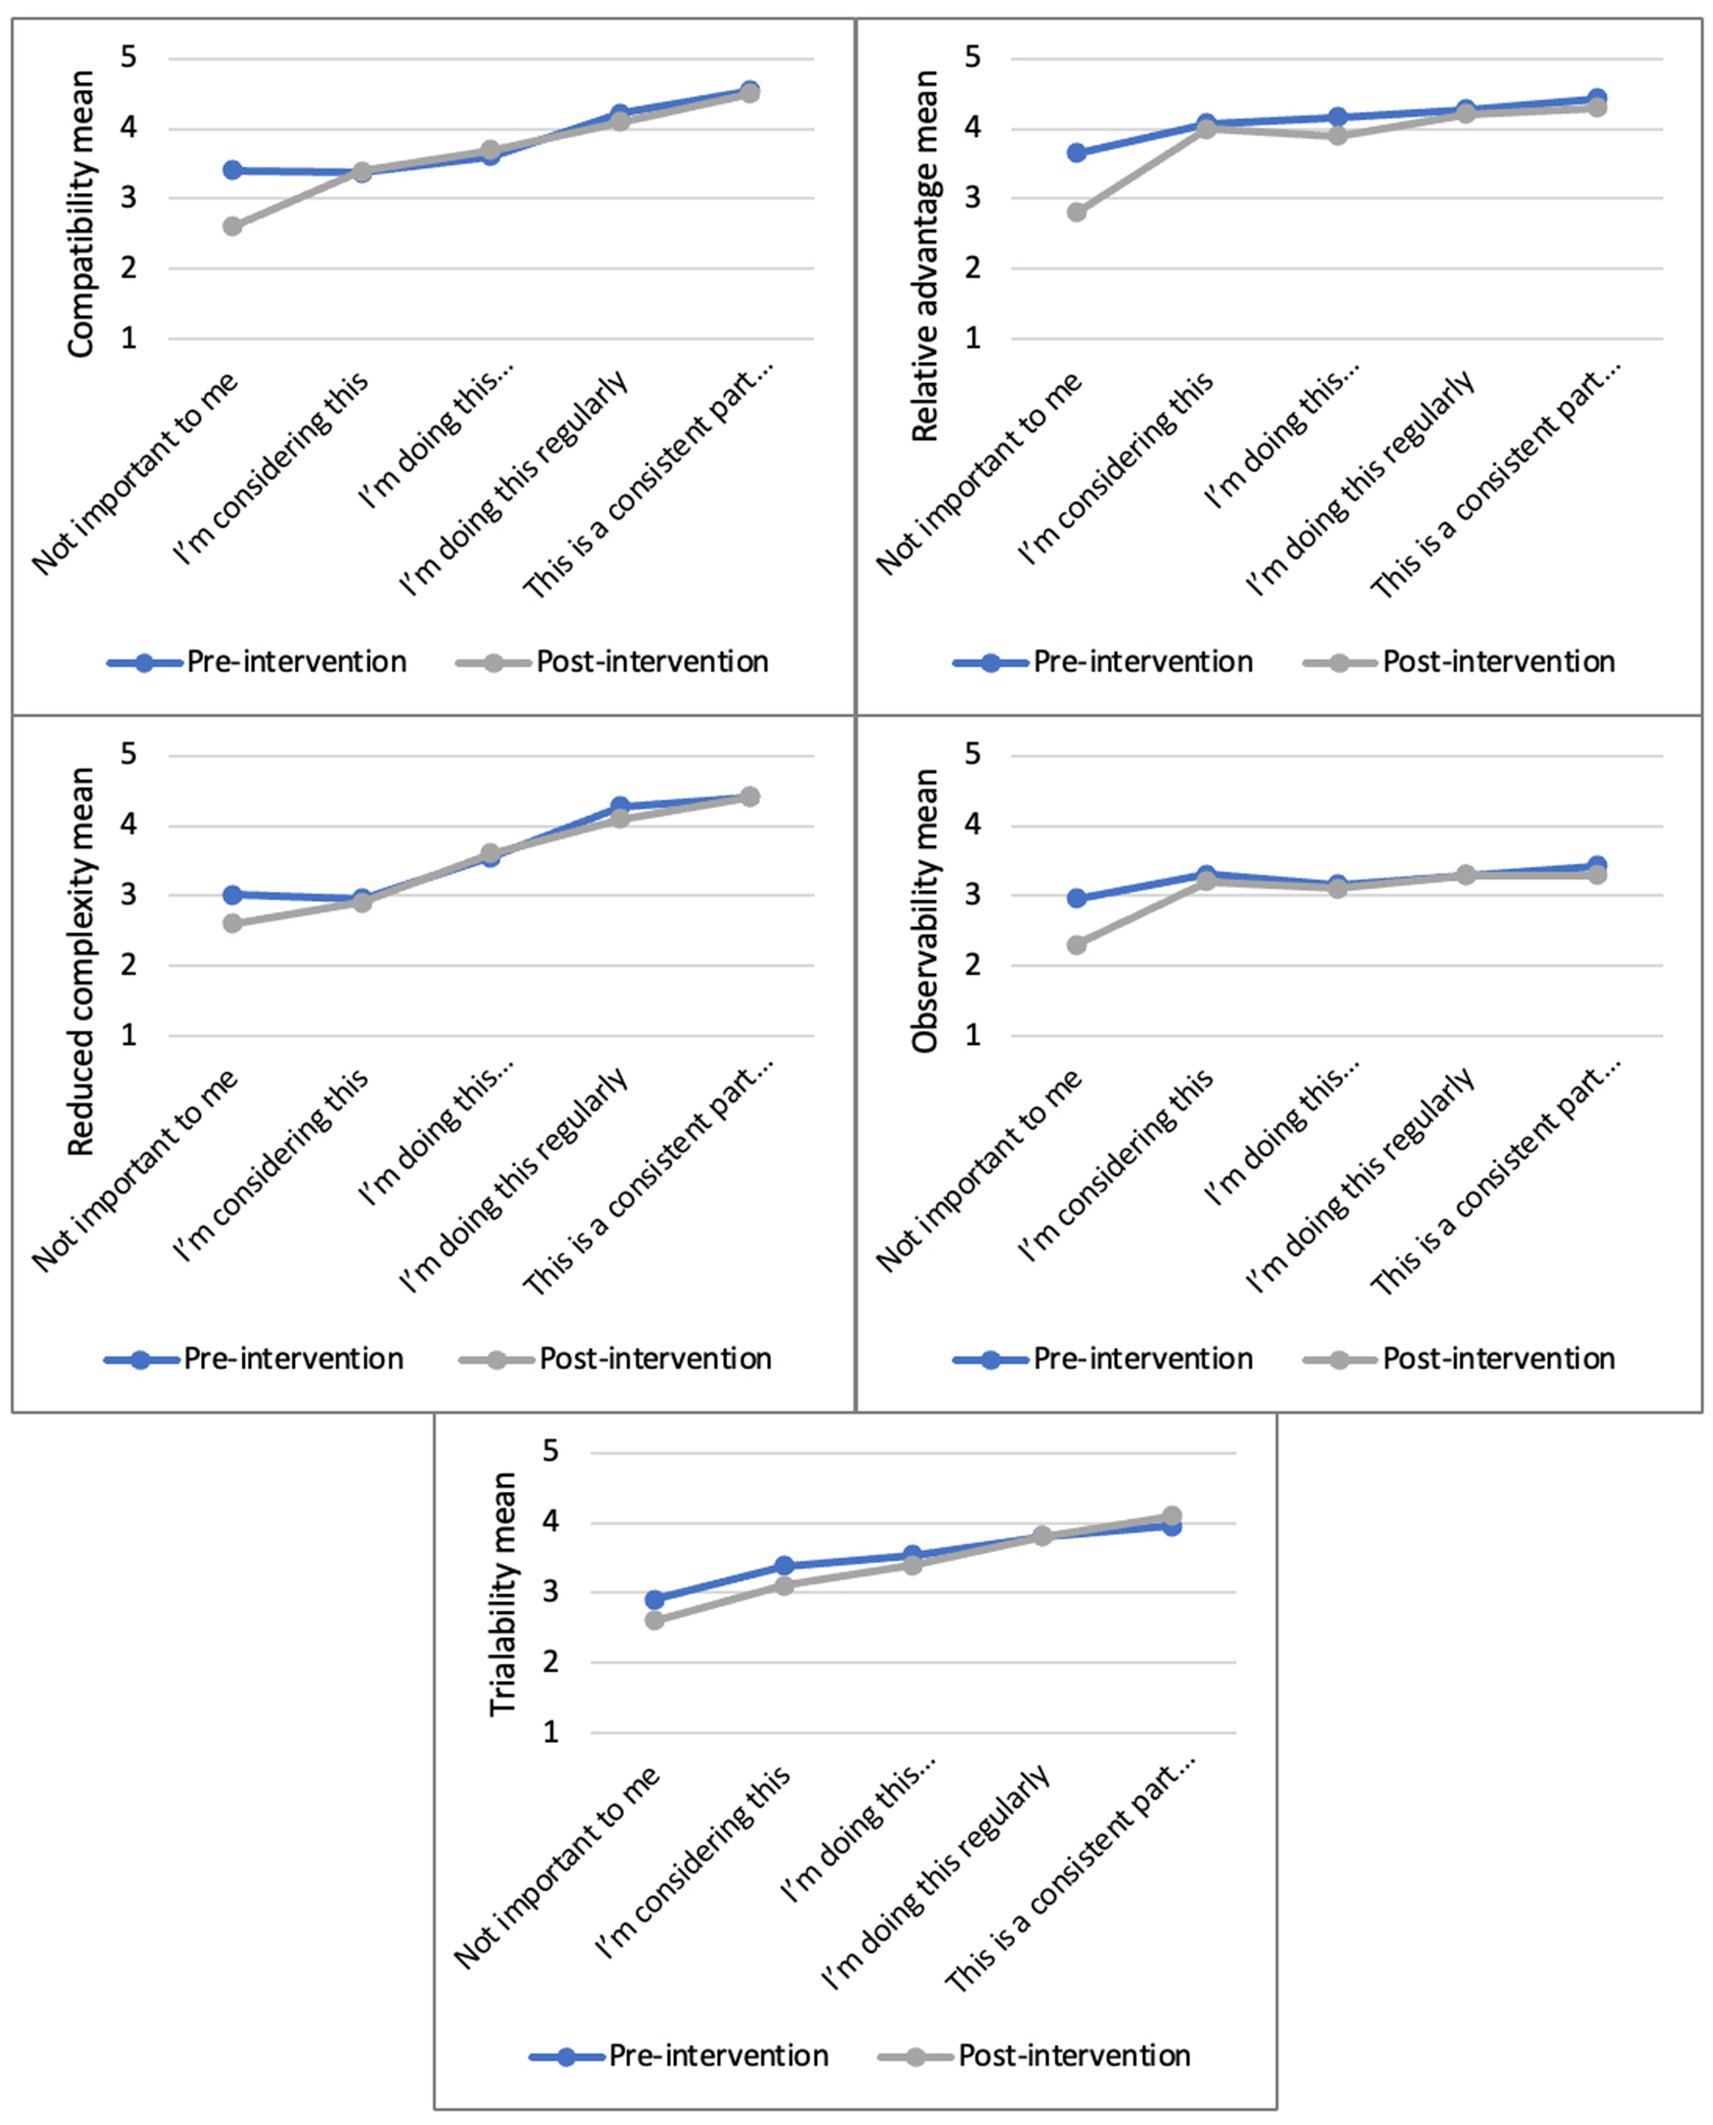
Figure 7. Individual DoI perceptions at the stages of engagement. Relative advantage pre-intervention total n = 504 and post-intervention total n = 467. Compatibility pre-intervention total n = 489 and post-intervention total n = 461. Complexity pre-intervention total n = 487 and post-intervention total n = 454. Observability pre-intervention total n = 470 and post-intervention total n = 439. Trialability pre-intervention total n = 459 and post-intervention total n = 425. The five behavioral stages on the x axis are derived from engagement in the specified practice of reducing irrigation based on weekly rainfall.
Our analysis using the overall mean, to combine all of the perceptions graphed against the stages of engagement (Figure 8), resembles most of the individual graphs in the previous figure. The most notable decrease can be found between the pre- and post-means (−0.80 ∆) at the Not important to me stage.
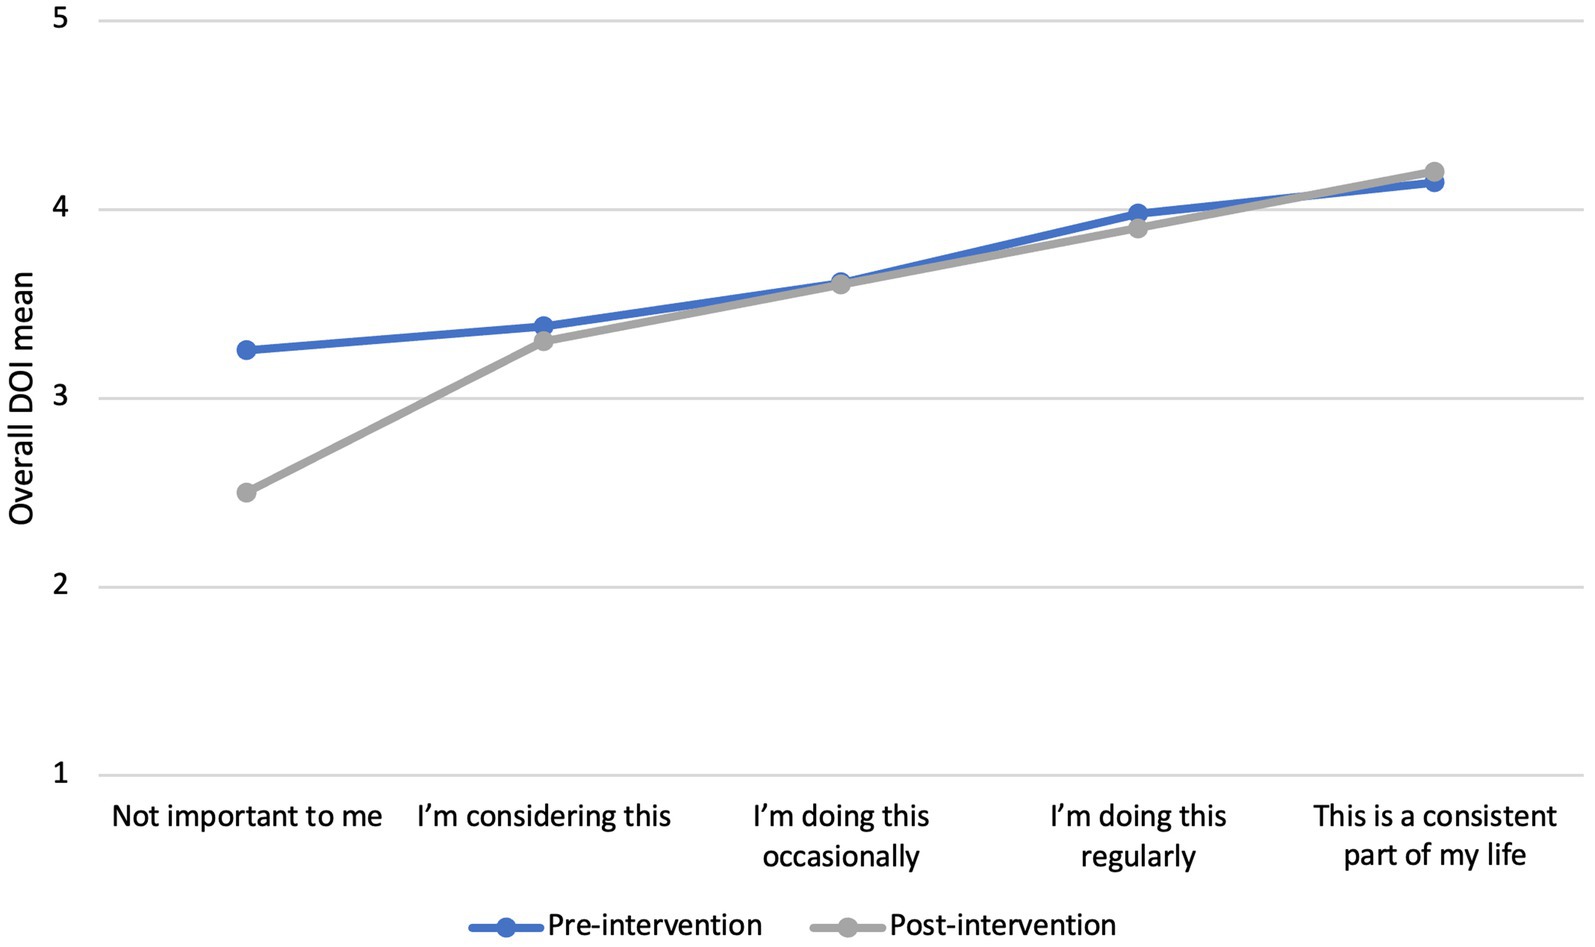
Figure 8. Combined DoI perceptions at the stages of engagement. Pre n = 442; post n = 411. The five behavioral stages on the x axis are derived from engagement in the practice of reducing irrigation based on weekly rainfall.
5.3 Objective 3: changes in water use during the intervention period
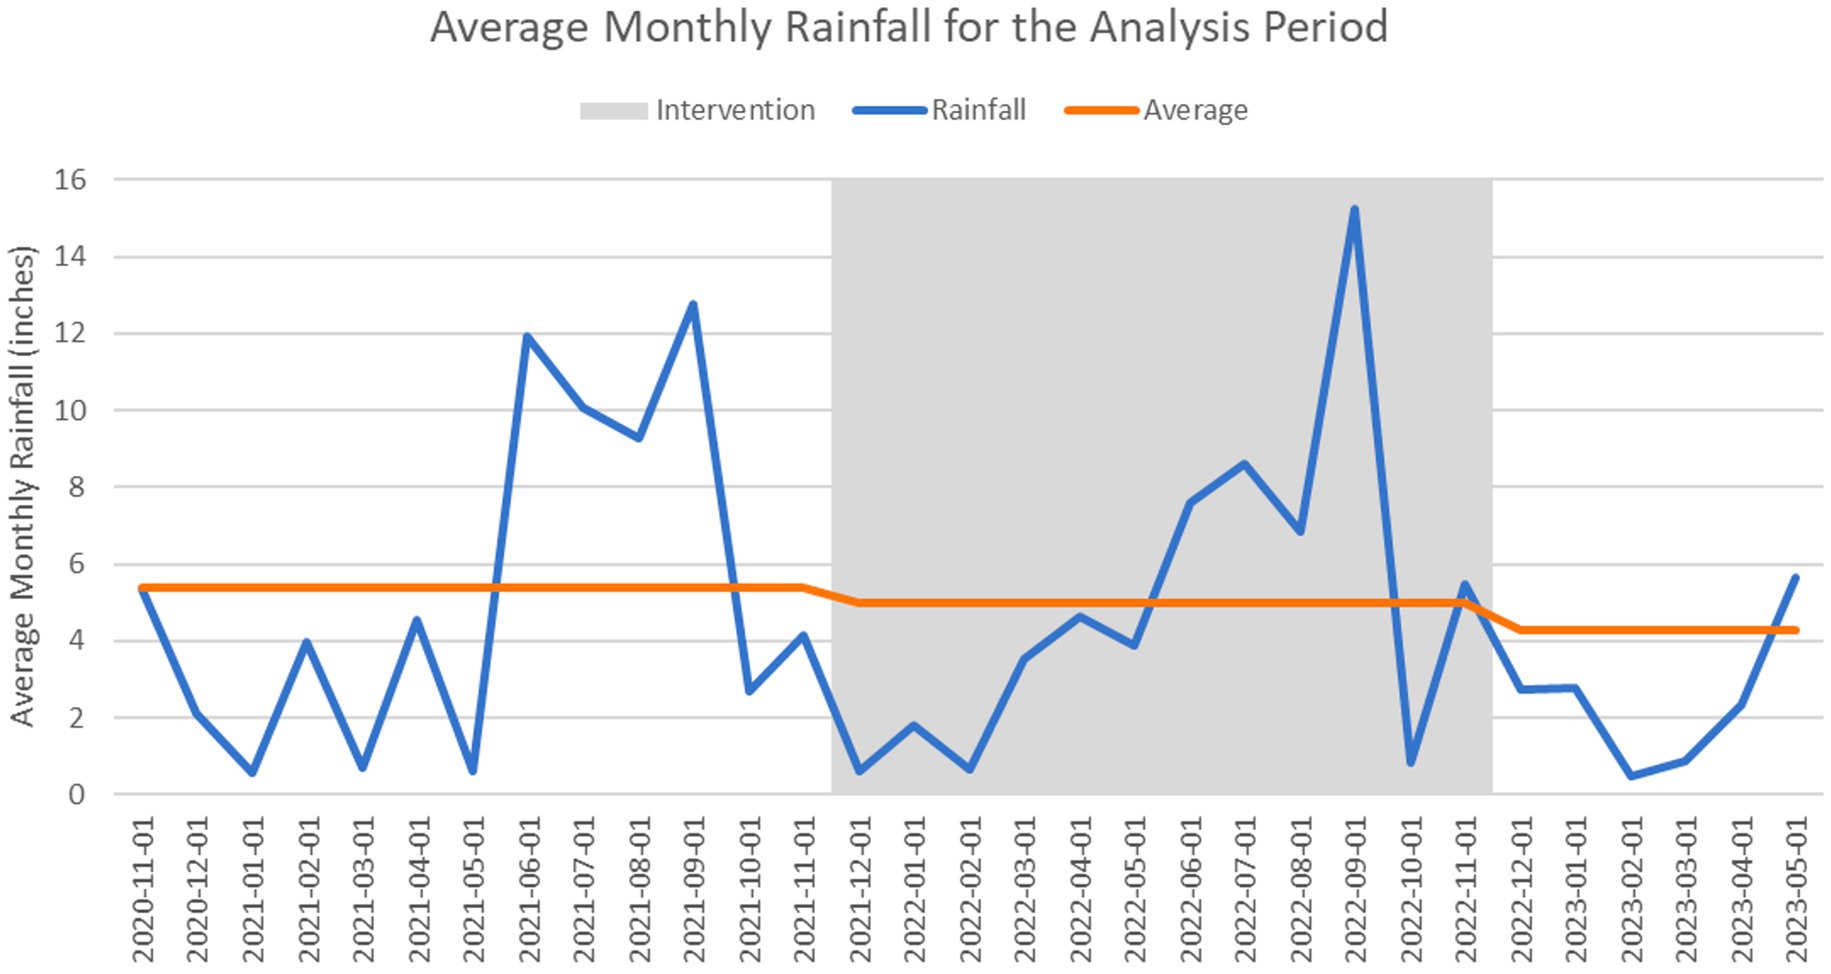
Figure 9 shows the monthly rainfall total and average monthly rainfall in the pre-intervention and post-intervention periods. Average monthly rainfall was 5.4 inches/month before the intervention, 5 inches/month during the intervention, and 4.3 inches/month after the intervention.
Figure 10 shows average monthly water use for the treatment and comparison groups. Before the intervention, average monthly water use for the treatment group was 11.1 kgal/month and was weakly correlated with monthly rainfall. During the intervention, the average monthly water use for the treatment group was 10.4 kgal/month and the correlation with monthly rainfall decreased slightly. After the intervention, average monthly water use for the treatment group was 11.4 kgal/month and was weakly correlated with monthly rainfall. Before the intervention, average monthly water use for the comparison group was 12.3 kgal/month and was weakly correlated with monthly rainfall. During the intervention, the average monthly water use for the comparison group was 11.3 kgal/month and the correlation with monthly rainfall decreased. After the intervention, average monthly water use for the comparison group was 12.7 kgal/month and was weakly correlated with monthly rainfall.
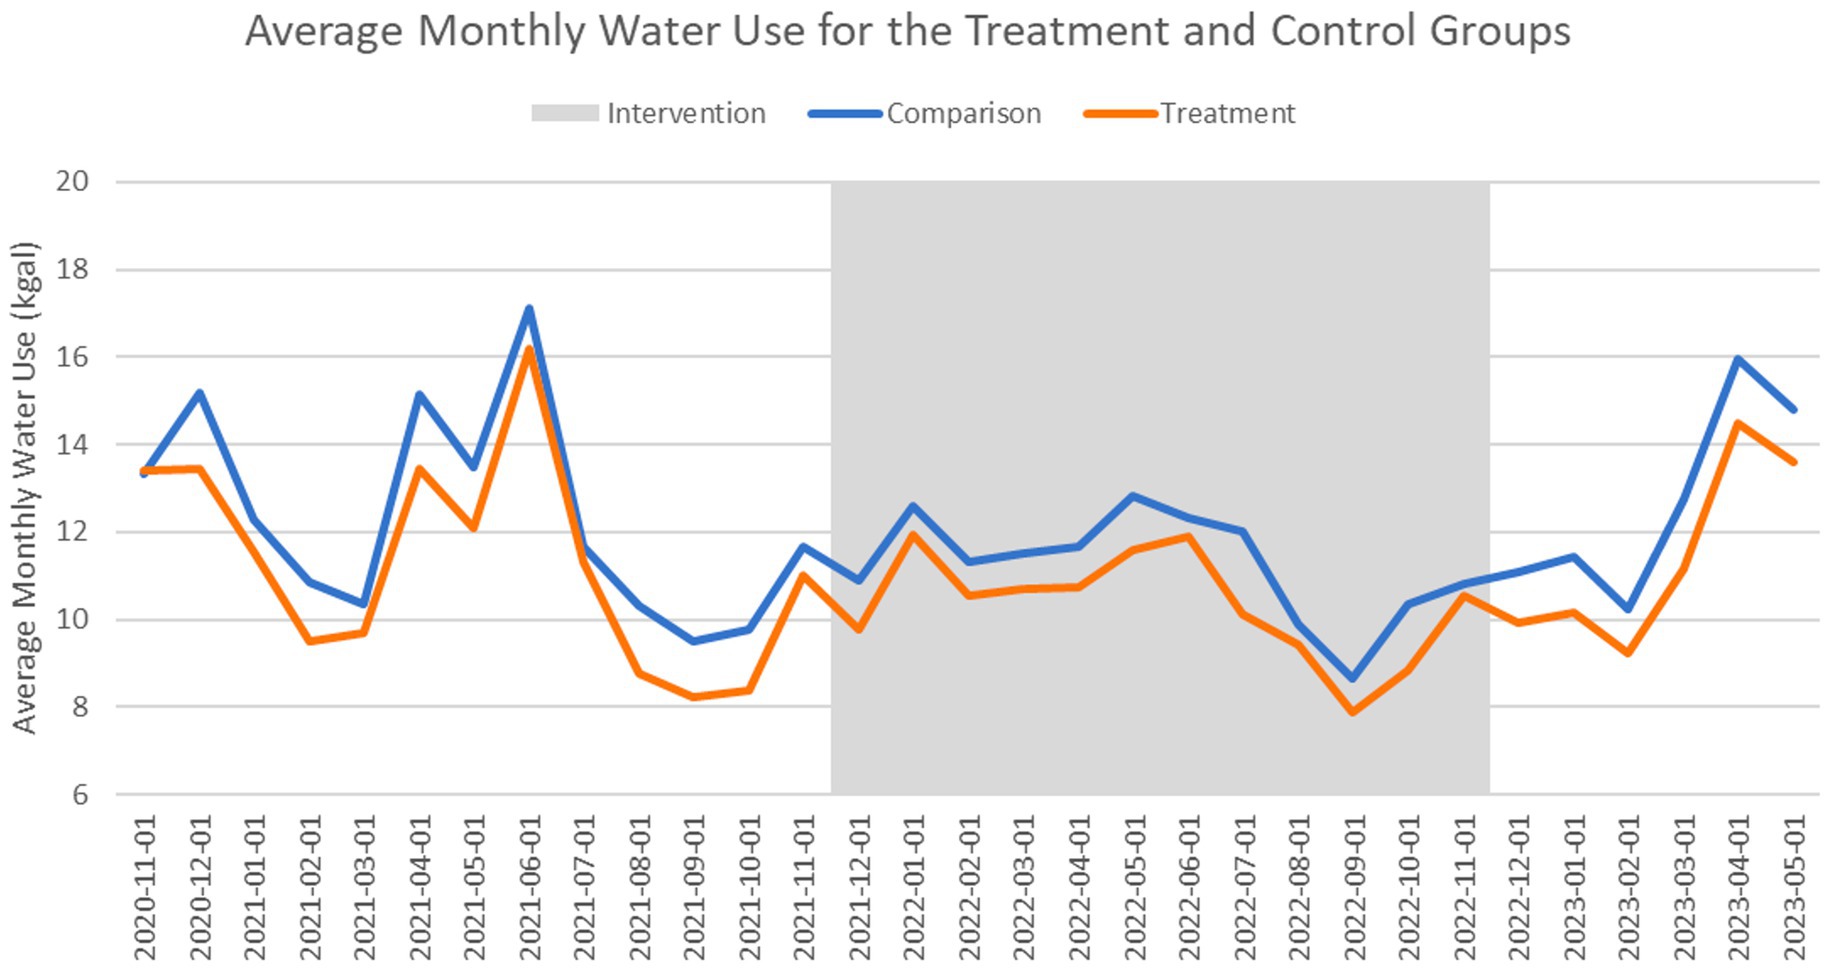
Figure 10. Average monthly water use for the treatment and comparison groups during the analysis period.
Average monthly water use in both the treatment and comparison groups decreased in the period during the intervention even though rainfall decreased slightly. Water use for the treatment group decreased by 8.3% during the intervention and water use for the comparison group decreased by 6.7% during the intervention. The difference in the decreases in water use were not statistically significant due largely to the variability in water use and change in water use within the groups. Water use increased slightly in both groups in the post-intervention period, although the change was not statistically significant for either group. In addition, the proportion of properties whose water use was more closely correlated with rainfall after the intervention was not statistically different between the treatment and comparison groups.
5.4 Objective 4: reactions to the project’s educational approach
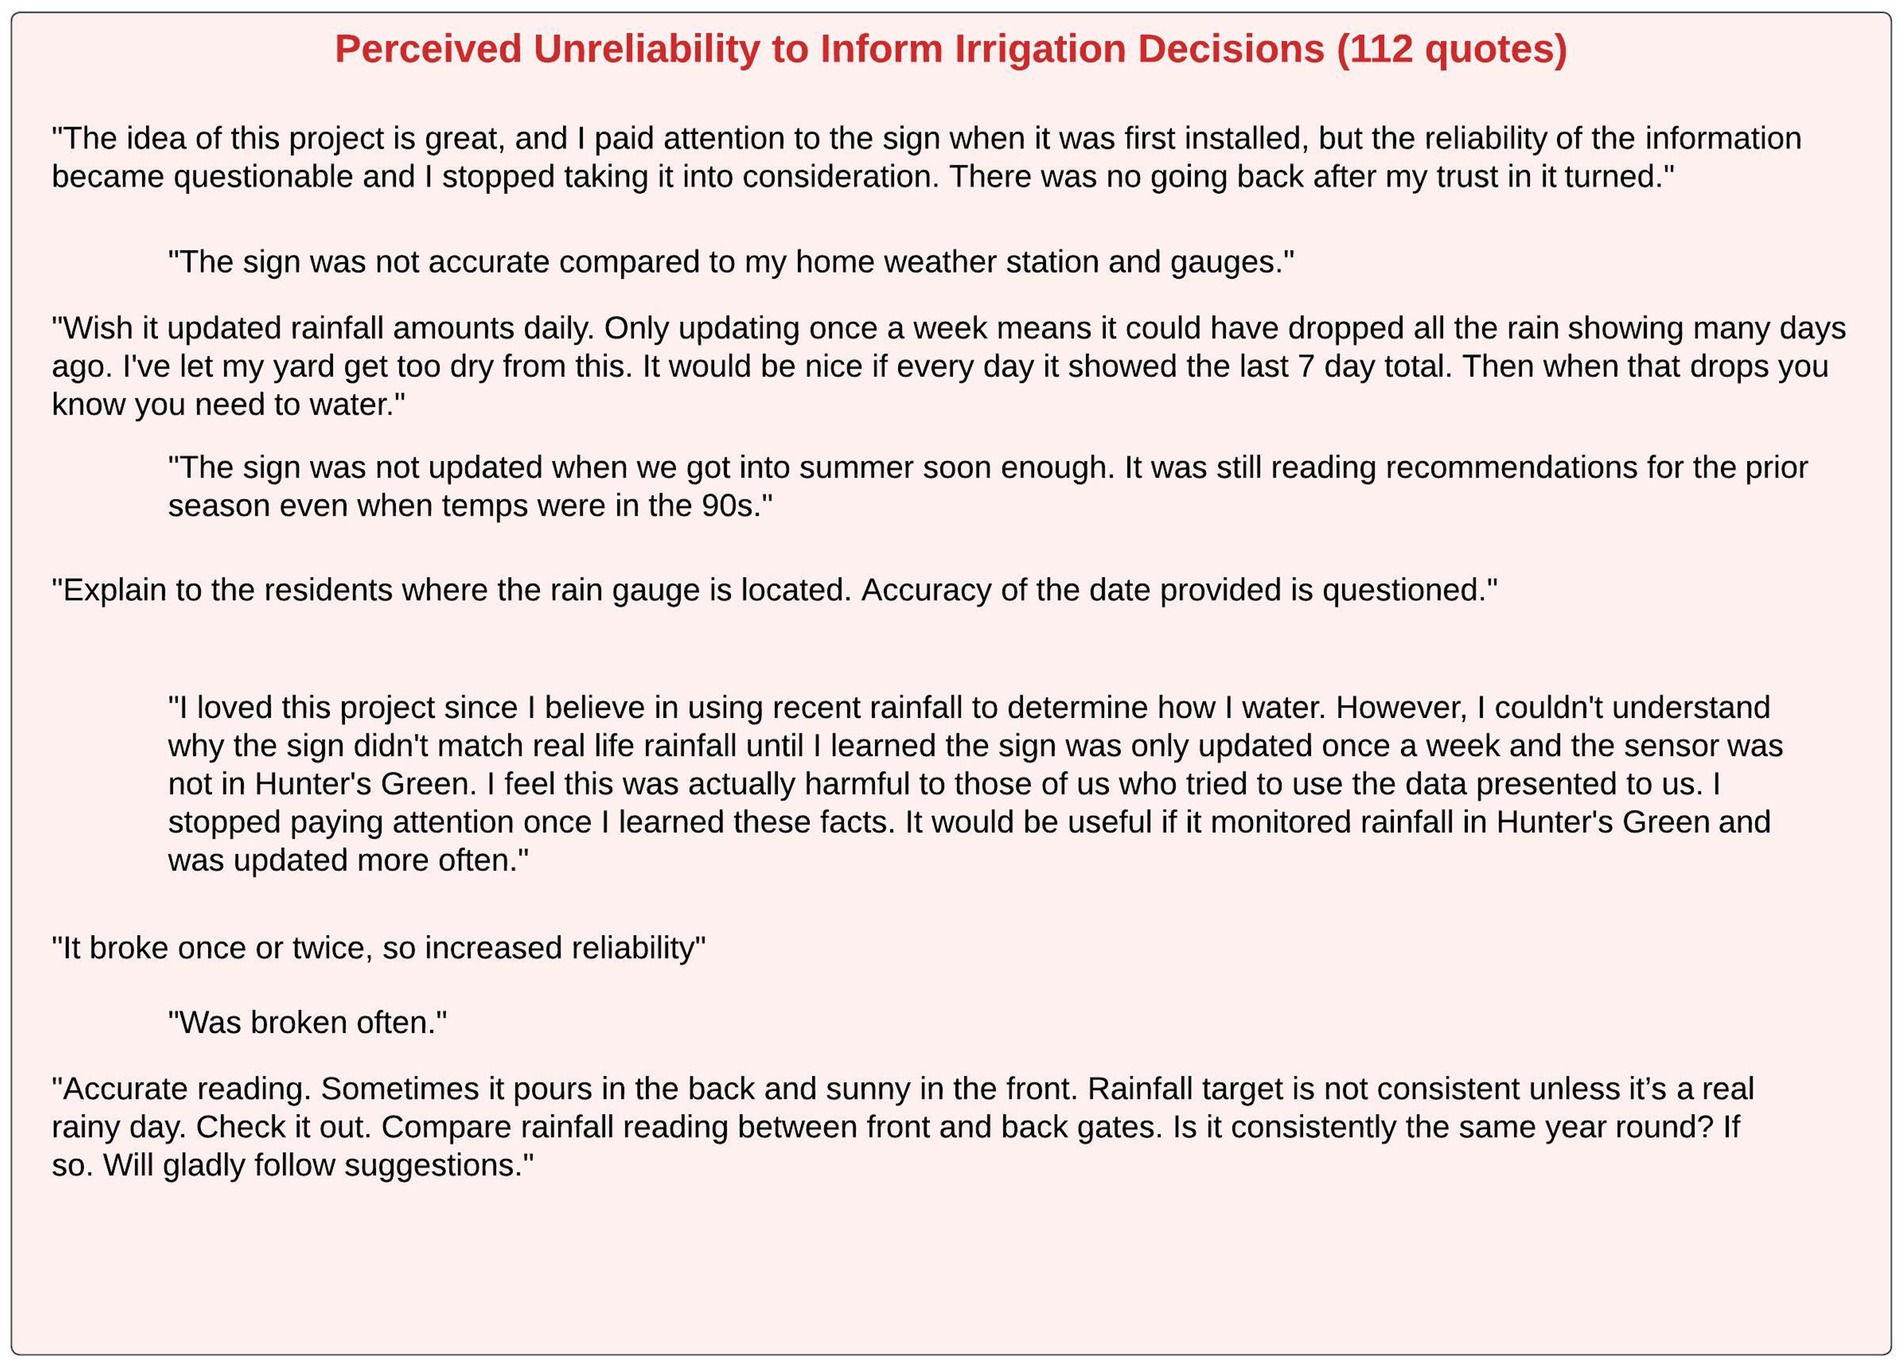
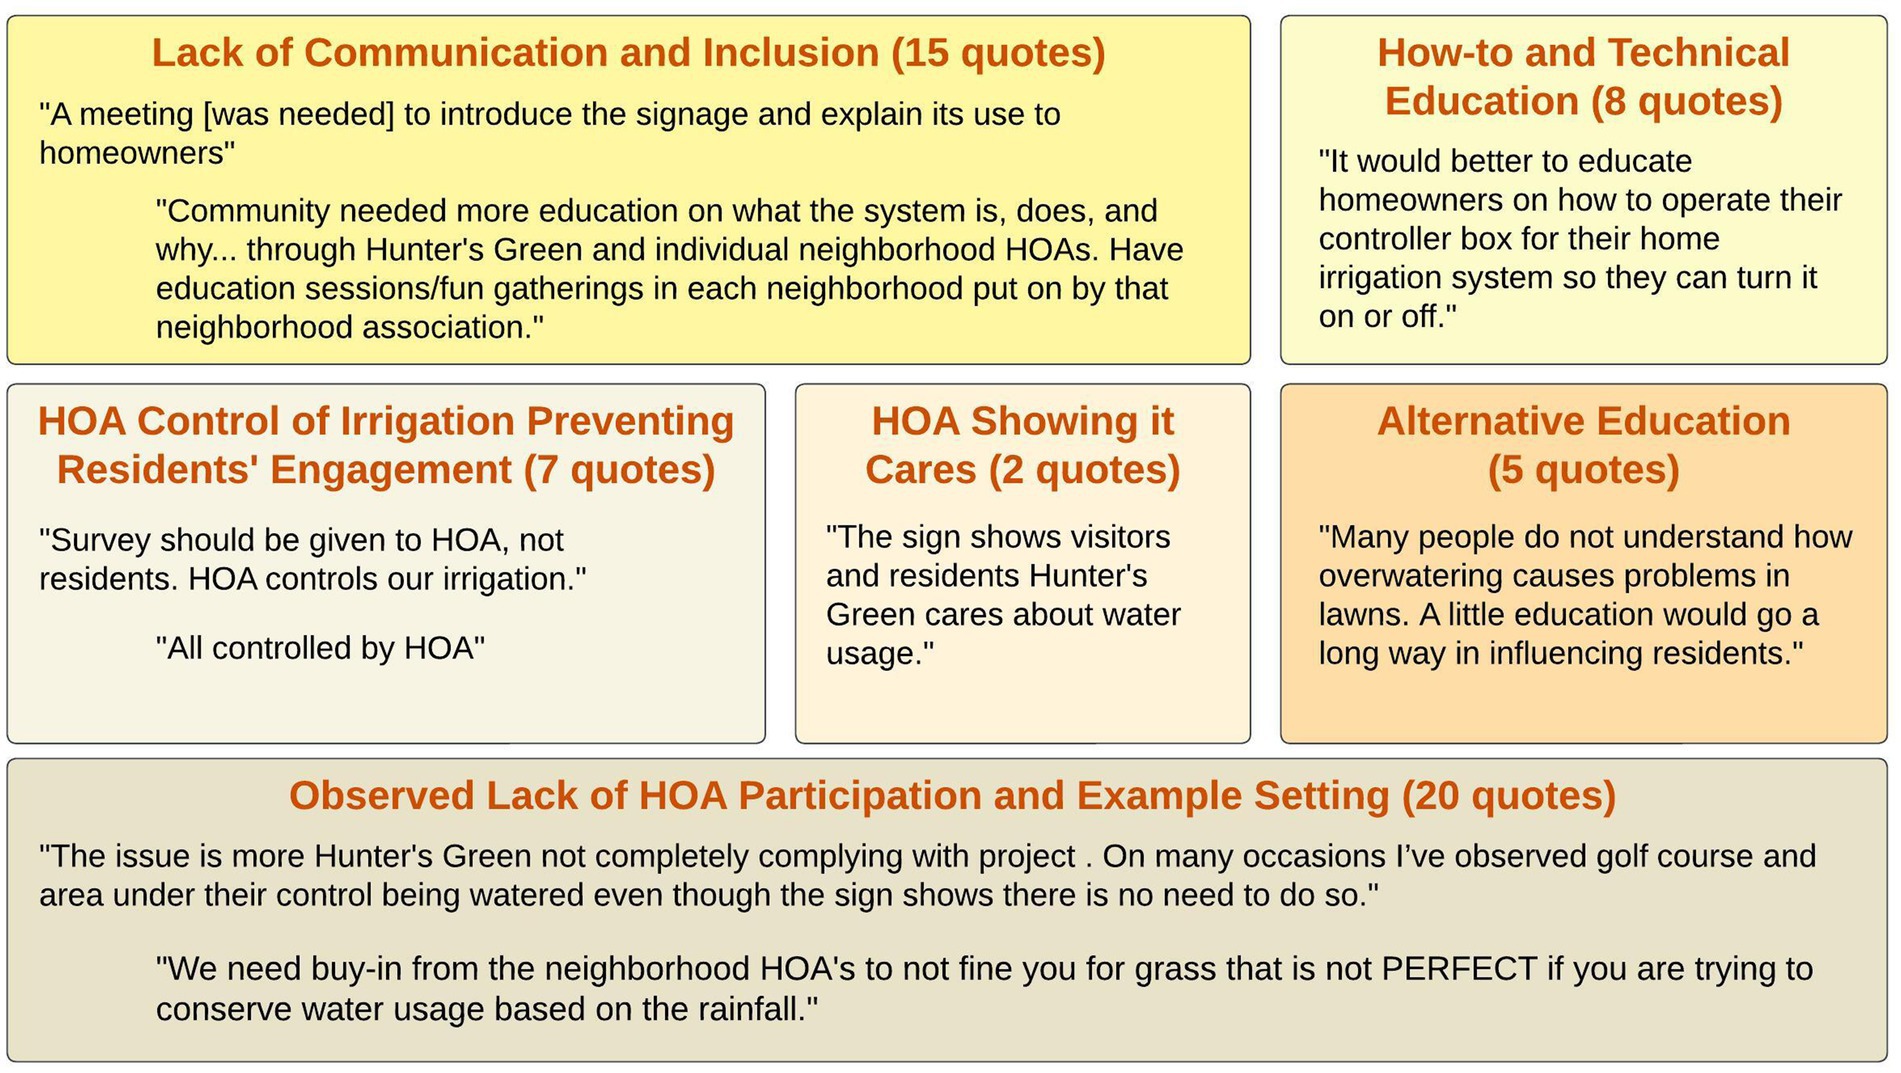
Figures 11–15 each visualize the inductively derived overarching themes describing qualitative data gathered post-intervention. Within each figure (where relevant), color-coded boxes represent sub-themes and contain illustrative quotes. More quotes than any of the other themes were coded into Figure 11’s overarching theme and single sub-theme. These data reflect residents’ perceptions that the information transmitted via the sign was not reliable enough to guide their irrigation. Some suggested that the sign was not effective because the rainfall amount was only updated weekly rather than more frequently or in real-time. Residents also doubted accuracy of the data based on comparing the sign’s rainfall reading to their home monitoring tools as well as their sensory observations of the weather.
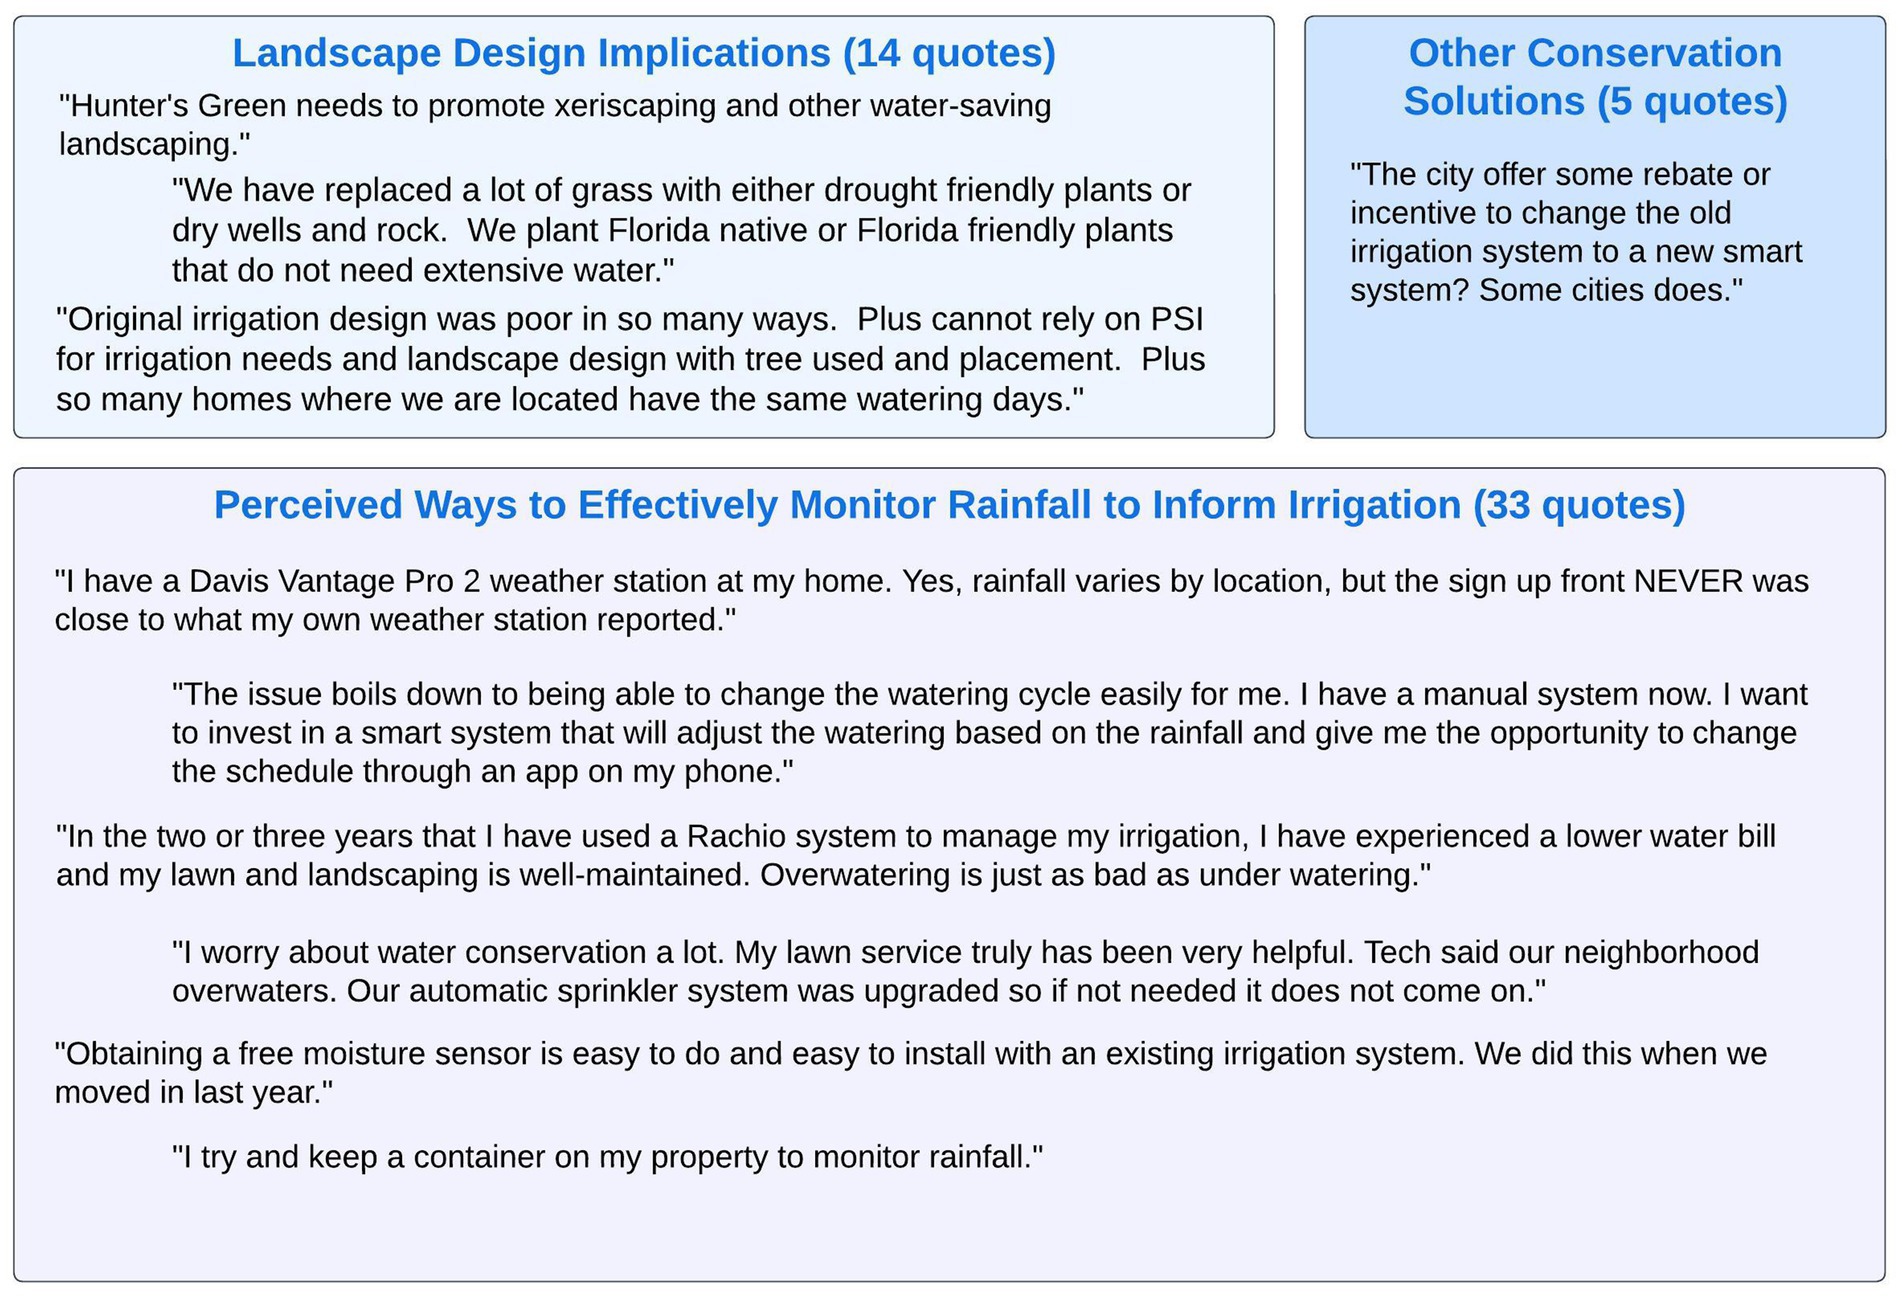
Figure 14. Residents’ perceived water conservation barriers and solutions illustrative quotes (52 total).
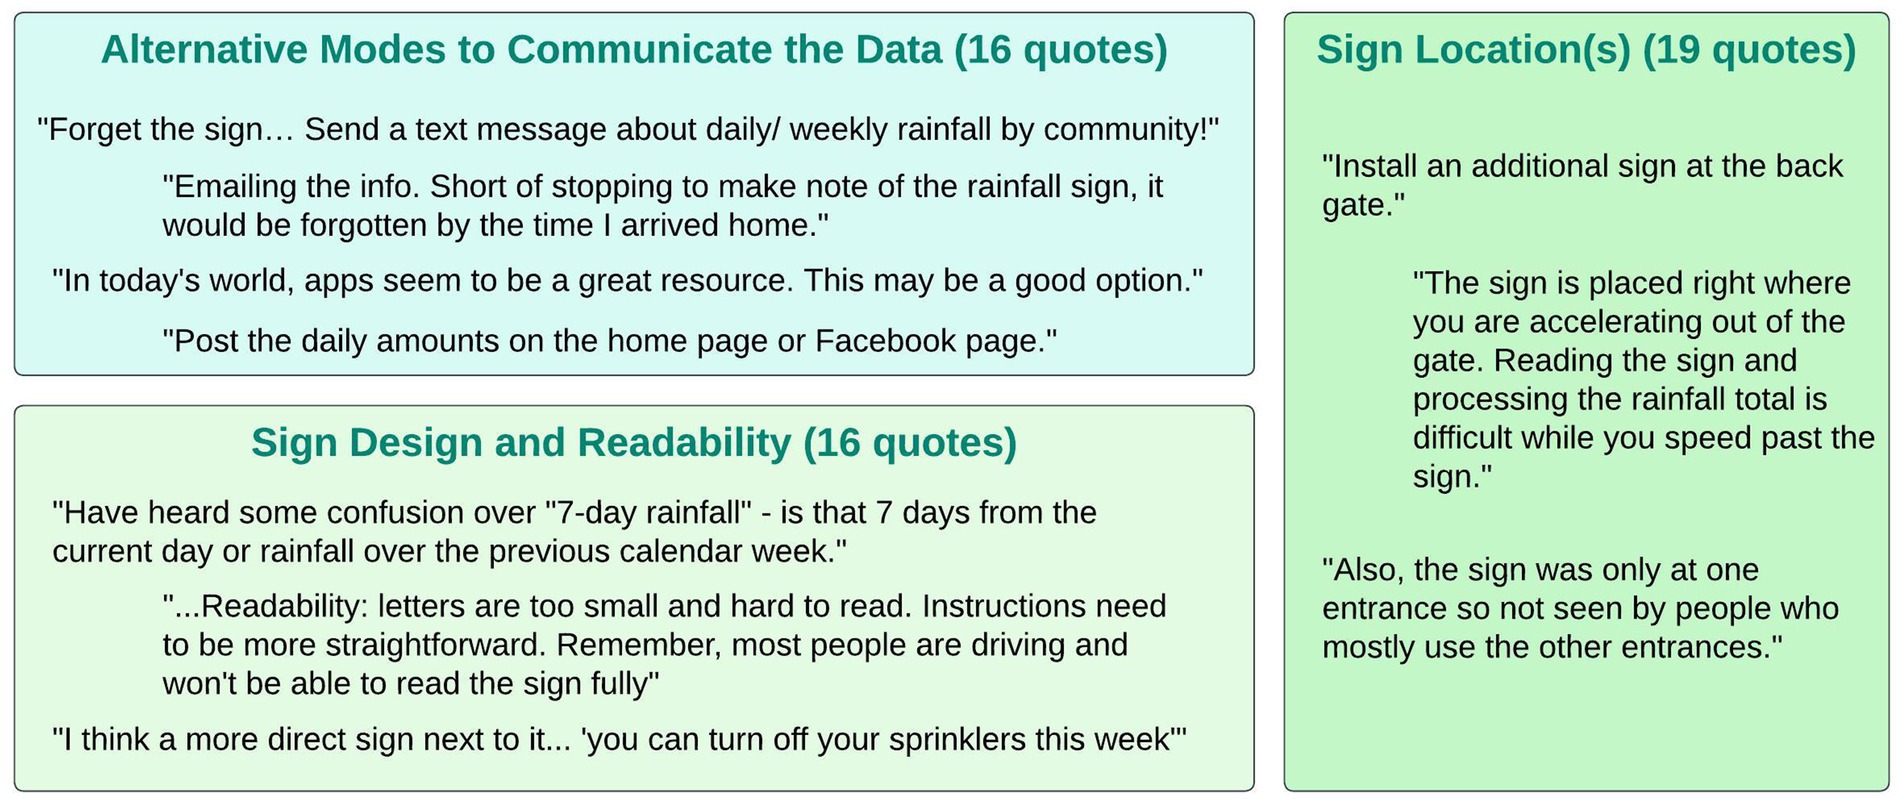
Residents voiced a variety of issues about how the sign was designed along with suggestions on alternative ways rainfall data could be communicated, proposed as potentially more effective than the sign (Figure 12). Text messages, social media, emails, or a mobile application were among these alternative modes proposed to share such data. People found both the sign’s physical design (e.g., text size, location, etc.) as well as its text contents to inhibit understanding and retention of the information and recommendations for water conservation.
The data in Figure 13 describe how residents felt there was a lack of communication and education to build their buy-in to the project along with their technical know-how to implement corresponding irrigation conservation practices. A sub-theme describes how some residents’ ability to engage in the target practice was limited or non-existent due to the HOA’s control over their irrigation. Under another sub-theme, residents explained that the HOA, while signed up for the project on paper, did not genuinely participate, and rather, would wastefully use outdoor water and fine residents for their lawn appearance.
Residents proposed diverse types of solutions to improve lawn/landscape (Figure 14). People recommended automated systems and weather stations and one respondent asked if the municipality could subsidize adoption of smart irrigation systems. Residents also claimed that reduced-turf lawns would be a solution to improve the community’s water usage, but the HOA may not permit this aesthetic.
The final visualization of qualitative feedback demonstrates that overall perceptions of the project ranged from highly positive to highly negative (Figure 15). Some residents wanted the sign intervention to become permanent and felt it helped them reduce their landscape water use. Others complained about the perceived unsightliness of the sign, its uselessness, and the waste of money invested in the project.
6 Discussion
Professionals and community leaders engaging in conservation education and outreach can improve the design and execution of their efforts by learning from this Florida-based pilot project’s successes as well as its failures, or missteps. Experts advocate for the publication of reports on conservation failures for others to learn vicariously, yet such cases are rarely found in the literature (Stravinsky, 2000; Sunderland et al., 2009; Catalano et al., 2019). Our three sources of findings—pre- and post-surveys, water usage data, and qualitative feedback—reveal nuance in project outcomes, which includes the adoption of the rainfall sign as a central information source and some knowledge increases, in contrast with decreased engagement in the target conservation practice, no significant changes in water usage, and residents’ unfavorable perceptions of the target practice and project approaches.
Considering the drop in residents’ adjusting irrigation based on local rainfall in conjunction with other findings sheds light on potential reasons for this failed attempt at shifting behaviors. Moreover, residents’ increased exposure to rainfall data may have led to slight knowledge increases related to the practice but was an insufficient means to improve residents’ decisional balance perceptions that would convince them to adopt and actually reduce water consumption. The narrow scope of the project’s education, by focusing on providing rainfall data without engaging the community to learn how to do the practice and its benefits, may have further constrained achieving behavioral outcomes. Decisional balance most notably decreased for residents in the pre-contemplation stage. The transtheoretical model (TTM) posits that people in the pre-contemplation and contemplation “starting stages” of behavior change are most likely to progress toward adoption if they build awareness about a problem and its solutions, learn how the change would bring them benefits, and identify resources to support the change (Fava et al., 1995). Arguably, these three conditions were inadequately addressed via the project, which concentrated on basic information transmission about rainfall amounts and the recommendation to use it for irrigation decisions. According to Fava et al. (1995), sustainable engagement by people further along in the TTM stages of change (i.e., at preparation, action, or maintenance) depends on social support for the change, perceiving greater benefits from the new behavior, and the replacing prompts (or stimuli) to engage with the old behavior with prompts for the new behavior. In this study, residents’ reduced decisional balance may have also stemmed from a lack of social support from the community and its leaders coupled with invisibility of benefits. Notably, the sign became the most-used source for rainfall data, but alone, this may not have been an effective enough prompt to spur changes in behaviors.
Residents’ qualitative feedback helps to better explain why the theorized change in conservation did not occur as well as specific barriers and solutions that the project did not address. Numerous technical issues and perceptions of unreliable data were voiced by residents, indicating they paid attention to the sign but could not confirm the accuracy of its data. Some residents checked the sign’s weekly amount against their own sensors or gauges and others seemed unwilling to trust the sign without knowing more about the data source and its credibility. Namely, a resident commended the project idea but identified the detriment being the data component: “…the reliability of the information became questionable and I stopped taking it into consideration. There was no going back after my trust in it turned.” Sharing weekly updates rather than daily or real-time transmission was also identified as a pitfall in the project approach, as residents observed rain events during weeks when the sign suggested irrigation was needed. Seasonality may have compounded this issue, bringing forth the question of whether using the sign was appropriate during the Florida rainy season. Although the qualitative data were analyzed via an inductive lens rather than the DoI characteristics (like the quantitative data), this feedback underscores a perceived lack of relative advantage in switching practices. For instance, a resident expressed that “the sign was not accurate compared to my home weather station and gauges.” However, compatibility issues were also raised, with residents claiming the physical sign design could have been improved in its readability, messaging, and even location. Some residents seemed to appreciate the concept but recommended using alternative digital methods for communicating rainfall data, such as mobile applications and webpages. According to User Centered Design theory, these challenges imply that the project team identified the conservation need but did not align an effective technological solution by actively consulting with end users of the technology and accounting for their engagement experiences (Still and Crane, 2017).
The qualitative data also underscore the shortfalls of the project’s focus on data access without community engagement and additional educational activities. Community members felt the sign was installed without any introductory meeting explaining why the Hunter’s Green community was a partner, the sign’s purpose, or ongoing education to support residents in enacting the conservation behaviors: “[The] community needed more education on what the system is, does, and why… through Hunter’s Green and individual neighborhood HOAs.” These gaps diminished residents’ sense of inclusion or relevance in the project, which are cornerstones of effective adult learning (Knowles et al., 2015). Although some feedback praised the HOA for showing it cares about water conservation, multiple residents identified policies (e.g., fines for lawn appearance) and practices (e.g., watering the golf course in the rain) by the community’s leadership and management that contradicted the conservation goals and even presented barriers to residents’ engagement in conservation. For instance, a resident pointed out that “the issue is more Hunter’s Green not completely complying with project. On many occasions I’ve observed golf course and area under their control being watered even though the sign shows there is no need to do so.” Lastly, residents suggested an array of conservation solutions for the community to reduce outdoor water use including smart irrigation systems, xeriscaping, and environmentally-friendly landscape professionals — although they claimed the HOA would not permit the turfless landscapes.
Although information access and exposure can be prerequisites to behavior change (Finger, 1994), the results and feedback from this project suggest the overall approach may have contained fundamental flaws. Outreach and non-formal education have shifted away from top-down technology transfer models, common in the 1970s and 80s, toward more participatory and community-centered models deemed to bring about sustainable behavior changes (Swanson and Rajalahti, 2010; Suvedi and Kaplowitz, 2016). The pilot project was potentially too closely aligned with a transfer model, and thus, we recommend testing designs grounded in community engagement and participatory approaches. Practitioners may consider contemporary planned change paradigms like systems change, theorized to better address multifaceted, systemic problems using a pluralistic and highly participatory model (Kania et al., 2018). A systems change community conservation effort would be multidimensional by working together with the community and its leaders to identify pathways to shift perceptions, power dynamics, relationships, formal policies and practices, and resource flows—all of which arguably contributed to the pilot project’s challenges. Moreover, we advise that engagement be more intentional with planned community leaders who express interest in partnering on conservation efforts. This is critical for the project team and those leaders to find ways together to promote an enabling environment through their policies, practices, and their relationships with residents—to prevent contradictions like those evident from this study. HOAs and their leadership—most common in the United States but present in concept throughout the world (Clarke and Freedman, 2019)—can have a significant influence over their residents’ landscape practices and the resulting conservation impacts through both formal policies and social norms. Unfortunately, this influence often dissuades residents from establishing environmentally friendly landscapes as they clash against a manicured aesthetic centered around turfgrass lawns (Turner and Stiller, 2020; Larson et al., 2022). The present study points to the opportunity to socialize community leaders and residents toward turfless and less-turf landscapes to better conserve water.
Numerous signs of success and potential catalysts for greater change resulted from the pilot project. Perhaps the most fundamental was the rainfall sign becoming the most-used source for rainfall data, which indicates residents were inclined to shift away from internet and other sources, or residents initially trusted a new university and community sponsored data source. We recommend that practitioners developing similar interventions carefully consider our qualitative findings regarding perceived data unreliability, potential sign messaging issues, and lack of clarity or transparency about the data source. It may have been more effective to use a localized, visible rainfall source connected to the sign inside the community. The qualitative data also reveal project successes pertaining to residents “taking the science into their own hands,” building awareness of the conservation need and employing their own methods to address it, which they deemed more effective than the sign (e.g., using home technologies and alternative data sources). Hence, we believe the evidence that the community’s residents wanted to be more engaged and learn more about the project illustrates their inclination to conserve. Future projects should employ community-building and brainstorming early and throughout the intervention. Furthermore, a reflection meeting, which we did not conduct, following such a pilot project is recommended to attempt to embolden residents to pursue further actions, possibly even leading some to shift from contemplation toward engagement.
7 Conclusion
The range of successes and failures resulting from this pilot project can guide professionals in designing and implementing effective future residential water conservation initiatives. A review by Catalano et al. (2019) found that project successes are shared nearly four time more frequently than project failures; yet without systematic analysis and peer-reviewed publication of challenges, there runs the risk of repeating the past instead of learning from it. Moreover, we concur with experts recommending a broader cultural shift within the research community and we hope sharing the failed attempts in this pilot project can be as valuable as published conservation successes. More specifically in response to our work, we recommend researchers use more participatory engagement and inquiry techniques. This includes an increased emphasis on collecting qualitative data to bring community voices to light, which was limited to two open-ended feedback boxes in our post-survey. Such a qualitative emphasis should explore the power dynamics and relational issues shown to influence project results. Additionally, aligned with research, ongoing project monitoring, with “accountability checkpoints,” should be executed to ensure corrections are made when intended results are not occurring.
The changes in landscape design and management practices needed by climate uncertainty and water scarcity are radical, and they involve not only technological fixes, but a true paradigm shift in both the way research is performed and how knowledge and experiences are integrated into that research. Traditional pre- and post-intervention survey research methods can be useful in gauging specific outputs, but as the story of this pilot project demonstrates, they alone lack responsiveness to participants’ motivations or challenges inhibiting their actions or follow-ups on their intentions. What is needed are mechanisms to capture and respond to broad and unique changes in the community and in individuals to facilitate an inclusive vision of what a community desires to become. This is where participation can be leveraged to catalyze change beyond the initial research idea. Participation brings opportunities to move from individual knowledge to shared knowledge, and from personal to collective responsibility for the future of neighborhood landscapes. Yet, as this pilot shows, power dynamics and structures may be highly influential in mobilizing the collective, and thus strategic facilitation and trust-building are necessary. Schneidewind et al. (2016) called on scientists dealing with complex challenges to not only attempt to exogenously examine transformations, but for the goals of their research to be transformative: “[transformative science is] a specific type of science that does not only observe and describe societal transformation processes, but rather initiates and catalyzes them. Transformative science aims to improve our understanding of transformation processes and to simultaneously increase societal capacity to reflect on them” (p. 6). This project offers valuable insight into the inevitable challenges, setbacks, and failures a “green shift” toward more sustainable, ecologically informed landscape practices is bound to generate as well as practical, immediately implementable takeaways that can be useful to educators, policymakers, researchers, community leaders, and residents as they navigate the trouble waters of an uncertain future.
Data availability statement
The datasets presented in this study can be found in online repositories. The names of the repository/repositories and accession number(s) can be found at: https://original-ufdc.uflib.ufl.edu/IR00012031/00001.
Ethics statement
The studies involving humans were approved by University of Florida Institutional Review Board. The studies were conducted in accordance with the local legislation and institutional requirements. The participants provided their written informed consent to participate in this study.
Author contributions
CJS: Conceptualization, Data curation, Formal analysis, Investigation, Methodology, Project administration, Software, Supervision, Validation, Visualization, Writing – original draft, Writing – review & editing. LAW: Conceptualization, Data curation, Formal analysis, Funding acquisition, Investigation, Methodology, Project administration, Resources, Software, Supervision, Validation, Visualization, Writing – original draft, Writing – review & editing. JD: Conceptualization, Data curation, Formal analysis, Investigation, Methodology, Project administration, Software, Supervision, Validation, Visualization, Writing – original draft, Writing – review & editing. NT: Conceptualization, Data curation, Formal analysis, Methodology, Software, Validation, Visualization, Writing – original draft, Writing – review & editing. DR: Conceptualization, Validation, Writing – original draft, Writing – review & editing.
Funding
The author(s) declare that financial support was received for the research, authorship, and/or publication of this article. This study was partially funded through a partnership with the Southwest Florida Water Management District and the University of Florida.
Acknowledgments
The authors of this study would like to acknowledge the Southwest Florida Water Management District and the Hunter’s Green Homeowner Association for their partnership in implementing this project and supporting efforts to increase outdoor water conservation.
Conflict of interest
The authors declare that the research was conducted in the absence of any commercial or financial relationships that could be construed as a potential conflict of interest.
Publisher’s note
All claims expressed in this article are solely those of the authors and do not necessarily represent those of their affiliated organizations, or those of the publisher, the editors and the reviewers. Any product that may be evaluated in this article, or claim that may be made by its manufacturer, is not guaranteed or endorsed by the publisher.
References
Abrash Walton, A., Nageotte, N. L., Heimlich, J. E., and Threadgill, A. V. (2022). Facilitating behavior change: introducing the Transtheoretical model of behavior change as a conservation psychology framework and tool for practitioners. Zoo Biol. 41, 386–397. doi: 10.1002/zoo.21704
Armitage, C. J., Sheeran, P., Conner, M., and Arden, M. A. (2004). Stages of change or changes of stage? Predicting transitions in Transtheoretical model stages in relation to healthy food choice. J. Consult. Clin. Psychol. 72, 491–499. doi: 10.1037/0022-006X.72.3.491
Ary, D., Jacobs, L. C., Irvine, C. K. S., and Walker, D. (2019). Introduction to research in education. 10th Edn. Boston, MA: Cengage Learning.
Bates, B., Kundzewicz, Z., and Wu, S. (2008). Climate change and water: intergovernmental Panel on Climate Change Secretariat. Available at: https://archive.ipcc.ch/pdf/technical-papers/climate-change-water-en.pdf
Bichsel, C. (2011). Liquid challenges: contested water in Central Asia. Available at: https://digitalcommons.wcl.american.edu/cgi/viewcontent.cgi?article=1495&context=sdlp
Boretti, A., and Rosa, L. (2019). Reassessing the projections of the world water development report. Npj Clean Water 2:1. doi: 10.1038/s41545-019-0039-9
Cardenas-Lailhacar, B., Dukes, M. D., and Miller, G. L. (2008). Sensor-based automation of irrigation on bermudagrass, during wet weather conditions. J. Irrig. Drain. Eng. 134, 120–128. doi: 10.1061/(ASCE)0733-9437(2008)134:2(120)
Carrico, A. R., and Riemer, M. (2011). Motivating energy conservation in the workplace: an evaluation of the use of group-level feedback and peer education. J. Environ. Psychol. 31, 1–13. doi: 10.1016/j.jenvp.2010.11.004
Catalano, A. S., Lyons-White, J., Mills, M. M., and Knight, A. T. (2019). Learning from published project failures in conservation. Biol. Conserv. 238:108223. doi: 10.1016/j.biocon.2019.108223
Clarke, W., and Freedman, M. (2019). The rise and effects of homeowners associations. J. Urban Econ. 112, 1–15. doi: 10.1016/j.jue.2019.05.001
Creswell, J. W., and Plano Clark, V. L. (2018). Designing and conducting mixed methods research. 3rd Edn. Thousand Oaks, CA: Sage Publications.
Dillman, D. A., Smyth, J. D., and Christian, L. M. (2009). Internet, mail, and mixed-mode surveys: The tailored design method. 3rd Edn. Toronto, Canada: Wiley and Sons.
Doran, E. M. B., Doidge, M., Aytur, S., and Wilson, R. S. (2022). Understanding farmers’ conservation behavior over time: a longitudinal application of the transtheoretical model of behavior change. Enviro. Manag. 323:116136. doi: 10.1016/j.jenvman.2022.116136
Economic Research Service (2024). Rural-urban continuum codes. Washington, DC: United States Department of Agriculture.
Fava, J. L., Velicer, W. F., and Prochaska, J. O. (1995). Applying the transtheoretical model to a representative sample of smokers. Addict. Behav. 20, 189–203. doi: 10.1016/0306-4603(94)00062-x
Fielding, K. S., Russell, S., Spinks, A., and Mankad, A. (2012). Determinants of household water conservation: the role of demographic, infrastructure, behavior, and psychosocial variables. Water Resour. Res. 48:10. doi: 10.1029/2012WR012398
Finger, M. (1994). From knowledge to action? Exploring the relationships between environmental experiences, learning, and behavior. J. Soc. Issues 50, 141–160. doi: 10.1111/j.1540-4560.1994.tb02424.x
Freivogel, C., Lehmann, S. H., and Visschers, V. H. M. (2022). Tailoring can improve consumers’ hygienic food-handling behavior to reduce the transmission risk of antimicrobial-resistant bacteria through food. Eur. J. Investig. Health Psychol. Educ. 12, 169–192. doi: 10.3390/ejihpe12020014
Grabow, G. L., Ghali, I. E., Huffman, R. L., Miller, G. L., Bowman, D., and Vasanth, A. (2013). Water application efficiency and adequacy of ET-based and soil moisture–based irrigation controllers for turfgrass irrigation. J. Irrig. Drain. Eng. 139, 113–123. doi: 10.1061/(ASCE)IR.1943-4774.0000528
Grimley, D., Prochaska, J. O., Velicer, W. F., Blais, L. M., and DiClemente, C. C. (1994). “The transtheoretical model of change” in Changing the self: Philosophies, techniques, and experiences. eds. T. M. Brinthaupt and R. P. Lipka (Albany, NY: State University of New York Press), 201–227.
Guppy, L., and Anderson, K. (2017). Water Crisis Report. Hamilton, Canada: United Nations University Institute for Water.
Gusto, C., Silvert, C., Diaz, J. M., and Warner, L. A.. (2021). Pre-survey data report: Rainfall signage to reduce irrigation. Available at: https://ufdcimages.uflib.ufl.edu/IR/00/01/15/64/00001/SWFWMD%20Pre%20Survey%20Report_Final.pdf
Hassell, T., and Cary, J. (2007). Promoting behavioural change in household water consumption: Literature review. Available at: https://www.waterwise.org.uk/wp-content/uploads/2018/02/Smart-Water-2007_Promoting-Behavioural-Change-in-Household-Water-Consumption.pdf
Hayden, L., Cadenasso, M. L., Haver, D., and Oki, L. R. (2015). Residential landscape aesthetics and water conservation best management practices: homeowner perceptions and preferences. Landsc. Urban Plan. 144, 1–9. doi: 10.1016/j.landurbplan.2015.08.003
Heimlich, J. E., and Ardoin, N. M. (2008). Understanding behavior to understand behavior change: a literature review. Environ. Educ. Res. 14, 215–237. doi: 10.1080/13504620802148881
Hilaire, R. S., Arnold, M. A., Wilkerson, D. C., Devitt, D. A., Hurd, B. H., Lesikar, B. J., et al. (2008). Efficient water use in residential urban landscapes. Hortic. Sci. 43, 2081–2092. doi: 10.21273/HORTSCI.43.7.2081
Hunter’s Green Master . (2024). Welcome to Your Online Community. Available at: https://huntersgreen.com
Kania, J., Kramer, M., and Senge, P. (2018). The water of systems change. Available at: https://www.fsg.org/publications/water_of_systems_change
Knowles, M. S., Holton, E. F. III, and Swanson, R. A. (2015). The adult learner: The definitive class in adult education and human resource development. 8th Edn. Milton Park, England: Routledge.
Kollmuss, A., and Agyeman, J. (2002). Mind the gap: why do people act environmentally and what are the barriers to pro-environmental behavior? Environ. Educ. Res. 8:3. doi: 10.1080/1350462022014540
Larson, K. L., Lerman, S. B., Nelson, K. C., Narango, D. L., Wheeler, M. M., and Groffman, P. M. (2022). Examining the potential to expand wildlife-supporting residential yards and gardens. Landsc. Urban Plan. 222:104396. doi: 10.1016/j.landurbplan.2022.104396
Lincoln, Y. S., and Guba, E. G. (1985). Naturalistic inquiry, vol. 9. 1st Edn. Thousand Oaks, CA: Sage Publications, 438–439.
Locke, D. H., Roy Chowdhury, R., Grove, J. M., Martin, D. G., Goldman, E., Rogan, J., et al. (2018). Social norms, yard care, and the difference between front and back yard management: examining the landscape mullets concept on urban residential lands. Soc. Nat. Resour. 31, 1169–1188. doi: 10.1080/08941920.2018.1481549
Martini, N. F., Nelson, K. C., and Dahmus, M. E. (2014). Exploring homeowner diffusion of yard care knowledge as one step toward improving urban ecosystems. Environ. Manag. 54, 1223–1236. doi: 10.1007/s00267-014-0368-x
McCready, M. S., Dukes, M. D., and Miller, G. L. (2009). Water conservation potential of smart irrigation controllers on St Augustinegrass. Agric. Water Manag. 96, 1623–1632. doi: 10.1016/j.agwat.2009.06.007
McKenzie-Mohr, D., Lee, N. R., Schultz, P. W., and Kotler, P. (2012). Social marketing to protect the environment. Thousand Oaks, CA: Sage Publications.
McKenzie-Mohr, D., and Schultz, P. W. (2014). Choosing effective behavior change tools. Soc. Mark. Q. 20, 35–46. doi: 10.1177/1524500413519257
Morse, J. (2003). “Principles of mixed methods and multimethod research design” in Handbook of mixed methods in social and behavioral research. eds. A. Tashakkori and C. Teddlie (Thousand Oaks: Sage Publications), 189–208.
Nehme, E. K., Pérez, A., Ranjit, N., Amick, B. C., and Kohl, H. W. (2016). Behavioral theory and transportation cycling research: application of diffusion of innovations. J. Transp. Health 3, 346–356. doi: 10.1016/j.jth.2016.05.127
Newberry, M. G., and Israel, G. D. (2017). Comparing two web/mail mixed-mode contact protocols to a unimode mail survey. Field Methods 29, 281–298. doi: 10.1177/1525822X17693804
Niche . (n.d.). Hunters Green. Available at: https://www.niche.com/places-to-live/n/hunters-green-tampa-fl/
Ozan, L. A., and Alsharif, K. A. (2013). The effectiveness of water irrigation policies for residential turfgrass. Land Use Policy 31, 378–384. doi: 10.1016/j.landusepol.2012.08.001
Postel, S. (1999). Pillar of sand: Can the irrigation miracle last. New York: WW Norton and Company.
Postel, S. L. (2000). Entering an era of water scarcity: the challenges ahead. Ecol. Appl. 10, 941–948. doi: 10.1890/1051-0761(2000)010[0941:EAEOWS]2.0.CO;2
Prochaska, J. O. (2008). Decision making in the transtheoretical model of behavior change. Med. Decis. Mak. 28, 845–849. doi: 10.1177/0272989X08327068
Prochaska, J. O., and DiClemente, C. C. (1983). Stages and processes of self-change in smoking: toward an integrative model of change. J. Consult. Clin. Psychol. 51, 390–395. doi: 10.1037/0022-006X.51.3.390
Richter, B. D., Bartak, D., Caldwell, P., Davis, K. F., Debaere, P., Hoekstra, A. Y., et al. (2020). Water scarcity and fish imperilment driven by beef production. Nat. Sustain. 3, 319–328. doi: 10.1038/s41893-020-0483-z
Schneidewind, U., Singer-Brodowski, M., Augenstein, K., and Stelzer, F. (2016). Pledge for a transformative science: A conceptual framework. Wuppertal: Wuppertal Institut für Klima.
Silvert, C. J., Gusto, C., Warner, L. A., Diaz, J. M., and Mallinger, R. E. (2023). How can residents protect and promote pollinators? The diffusion of residential pollinator-friendly gardening. Environ. Manag. 345:118877. doi: 10.1016/j.jenvman.2023.118877
Steg, L., and Vlek, C. (2009). Encouraging pro-environmental behaviour: an integrative review and research agenda. J. Environ. Psychol. 29, 309–317. doi: 10.1016/j.jenvp.2008.10.004
Still, B., and Crane, K. (2017). Fundamentals of user-centered design: A practical approach. 1st Edn. Boca Raton, FL: CRC press.
Strauss, A. L. (1987). Qualitative analysis for social scientists. Cambridge, UK: Cambridge University Press.
Stravinsky, I. (2000). Writing the wrongs: developing a safe-fail culture in conservation. Conserv. Biol. 14, 1567–1568. doi: 10.1111/j.1523-1739.2000.01461.x
Sunderland, T., Sunderland-Groves, J., Shanley, P., and Campbell, B. (2009). Bridging the gap: how can information access and exchange between conservation biologists and field practitioners be improved for better conservation outcomes? Biotropica 41, 549–554. doi: 10.1111/j.1744-7429.2009.00557.x
Survis, F. D. (2016). Beyond water restrictions: Informing effective lawn watering behavior. Boca Raton, FL: Florida Atlantic University.
Suvedi, M., and Kaplowitz, M. (2016). What every extension worker should know. Available at: https://meas.illinois.edu/wp-content/uploads/2015/04/MEAS-2016-Extension-Handbook-Suvedi-Kaplowitz-2016_02_15.pdf
Swanson, B.E., and Rajalahti, R. (2010). Strengthening agricultural extension and advisory systems: procedures for assessing, transforming, and evaluating extension systems. Agriculture and rural development discussion paper no. 45. World Bank.
Turner, V. K., and Stiller, M. (2020). How do homeowners associations regulate residential landscapes? An analysis of rule structure and content in Maricopa County (AZ). J. Am. Plan. Assoc. 86, 25–38. doi: 10.1080/01944363.2019.1665474
UNESCO World Water Program . (2022). The United Nations world water development report. Available at: https://unesdoc.unesco.org/ark:/48223/pf0000380721
United Nations Water . (2012). Managing water under uncertainty and risk: the United Nations world water development report 2012. Available at: https://www.unwater.org/publications/un-world-water-development-report-2012
United States Census Bureau . (n.d.). Hillsborough County, Florida. Available at: https://data.census.gov/profile/Hillsborough_County,_Florida?g=050XX00US12057
Ward, R. M., Velicer, W. F., Rossi, J. S., Fava, J. L., and Prochaska, J. O. (2004). Factorial invariance and internal consistency for the decisional balance inventory—short form. Addict. Behav. 29, 953–958. doi: 10.1016/j.addbeh.2004.02.042
Warner, L. A., Diaz, J. M., and Kalauni, D. (2023). Turning off landscape irrigation when rainfall is adequate: what distinguishes intenders from nonintenders? Urban Water J. 20, 223–234. doi: 10.1080/1573062X.2022.2155855
Warner, L. A., and Lamm, A. J. (2017). Understanding residential irrigation users to target water conservation extension programs. J. Ext. 55:3. doi: 10.34068/joe.55.03.11
Keywords: participatory research, planned community, project failures, rainfall, residential landscape, urban, water conservation
Citation: Silvert CJ, Warner LA, Diaz J, Taylor N and Ruggeri D (2024) A call for water conservation research interventions informed by community engagement and input: “There was no going back after my trust in it turned”. Front. Water. 6:1395414. doi: 10.3389/frwa.2024.1395414
Edited by:
Oliver Hensengerth, Northumbria University, United KingdomReviewed by:
Catherine Sanders, North Carolina State University, United StatesAnne-Lise Boyer, UMR5600 Environnement, Ville, Societe (EVS), France
Cat Button, Newcastle University, United Kingdom
Copyright © 2024 Silvert, Warner, Diaz, Taylor and Ruggeri. This is an open-access article distributed under the terms of the Creative Commons Attribution License (CC BY). The use, distribution or reproduction in other forums is permitted, provided the original author(s) and the copyright owner(s) are credited and that the original publication in this journal is cited, in accordance with accepted academic practice. No use, distribution or reproduction is permitted which does not comply with these terms.
*Correspondence: Colby J. Silvert, Y3NpbHZlcnRAdW1kLmVkdQ==
 Colby J. Silvert
 Laura A. Warner
 John Diaz2
 Nicholas Taylor

