 Yoseph M. Tessema1†
 Fasikaw A. Zimale
94% of researchers rate our articles as excellent or good
Learn more about the work of our research integrity team to safeguard the quality of each article we publish.
Find out more
ORIGINAL RESEARCH article
Front. Water , 17 April 2024
Sec. Water and Hydrocomplexity
Volume 6 - 2024 | https://doi.org/10.3389/frwa.2024.1387915
This article is part of the Research Topic Climate, Water and Land in Africa: Research Trends and Challenges View all 8 articles
Reservoir sedimentation is a significant issue that shortens reservoir life and impacts operations such as irrigation, hydropower, and drinking water supply because it significantly reduces the reservoir’s initial capacity. Information on changes in the storage capacity is required to reduce the risk of reservoir sustainability. This study was conducted on the Angereb reservoir in the sub-humid region of Ethiopia, in the Upper Blue Nile Basin. Bathymetric surveys and ArcGIS 10.8 were used to estimate the sedimentation and service life of the Angereb reservoir. A Triangulated Irregular Network (TIN) surface was developed from the survey data to estimate the volume of the reservoir. Based on the findings of this bathymetry a total of 2.18 Mm3 of sediment was deposited on the reservoir bed between 2007 to 2022. Storage capacity was decreased by 62.28% in 16 years of operation and caused an average annual volume reduction of 3.9%. The sediment yield (SY) and specific sediment yield (SSY) of the Angereb watershed revealed 192715.5 and 170312.5 m3 year−1 and 3043.2 and 2689.4-ton km−2 y−1 for trap efficiencies of 70.1 and 80% calculated with two methods, respectively. The SSY has increased by about 50.3% to the minimum and 70.1% to the maximum indicating more degradation of the watershed in sixteen years. The gross storage capacity loss of the reservoir was about 75% which was 5.3 Mm3 in 1997 and reduced to 1.32 Mm3 in 2022 with an annual reduction of 2.9% in storage capacity. The reservoir will be filled up by sediment in 7 years if the incoming sediment remains the same in the future. These findings will serve as a call for action in the watershed and a foundation for managing the accumulated sedimentation in the Angereb reservoir and for developing sediment control and management strategies for similar reservoirs.
The natural conditions of a stream or river change when a barrier is built, thereby creating a reservoir. This lower flow velocity encourages slow sediment deposition in the inflowing waters. Increased sedimentation leads to a continuous deposition of sediment in reservoirs, which results in several issues, including the degradation of water quality, diminished storage capacity, increased flood risks, interruptions in hydropower generation, and reduced water supply (Dutta et al., 2016; Elsahabi et al., 2018). According to Issa et al. (2015), sedimentation reduces reservoir capacity by 0.4–2.0% of the world’s reservoir area per year, whereas the sediment deposition rate varies from 0.1 to 2.3% for large dams globally (Rashid et al., 2015). Reservoirs can serve several functions such as domestic water supply, irrigation, flood control, and hydropower. However, it is susceptible to sediment build-up because of erosion in upland watersheds.
Reservoir sedimentation is a process in which sediments are delivered to a dam or reservoir by streams (Kothyari and Jain, 2000). It is a widespread occurrence that has recently been recognized as a significant environmental risk (Adongo et al., 2020; Ayele et al., 2021). For example, recent studies indicated sediment deposition accounts for loss of reservoir storage of 0.22–0.68% in the USA, 0.65% in Europe, and 0.83–2.3% in China (Schleiss et al., 2016, Panagos et al., 2024). According to Randle et al. (2021), reservoir capacity per capita has shrunk by over 35% in the last 50 years in the USA, likely due to both sediment buildup and population growth. Sediment deposition in reservoirs is a critical downstream effect of soil erosion that affects the long-term sustainability of dams constructed for various purposes in Ethiopia (Froehlich et al., 2017; Bachiller et al., 2019; Iradukunda and Bwambale, 2021).
To effectively manage freshwater resources, it is crucial to analyze sediment deposition and reservoir storage capacity. Sediments that settle on reservoir beds are always carried by surface runoff water entering dams (Ikhar et al., 2018). To emphasize this and warn decision-makers to take precautions in advance, it is crucial to understand and assess the rate of deposition in reservoirs. However, frequent sedimentation assessments and the decline in storage capacity can be made with the aid of periodic reservoir capacity surveys (Foteh et al., 2018). As a result of inadequate implementation of reservoir management techniques, such as sediment routing, regular sediment flushing, and catchment management aimed at minimizing soil erosion, the accumulation of sediments in reservoirs has become an inescapable issue. This problem has steadily escalated, impacting numerous nations globally (Adongo et al., 2021; Michalec and Cupak, 2021).
Situated in the northwestern region of Ethiopia, close to the city of Gondar, Angereb Dam primarily serves the purpose of providing water to the city. Gondar City relies on two primary water supply sources: surface water from the Angerb reservoir and groundwater from multiple wells in the Kolladiba and Angereb Valley fields. Unfortunately, the river supply is dwindling over time due to reservoir capacity loss, and the significant declines in yield from groundwater sources. The present water requirement for the city stands at 35,103 m3/day (equivalent to 406.3 L/s). Yet, the total water production capacity from the Angereb dam and the two well fields amounts to only 11,467 m3/day (which translates to 132.7 L/s). This signifies a shortfall of 67.4% compared to the needed water volume (MS Consultant, 2023).By Ethiopian standards, the town is recognized for its persistent issue of inadequate potable water supply. Sedimentation poses a threat to the reservoir’s longevity. Thus, it is imperative to establish a sediment management plan tailored to the unique social, economic, environmental, and technical characteristics of Ethiopia in general and the study area. While constructing new reservoirs, designers have employed various strategies to address sedimentation issues. However, the absence of a comprehensive local database on sediment yield and adaptable sediment yield models has presented a challenge (Haregeweyn et al., 2006). Typically, in Ethiopia designers have relied on sediment yield estimates ranging from 800 to 1,200 t km−2 year−1, as reported in numerous technical publications, though the data source remains unspecified. This has led to the development of dams that may pose risks. Previous studies focusing primarily on northern Ethiopia have highlighted significant spatial variations in sediment yield within that region (Haregeweyn et al., 2008; Tamene et al., 2006; Vanmaercke et al., 2010). Consequently, it proves challenging to extend sediment yield statistics from one watershed or area to another reservoir design. Additionally, there exists no standard erosion rate for a given region, as soil erosion is contingent on the scale of observation. The actual sediment output is shaped by a range of environmental factors and dynamic erosion processes (Walling, 1983; De Vente et al., 2007). This research will narrow the gaps specified above.
The primary aim of this study was to assess sedimentation levels in the Angereb reservoir, achieved through a bathymetric survey. In pursuit of this objective, the analysis addressed three key research questions: What is the quantity of sediment deposited in the past operational year? How much does sedimentation reduce storage capacity? What is the sediment yield in the Angereb reservoir watershed? Consequently, by mitigating both soil erosion and the transport of sediment from the upland watershed, it becomes feasible to curtail the influx of sediment into reservoirs. This proves vital for prioritizing watershed conservation efforts and minimizing the socio-economic and environmental costs associated with sedimentation in various water supply, irrigation, and hydropower reservoirs (Palmieri et al., 2001; Hurni et al., 2015).
In Ethiopia, there has been limited research conducted using bathymetric surveys to assess sediment accumulation in reservoirs. The country’s endeavors to safeguard its land and water resources have faced challenges (Haregeweyn et al., 2012). Consequently, soil erosion has emerged as a significant concern, with a substantial portion of eroded soil particles finding their way into reservoirs (Mitiku and Karl Herweg, 2006). This has led to a notable issue: many dams constructed in Ethiopia in recent years have become silted up with sediment, rendering them ineffective for their intended purposes (Moges et al., 2018). This situation implies that the future utility of small dams may be severely compromised without established sedimentation monitoring practices.
Bathymetric surveys offer engineers, managers, and regulators a valuable tool for estimating reservoir quantities and surface areas, providing them with accurate information on water availability (Furnans and Austin, 2008). Conducting surveys of the reservoir on multiple dates allows for comparisons and predictions of sediment accumulation rates (Dunbar et al., 1999; Tamene et al., 2006; Furnans and Austin, 2008). In 2005 and 2007, bathymetric studies were carried out to assess sedimentation levels in Angereb Reservoir. However, there had been no prior use of the bathymetry survey method for evaluating reservoir sedimentation in the preceding 16 years, leading to uncertainty about the current capacity of the Angereb reservoir. This study will quantify the sediment yield of the Angereb watershed and estimate the remaining life of the reservoir to scientifically understand and manage the reservoirs health. The findings will aid in filling the gaps by identifying issues with the structures’ long-term viability and proper operation and outline physically feasible management options with the context of the local condition to extend the life of the reservoir.
The Angereb earthen dam, situated on the eastern edge of Gondar town, northwestern Ethiopia, along the Angereb River, was constructed in 1997. At full capacity (water level at 2,135 m above sea level), the reservoir covers a total area of 38.78 hectares. The dam crest spans 871 meters, and initially, the reservoir is designed to hold a total capacity of 5.28 Mm3. The intake at the reservoir is crucial for supplying water to the treatment plant. It consists of a reinforced concrete platform where the pumps are mounted. Previously, the intake suction pipe was positioned 10.05 meters below the spillway crest level in the intake tower, but sediment accumulation caused operational issues, prompting the pumps to be raised for cleaner water extraction. At present, the lowest point of the intake suction pipe sits at 5.34 meters below the spillway crest level as recommended by Haregeweyn et al. (2012). Additionally, there is a bottom outlet located at an elevation of 2,119 meters above sea level, equipped with a 600 mm diameter pipe beneath the dam for reservoir flushing. It was reported that sediment accumulation had buried the outlet, leading to pipe blockage before 2007 (Haregeweyn et al., 2012). However, later on the water supply office managed to open the bottom outlet to flush out some water. From personal communications with the Gondar Town Water supply office technical people, the bottom outlet is opened when the first flush flood starts and will be stopped when the overflow over the spill way stops. The existing spillway is an ogee type weir 15 m long with a rectangular channel of 140 m. It discharges a design flow of 60 m3/s with 1.50 m head and 1.50 m freeboard.
The watershed of the reservoir spans between 37°25′ 00′′E and 37°31′ 00′′E longitude and 12°00′00′′N and 12°34′ 00′′N latitude, covering a total area of 6,757 hectares. The Angereb river originates from Lay Armacheho area in the upper catchment of Megech river and traverses through a varied terrain characterized by plains and hills, forming a fan-shaped pattern. The slope of the watershed varies between 10 and 30% across approximately 36.5% of its watershed, with gentler gradients ranging between 3 and 10% elsewhere. Dominated by chains of hills interspersed with steep mountainous ridges, the primary landform of the watershed features ridges oriented east–west, sloping towards the south (Zeleke et al., 2013). Characterized by a dendritic drainage pattern, the watershed encompasses extensive cultivation, with approximately 70% of the area under agricultural use (Desta, 2010). Vegetation, comprising sparse shrubs and bushes of limited economic value, has been subject to prolonged overexploitation, rendering it insufficient for erosion protection. Underlain by Ashengi Group sedimentary rocks, dating from the Paleocene to Miocene periods, the watershed exhibits basaltic flows deeply eroded, with limited permeability as water primarily moves through fractures. Soil units are eutric cambisols, except at higher elevations, where differences occur. Human activities, such as settlement and vegetation clearance for cultivation, have led to substantial deforestation in most of the areas. Numerous small streams and springs contribute to the Angereb River, eventually merging with the Megech River. The region experiences significant rainfall, resulting in high runoff levels during the wet season and lean flows during the dry season (Figure 1).
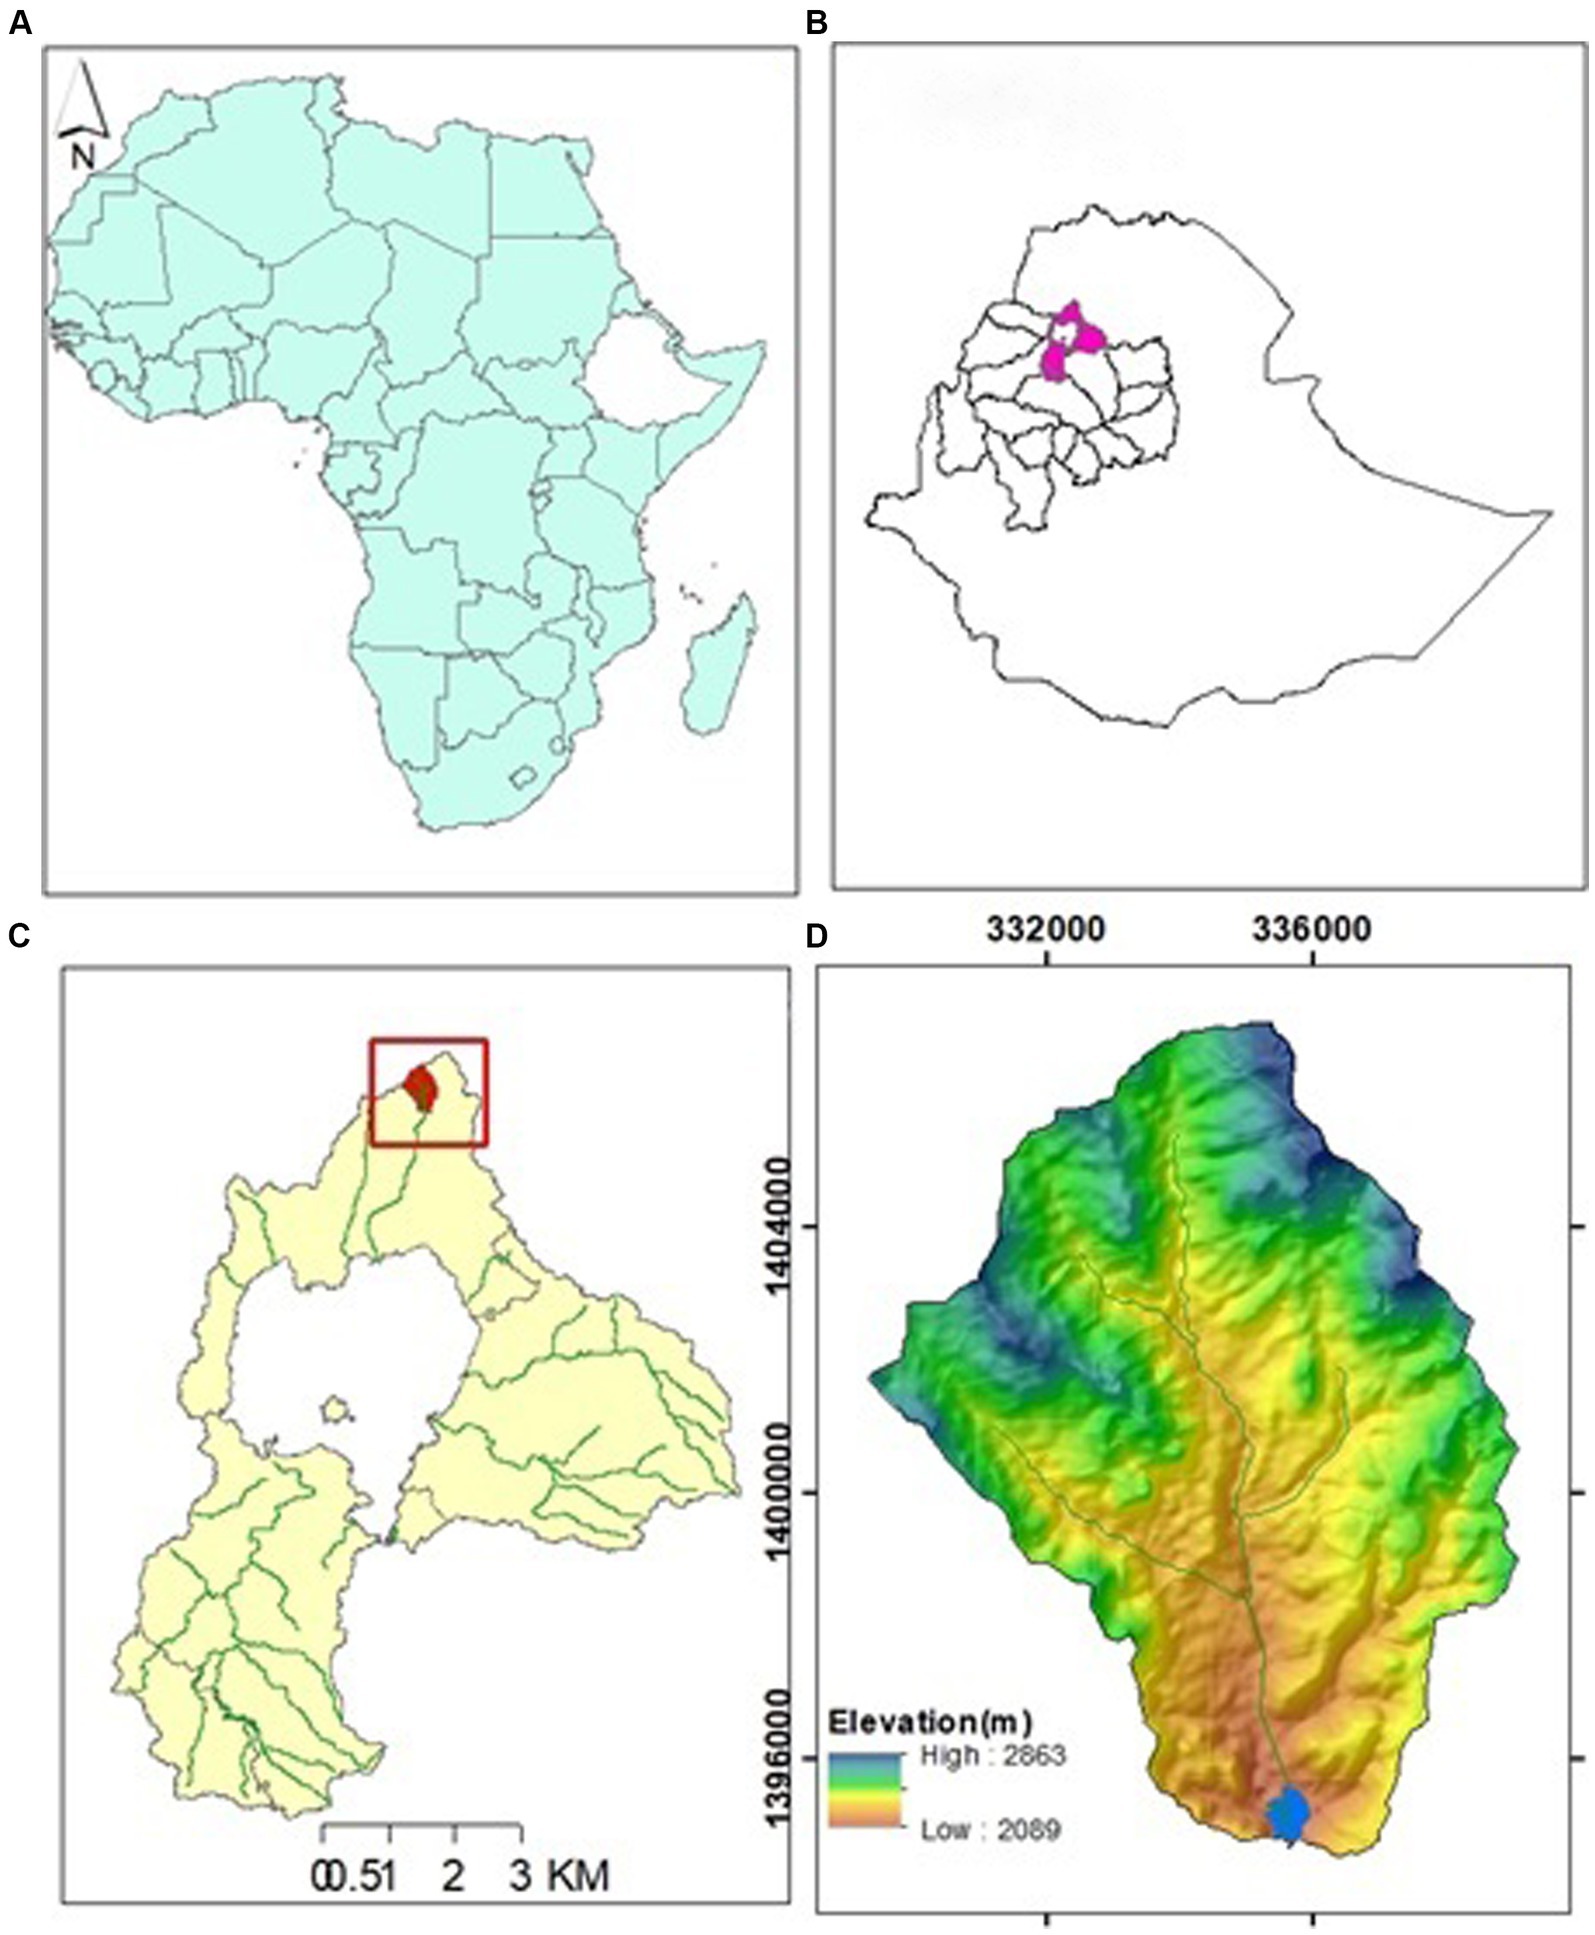
Figure 1. Location map of the study area: (A) Map of Africa indicating the location map of Ethiopia, (B) Upper Blue Nile and Lake Tana Basin, super imposed on the Ethiopian map (C) Angerb watershed super imposed in Lake Tana Basin, (D) Angerb dam and topography of the watershed.
Conducting a bathymetry survey involves using specialized equipment and techniques to precisely measure the depth of a reservoir’s bed beneath the water’s surface. In this survey, a digital SONAR device, specifically a Garmin GPS Map 421S single beam echo sounder with dual-frequency 200 kHz, was employed for depth measurement and recording coordinates. A motorboat served as the primary mode of transportation and spatial analysis was conducted using ArcGIS 10.8 software. Measurement tools such as a flexible meter and a graduated metal plate were utilized for accurate depth readings, particularly in areas where the boat could not run the motor due to shallow water depths. Safety was ensured by wearing life jackets.
The echo sounder used in this study was previously calibrated for the bathymetric survey of Lake Tana (Kebedew et al., 2020). Therefore, the accuracy of the readings from the echo sounder in this survey was checked with depth measured with both the graduated metal and echo sounder. To this end, during the bathymetric survey, approximately twenty water depth samples were measured at shallower depths (<4 m). To assess the precision of these measurements, the root mean square error (RMSE) was calculated using the following equation:
In the above equation, RMSE represents the root mean square error of the vertical component (Z). ‘n’ stands for the number of measured points, while Zm and Zs denote the depth readings obtained through the graduated metal plate and Echo sounder, respectively. As per Eq. 1, the RMSE for the measured water depths was determined to be 0.078 meters. Following the guidelines from National Digital Elevation Program (NDEP) (2004), the vertical accuracy estimate at the 95 percent confidence level was derived by multiplying the RMSE by a factor of 1.96, resulting in a value of 0.152 meters. This level of error was considered acceptable by both National Digital Elevation Program (NDEP) (2004) and Sekellick and Banks (2010).
The bathymetric survey was carried out when the reservoir was at full supply level, employing grid spacing ranging from 15 to 20 meters. The data was collected between September 2, 2022, and September 5, 2022, and a total of 2,687 sample points were collected (refer to Figure 2). To ensure accuracy and consistency, the spillway crest level served as the benchmark. The water surface elevation below the spillway crest level was measured daily before each survey and utilized as the reference to calculate reservoir bed elevations. To minimize the influence of wave height on water depth assessment using the echo sounder, the survey was conducted under calm environmental conditions. Additional secondary data from previous bathymetric surveys of 2004 and 2007 were acquired from Gondar city water supply and sanitation service office.

Figure 2. Bathymetric survey points in Angereb reservoir in 2022.
A total of eight undisturbed soil samples, known for their volume, were extracted from various locations within the reservoir area. These samples were collected during the reservoir drawdown period, specifically on May 17, 2023, when the water level was at its lowest. The selection of sampling points and the number of samples taken account spatial distribution of sediment within the reservoir. Regrettably, it was not feasible to obtain undisturbed samples from certain central sections of the reservoir due to the lack of necessary equipment. The soil samples were collected to a maximum depth of 0.3 meters for subsequent analysis of dry density in the laboratory. The spatial distribution of these soil sample points is illustrated in Figure 3 and Table 1.
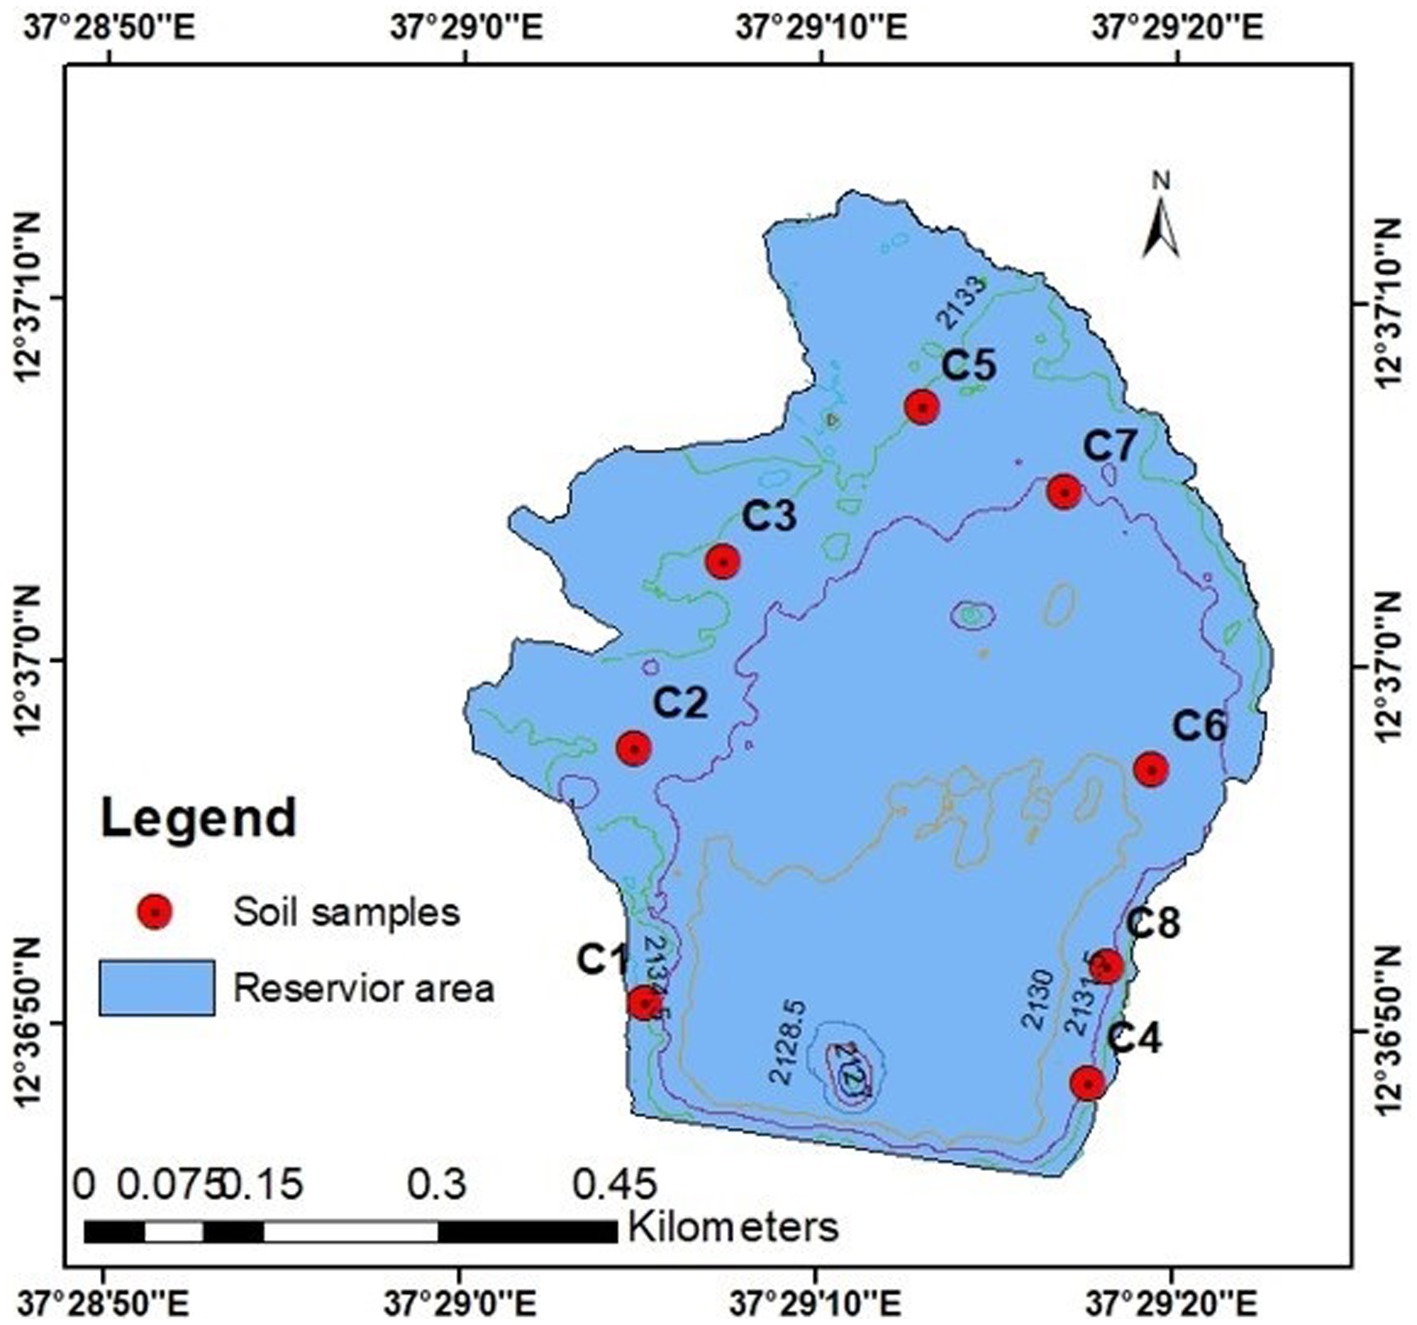
Figure 3. Soil sample location for estimation of dry bulk density in the Angereb reservoir.
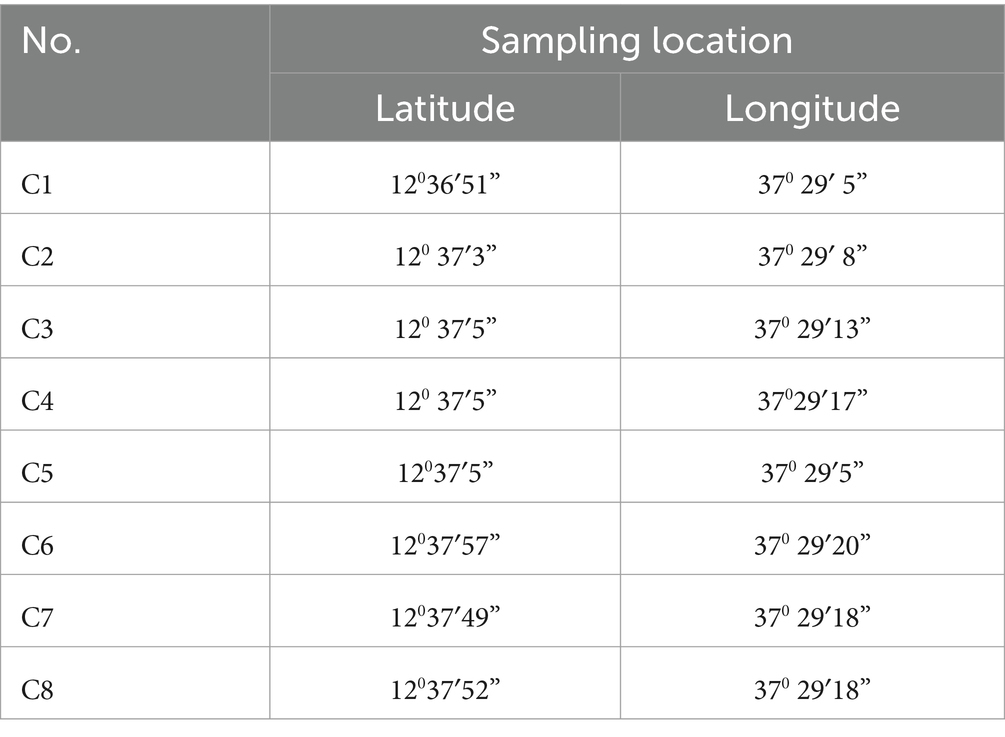
Table 1. Soil sample Angereb reservoir.
In this study, spatial interpolation techniques are employed to generate continuous surfaces from point data derived from depth recordings (Sterling, 2003). Geo-statistical analyst tool that is available in Arc-GIS 10.8 was utilized. Geostatistical data analysis is crucial to maximize the utility of observed data and to estimate depth parameters in other locations. The selected interpolation techniques, including Kriging, Inverse Distance Weighting (IDW), Local Polynomial Interpolation (LPI), and Radial Base Function (RBF), were chosen due to their routine application in bathymetric data interpolation and their widespread usage in the literature (Sterling, 2003). For each dataset, the interpolation method demonstrating the lowest Root Mean Square Error (RMSE) (Eq. 3) and Mean Absolute Error (MAE) (Eq. 2) was deemed the most suitable, following the approach outlined by Sterling (2003). The effectiveness of spatial interpolation methods was also assessed using the coefficient of determination (R2) value.
where n is the number of sample points, Dobs is the observed dataset, and Dint is the interpolated value.
To estimate reservoir sedimentation, the bathymetry data from 2005 and 2007, along with the new data collected in 2022, were imported and organized in Microsoft Excel. Subsequently, they were processed and analyzed using the 3D analyst tool within ArcMap. The Triangulated Irregular Network (TIN) map was generated from the survey data to calculate the reservoir’s storage capacity and water surface area. To determine the thickness of accumulated sediment, two periods of depths from bathymetry surveys in 2007 and 2022 were used. Raster layers were created using the TINs from 2007 and 2022 to know the spatial distribution of accumulated sediment in the reservoir. Using ArcMap’s Raster calculator tool, the 2022 reservoir bed elevation raster was subtracted from the 2007 reservoir bed elevation raster. The difference in raster layers represents sediment deposits in the reservoir during reservoir operation. The river centerline is also used in this study to assess the change in river bed profile. To do so, the river centerline from 2007 bathymetry surveys were interpolated from a raster map of 2007 and a raster map of 2022. Finally, longitudinal profiles were created using the 3D analysis tool in Arc GIS10.8. The use of cut/fill function within the 3D Analyst tool in Arc GIS software was used to show the net sediment deposition and net scouring of the Angereb reservoir in the last sixteen years.
Capturing the proportion of incoming silt that becomes deposited or trapped within the reservoir is referred to as trap efficiency (TE) (Verstraeten and Poesen, 2000). To accurately determine the average sediment production from contributing watersheds, it is necessary to account for the reservoir TE when calculating the volume of accumulated sediment. This helps prevent the underestimation of sediment deposition and takes into consideration material that may exit the reservoir. Various methods exist for calculating the trap efficiency of reservoirs (Verstraeten and Poesen, 2000). One of the most widely used empirical-based models for small and ungagged reservoirs is proposed by Brown (1943) and further elaborated by Verstraeten and Poesen (2000).
In the equation, C represents the reservoir storage capacity (in cubic meters), A stands for the catchment area (in square kilometers), and D is a constant with values ranging from 0.046 to 1, and a mean value of 0.1. It is important to note that the value of TE is contingent on the specific value of D, which itself is determined by sediment characteristics. Given the challenge in objectively defining a precise value for D, and considering the scarcity of available data, this study uses the average D value of 0.1 to determine sediment yield based on trap efficiency with Brown’s equation, as suggested by Tamene et al. (2006).
Another method most commonly used for determining the trap efficiency of reservoirs is Brune’s curve (Garg and Jothiprakash, 2008). Brune presented a set of envelope curves applicable to normal ponded reservoirs using the capacity-inflow relationship. Brune developed an empirical relationship between trap efficiency and the ratio of reservoir capacity to the annual inflow. Equations are developed based on the size of the sediments trapped. Based on visual observation of the particles of sediment taken for bulk density analysis for Angereb reservoir, particles are small-grained. Therefore, the equation for small-grained is selected for this reservoir. The equation for primarily colloidal and dispersed fine-grained sediments is shown below.
The initial few meters from the reservoir’s bottom to the bottom outlet, measured from the dam’s height, are designated as dead storage. This allocation is made during the planning stage to allow for silt accumulation without affecting the reservoir’s operation throughout its useful life. The determination of dead storage volume hinges on three key factors: (1) the projected sediment input from the watershed; (2) the intended lifespan of the reservoir; and (3) the potential for post-dam sediment management. The space above the dead storage level, available for utilization, is referred to as live storage. In this study, the reservoir’s anticipated remaining life was estimated based on the following equations:
In these equations, remaining life represents the anticipated lifespan of the reservoir till it gets full with sediment (in years), while the current total storage volume stands for the remaining storage volume computed from this bathymetric survey. Annual sediment volume signifies the sediment deposited per year (in cubic meters per year), which is determined using the following equation:
Where SR is the sedimentation rate per year, SV is the sediment volume (m3) that accumulated between two successive bathymetry surveys, and ∆T is the time interval between two successive reservoir surveys.
Sediment yield encompasses the entire sediment discharge from the watershed into the reservoir within a defined timeframe. This comprises both the silt retained within the reservoir and the sediment that flows out. This can be quantified in absolute measurements as sediment yield (SY; in cubic meters per year) or in area-specific terms as specific sediment yield (SSY; in metric tons per hectare per year) (Haregeweyn et al., 2012). These values are determined through calculations employing Eqs. 8, 9:
Where SY represents sediment yield (m3 per year), SV stands for the measured volumetric sediment silted in the reservoir (m3), TE denotes the sediment trap efficiency of the reservoir (%), A signifies the watershed area (km2), Y represents the time interval (years) between two successive bathymetric reservoir surveys, and SSY indicates the area-specific sediment yield (ton per hectare per year). DBD refers to the dry bulk density of the sediment deposit (ton per cubic meter). To enable a comparison of sedimentation rates across different reservoirs, the measured sediment volume (m3) must be converted to sediment mass (tons) using the dry bulk density (DBD) (Verstraeten and Poesen, 2000). The mean DBD for the reservoir was computed using the average DBD of the samples.
To decide the dry density of deposited sediment, eight sediment samples were collected with a ring core and dried for 24 h at 105°C at YOAB Soil and Material Laboratory. The average dry bulk density for the reservoirs was 1101.87 kg m−3 ranging from 1017.53 kg/m3 to 1199.45 kg/m3. By comparing the suggested dry mass density of the reservoirs with previous studies, an equal order of magnitude of dry mass density values were found. Haregeweyn et al. (2006) used the recommended dry bulk density of 1010.18–1,420 kg m−3 for reservoirs in northern Ethiopia.
Among the four interpolation techniques examined, the Local Polynomial Interpolation had the lowest MAE (0.222 m) from Eq. 2, RMSE (0.401 m) from (Eq. 3), and highest coefficient of correlation (R2 = 0.939). Due to its effectiveness and ability to produce a fair representation of the data, the local polynomial interpolation approach was selected for spatial interpolation as shown in Table 2.
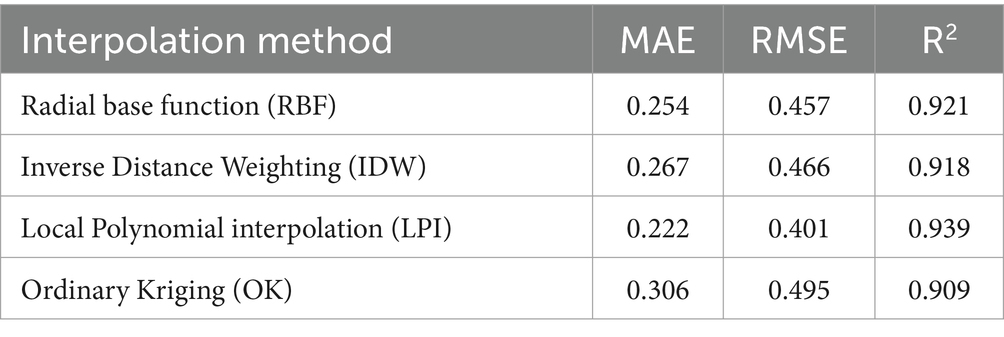
Table 2. Summary of interpolation accuracy analysis.
A raster map was created using the local polynomial interpolation method to create TIN surface maps from bathymetry survey elevation data. The primary input for creating a TIN surface map from a bathymetry survey was this raster map as illustrated in Figure 4.

Figure 4. Distribution of reservoir depth from raster map of the 2022 survey data.
The reservoir area covers 21.62 ha within a depth range between 4 to 6 m and 16.51 ha covers 0–4 m and a small area of the reservoir has a depth of between 6 to 12.8 m covering an area of 0.66 ha as shown in Figure 4 and Table 3. The deepest depth reading within the reservoir was 12.1 m near the dam axis around the dam outlet. 42.56% of the reservoir covers a depth of 0–4 m.
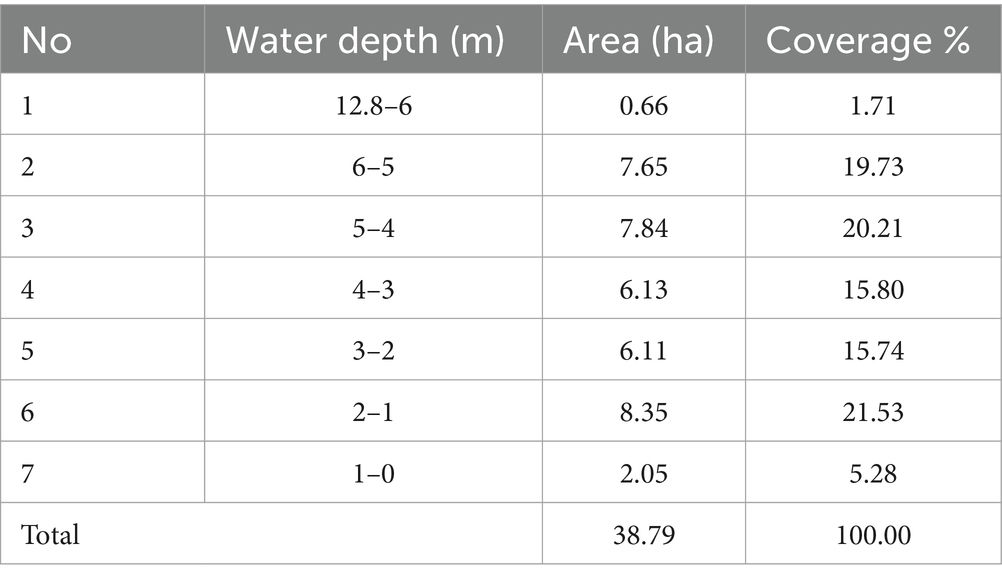
Table 3. Summary of reservoir elevation in terms of area coverage.
The reservoir area and volume were calculated using the TIN surface created from the bathymetric survey points. The reservoir bed surface is represented digitally by the TIN surface, which is composed of randomly distributed nodes produced from contour lines and point measurements with 3D coordinates (x, y, and z) that are organized into a network of non-overlapping triangles (Gopal and Rao, 2016). Raster maps of both the 2007 and 2022 bathymetric surveys are developed from the TIN maps and further calculations of sediment thickness (depth) are based on it.
Due to sediment buildup, which alters the Elevation-area-capacity curves, reservoirs’ storage capacity steadily decreases. For those who plan, create, and manage dams, these curves are crucial. Water surface area and storage capacity as a function of water elevation were calculated using the TIN for the surveys conducted in 2005, 2007, and 2022. The results are shown Figure 5.
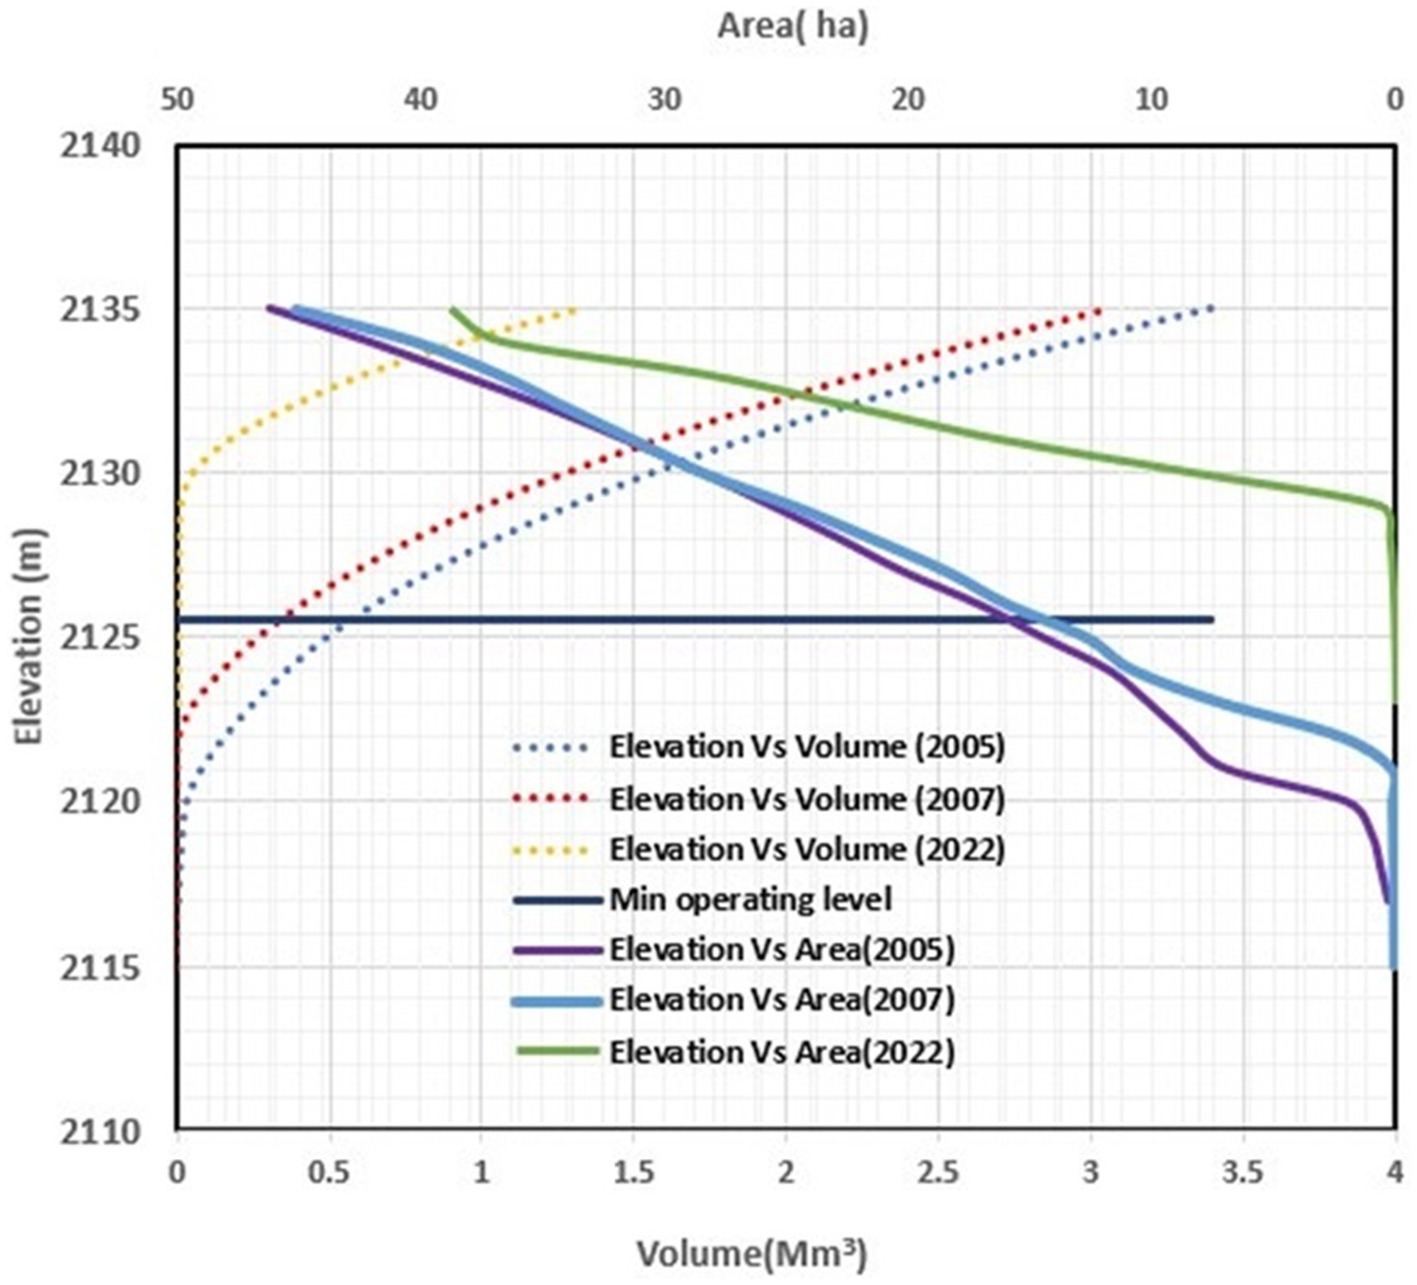
Figure 5. Area Elevation curve and capacity elevation curve.
The volume of the reservoir sediment deposit was calculated using the variation in reservoir capacity between the years 2005, 2007, and 2022. At full supply levels in 1997, 2005, and 2007, and 2022, the reservoir had storage capacities of 5.3 Mm3, 3.8 Mm3, 3.5 Mm3, and 1.32 Mm3, respectively. The total storage loss owing to silt from 1997 to 2022 was 3.98 Mm3. A deposition of 75.1% of the entire storage during 26 years of operation, with a 2.9% annual reduction in storage capacity that occurred due to sedimentation. The annual capacity loss (TCL %) of the Angereb reservoir for the four periods, 1997–2005, 2005–2007, 2007–2022, and 1997–2022, were estimated as 3.1, 2.6, 3.9, and 2.9%, respectively. The results were summarized as shown in Table 4.
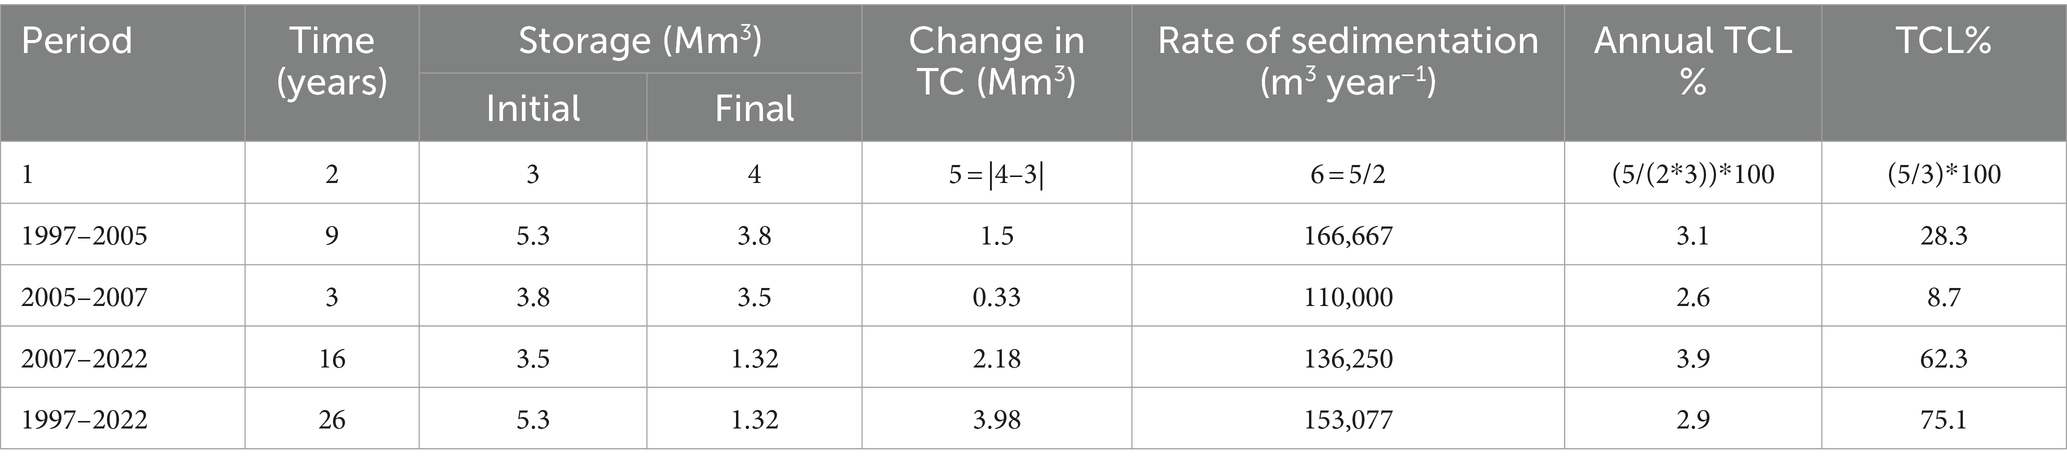
Table 4. The total capacity loss (TCL %) of the Angereb reservoir.
The results of this study demonstrate that the sedimentation is relatively serious when compared to the results of the majority of studies of similar reservoirs in other regions of Ethiopia and East Africa. Haregeweyn et al. (2006) reported annual TCL values of 0.18–4% for 13 reservoirs in northern Ethiopia. Similar studies carried out by the Department for International Development (Lawrence, 2004) reported that siltation rates range between 1–3% in Zimbabwe and 1–4% in Tanzania. Lawrence (2004) also reported that about 15% of the surveyed dams will be filled with sediment in less than the design period. On the other hand, the siltation problem is more severe in our study area when compared to the world average annual rate of storage loss due to reservoir sedimentation for large dams, i.e., 0.5–1% (WCD, 2000). However, our findings are in the same order of magnitude as the reservoirs built in densely populated areas like China (Zhang et al., 2021). Our study complements also Kebedew et al.’s work on Lake Tana, where the sedimentation rate of the large shallow lake was found similar with the sedimentation rates of the shallow tropical lakes in Yangtze River Basin in China (Xu et al., 2017; Kebedew et al., 2021, Ren et al., 2021).
The first step was to generate raster layers using the 2007 and 2022 TIN data to define the distribution of sediment thickness (depth) in the reservoir. The 2007 reservoir bed elevation raster was then deducted from the 2022 reservoir bed elevation raster using the Raster calculator in spatial analysis tool to generate the differenced raster. According to the results, the greatest sediment thickness (depth) was 11.54 m, the maximum computed elevation reduction was −1.25 m, and the average computed sediment thickness was 5.99 m. The negative 1.25 m shows that this depth has been reduced from the 2007 reservoir ground level by 1.25 m, indicating dredged sediment from the bed. Figure 6 indicates sediment deposition locations in the reservoir for sediment management.

Figure 6. Reservoir sediment thickness map.
The longitudinal profiles were plotted along the pre-impoundment center line of the river for both the 2007, and 2022 surveys. The difference between the 2007–2022-year longitudinal profiles represents the sediment deposited along the river center line in sixteen years as shown in Figure 7. As it can be observed in the figure the Water supply office has managed to lower the elevation near the bottom outlet pipe.
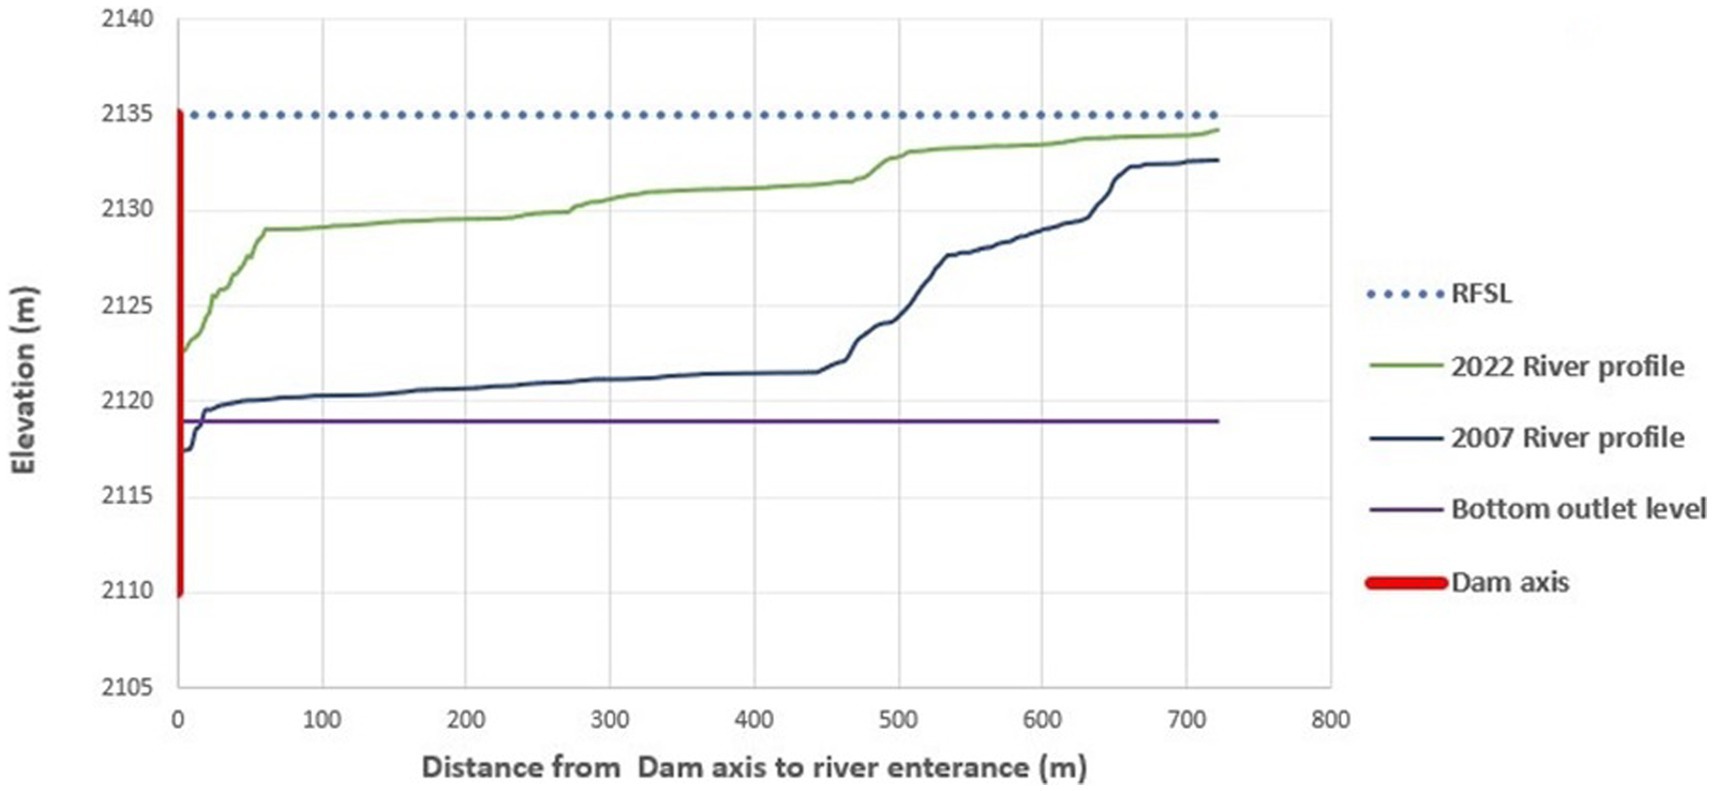
Figure 7. Riverbed profiles during 2007 and 2022 surveys.
The trap efficiency of the reservoir is calculated by using Eqs. 4, 5. Taking 69.66 km2 watershed areas (A), D = 0.1 and reservoir capacity of 1.32 Mm3 reservoir capacities the trap efficiency was 80%. Based on Brune’s equation with reservoir capacity (C) of 1.32 Mm3 and average annual inflow (I) of 21.05 Mm3 the corresponding trap efficiency from Eq. 5, is 70.7% for fine-grained sediments.
To compute the sediment yield (SY) and specific sediment yield (SSY) of the Watershed Eqs. 8, 9 are employed. The average dry bulk density and the above-calculated trap efficiencies from Eqs. 4, 5 were used. The total sediment volume (SV) of the Angereb reservoir is 2.18 mm3 between the years 2007–2022 and the dry bulk density is 1.1 ton m−3. Taking 16 years as the time of the reservoir sedimentation, the sediment yield (SY) and specific sediment yield (SSY) were computed.
Accordingly, the sediment yield (SY) for 70.7% (Brune’s) and 80% (Brown’s) trap efficiencies are 192715.7 and 170312.5 m3 y−1. While the SSY is 3043.2 and 2689.4 ton km−2 y−1, respectively. Taking the two trap efficiencies, the SSY ranges from 26.9–30.4 t ha−1 y−1.
The yearly sedimentation yield in this study was similar to that found in different investigations conducted in Ethiopia and even in Africa. For instance, in Ethiopia, according to Tamene et al. (2006), the particular sediment yield value in the highlands of northern Ethiopia ranges from 345 to 4,935-ton km−2 y−1, and according to Haregeweyn et al. (2012), the SSY for 2005–2007 bathymetric survey of the Angereb watershed was 1,789-ton km−2 y−1. The SSY of this study is also between the ranges found for the highlands of Ethiopia.
Studies conducted in various regions, including the upper Indus basin, Africa, and Italian catchments, shed light on sediment yield values (SSY) that are pertinent to our understanding of the Angereb reservoir. Faran Ali and de Boer (2008) observed SSY values ranging from 194 to 3,888 t km−2 y−1 in the upper Indus basin. Similarly, Vanmaercke et al. (2010), after reviewing 84 publications and from measurements of 682 African catchments, reported a wide variation in SSY values, ranging from 0.2 to 15,699 t km−2 y−1, with an average of 634 t km−2 y−1. Furthermore, Epari et al. (2022) investigated sediment yield for fifty reservoirs in Italian catchments, discovering a range of 17 to 4,398 t km−2 y−1. These findings collectively indicate that the sediment yield observed in the Angereb reservoir falls within the spectrum of both global and local SSY values. This alignment with broader trends reinforces the relevance of understanding and managing sedimentation in the context of the Angereb reservoir.
It indicates that from 50.3–70.1% increase of the SSY is observed in this same reservoir within 16 years based on the two trap efficiency methods. The steep slopes, the high rainfall, and the soil type of the catchment area, the continuous cultivation that is going on and the lower vegetation cover make the situation more conducive for greater erosion to take place in the Angereb watershed during rainy seasons. As the result of high sheet, gulley and channel erosions and swift transport of eroded materials, sediment load carried by Angereb River is remarkably high.
The life of a reservoir is affected by the sedimentation rate of a reservoir that is directly influenced by the sediment produced in the catchment and the amount of sediment trapped by the reservoir. In the original study document the life of the reservoir is 26 years. The dam has already exceeded this 25 lifetime. Since the purpose of this reservoir is for water supply and has an intake tower, the water can be taken through the tower as long as there is water in the reservoir. Therefore, we have to know how much this reservoir can take to fill up to full level if the incoming sediment continues with this trend. To estimate the remaining life of the Angereb reservoir the yearly incoming sediment is used. Therefore, using Eq. 6 the remaining life of the reservoir till it gets full by sediment is 7 years.
When we are dealing with a reservoir like Angereb that has been heavily filled with sediment, it poses quite a problem. However, there are many ways we can manage this situation to make the reservoir usable for a longer period. One approach involves tackling the amount of sediment flowing into the reservoir, which can be done through a combination of watershed management techniques and sediment traps (Morris, 2020; Randle et al., 2021). This includes setting up sediment basins, check dams, and vegetative buffers, as well as implementing erosion control methods (Dagnew et al., 2015; Zhao, 2017) such as planting vegetation to prevent erosion, building terraces, regulating livestock grazing in the watershed, and constructing barriers upstream of the reservoir to catch sediment before it settles in the main storage area. These steps can help prolong the reservoir’s lifespan and ensure it continues to serve its purpose effectively.
Another method that is currently impractical to put into action is sediment routing. Given the topography around the Angereb reservoir, constructing a bypass channel to divert sediment-laden flow away from the reservoir and reduce deposition within it would be extremely challenging. However, the most cost-effective option available is to open the bottom outlet during a high flow, allowing the sediment to be flushed out of the reservoir and thus reducing sediment buildup (Wang and Chunhong, 2009). It is particularly efficient to do this during the initial high flows, as it requires minimal additional energy and capitalizes on natural hydraulic forces to transport sediment effectively. Moreover, during this flushing period, there is an opportunity to agitate the settled sediment to facilitate its removal from the reservoir.
Sediment removal through dredging and excavation during periods of water recession is another option (Randle et al., 2021). While there have been some minor dredging efforts in the northwest area of the reservoir, this method remains the most feasible albeit expensive option for implementation. However, it demands careful consideration when selecting disposal sites for the dredged material. Ideally, disposal sites should be located outside the reservoir’s watershed. In cases where options are limited and disposal within the watershed is necessary, measures such as vegetative buffers and other protective measures should be employed to prevent the reintroduction of the removed sediment into the reservoir. This approach requires meticulous planning and execution to ensure its effectiveness while minimizing environmental impacts.
Involving local communities and stakeholders in reservoir management endeavors plays a vital role in harvesting support and fostering collaboration. By educating residents about the significance of sediment management and actively engaging them in conservation efforts, we can achieve more effective outcomes. Gondar Water Supply and Sewerage Services should collaborate closely with communities situated in the watershed, particularly those contributing to high sediment inflows. Working hand in hand with these communities, the focus should be on implementing watershed conservation measures that not only address sedimentation but also offer economic opportunities. This could involve initiatives aimed at rehabilitating degraded areas of the watershed while simultaneously creating income-generating activities for the residents (Example, beekeeping). By involving and empowering the communities directly impacted by sedimentation, we can cultivate a sense of ownership and responsibility toward the sustainable management of the reservoir and its surrounding environment. This collaborative approach not only enhances the effectiveness of sediment management efforts but also promotes long-term environmental stewardship and community resilience.
As a final option, if all previous attempts to address sedimentation have proven ineffective, there is the possibility of raising the dam height to expand the reservoir’s capacity. However, this approach comes with substantial considerations and is often viewed as less favorable. It constitutes a major engineering endeavor, necessitating significant investment in design, construction, and potentially even relocation of infrastructure affected by the rising water level. Ensuring the safety of the dam becomes paramount in such a project. Heightening the dam introduces new structural complexities and demands thorough engineering assessments to guarantee the dam’s stability under increased water pressure. It is crucial to recognize that sedimentation in reservoirs is an ongoing process. Even with a heightened dam, sediment accumulation will persist, necessitating further interventions in the future. This underscores the need for a comprehensive, long-term strategy to manage sedimentation and maintain the reservoir’s functionality over time.
In conclusion, the present study thoroughly investigated and compared four interpolation techniques for creating TIN surface maps from bathymetry survey elevation data. The method of Local Polynomial Interpolation emerged as the most effective technique, exhibiting the lowest MAE (0.222 m), RMSE (0.401 m), and the highest coefficient of correlation (R2 = 0.939) among the examined methods. The study investigated the dynamics of the Angereb reservoir, revealing substantial sedimentation over the years. The TIN surfaces derived from bathymetric surveys in 2007 and 2022 were employed to calculate reservoir volume, and sediment deposits. The findings indicated a notable decrease in storage capacity due to sediment buildup, with a total storage loss of 3.98 mm3 over the period from 1997 to 2022. The annual reduction in storage capacity due to sedimentation was 2.9%.
Comparisons with similar studies in Ethiopia and East Africa highlighted the severity of sedimentation in the Angereb reservoir. Annual Total Capacity Loss (TCL %) values for different periods were estimated, with the results indicating a substantial impact on reservoir storage capacity. Spatial analyses using raster layers demonstrated the distribution of sediment depths in the reservoir, revealing areas with significant sediment buildup. It showed that 1.25 m depth of sediment was dredged in the reservoir near the western part of the reservoir. Longitudinal profiles along the pre-impoundment river profile were analyzed, illustrating the sediment deposited on the river center over sixteen years. Sediment yield and specific sediment yield calculations further emphasized the magnitude of sedimentation, with 50.3–70.1% increase in SSY observed compared to previous data from 16 years.
The study also addressed the reservoir’s useful life, identifying factors contributing to its premature decrease in storage capacity. Lack of sufficient sediment yield data during the design stage, absence of appropriate soil conservation methods in the upper catchment area, and unforeseen gully erosion were identified as key reasons for the reservoir not meeting their intended design life.
Rehabilitating and conserving the soils in the catchment is the main obstacle. Without taking this measure, the reservoir will be filled with silt, the capacity will continue to drop until they are no longer water in the reservoir, and the long-term availability of water for the city will be severely compromised. To address soil erosion issues throughout the whole watershed, tailored conservation practices and investments must be introduced in the watershed. The water supply and sewerage office of Gondar should plan a program to reclaim a usable storage volume from the reservoir based on the above management options and a watershed rehabilitation program in the watershed to extend the use of the dam.
The raw data supporting the conclusions of this article will be made available by the authors, without undue reservation.
YT: Data curation, Formal analysis, Investigation, Methodology, Software, Visualization, Writing – original draft, Writing – review & editing. FZ: Conceptualization, Data curation, Formal analysis, Investigation, Methodology, Software, Supervision, Validation, Writing – original draft, Writing – review & editing. MK: Methodology, Writing – review & editing.
The author(s) declare that no financial support was received for the research, authorship, and/or publication of this article.
We are thankful to Nigussie Haregewoyn to provide the 2007 bathymetric survey data of Angereb reservoir.
The authors declare that the research was conducted in the absence of any commercial or financial relationships that could be construed as a potential conflict of interest.
All claims expressed in this article are solely those of the authors and do not necessarily represent those of their affiliated organizations, or those of the publisher, the editors and the reviewers. Any product that may be evaluated in this article, or claim that may be made by its manufacturer, is not guaranteed or endorsed by the publisher.
DBD, Dry bulk density; DEM, Digital Elevation Model; GIS, Geographic Information System; IDW, Inverse Distance Weighting; LPI, Local Polynomial Interpolation; OK, Ordinary Kriging; SY, Sediment yield; SSY, Specific sediment yield; UK, Universal kriging.
Adongo, T. A., Abagale, F. K., and Agyare, W. A. (2021). Modeling and forecasting reservoir sedimentation of irrigation dams in the Guinea Savannah ecological zone of Ghana. Water Pract. Technol. 16, 1355–1369. doi: 10.2166/wpt.2021.073
Adongo, T. A., Kyei-Baffour, N., Abagale, F. K., and Agyare, W. A. (2020). Assessment of reservoir sedimentation of irrigation dams in northern Ghana. Lake Reserv. Manag. 36, 87–105. doi: 10.1080/10402381.2019.1659461
Ayele, G. T., Kuriqi, A., Jemberrie, M. A., Saia, S. M., Seka, A. M., Teshale, E. Z., et al. (2021). Sediment yield and reservoir sedimentation in highly dynamic watersheds: the case of Koga reservoir, Ethiopia. Water 13:3374. doi: 10.3390/w13233374
Bachiller, A. R., Rodríguez, J. L. G., Sánchez, J. C. R., and Gómez, D. L. (2019). Specific sediment yield model for reservoirs with medium-sized basins in Spain: an empirical and statistical approach. Sci. Total Environ. 681, 82–101. doi: 10.1016/j.scitotenv.2019.05.029
Dagnew, D. C. (2015). Impact of conservation practices on runoff and soil loss in the sub-humid Ethiopian highlands: the Debre Mawi watershed. J. Hydrol. Hydromech. 63, 210–219. doi: 10.1515/johh-2015-0021
De Vente, J., Poesen, J., Arabkhedri, M., and Verstraeten, G. (2007). The sediment delivery problem revisited. Prog. Phys. Geogr. 31, 155–178. doi: 10.1177/0309133307076485
Desta, G. (2010). Conceptualizing rill erosion as a tool for planning and evaluating soil conservation in Angereb watershed, Ethiopia-methodological development: Research report for Q505 project supported by eastern and southern Africa partnership program (ESAPP). doi: 10.7892/boris.69286
Dunbar, J. A., Allen, P. M., and Higley, P. D. (1999). Multifrequency acoustic profiling for water reservoir sedimentation studies. J. Sediment. Res. 69, 518–527. doi: 10.2110/jsr.69.518
Dutta, S. C., Nayak, S., Acharjee, G., Panda, S. K., and Das, P. K. (2016). Gorkha (Nepal) earthquake of April 25, 2015: actual damage, retrofitting measures and prediction by RVS for a few typical structures. Soil Dynam. Earthq. Eng. 89, 171–184. doi: 10.1016/j.soildyn.2016.08.010
Elsahabi, M., Negm, A., and Ali, K. (2018). Assessment of sedimentation capacity in Lake Nasser, Egypt, utilizing RS and GIS. Procedia Manuf 22, 558–566. doi: 10.1016/j.promfg.2018.03.082
Epari, R. P., Carlo De, M., Gianluca, G., and Chiara, B. (2022). Assessment of current reservoir sedimentation rate and storage capacity loss: an Italian overview. J. Environ. Manag. 320:115826. doi: 10.1016/j.jenvman.2022.115826
Faran Ali, K., and de Boer, D. H. (2008). Factors controlling specific sediment yield in the upper Indus River basin, northern Pakistan. Hydrol. Proces. 22, 3102–3114. doi: 10.1002/hyp.6896
Foteh, R., Garg, V., Nikam, B. R., Khadatare, M. Y., Aggarwal, S. P., and Kumar, A. S. (2018). Reservoir sedimentation assessment through remote sensing and hydrological modeling. J. Indian Soc. Remote Sens 46, 1893–1905. doi: 10.1007/s12524-018-0843-6
Froehlich, D. C., Narayan, P., and Kumar, M. (2017). Estimating reservoir capacity loss from sedimentation. In: Proceedings of the third national dam safety conference, Roorkee, India, pp. 18–19
Furnans, J., and Austin, B. (2008). Hydrographic survey methods for determining reservoir volume. Environ. Model. Softw. 23, 139–146. doi: 10.1016/j.envsoft.2007.05.011
Garg, V., and Jothiprakash, V. (2008). Estimation of useful life of a reservoir using sediment trap efficiency. J. Spat. Hydrol. 8:Article 2.
Gopal, N., and Rao, N. H. (2016). “3D visualization of reservoir and its applications in fisheries: A GIS perspective,” in Fishery Technology. India: Society of Fisheries Technologists. 53, 75–81. Available at: http://krishi.icar.gov.in/jspui/handle/123456789/2721
Haregeweyn, N., Bekure, M., Atsushi, T., Mitsuru, T., Derege, M., and Bedru, B. (2012). Reservoir sedimentation and its mitigating strategies: a case study of Angereb reservoir. J. Soils Sediments 12, 291–305. doi: 10.1007/s11368-011-0447-z
Haregeweyn, N., Poesen, J., Deckers, J., Nyssen, J., Haile, M., Govers, G., et al. (2008). Assessment and evaluation of sediment-bound nutrient export and associated costs from micro-dam watersheds of northern Ethiopia. Land Degrad. Dev. 19, 136–152. doi: 10.1002/ldr.830
Haregeweyn, N., Poesen, J., Nyssen, J., De Wit, J., Haile, H., Govers, G., et al. (2006). Reservoirs in Tigray: characteristics and sediment deposition problems. Land Degrad. Dev. 17, 211–230. doi: 10.1002/ldr.698
Hurni, K., Zeleke, G., Kassie, M., Tegegne, B., Kassawmar, T., Teferi, E., et al. (2015). “Economics of land degradation (ELD) Ethiopia case study. Soil degradation and sustainable land management in the rainfed agricultural areas of Ethiopia: An assessment of the economic implications” in Report for the economics of land degradation initiative. eds. N. Stewart and M. Thiebault (Bonn, Germany: University of Burn), 94.
Ikhar, P., Regulwar, D., and Kamodkar, R. (2018). Optimal reservoir operation using soil and water assessment tool and genetic algorithm. ISH J. Hydraul. Eng. 24, 249–257. doi: 10.1080/09715010.2017.1417754
Iradukunda, P., and Bwambale, E. (2021). Reservoir sedimentation and its effect on storage capacity. A case study of Murera reservoir, Kenya. Cogent. Eng. 8:1917329. doi: 10.1080/23311916.2021.1917329
Issa, I. E., Al-Ansari, N., Knutsson, S., and Sherwany, G. (2015). Monitoring and evaluating the sedimentation process in Mosul dam reservoir using trap efficiency approaches. Engineering 7, 190–202. doi: 10.4236/eng.2015.74015
Kebedew, M. G., Kibret, A. A., Tilahun, S. A., Belete, M. A., Zimale, F. A., and Steenhuis, T. S. (2020). The relationship of lake morphometry and phosphorus dynamics of a tropical Highland Lake: Lake Tana, Ethiopia. Water 12:2243. doi: 10.3390/w12082243
Kebedew, M. G., Tilahun, S. A., Belete, M. A., Zimale, F. A., and Steenhuis, T. S. (2021). Sediment deposition (1940–2017) in a historically pristine lake in a rapidly developing tropical highland region in Ethiopia. Earth Surf. Process. Landf. 46, 1521–1535. doi: 10.1002/esp.5118
Kothyari, C., and Jain, M. (2000). Estimation of soil erosion and sediment yield using GIS. Hydrol. Sci. J. 45, 771–786.
Lawrence, P. (2004). Sedimentation in small dams. Development of a catchment characterisation and sediment yield prediction procedure.
Michalec, B., and Cupak, A. (2021). Assessment of quality of water and sediments in small reservoirs in southern Poland–a case study. Environ. Eng. Res. 27:200660. doi: 10.4491/eer.2020.660
Mitiku, H., and Karl Herweg, B. S. (2006). Sustainable land management: A new approach to soil and water conservation in Ethiopia. Bern, Switzerland: Centre for Development and Environment (CDE) and NCCR North-South.
Moges, M. M., Abay, D., and Engidayehu, H. (2018). Investigating reservoir sedimentation and its implications to watershed sediment yield: the case of two small dams in data-scarce Upper Blue Nile Basin, Ethiopia. Lakes Reserv. Res. Manag. 23, 217–229. doi: 10.1111/lre.12234
Morris, G. L. (2020). Classification of management alternatives to combat reservoir sedimentation. Water 12:861. doi: 10.3390/w12030861
MS Consultant (2023). Gondar City water supply emergency response assessment report, Addis Ababa, Ethiopia.
National Digital Elevation Program (NDEP) (2004). Guidelines for Digital Data Version 1.0. Available at: http://www.ndep.gov/NDEP_Elevati,on_Guidelines_Ver1_10May2004.pdf
Palmieri, A., Shah, F., and Dinar, A. (2001). Economics of reservoir sedimentation and sustainable management of dams. J. Environ. Manag. 61, 149–163. doi: 10.1006/jema.2000.0392
Panagos, P., Matthews, F., Patault, E., De Michele, C., Quaranta, E., Bezak, N., et al. (2024). Understanding the cost of soil erosion: an assessment of the sediment removal costs from the reservoirs of the European Union. J. Clean. Prod. 434:140183. doi: 10.1016/j.jclepro.2023.140183
Randle, T. J., Morris, G. L., Tullos, D. D., Weirich, F. H., Kondolf, G. M., Moriasi, D. N., et al. (2021). Sustaining United States reservoir storage capacity: need for a new paradigm. J. Hydrol. 602:126686. doi: 10.1016/j.jhydrol.2021.126686
Rashid, M. U., Shakir, A. S., Khan, N. M., Latif, A., and Qureshi, M. M. (2015). Optimization of multiple reservoir operations with consideration to sediment evacuation. Water Resour. Manag. 29, 2429–2450. doi: 10.1007/s11269-015-0951-9
Ren, S., Zhang, B., Wang, W. J., Yuan, Y., and Guo, C. (2021). Sedimentation and its response to management strategies of the three gorges reservoir, Yangtze River, China. Catena 199:105096. doi: 10.1016/j.catena.2020.105096
Schleiss, A. J., Franca, M. J., Juez, C., and De Cesare, G. (2016). Reservoir sedimentation. J. Hydraul. Res. 54, 595–614. doi: 10.1080/00221686.2016.1225320
Sekellick, A. J., and Banks, W. S. (2010). Water volume and sediment accumulation in Lake Linganore. Frederick County, Maryland: U.S. Geological Survey scientific investigations report 2010. 14).
Sterling, D. L. (2003). A comparison of spatial interpolation techniques for determining shoaling rates of the Atlantic Ocean Channel. Blacksburg, VA: Virginia Tech.
Tamene, L., Park, S. J., Dikau, R., and Vlek, P. (2006). Reservoir siltation in the semiarid highlands of northern Ethiopia: sediment yield–catchment area relationship and a semquantitative approach for predicting sediment yield. Earth surface processes and landforms earth surf process. Landforms 31, 1364–1383. doi: 10.1002/esp.1338
Vanmaercke, M., Zenebe, A., Poesen, J., Nyssen, J., Verstraeten, G., and Deckers, J. (2010). Sediment dynamics and the role of flash floods in sediment export from medium-sized watersheds: a case study from the semi-arid tropical highlands in northern Ethiopia. J. Soils Sed. 10, 611–627. doi: 10.1007/s11368-010-0203-9
Verstraeten, G., and Poesen, J. (2000). Estimating trap efficiency of small reservoirs and ponds: methods and implications for the assessment of sediment yield Progress in physical 24:219. Available at: http://ppg.sagepub.com
Walling, D. E. (1983). The sediment delivery problem. J. Hydrol. 65, 209–237. doi: 10.1016/0022-1694(83)90217-2
Wang, Z. Y., and Chunhong, H. U. (2009). Strategies for managing reservoir sedimentation. Int. J. Sed. Res. 24, 369–384. doi: 10.1016/S1001-6279(10)60011-X
WCD (2000). Dams and development, a new framework for decision making. Report of the world Commission of Dams. Earth-scan publications: London
Xu, M., Dong, X., Yang, X., Chen, X., Zhang, Q., Liu, Q., et al. (2017). Recent sedimentation rates of shallow lakes in the middle and lower reaches of the Yangtze River: patterns, controlling factors and implications for lake management. Water 9:617. doi: 10.3390/w9080617
Zeleke, T., Moussa, A. M., and El-Manadely, M. S. (2013). Prediction of sediment inflows to Angereb dam reservoir using the SRH-1D sediment transport model. Lakes Reserv. Res. Manag. 18, 366–371. doi: 10.1111/lre.12047
Zhang, Y., Xu, M., Wu, T., Li, Z., Liu, Q., Wang, X., et al. (2021). Sources of fine-sediment reservoir deposits from contrasting lithological zones in a medium-sized catchment over the past 60 years. J. Hydrol. 603:127159.
Keywords: Angereb reservoir, reservoir sedimentation, bathymetry, specific sediment yield (SSY), Upper Blue Nile Basin, specific sediment (SY), trap efficiency, reservoir management
Citation: Tessema YM, Zimale FA and Kebedew MG (2024) Understanding sedimentation trends to enhance sustainable reservoir management in the Angereb reservoir, Upper Blue Nile Basin, Ethiopia. Front. Water. 6:1387915. doi: 10.3389/frwa.2024.1387915
Edited by:
Axel Bronstert, University of Potsdam, GermanyReviewed by:
Jose Andres Lopez-Tarazon, Forestal Catalana SA, SpainCopyright © 2024 Tessema, Zimale and Kebedew. This is an open-access article distributed under the terms of the Creative Commons Attribution License (CC BY). The use, distribution or reproduction in other forums is permitted, provided the original author(s) and the copyright owner(s) are credited and that the original publication in this journal is cited, in accordance with accepted academic practice. No use, distribution or reproduction is permitted which does not comply with these terms.
*Correspondence: Fasikaw A. Zimale, RmFzaWthd0BnbWFpbC5jb20=
†These authors have contributed equally to this work and share first authorship
‡ORCID: Fasikaw A. Zimale https://orcid.org/0000-0001-9728-2712
Disclaimer: All claims expressed in this article are solely those of the authors and do not necessarily represent those of their affiliated organizations, or those of the publisher, the editors and the reviewers. Any product that may be evaluated in this article or claim that may be made by its manufacturer is not guaranteed or endorsed by the publisher.
Research integrity at Frontiers
Learn more about the work of our research integrity team to safeguard the quality of each article we publish.