 Andreas Bauwe
 Bernd Lennartz
- Faculty of Agricultural and Environmental Sciences, University of Rostock, Rostock, Germany
Nitrate (NO3−) export from agricultural land poses an ongoing threat to both inland and coastal waters. Experimental studies investigating the hydrology-NO3−-export mechanisms require long-term data to identify reliable causal relationships. In this study, utilizing a 23-year continuous dataset with a high temporal resolution (daily to twice a week), we aim to identify potential drivers for NO3-losses and assess the impact of nitrogen (N) soil surface budgets on NO3-export. A drainage plot (4.2 ha) and a ditch catchment (179 ha) were fully equipped to register hydrological parameters, including water sample collection. Mean annual NO3−-N concentrations (loads) for the drainage plot and the ditch catchment were 9.4 mg l−1 (20.6 kg ha−1) and 6.0 mg L−1 (20.9 kg ha−1), respectively. Annual discharge was closely positively correlated with annual NO3-losses, highlighting the significant influence of prevailing weather and, consequently, hydrologic conditions on NO3-export rates. The majority of the annual NO3−-load was exported during winter (56% at the drainage plot, 51% at the ditch catchment), while the rest was exported during spring (28, 29%), summer (9, 9%) and fall (7, 11%). We could not find any direct relationships between N soil surface budgets and NO3-losses. Putting all results together, it can be concluded that agricultural activities for many decades resulted in high soil N stocks, which determined the general high NO3−-N concentration levels. Nevertheless, temporal NO3-export dynamics during the last two decades were clearly driven by hydro-meteorological conditions, nearly independently of land management and N soil surface budgets on the fields.
1 Introduction
Nutrient export from agricultural land is continuing to threaten our inland and coastal waters. To achieve a good ecological status for surface water bodies, numerous directives and action plans have been established at both the European Union level (EC, 1991, 2000) and regionally (OSPAR, 1992; HELCOM, 2007). Nitrogen (N) pollution remains elevated and ecologically unacceptable in various regions worldwide (UBA, 2018; Oelsner and Stets, 2019; Yu et al., 2019; Malone and Newton, 2020).
Compelling evidence indicates that long-term N fertilizer application has resulted in soil N enrichment in numerous agricultural watersheds (Van Meter et al., 2016; Ascott et al., 2017; Chen et al., 2018). Owing to positive N soil surface budgets, N enrichment in agricultural soils is likely to be continued in the near future. However, a modeling study examining the evolution of N surplus in Europe for more than a century identified a gradual decline in N surplus in European soils in the recent past (Batool et al., 2022). The reasons for this decline are undoubtedly multifaceted, with administrative regulations playing a pivotal role. For instance, in its efforts to counteract excessive N export into surface water bodies, Germany has progressively tightened regulations concerning annual N surplus, reducing it from 90 kg N ha−1 in 2006 to 50 kg N ha−1 from 2018 onwards (DüV, 1996, 2006, 2017). These administrative measures appear to be gradually having a positive effect on surface water quality. For example, there is a weak tendency of decreasing nitrate-nitrogen (NO3−-N) concentrations in German rivers (BMUB, 2017). At European level, a decrease in NO3−-N concentrations can be observed in some rivers (Rhine, Odense, Thames), while NO3−-N concentrations continue to rise in other large rivers (e.g., Loire) (Bouraoui and Grizzetti, 2011). The different trends were partially explained by different NO3-lag times (Bouraoui and Grizzetti, 2011).
NO3−-N concentrations and loads in streams are controlled by a variety of factors. One important factor is land use. For example, NO3−-N concentrations are usually lower in forested catchments compared to agricultural catchments (Mayer et al., 2002; Poor and McDonnell, 2007; Barnes and Raymond, 2010), in which N is added in form of mineral and/or organic fertilizers. Hydro-meteorological conditions also play a crucial role in driving NO3−-N concentrations and export patterns in streams. Many studies have demonstrated a close positive correlation between discharge and NO3−-N loads (e.g., Tomer et al., 2003; Bauwe et al., 2020). Tomer et al. (2003) reported for a tile-drained watershed in Iowa, USA, that NO3−-N concentrations were not typically diluted by large flows resulting in high NO3−-N loads during discharge events. They concluded that practices to optimize N management within fields should be encouraged, because edge-of-field measures such as constructed wetlands cannot effectively remove NO3−-N during large flows (Tomer et al., 2003). Furthermore, NO3−-N concentrations often exhibit seasonal variations depending on discharge composition. An Austrian study has shown that alternating aquifer contributions within a year controlled to a large degree the seasonality of the NO3−-N concentrations in the streams due to significantly higher NO3−-N concentrations in the shallow aquifer compared to the deep aquifer (Exner-Kittridge et al., 2016). At the event scale, NO3−-N concentration patterns present a nuanced picture, with scientific literature reporting both dilution effects (Inamdar et al., 2004; Feinson et al., 2016) and accretion effects (Fučík et al., 2012; Bauwe et al., 2015).
A limited investigation period is often an obstacle in experimental studies to identify long-term trends or to uncover relations between hydrology and nitrate export patterns. In 2001, we fully equipped a 4.2 ha drainage plot and a 179 ha ditch catchment for the purpose of monitoring hydrological parameters, including water sample collection. The continuous monitoring effort has yielded a large continuous data set with a high temporal resolution (daily to twice a week) spanning over 22 years (2001–2022). Here, we use this extensive dataset to identify potential drivers for NO3-losses and investigate the impact of N soil surface budgets on NO3-export.
2 Materials and methods
2.1 Study site
The study area is situated in northeastern Germany, approximately 10 km southeast of Rostock (Figure 1). Characterized by conventional arable use covering 94% of the region, the landscape features minimal forested areas, accounting for only 6%. The catchment is located in a glacially formed landscape with a flat topography and only gentle slopes (slope gradients <3%). Mineral soils (mainly sandy loams) are characteristic for the area, with a predominance of Luvisols (48%), Gleysols (43%), and Stagnic Gleysols (9%). The four agricultural fields in the study area (Figure 1) are tile-drained with a drainage depth 1.1 m and a drainage distance from 8 to 22 m.

Figure 1. Study area.
Water originating from the tile drains flows into a main ditch (Figure 1). The drainage plot (field 4) and the ditch catchment (including fields 1, 2, 3, 4) are 4.2 ha and 179 ha in size, respectively. Tile drain flow is most pronounced during the winter months, extending from November to April. This temporal pattern corresponds to a precipitation surplus attributable to lower temperatures and reduced evapotranspiration rates during this period. Mean annual precipitation was 614 mm and the mean annual temperature was 9.1°C (2001–2022). While precipitation is predominantly in the form of rainfall, certain winters experienced substantial snow cover, notably in 2009 and 2010. Due to the high areal proportion of tile drainage (94%), discharge in the ditch is mainly controlled by tile flow and groundwater flow (Bauwe et al., 2016). In contrast, surface runoff is only sporadically being observed during intense storm events.
2.2 Hydrological data
The sampling station positioned at the outlet of the drainage plot, linked to the collector drain, is equipped with a Venturi flume (RBC-flume, UGT GmbH, Germany). This apparatus enables continuous and automatic water level measurement at 15 min intervals. The recorded water level data are subsequently converted into flow data at the collector drain through the application of regression equations supplied by the manufacturer. The sampling station at the ditch located at the catchment outlet is equipped with an automatic, ultrasonic, water level measurement device (Teledyne Isco, Inc., Lincoln, NE). We conducted frequent flow measurements, typically on a weekly basis, utilizing an inductive flowmeter (Flo-Mate TM, Marsh-McBirney, Inc., Frederick, MD) to develop rating curves for this station. Rating curves were used to calculate daily flow data using the automatic water level measurements.
2.3 Nitrate data
Water samples from both the drainage plot and the ditch were systematically collected using ISCO samplers (Teledyne Isco, Inc., Lincoln, NE), typically a minimum of twice a week. After collecting the water samples, they were promptly transported to the laboratory and frozen at −20°C to preserve their integrity until the subsequent analysis for NO3−-N. The analysis of NO3−-N was conducted through ion chromatography, utilizing equipment from Metrohm AG, Herisau, Switzerland. To derive daily, monthly and annual NO3−-N loads for both the drainage plot and the ditch catchment, we used the R software package RiverLoad (Nava et al., 2019). This package provides different methods for load estimation, such as averaging methods, ratio estimators and regression methods. Based on our dataset with continuous flow data and instantaneous concentration data, load estimation using linear interpolation of concentration data was appropriate for this study:
where L is the NO3−-N load, Cjint (g m−3) is the daily NO3−-N concentration linearly interpolated between two measured samples, Qj (m3 s−1) is the mean daily streamflow and K″ is a conversion factor for the period of load estimation (Moatar and Meybeck, 2005).
It is pertinent to note that the annual values for both hydrological data and NO3−-N data pertain to a hydrologic year spanning from November to October.
2.4 Nitrogen soil surface budget
Field records from the local farmer, encompassing detailed agricultural practices, served as the foundation for calculating annual N soil surface budgets from 2001 to 2022. The crop rotation during the investigation contained common crops such as winter wheat (Triticum aestivum L.), winter barley (Hordeum vulgare L.), rapeseed (Brassica napus L.), and maize (Zea mays L.) (Table 1). Periodically, sugar beet (Beta vulgaris L.) and legumes such as peas (Pisum sativum L.) or alfalfa (Medicago sativa L.) were also cultivated. This crop rotation is typical for conventional arable farming in northern Germany. Annual N applications varied based on crop selection, as detailed in Table 1. N fertilizers, primarily in mineral form, were applied three to four times a year. Winter wheat and winter barley were typically sown in the latter part of September and harvested in the subsequent summer. Rapeseed was sown about a month earlier, and its harvest coincided with that of winter wheat and winter barley. Maize, sugar beet, and peas were sown in late April and harvested in late summer or early fall of the same year. Table 1 additionally provides information on N in yields for the main crops.
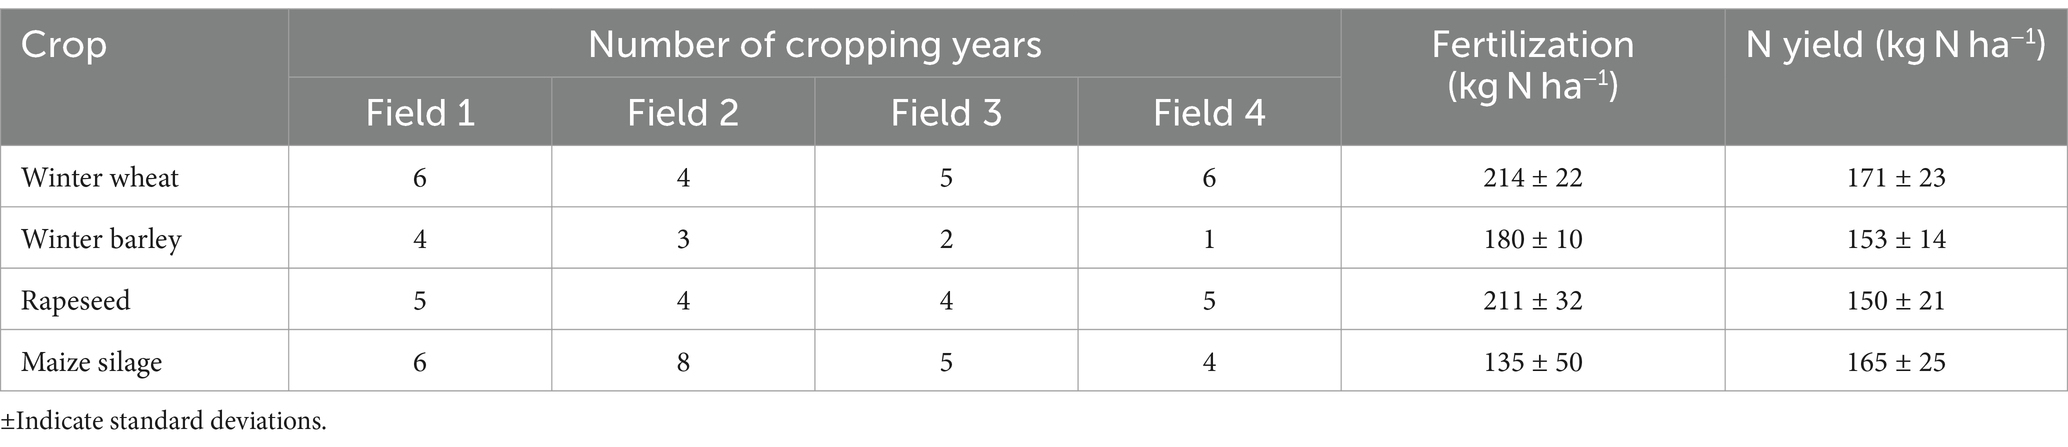
Table 1. Main crops, N fertilization and N in yields.
N soil surface budget was calculated for all four fields in the catchment accounting for mineral and organic fertilization, N fixation, and harvest as follows:
where Nsur is N soil surface budget, Nmin is amount of N in mineral fertilizer, Norg is amount of N in organic fertilizer accounting for ammonia volatilization, Nfix is amount of N fixed by legumes, Natm is amount of atmospheric N deposition, and Nyld is amount of N in harvested yield. All units are (kg ha−1). Data on the N content of organic fertilizers, harvested crops, N fixation rates, and losses due to ammonia volatilization were sourced from literature (MLUV-MV, 2008, 2019). The atmospheric N deposition was 14 kg ha−1 year−1 for the study catchment.1 The N content of mineral fertilizers was obtained from manufacturer specifications. Fertilizer application details and crop yields for each field were provided by the farmer. Notably, the N soil surface budgets of the drainage plot align with those of field 4 (Figure 1), while those of the ditch catchment were computed as area-weighted means of the four fields within the catchment.
3 Results and discussion
3.1 Flow regime and nitrate concentrations
Streamflow and NO3−-N concentrations at both the collector drain and the ditch exhibited pronounced dynamics throughout the study period (Figure 2). Peak flows and maximum annual NO3−-N concentrations predominantly occurred during the winter, while both streamflow and NO3−-N concentrations approached near-zero levels during the summer months. NO3−-N concentration levels were comparable at the collector drain and in the ditch during winter. Mean flow rates during the winter months (November until April) at the collector drain and in the ditch were 0.4 and 15.5 L s−1, respectively. Conversely, the collector drain often experienced dry conditions in summer (May until October), with an exception in the summer of 2011 when an extraordinary precipitation event (98 mm day−1) led to substantial flow. Mean flow rates in the ditch during summer were relatively low at 5.1 L s−1. Although NO3−-N concentrations were typically below the drinking water limit of 11.3 mg L−1 in summer (mean values of 8.0 and 3.1 mg L−1 at the collector drain and in the ditch, respectively), they frequently exceeded this limit in winter (Figure 2) (mean values of 10.8 and 9.0 mg L−1 at the collector drain and in the ditch, respectively).
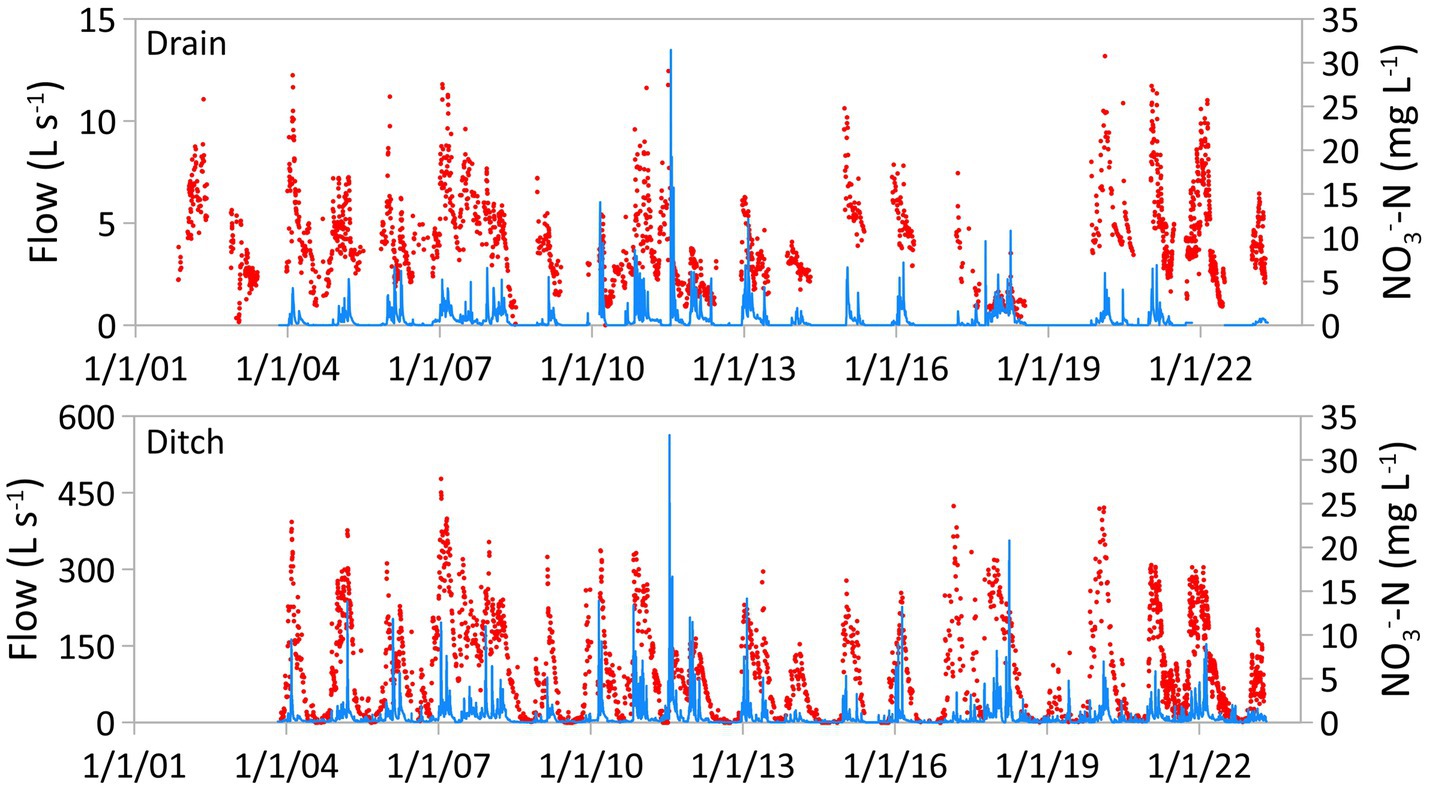
Figure 2. Daily flow rates (blue lines) and measured NO3−-N concentrations (red dots) at the collector drain (above) and in the ditch (below) throughout the study period. NO3−-N measurements at the collector drain began on November 4, 2001, and measurements at the ditch, along with flow measurements at both stations, commenced on November 1, 2003. Data for this study were analyzed until April 30, 2023.
The general trend of low NO3−-N concentrations in summer and high NO3−-N concentrations in winter (Figure 2) can be attributed to the activation of different N sources. During the summer, characterized by low groundwater tables, it is reasonable to assume that mainly groundwater, with low NO3−-N concentrations, contributes to the flow. In contrast, during winter when the water table rises, NO3−-rich water from the upper soil layers significantly influences the chemical composition of the discharge. This seasonal NO3−-N pattern in surface waters of agricultural catchments aligns with findings described by various researchers, including Pionke et al. (1999), Dupas et al. (2016), Exner-Kittridge et al. (2016), Ford et al. (2018) and Abbott et al. (2018).
Over our observation period, no discernible trends were identified regarding the magnitude of NO3−-N concentrations. The visual interpretation of Figure 2 and the plotting of NO3−-N concentrations as a function of flow (Figure 3) revealed a positive relationship between flow and NO3−-N concentrations. This positive relationship between streamflow and NO3−-N concentrations was more pronounced in the ditch (Figure 3). This can be attributed primarily to water flow from groundwater with very low NO3−-N concentrations in the ditch during summer, whereas the discharge season at the collector drain is typically confined to the winter, during which NO3−-N concentrations from drainage water are generally higher. The different NO3−-N concentration pattern of the collector drain and the ditch will be visible when plotting the NO3−-N concentrations as histograms (Figure 4). The main difference between both figures is the large number of samples exhibit NO3−-N concentrations from 0 to 5 mg L−1 in the ditch. These samples were taken in the vast majority of cases in summer, when there was no water in the collector drain. Excluding these low concentration samples, both histograms are similar. Only, a small number of samples (104 at the drain collector and 44 in the ditch) contained NO3−-N concentrations beyond 20 mg L−1.
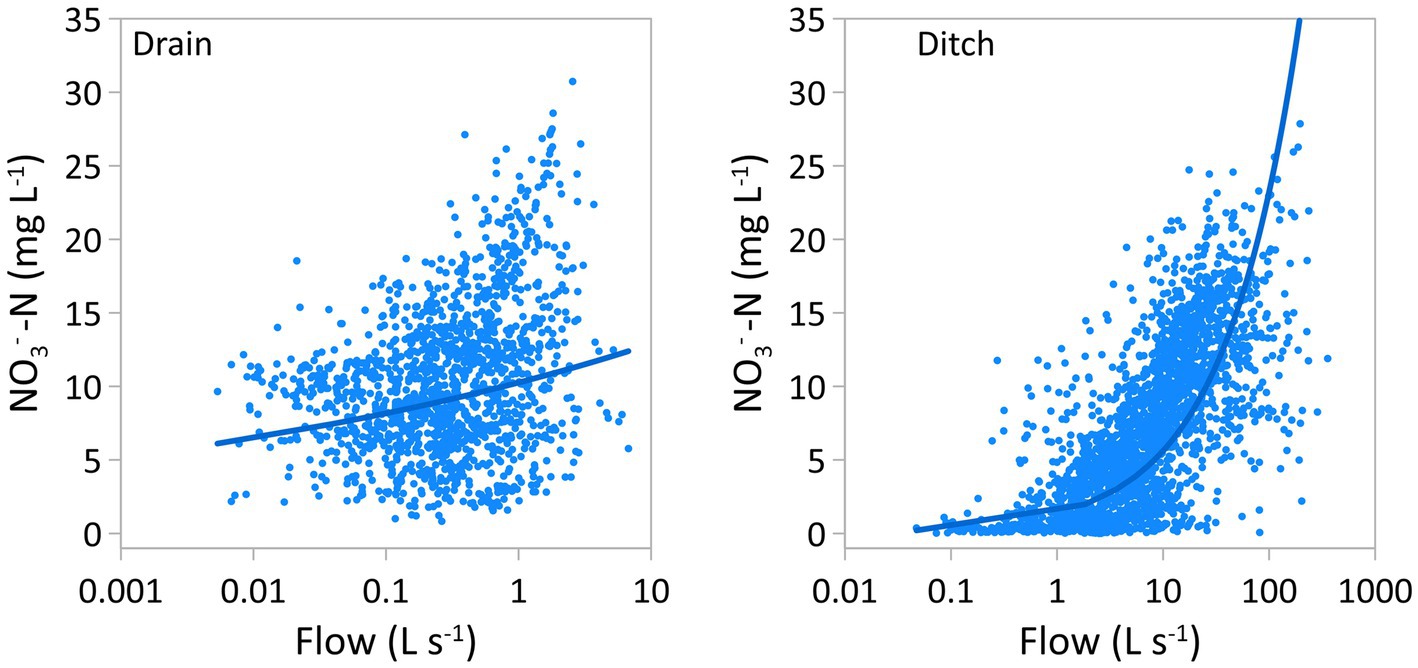
Figure 3. Relationships between NO3−-N concentrations and flow rates at the collector drain (left) and the ditch (right).
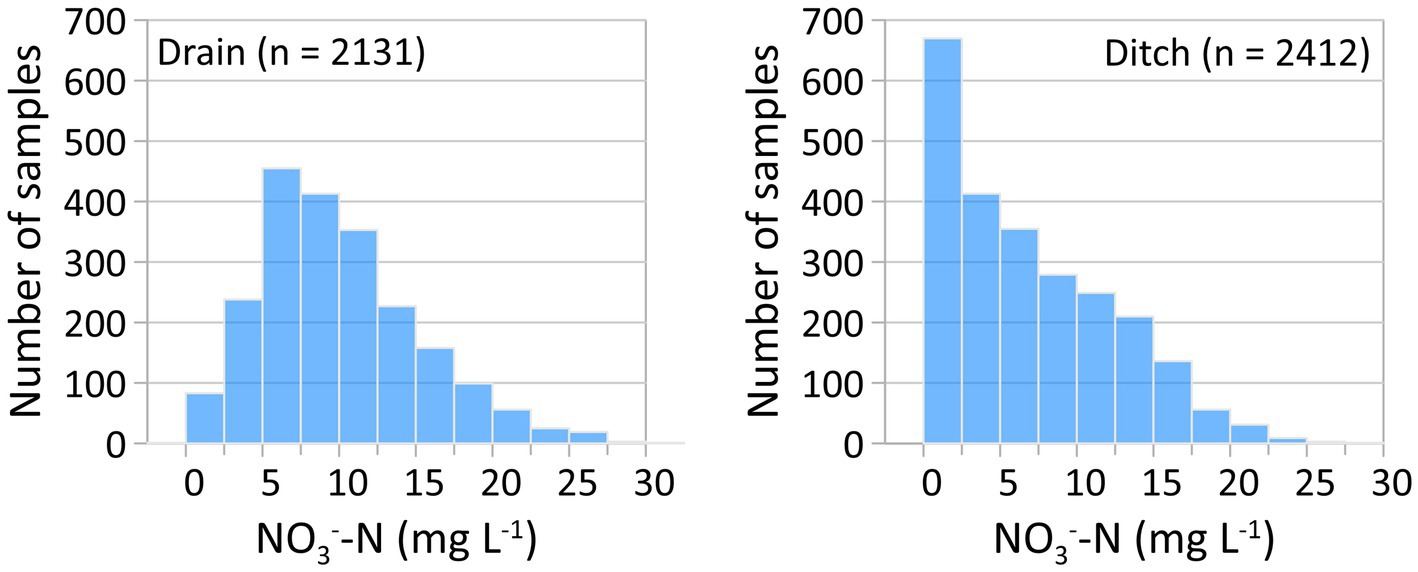
Figure 4. Histograms of NO3−-N concentrations at the collector drain (left) and the ditch (right).
In summary, both flow patterns and the dynamic behavior of NO3−-N concentrations at the collector drain and in the ditch exhibit a high temporal parallelism (Figure 2), emphasizing the significance of the artificial drainage system in discharge generation. Furthermore, it identifies the drainage system as a notable source of NO3-losses at larger spatial scales such as ditches, which confirms an earlier study conducted in the same study area analyzing a 3-years period of time (Tiemeyer et al., 2006).
3.2 Discharge and nitrate loads
NO3−-N loads (Equation 1) were clearly driven by discharge. This holds true both for a daily and for an annual evaluation (Figure 5). The relationship between flow and NO3−-N losses was even stronger compared to NO3−-N concentrations. Annual NO3−-N loads varied greatly. Highest annual NO3−-N loads were observed at the collector drain (50 kg ha−1) and at the ditch (52 kg ha−1) in 2007 followed by very high loads in 2011, while NO3−-N loads were lowest in 2019. In that year, no NO3−-N was transported via the collector drain, since the collector drain did not carry any water and annual NO3−-N load was 1 kg ha−1 at the ditch. These 2 years reflect extreme weather conditions. The high NO3−-N loads in 2007 and 2011 were mainly caused by very wet conditions in summer, while the low NO3−-N loads in 2019 were a result of a prolonged drought period in 2018. Mean annual loads at the collector drain (19.7 kg ha−1) and the ditch (19.9 kg ha−1) were similar.
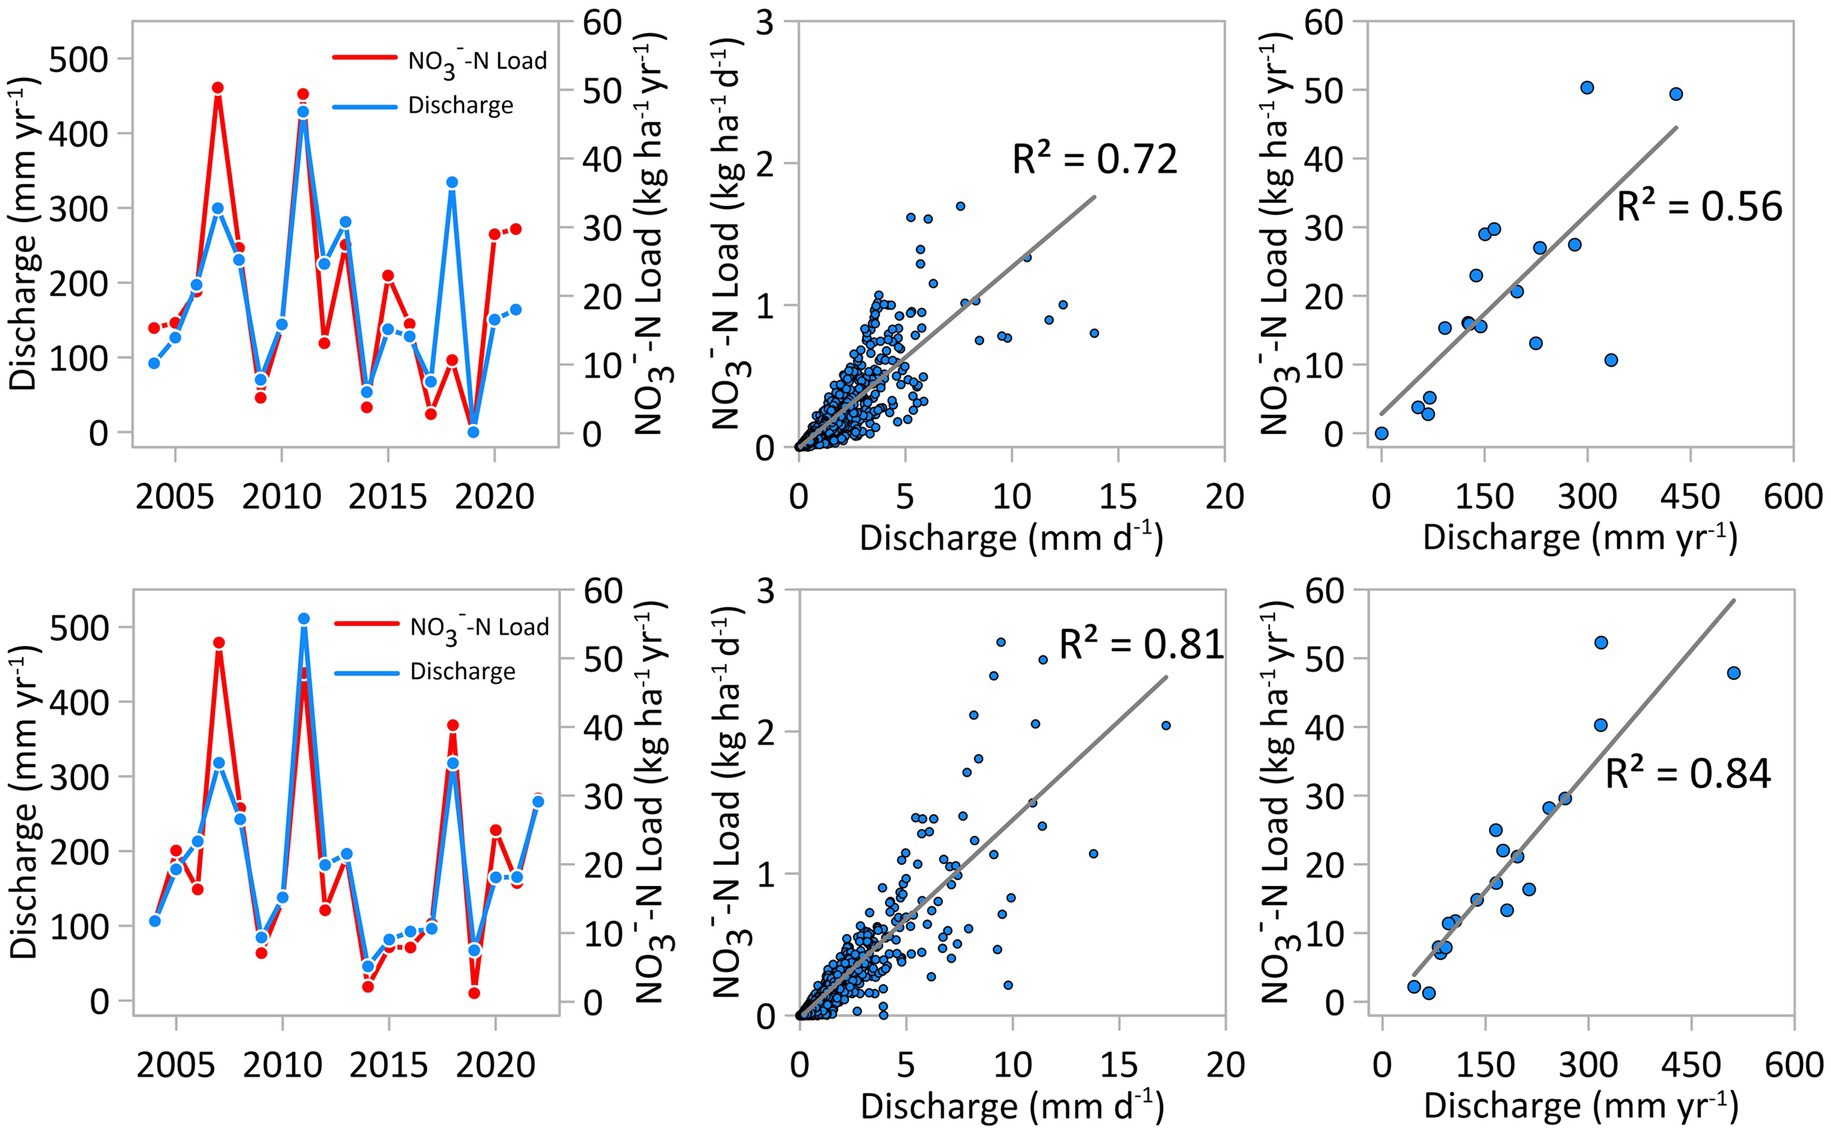
Figure 5. Annual discharge and NO3−-N loads at the collector drain and the ditch and daily and annual relationships between these two parameters.
Due to the strong relationship between flow and NO3−-N loads it is not surprising that NO3−-N loads follow a pronounced seasonal pattern (Figure 6). High discharge rates in winter, in particular in January, February and March, caused high NO3−-N loads during that time. Consequently, highest monthly NO3−-N loads were recorded in January, both at the collector drain (4.7 kg ha−1) and at the ditch (4.4 kg ha−1), while NO3−-N loads were lowest in October at the collector drain (0.2 kg ha−1) and in September at the ditch (0.3 kg ha−1).
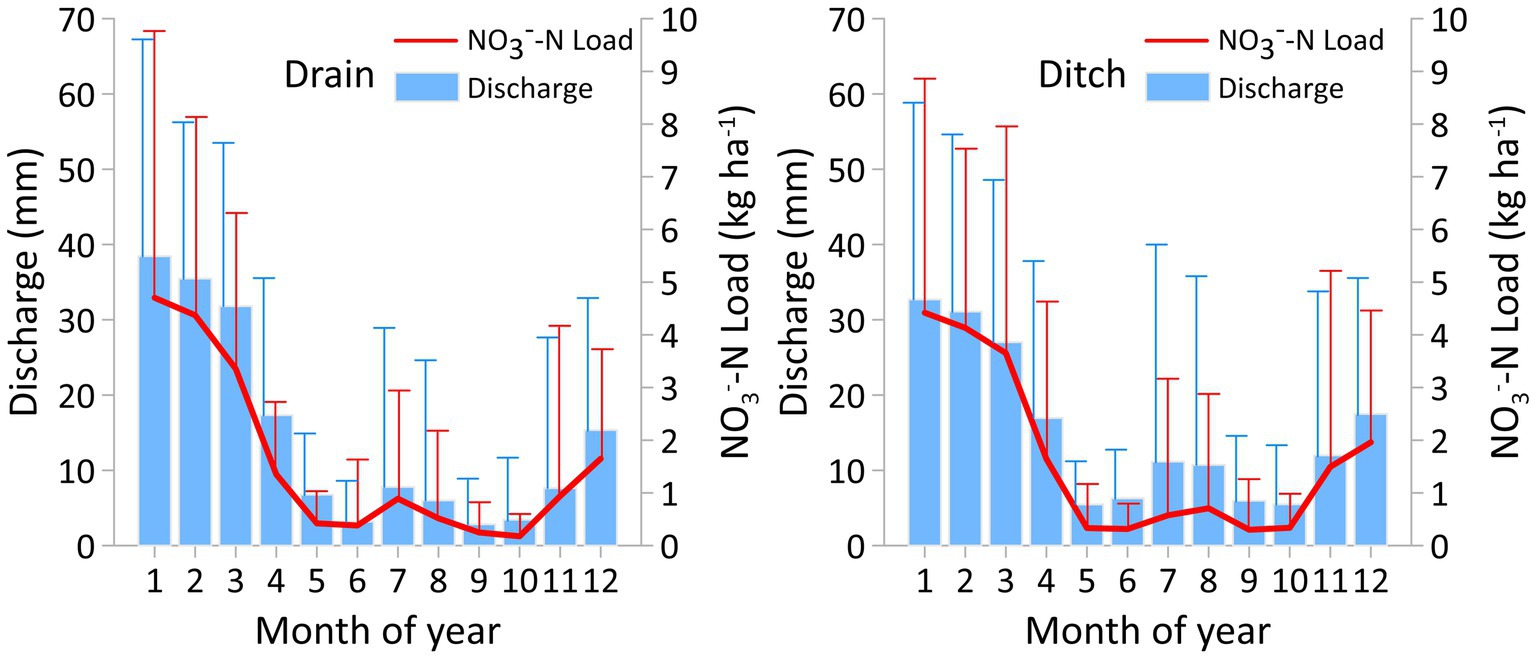
Figure 6. Mean monthly discharge and NO3−-N loads at the collector drain and the ditch. The vertical lines indicate standard deviations.
A significant amount of NO3−-N was leached during a short period of time and the majority of NO3−-N losses were restricted to winter. For example, the extraordinary high rainfall event (98 mm) on July 23, 2011 led to 10% of the annual NO3−-N load being discharged within the next 7 days. To underpin the importance of seasonality of NO3−-N leaching, it should be noted that 65 and 61% of the annual NO3−-N load is being between January and March at the collector drain and the ditch, respectively (Figure 6). These NO3−-N export mechanisms can be illustrated when the daily cumulative NO3−-N load starting with the highest load is plotted against time (Figure 7).
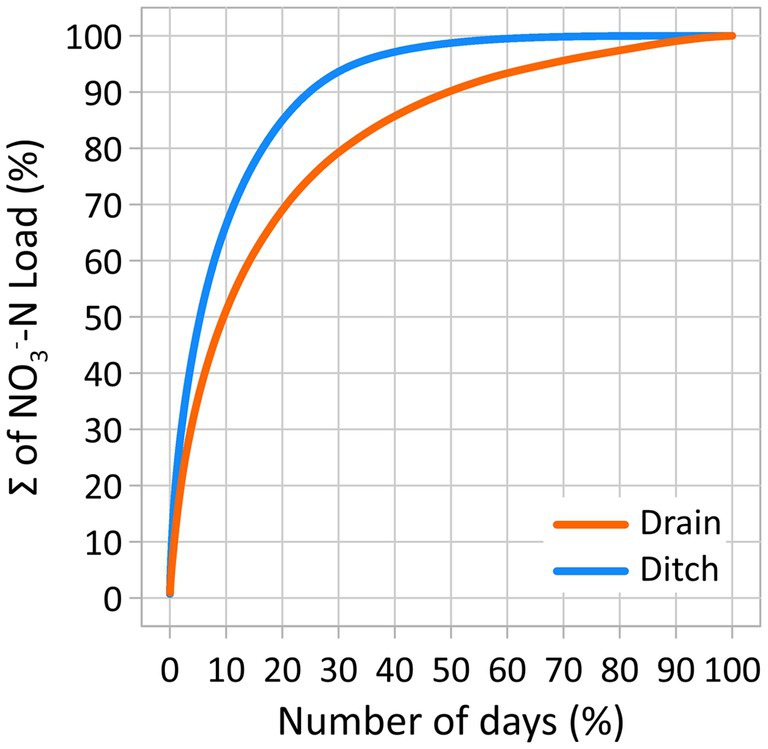
Figure 7. Daily cumulative NO3−-N loads sorted starting with the highest load as a function of time.
When analyzing Figure 7, it is striking that the majority of the NO3−-N load is being discharged during a very short period of time. Twenty-seven days (out of 4,259 discharge days) with the highest NO3−-N loads were enough to contribute 10% of the total load at the collector drain. Even more extreme, 22 days out of 6,679 discharge days contributed to 10% of NO3−-N load at the ditch. 50% of the total NO3−-N load was discharged, when 10 and 5% of the considered time period has passed at the collector drain and the ditch, respectively. At the other end of the spectrum, it can be stated that only 10% of the total NO3−-N load is being discharged in 50 and 75% of the total time at the collector drain and the ditch, respectively. The graph of the collector drain in Figure 7 is flattened compared to the graph of the ditch. This is mainly because there is no flow and therefore no NO3−-N leaching at the collector drain in summer with very low NO3−-N loads. Generally, the range of the NO3−-N loads at the collector drain is smaller compared to the ditch due to missing low summer values.
3.3 Nitrogen soil surface budget and nitrate export
From 2001 to 2022, The N input at the drainage plot ranged from 40 kg ha−1 year−1 to 275 kg ha−1 year−1, while the N input varied from 109 kg ha−1 year−1 to 228 kg ha−1 year−1 in the ditch catchment. N output ranged from 26 to 232 kg ha−1 year−1 and from 99 to 163 kg ha−1 year−1 for the drainage plot and the ditch catchment, respectively. These values align with typical conventional farming practices in northeastern Germany. N soil surface budgets (Equation 2) in our study area mostly exhibited positive values due to higher input than export through harvest (Figure 8 and Table 1). Notably, the ditch catchment exhibited less variability in N input, output, and soil surface budgets, benefiting from the inclusion of four fields with different cultivation practices instead of one single field (drainage plot). When the cumulative N soil surface budgets and NO3−-N losses via the collector drain and the ditch over the course of the study period are subtracted, a surplus of 295 kg N (drainage plot) and 268 kg N (ditch catchment) is evident. This suggests a long-term accumulation of N in the soils despite the fact that, based on the prevailing soil types and impact of groundwater, ca. 10–30 kg N ha−1 year−1 may have been lost through denitrification (Kreins et al., 2010). NO3−-rich soil water is potentially available for leaching and becomes active when the groundwater table rises. This probably explains the observed seasonal patterns of NO3−-N concentrations and the positive relationships between flow and NO3−-N concentrations in our study catchment. The significance of groundwater head in nitrate export has been highlighted in previous studies (Musolff et al., 2016).
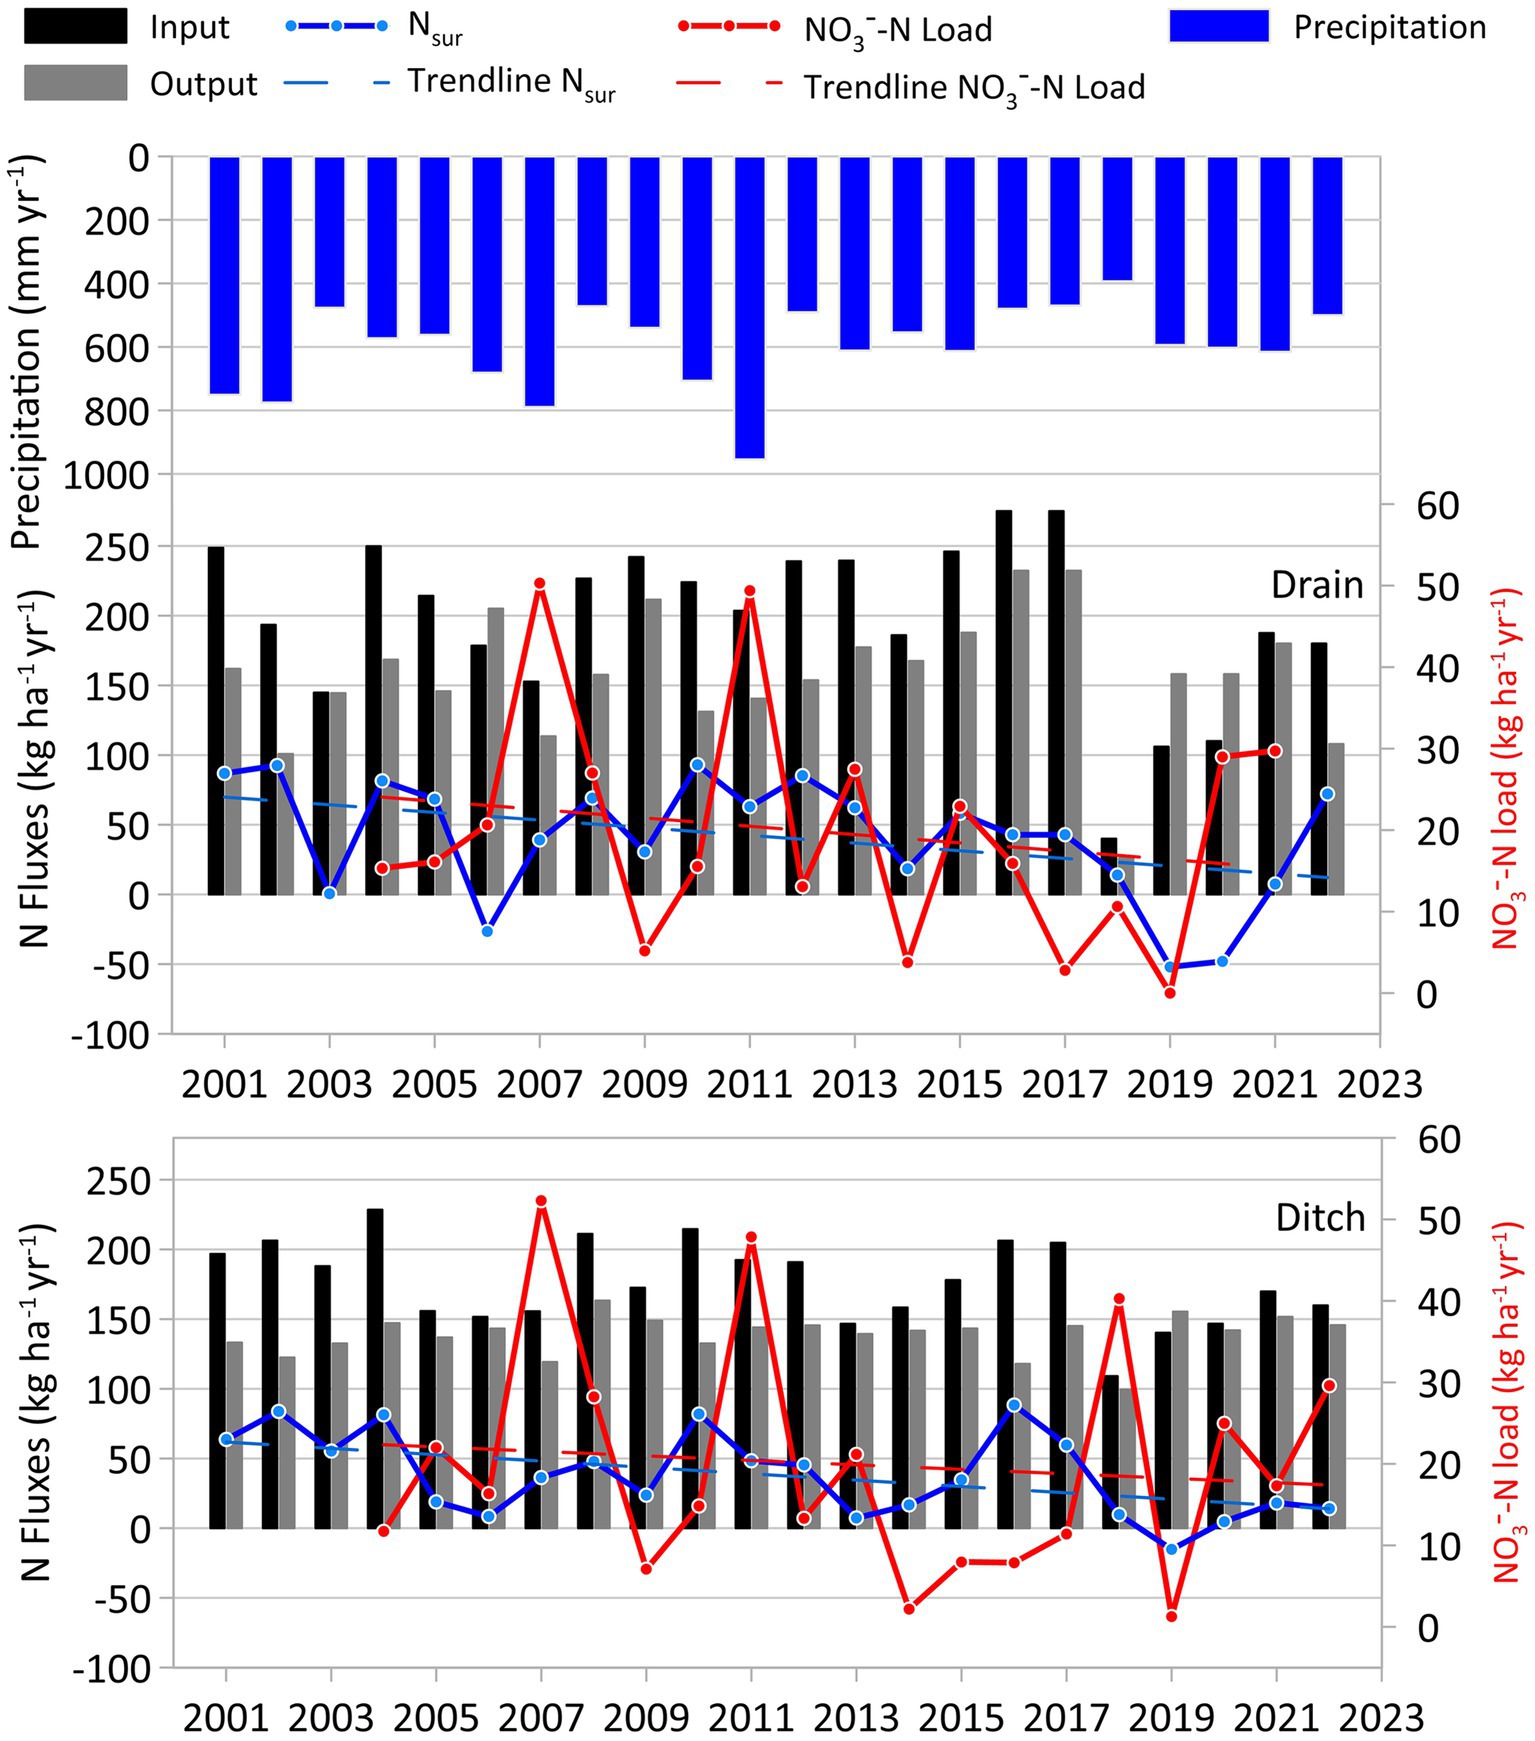
Figure 8. N input, N output, N soil surface budget (Nsur) and NO3−-N loads for the drainage plot (above) and the ditch catchment (below) and annual precipitation.
NO3−-N loads were completely independent from the N management on the arable fields and highest loads were observed during the wettest years 2007 and 2011 (Figure 8). In contrast to findings in other studies (Larsson and Jarvis, 1999; Ford et al., 2018; Liu et al., 2022), our results confirm earlier studies of our working group, in which no direct relationships between the N soil surface budget and N export (Bauwe et al., 2020) was identified. Contrarily, NO3-export in our study catchment and also in other catchments of the Baltic Sea Region (Bechmann et al., 2014) appear to be entirely independent of N fertilizer application rates and is solely driven by hydro-meteorological factors.
3.4 Implications for catchment management
The data analysis in this study had two significant findings. Firstly, the previously described seasonal fluctuations in NO3−-N concentrations and discharge had profound implications for NO3-export. Considering the entire time frame, the majority of NO3−-N has been lost via the collector drain or the ditch during a very short period (Figure 7). Secondly, no direct relationships between N soil surface budget and NO3-export were discerned at either the drainage plot or the ditch (Figure 8). Although the N soil surface budget generally exhibited a decreasing trend, this reduction did not correlate with changes in NO3−-N concentrations (Figure 2).
These findings have implications for a catchment management aiming at mitigating NO3−-N losses. Efforts should be intensified to further reduce the N surplus. While there is an overarching trend in Germany and other European countries toward gradually decreasing agricultural N surplus (Batool et al., 2022), it is important to recognize that the positive impact on riverine NO3-export may take many years to materialize. The predominant reason for this prolonged delay, known as the “N legacy effect,” refers to the enduring accumulation of N in the root zone (Van Meter et al., 2016). The long-term N accumulation in the upper soil layers might also explain, why there are no functional seasonal relationships between agricultural activities such as N fertilization and NO3−-N concentrations in our study area. In contrast, there are instances, in which NO3−-transport in the river was affected by seasonal changes of the N soil system budgets (Pinardi et al., 2022). Under climate change conditions, both NO3−-N export mechanisms and biogeochemical cycles may change, which makes predictions regarding NO3−-N losses difficult. On the one hand, expected wetter winters in Central Europe (Frei et al., 2006) will probably lead to increased NO3−-N loads because of elevated discharge in winter. On the other hand, rising temperatures will presumably result in higher denitrification rates (de Klein et al., 2017), which will might have a positive effect on NO3−-N concentrations and loads in surface waters. For example, a downward trend in N export during the last three decades was observed for the Po River in Italy, and it was associated with an upward trend in water temperature along with enhanced denitrification rates (Soana et al., 2024).
To expedite the transition to a sustainable N management in agricultural catchments, technical measures should be implemented. Given that artificial drainage systems exert significant control over the hydrology and hydrochemistry of larger scales (Tiemeyer et al., 2006), reduction measures should primarily target drainage plot outlets. Effective strategies may include the establishment of constructed wetlands (Kovacic et al., 2000; Crumpton et al., 2020; Mitchell et al., 2023) or the implementation of reactive barriers (Christianson et al., 2012, 2021; Mitchell et al., 2023). Both approaches also have the potential to mitigate high flows, thereby positively influencing NO3−-N concentrations during discharge events. However, in the scientific literature it is also argued that conservation practices (less fertilization, crop rotation etc.) possibly lead to faster success than controlled drainage, bioreactors, or saturated buffers (Liu et al., 2022).
Because of remaining uncertainties, probably the best approach for a sustainable N management in agricultural catchments is the implementation and strengthening of conservation practices together with technical solutions in hot spot areas.
4 Conclusion
In conclusion, our two-decade-long intensive monitoring of hydrology and NO3-export in a nested tile-drained agricultural catchment has provided insights into the complex dynamics of N losses from agricultural land. The main findings of this investigation can be summarized as follows:
(1) Seasonal NO3-export: the study revealed distinct seasonal patterns in NO3− concentrations and export, with elevated levels during winter months. NO3-export dynamics were closely linked to hydro-meteorological conditions, which underlines the significant influence of weather and hydrologic factors on NO3-losses. The majority of the annual NO3− load was transported within a few days, highlighting the episodic nature of NO3-export in the catchment.
(2) Limited influence of N soil Surface budgets: surprisingly, no direct relationships were found between N soil surface budgets and NO3-losses. The temporal dynamics of NO3-export were primarily determined by hydro-meteorological conditions.
(3) Implications for catchment management: the findings underscore the challenges in mitigating NO3-losses from agricultural land, suggesting that reductions in N surplus may take years to have a positive effect on NO3− concentrations due to the “N legacy effect.” Effective catchment management strategies should consider the impact of artificial drainage systems on NO3-export and focus on hot spot areas, possibly through the implementation of technical measures such as constructed wetlands or reactive barriers, in conjunction with conservation practices.
Data availability statement
The raw data supporting the conclusions of this article will be made available by the authors, without undue reservation.
Author contributions
AB: Conceptualization, Formal analysis, Methodology, Writing – original draft. BL: Conceptualization, Supervision, Writing – review & editing.
Funding
The author(s) declare that no financial support was received for the research, authorship, and/or publication of this article.
Acknowledgments
The authors would like to thank Marianne Kietzmann and Evelyn Bolzmann for the extensive chemical analyses and Tilo Hartwig for his assistance with the fieldwork.
Conflict of interest
The authors declare that the research was conducted in the absence of any commercial or financial relationships that could be construed as a potential conflict of interest.
Publisher’s note
All claims expressed in this article are solely those of the authors and do not necessarily represent those of their affiliated organizations, or those of the publisher, the editors and the reviewers. Any product that may be evaluated in this article, or claim that may be made by its manufacturer, is not guaranteed or endorsed by the publisher.
Footnotes
References
Abbott, B. W., Moatar, F., Gauthier, O., Fovet, O., Antoine, V., and Ragueneau, O. (2018). Trends and seasonality of river nutrients in agricultural catchments: 18 years of weekly citizen science in France. Sci. Total Environ. 624, 845–858. doi: 10.1016/j.scitotenv.2017.12.176
Ascott, M. J., Gooddy, D. C., Wang, L., Stuart, M. E., Lewis, M. A., Ward, R. S., et al. (2017). Global patterns of nitrate storage in the vadose zone. Nat. Commun. 8:1416. doi: 10.1038/s41467-017-01321-w
Barnes, R. T., and Raymond, P. A. (2010). Land-use controls on sources and processing of nitrate in small watersheds: insights from dual isotopic analysis. Ecol. Appl. 20, 1961–1978. doi: 10.1890/08-1328.1
Batool, M., Sarrazin, F. J., Attinger, S., Basu, N. B., Van Meter, K., and Kumar, R. (2022). Long-term annual soil nitrogen surplus across Europe (1850–2019). Sci. Data 9:612. doi: 10.1038/s41597-022-01693-91
Bauwe, A., Kahle, P., and Lennartz, B. (2016). Hydrologic evaluation of the curve number and Green and Ampt infiltration methods by applying Hooghoudt and Kirkham tile drain equations using SWAT. J. Hydrol. 537, 311–321. doi: 10.1016/j.jhydrol.2016.03.054
Bauwe, A., Kahle, P., Tiemeyer, B., and Lennartz, B. (2020). Hydrology is the key factor for nitrogen export from tile-drained catchments under consistent land-management. Environ. Res. Lett. 15:094050. doi: 10.1088/1748-9326/aba580
Bauwe, A., Tiemeyer, B., Kahle, P., and Lennartz, B. (2015). Classifying hydrological events to quantify their impact on nitrate leaching across three spatial scales. J. Hydrol. 531, 589–601. doi: 10.1016/j.jhydrol.2015.10.069
Bechmann, M., Blicher-Mathiesen, G., Kyllmar, K., Iital, A., Lagzdins, A., and Salo, T. (2014). Nitrogen application, balances and their effect on water quality in small catchments in the Nordic–Baltic countries. Agric. Ecosyst. Environ. 198, 104–113. doi: 10.1016/j.agee.2014.04.004
BMUB (2017). ‘Nitratbericht 2016 - Gemeinsamer Bericht der Bundesministerien für Umwelt, Naturschutz, Bau und Reaktorsicherheit sowie für Ernährung und Landwirtschaft’. Available at: www.bmu.de/fileadmin/Daten_BMU/Download_PDF/Binnengewaesser/nitratbericht_2016_bf.pdf (Accessed March 01, 2024).
Bouraoui, F., and Grizzetti, B. (2011). Long term change of nutrient concentrations of rivers discharging in European seas. Sci. Total Environ. 409, 4899–4916. doi: 10.1016/j.scitotenv.2011.08.015
Chen, D., Shen, H., Hu, M., Wang, J., Zhang, Y., and Dahlgren, R. A. (2018). Legacy nutrient dynamics at the watershed scale: principles, modeling, and implications. Adv. Agron. 149, 237–313. doi: 10.1016/bs.agron.2018.01.005
Christianson, L., Bhandari, A., Helmers, M., Kult, K., Sutphin, T., and Wolf, R. (2012). Performance evaluation of four field-scale agricultural drainage denitrification bioreactors in Iowa. Trans. ASABE 55, 2163–2174. doi: 10.13031/2013.42508
Christianson, L. E., Cooke, R. A., Hay, C. H., Helmers, M. J., Feyereisen, G. W., Ranaivoson, A. Z., et al. (2021). Effectiveness of denitrifying bioreactors on water pollutant reduction from agricultural areas. Trans. ASABE 64, 641–658. doi: 10.13031/trans.14011
Crumpton, W. G., Stenback, G. A., Fisher, S. W., Stenback, J. Z., and Green, D. I. S. (2020). Water quality performance of wetlands receiving nonpoint-source nitrogen loads: nitrate and total nitrogen removal efficiency and controlling factors. J. Environ. Qual. 49, 735–744. doi: 10.1002/jeq2.20061
de Klein, J. J. M., Overbeek, C. C., Juncher Jørgensen, C., and Veraart, A. J. (2017). Effect of temperature on oxygen profiles and denitrification rates in freshwater sediments. Wetlands 37, 975–983. doi: 10.1007/s13157-017-0933-1
Dupas, R., Jomaa, S., Musolff, A., Borchardt, D., and Rode, M. (2016). Disentangling the influence of hydroclimatic patterns and agricultural management on river nitrate dynamics from sub-hourly to decadal time scales. Sci. Total Environ. 571, 791–800. doi: 10.1016/j.scitotenv.2016.07.053
DüV . (1996). Verordnung über die Grundsätze der guten fachlichen Praxis beim Düngen (Düngeverordnung) Bundesgesetzblatt 1996 Teil 1 Nr. 6. Bonn, Germany: Federal ministry of Justice.
DüV . (2006). Verordnung über die Anwendung von Düngemitteln, Bodenhilfsstoffen, Kultursubstraten und Pflanzenhilfsmitteln nach den Grundsätzen der guten fachlichen Praxis beim Düngen (Düngeverordnung—düV) Bundesgesetzblatt 2006 Teil 1 Nr. 2. Bonn, Germany: Federal ministry of Justice.
DüV (2017). Verordnung über die Anwendung von Düngemitteln, Bodenhilfsstoffen, Kultursubstraten und Pflanzenhilfsmitteln nach den Grundsätzen der guten fachlichen Praxis beim Düngen (Düngeverordnung—düV) Bundesgesetzblatt I S. Bonn: Federal ministry of Justice, 1305.
EC (1991). Council directive 91/676/EEC of 12 December 1991 concerning the protection of waters against pollution caused by nitrates from agricultural sources. Off. J. Eur. Commun. L 375, 1–8.
EC (2000). Directive 2000/60/EC of the European Parliament and of the council of 23 October 2000 establishing a framework for community action in the field of water policy. Off. J. Eur. Commun. L 327, 1–72.
Exner-Kittridge, M., Strauss, P., Blöschl, G., Eder, A., Saracevic, E., and Zessner, M. (2016). The seasonal dynamics of the stream sources and input flow paths of water and nitrogen of an Austrian headwater agricultural catchment. Sci. Total Environ. 542, 935–945. doi: 10.1016/j.scitotenv.2015.10.151
Feinson, L. S., Gibs, J., Imbrigiotta, T. E., and Garrett, J. D. (2016). Effects of land use and sample location on nitrate-stream flow hysteresis descriptors during storm events. J. Am. Water Resour. Assoc. 52, 1493–1508. doi: 10.1111/1752-1688.12477
Ford, W. I., King, K., and Williams, M. R. (2018). Upland and in-stream controls on baseflow nutrient dynamics in tile-drained agroecosystem watersheds. J. Hydrol. 556, 800–812. doi: 10.1016/j.jhydrol.2017.12.009
Frei, C., Schöll, R., Fukutome, S., Schmidli, J., and Vidale, P. L. (2006). Future change of precipitation extremes in Europe: Intercomparison of scenarios from regional climate models. J. Geophys. Res. Atmos. 111:D06105. doi: 10.1029/2005JD005965
Fučík, P., Kaplická, M., Kvítek, T., and Peterková, J. (2012). Dynamics of stream water quality during snowmelt and rainfall–runoff events in a small agricultural catchment. Clean - Soil Air Water 40, 154–163. doi: 10.1002/clen.201100248
HELCOM (2007). Baltic Sea Action Plan, HELCOM Ministerial Meeting. Krakow, Poland: November 15, 2007. Available at: http://helcom.fi/baltic-sea-action-plan. (Accessed January 2, 2024)
Inamdar, S. P., Christopher, S. F., and Mitchell, M. J. (2004). Export mechanisms for dissolved organic carbon and nitrate during summer storm events in a glaciated forested catchment in New York, USA. Hydrol. Process. 18, 2651–2661. doi: 10.1002/hyp.5572
Kovacic, D. A., David, M. B., Gentry, L. E., Starks, K. M., and Cooke, R. A. (2000). Effectiveness of constructed wetlands in reducing nitrogen and phosphorus export from agricultural tile drainage. J. Environ. Qual. 29, 1262–1274. doi: 10.2134/jeq2000.00472425002900040033x
Kreins, P., Behrendt, H., Gömann, H., Heidecke, C., Hirt, U., Kunkel, R., et al. (2010). Analyse von Agrar- und Umweltmaßnahmen im Bereich des landwirtschaftlichen Gewässerschutzes vor dem Hintergrund der EG-Wasserrahmenrichtlinie in der Flussgebietseinheit Weser. Braunschweig: Johann Heinrich von Thünen-Institut, Sonderheft, 180.
Larsson, M. H., and Jarvis, N. J. (1999). A dual-porosity model to quantify macropore flow effects on nitrate leaching. J. Environ. Qual. 28, 1298–1307. doi: 10.2134/jeq1999.00472425002800040034x
Liu, W., Tian, S., Youssef, M. A., Birgand, F. P., and Chescheir, G. M. (2022). Patterns of long-term variations of nitrate concentration—stream discharge relationships for a drained agricultural watershed in mid-western USA. J. Hydrol. 614:128479. doi: 10.1016/j.jhydrol.2022.128479
Malone, T. C., and Newton, A. (2020). The globalization of cultural eutrophication in the coastal ocean: causes and consequences. Front. Mar. Sci. 7:670. doi: 10.3389/fmars.2020.00670
Mayer, B., Boyer, E. W., Goodale, C., Jaworski, N. A., van Breemen, N., Howarth, R. W., et al. (2002). Sources of nitrate in rivers draining sixteen watersheds in the northeastern U.S.: isotopic constraints. Biogeochemistry 57–58, 171–197. doi: 10.1023/A:1015744002496
Mitchell, M. E., Newcomer-Johnson, T., Christensen, J., Crumpton, W., Dyson, B., Canfield, T. J., et al. (2023). A review of ecosystem services from edge-of-field practices in tile-drained agricultural systems in the United States Corn Belt Region. J. Environ. Manag. 348:119220. doi: 10.1016/j.jenvman.2023.119220
MLUV-MV (2008). Richtwerte für die Untersuchung und Beratung zur Umsetzung der Düngeverordnung in Mecklenburg-Vorpommern. Ministry of Agriculture, Environment and Consumer Protection. Mecklenburg-Western Pomerania, Schwerin, Germany. Available at: https://docplayer.org/24828635-Richtwerte-fuer-die-untersuchung-und-beratung-zur-umsetzung-der-duengeverordnung-in-mecklenburg-vorpommern.html. (Accessed January 5, 2024)
MLUV-MV (2019). Richtwerte für die Untersuchung und Beratung zur Umsetzung der Düngeverordnung vom 26. Mai 2017 in Mecklenburg-Vorpommern. Ministry of Agriculture, Environment and Consumer Protection. Mecklenburg-Western Pomerania, Schwerin, Germany. Available at: https://www.lms-beratung.de/export/sites/lms/de/.galleries/Downloads_LFB/DueV/DueV-Richtwerte-MV190114.pdf. (Accessed January 5, 2024)
Moatar, F., and Meybeck, M. (2005). Compared performances of different algorithms for estimating annual nutrient loads discharged by the eutrophic river Loire. Hydrol. Process. 19, 429–444. doi: 10.1002/hyp.5541
Musolff, A., Schmidt, C., Rode, M., Lischeid, G., Weise, S. M., and Fleckenstein, J. H. (2016). Groundwater head controls nitrate export from an agricultural lowland catchment. Adv. Water Resour. 96, 95–107. doi: 10.1016/j.advwatres.2016.07.003
Nava, V., Patelli, M., Rotiroti, M., and Leoni, B. (2019). An R package for estimating river compound load using different methods. Environ. Model. Softw. 117, 100–108. doi: 10.1016/j.envsoft.2019.03.012
Oelsner, G. P., and Stets, E. G. (2019). Recent trends in nutrient and sediment loading to coastal areas of the conterminous U.S.: insights and global context. Sci. Total Environ. 654, 1225–1240. doi: 10.1016/j.scitotenv.2018.10.437
OSPAR (1992). Convention for the protection of the marine environment of the North-East Atlantic. Available at: https://www.ospar.org/site/assets/files/1290/ospar_convention.pdf. (Accessed January 2, 2024)
Pinardi, M., Soana, E., Severini, E., Racchetti, E., Celico, F., and Bartoli, M. (2022). Agricultural practices regulate the seasonality of groundwater-river nitrogen exchanges. Agric. Water Manag. 273:107904. doi: 10.1016/j.agwat.2022.107904
Pionke, H. B., Gburek, W. J., Schnabel, R. R., Sharpley, A. N., and Elwinger, G. F. (1999). Seasonal flow, nutrient concentrations and loading patterns in stream flow draining an agricultural hill-land watershed. J. Hydrol. 220, 62–73. doi: 10.1016/S0022-1694(99)00064-5
Poor, C. J., and McDonnell, J. J. (2007). The effects of land use on stream nitrate dynamics. J. Hydrol. 332, 54–68. doi: 10.1016/j.jhydrol.2006.06.022
Soana, E., Gervasio, M. P., Granata, T., Colombo, D., and Castaldelli, G. (2024). Climate change impacts on eutrophication in the Po River (Italy): temperature-mediated reduction in nitrogen export but no effect on phosphorus. J. Environ. Sci. 143, 148–163. doi: 10.1016/j.jes.2023.07.008
Tiemeyer, B., Kahle, P., and Lennartz, B. (2006). Nutrient losses from artificially drained catchments in North-Eastern Germany at different scales. Agric. Water Manag. 85, 47–57. doi: 10.1016/j.agwat.2006.03.016
Tomer, M. D., Meek, D. W., Jaynes, D. B., and Hatfield, J. L. (2003). Evaluation of nitrate nitrogen fluxes from a tile-drained watershed in Central Iowa. J. Environ. Qual. 32, 642–653. doi: 10.2134/jeq2003.6420
UBA . (2018). Daten zur Umwelt. Umwelt und Landwirtschaft. Umweltbundesamt. Dessau. Available at: www.umweltbundesamt.de/sites/default/files/medien/376/publikationen/uba_dzu2018_umwelt_und_landwirtschaft_web_bf_v7.pdf. (Accessed August 1, 2019)
Van Meter, K. J., Basu, N. B., Veenstra, J. J., and Burras, C. L. (2016). The nitrogen legacy: emerging evidence of nitrogen accumulation in anthropogenic landscapes. Environ. Res. Lett. 11:035014. doi: 10.1088/1748-9326/11/3/035014
Keywords: agriculture, nitrate, nitrogen, long-term monitoring, soil surface budget, tile drainage agriculture, tile drainage
Citation: Bauwe A and Lennartz B (2024) Insights gained from two decades of intensive monitoring: hydrology and nitrate export in a tile-drained agricultural catchment. Front. Water. 6:1369552. doi: 10.3389/frwa.2024.1369552
Edited by:
Qian Zhang, University of Maryland, College Park, United StatesReviewed by:
Elisa Soana, University of Ferrara, ItalyMaría Luz Rodríguez, University of A Coruña, Spain
Copyright © 2024 Bauwe and Lennartz. This is an open-access article distributed under the terms of the Creative Commons Attribution License (CC BY). The use, distribution or reproduction in other forums is permitted, provided the original author(s) and the copyright owner(s) are credited and that the original publication in this journal is cited, in accordance with accepted academic practice. No use, distribution or reproduction is permitted which does not comply with these terms.
*Correspondence: Andreas Bauwe, YW5kcmVhcy5iYXV3ZUB1bmktcm9zdG9jay5kZQ==