 Lukas Bouman1
 Dorothee Spuhler2*Marc-André Bünzli3
 Amancio Melad III4,5
 Lamine Diop6
 Osmar Coelho7
 Regula Meierhofer1*
- 1Department of Sanitation, Water and Waste for Development, Swiss Federal Institute of Aquatic Science and Technology (Eawag), Duebendorf, Switzerland
- 2UMTEC Institut für Umwelt- und Verfahrenstechnik, University of Applied Sciences of Eastern Switzerland (OST), Rapperswil, Switzerland
- 3Thematic Cooperation Water, Swiss Agency for Development and Cooperation, Bern, Switzerland
- 4UNESCO-IHE Institute for Water Education, Delft, Netherlands
- 5De La Salle University (DLSU), Manila, Philippines
- 6Gaston Berger University, Saint-Louis, Senegal
- 7Center for Sustainable Development, Brasilia Federal University, Brasilia, Brazil
Introduction: The Water Flow Diagram (WFD) is a novel advocacy and communication tool that presents urban water supply and management in a simple visualization. Rapid urbanization, growing populations, and the climate crisis increase the pressure on water resources, particularly in urbanized areas. The WFD aims to foster a dialogue around conflict of interests and opportunities among different stakeholders, and trigger actions toward more sustainable urban water management (UWM), as well as a water secure future.
Method: The WFD is produced from data on water abstraction, water use of different sectors, water treatment, water recycling and contamination risks. The data were obtained from government services, wastewater and water utilities, large industries, universities and reports of intergovernmental organizations. If these sources did not have data, reports from NGOs or consultants, comparable contexts, default values or expert judgements were considered. The annual water flows are presented in a Sankey Diagram. An intuitive color code highlights the flows as “problematic” or “appropriate” and points to areas where UWM practices should be improved.
Results and conclusions: The final diagrams are a concise instrument that identifies challenges of UWM in the four application cases presented in this article. Key challenges that became evident included: pollution from agricultural production, the lack of wastewater and sanitation infrastructure, high water losses in the distribution networks, water exports leading to a lack in local supply and sewer overflows during heavy rainfalls. Opportunities identified were the need to: invest in sanitation and wastewater to protect resources, create coordination bodies to align conflict of interests, and/or invest in blue-green infrastructure for rainwater retention. The WFD triggered local actions, such as in-depth discussions between relevant actors, the formation of integrated water use committees and the interest of the national ministry in Senegal to replicate the diagram for other locations. This article presents the methodology, discusses the four case studies and deliberates on the prospective use of the WFD.
1 Introduction
Growing population and climate change increase the pressure on water resources, particularly in urbanized areas. The world's population exceeded eight billion in 2022 (Nandagiri, 2023) with 56% living in cities (WorldBank, 2023). The United Nations predict that 68% of the over nine billion people will live in cities by 2050 (Habitat, 2022). Urbanized areas alter the water cycle. Overall runoff volumes increase (Dunne and Leopold, 1978; Arnold Jr and Gibbons, 1996) and are less buffered than in non-urbanized areas, resulting in higher peak discharges during heavy rainfalls (Dunne and Leopold, 1978; Packman, 1980; Konrad, 2003). Due to climate change, extreme events, such as heavy rainfalls and droughts, will increase (Field, 2012). Furthermore, groundwater recharge has reduced due to an increase in impervious area (O'Driscoll et al., 2010). At the same time, groundwater abstraction has increased, particularly in developing countries, where groundwater is usually a safer alternative to surface water (McGrane, 2016). On the other hand, exfiltration from malfunctioning water supply and sewerage can increase and contaminate groundwater tables (Jacobson, 2011). On the qualitative aspects, many different contaminants originate from cities, such as heavy metals (McGrane, 2016), microbial contaminants (Kay et al., 2007), elevated nutrient loadings, volatile organic compounds, nanoparticles and micropollutants, such as pesticides, pharmaceuticals (Heberer et al., 2002) and polycyclic aromatic hydrocarbons (PAHs) from vehicular emissions (Van Metre et al., 2000).
Such stress factors impair sustainable urban water management (UWM) and restrain progress toward the Sustainable Development Goals (SDG), including SDG 6: clean water and sanitation, SDG 11: sustainable cities and communities and SDG 13: climate action. Therefore, it is important to accelerate the shift to sustainable management of urban water resources. Tools are needed to foster communication among stakeholders and to support advocacy and adequate planning decisions. A collectively created visualization of the urban water flows, including challenges and opportunities, could make a decisive contribution toward an earlier adoption of sustainable UWM schemes.
Because the sector did not have a useful tool to visualize water flows, researchers and development experts from the Swiss Community of Practice around water (Aguasan) jointly created the Water Flow Diagram (WFD). The rationale was that a well-crafted diagram could instantly and memorably communicate a connection that might otherwise demand an extensive and quickly forgettable explanation (Platts and Hua Tan, 2004). Based on this hypothesis, three criteria were defined for the diagram: it should: (i) be applicable without the need for any programming skills; (ii) allow for a quick identification of the challenges and opportunities through an easily understandable graphic, and (iii) be based on a participatory approach that includes data collection, interpretation and action planning. The main stakeholders of the participatory process should include: private and industrial water users, agricultural companies and small farmers, water related decision makers, water rights defenders, utilities, policy makers, urban planners, civil society, and NGOs.
2 Materials and methods
An extensive literature review on existing tools and instruments that visualize urban water balances led to the conception of the WFD. The tool was further developed in an iterative co-creation process through several case studies. At each step, feedback from different experts was collected and injected into the next stage of development.
2.1 Existing urban water balance tools
A selection of tools that visualize water and wastewater flows documented in literature and/or highlighted by experts in the sector is presented in Table 1.
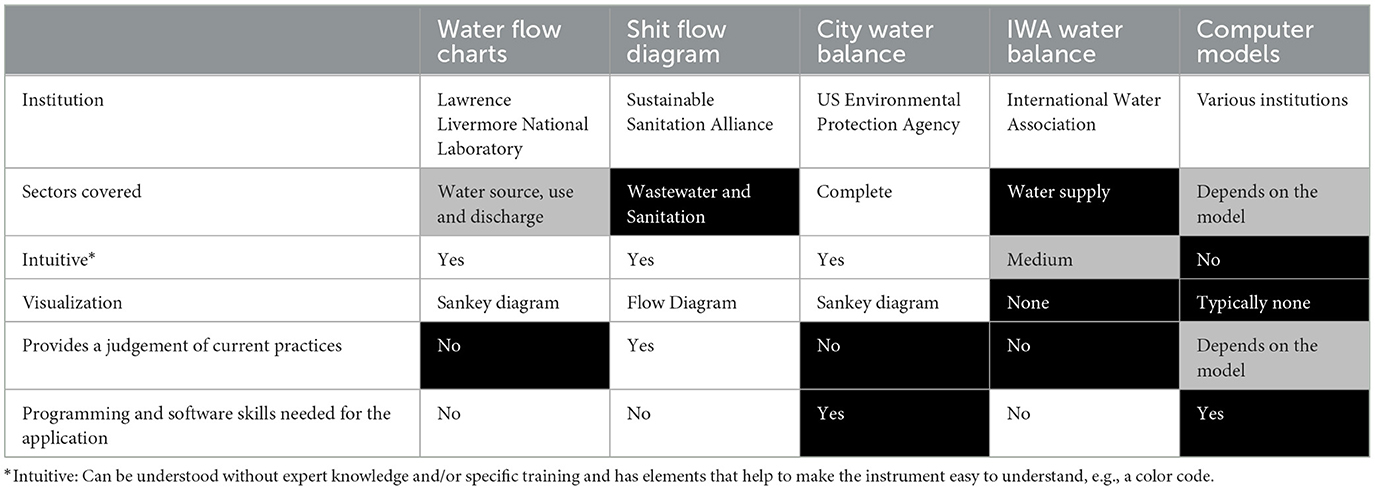
Table 1. Selection of existing urban water balance tools (white cells = favorable characteristics, gray = partly favorable characteristics, black = unfavorable characteristics).
The Water Flow Charts by the Lawrence Livermore National Laboratory use Sankey Diagrams to represent annual water balances for states or an entire country (Kaiper, 2004). They provide an intuitive overview of state-wide or nation-wide water flows in a visual format. The diagrams do not reveal whether or not the water is treated before use or discharge, nor if the management practices are appropriate. The methodology of how these water balances are put together is not publicly available.
In the sanitation sector, the Shit Flow Diagram was developed by the Sustainable Sanitation Alliance (Peal et al., 2020). It uses a flow diagram approach to visualize which proportions of the fecal sludge and wastewater in a city are safely or not safely managed. To communicate the latter, an intuitive color code is used. No special skills or programming skills are necessary to make such a diagram.
The City Water Balance by the Environmental Protection Agency of the United States uses an intuitive Sankey Diagram approach to track the major pathways of urban water. Values for data that is lacking are estimated (Erban et al., 2018). On the basis of the diagram, the viewer cannot judge whether the water management practices are appropriate or not. Since the compilation of the data is based on the software environment R, the user needs programming skills to apply it.
The Best Practice Water Balance of the International Water Association provides a useful volumetric overview for water utilities from the source to the water distribution, focusing on non-revenue water (Lambert, 2002). The output, however, is not visualized in a graphic. Neither the wastewater nor the water quality are considered in the water balance.
In addition, a variety of computer models have been developed to simulate water balances in urban areas. For example the Dynamic Urban Water Simulation Model (DUWSiM) by the University College Dublin, Ireland (Willuweit and O'Sullivan, 2013), the Urban Volume and Quality (UVQ) model by the Commonwealth Scientific and Industrial Research Organization, Australia (Mitchell and Diaper, 2006), the Water Evaluation and Planning System by the Stockholm Environment Institute, USA (Sieber and Purkey, 2015) the LiWatool by the Institute for Automation and Communication, Germany (Schütze and Robleto, 2010) and the Integrated Urban Water Model by the Colorado State University. They predict water demand and available water and/or storm water and wastewater production. Some of them include water quality. While some models simulate the micro environment (street level), others simulate the macro level (watershed). These computer-based models can be very useful for engineers, modelers and planners, but require substantial programming and software skills. Most of the models do not have visual outputs that can easily be disseminated and understood by a diverse audience.
2.2 Expert consulting
The development of the WFD tool was based on a co-creation approach. Starting with a first draft, practitioners were regularly engaged and the diagram and underlying methodology were created in an iterative process. The practitioners consulted included water and wastewater experts, WASH specialists, practitioners, water users, utility managers and graphic designers. Practitioner engagement took place through bilateral conversations on specific parts of the diagram, in two online workshops, in regular meetings of Aguasan—a Swiss community of practice of organizations working in the WASH sector—and at five different international water conferences (Stockholm World Water Week, United Nations Water Week, World Water Forum, All Systems Connect Symposium and the Global Water Operators Partnerships Alliance Congress). The inputs collected during these consultations informed the further development of the methodology.
2.3 The water flow diagram methodology
Yearly water balances are illustrated with Sankey Diagrams, which consists of “nodes” that are connected with “flows.” The width of a flow is proportional to its quantity, in this case, the annual water flow from one process to another. It is read from left to right to follow the path of the water flows along the water use chain. The unit of the volumes indicated is 1,000 m3/year. Six different functional groups for the processes were defined: source, drinking water treatment and distribution, use (domestic, public, industrial and agricultural), wastewater transport and treatment, discharge, and reuse. Inside every functional group, there are standard options to choose from corresponding to the nodes in the Sankey Diagram. The structure is presented in Figure 1. If there are significant reasons to add a node to the standard structure, it can simply be added manually.
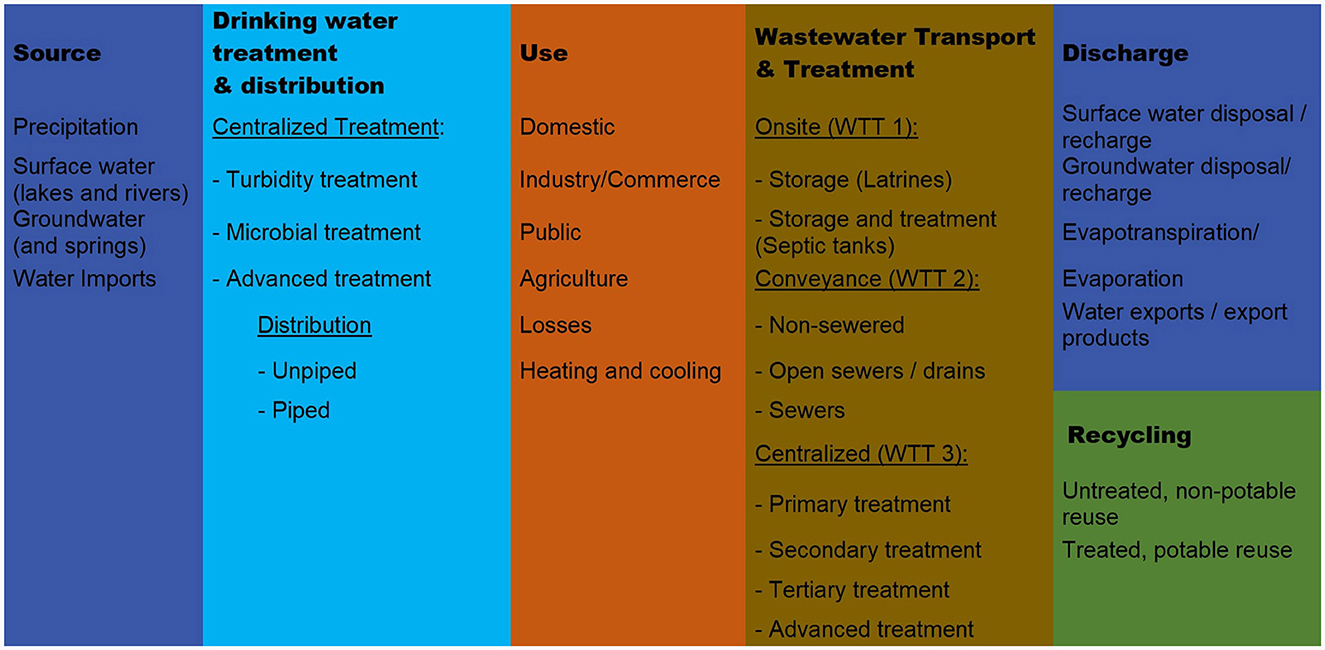
Figure 1. Structure of the Water Flow Diagram with six functional groups and the standard nodes.
The color code was defined as appropriate or problematic on the basis of the adequacy of the water quality and quantity of a flow, and its use or destination. The evaluation was done by the local project teams together with the researchers from Eawag. Four water qualities were defined: uncontaminated, microbiologically contaminated, biochemically contaminated and chemically contaminated. For every section of the water flow between two nodes, the water quality was categorized as problematic (red) or appropriate (green). For example, if microbiologically contaminated water was treated by a microbial treatment, the UWM was categorized as appropriate. However, if chemically contaminated water was treated by a microbial treatment, the UWM was categorized as problematic. Furthermore, the default output water quality for every node was defined based on the input water quality and the node itself, unless the data indicated otherwise.
If there was no information about the water quality, it was colored gray. Categorization into appropriate and problematic flows was also done regarding water quantity. For example, water losses in the distribution system of up to 10% were considered as appropriate, whereas higher losses were categorized as problematic. Furthermore, the SDG 6 principle that safely managed water needs to be available on the premises was taken into account. Therefore, unpiped water was categorized as a problematic UWM. A detailed guide to judge the appropriateness of the UWM practices for every combination of flow and node is attached to the user manual (Bouman and Spuhler, 2023). Every case study team applied this detailed guide in close exchange with the Eawag experts throughout the process.
The system boundary of a WFD is defined at the beginning of every analysis. For the cases studies presented here, the municipal boundaries or the service area of utilities were used. In systems with narrower system boundaries and a higher population density, a stronger focus is put on the assessment of water management practices in the urban areas. However, the water flows represented in a WFD always interact with the water flows, stocks, practices and water quality outside of its system boundaries. In diagrams of less densely populated areas, the assessment focuses more on the impact of large scale water use and landuse on the water availability and water quality. Even an entire catchment area of a city could be within the system boundaries of the WFD.
Various data sources can be used to compose a WFD. Potential data sources are government services, (waste) water utilities, agencies, universities and large industrial users. If higher quality data are not accessible, reports from consultants, NGOs or intergovernmental organizations might serve as data sources. If such reports are not available, estimations for default values can be drawn from comparable contexts or expert judgements. Experts included either generalists with multiple years of international experience in the water or sanitation sectors or specialists, such as employees of a water utility or members of a farmer's association with solid expertise of a specific aspect of the diagram. In all of the case studies, except for Bern, data from one particular year were used. In the case of Bern, the average values of a timeline of 5 years were used for the diagram. The validity of the data was discussed during the appropriation meeting (see procedure in the following paragraph) where all the stakeholders discussed and approved the final WFD. An important element in the validation process of a WFD was that the water flows in the diagram needed to be fully balanced. As storage of water in one node is not possible, all the water flowing into a node also has to be shown as flowing out. Basing the analysis on the water balance permits the stakeholders to analyse, discuss and recheck the quantities of water flows that are estimated, especially in cases where data of lower reliability are used.
The WFDs were composed during an iterative and participatory process. The stakeholders included the municipality and administrative authorities, utilities and technical services, different private and industrial water users, civil society, researchers, planners, and NGOs. The goal of the participatory process was to build a common understanding of the water management and its challenges. This understanding would then become the basis for broadly supported key action points. Stakeholders were involved in the initial data collection, validation of different evolving versions of the diagram, and, finally, the definition and adoption of action points. The procedure followed was different from case to case and is described in Section 2.4.
The procedure to develop a WFD consists of the following steps:
1. Ignite the process: a partner organization was found, the system boundaries defined and ideally, a support statement of the municipality obtained.
2. Collect data: data was collected from government services, wastewater and water utilities, large industries, universities, NGOs or consultants, secondary sources, or expert judgements. In some circumstances, primary data collection was conducted.
3. Draft WFD: the data was compiled in an Excel template that was then used to generate the Sankey Diagram, using an open access online tool (sankeymatic.com), which was then graphically edited in PowerPoint.
4. Conduct appropriation meeting: the draft WFD was discussed by all interested stakeholders, the main messages defined and potential indicators and actions elaborated on.
5. Finalize WFD: the diagram with the learnings from the appropriation meeting was finalized, disseminated and actions to improve the UWM were proposed.
2.4 Case studies
The following describes how WFD diagrams were developed in the four case study locations: Bern, Switzerland, Rio Pardo de Minas, Brazil, Santa Maria Bulacan, Philippines and in suburbs of Dakar, Senegal.
2.4.1 Bern, Switzerland
The capital of Switzerland was the first case study location. Bern is a relatively small city with a well-developed UWM. The city boundaries were used as system boundaries and included an area of 51 km2 and 135,000 inhabitants, corresponding to a density of 2,630 inhabitants per km2. The necessary data was readily available from the wastewater and drinking water utilites and the cantonal office and data from the years 2015–2020 were used. The participatory process in Bern, however, was not as central as in other locations since the case study served as proof of concept. The wastewater and drinking water utilites and the cantonal office were also involved in the process of defining the diagram and validating it. The Mayor of the city supported the process with a letter of support and a video message.
2.4.2 Rio Pardo de Minas, Brazil
Rio Pardo de Minas is a municipality in the northeast of the Brazilian state of Minas Gerais. Its main economic activities are agriculture and small industries. The municipal boundaries were used as system boundaries. The area included 3,130 km2 and 31,000 inhabitants, with a low population density of 10 inhabitants per km2. Information was collected from local partner organizations and from the municipality. In addition, the National Water Agency database of water use rights was consulted. The participatory process was led by the local office of a Swiss NGO. Co-creation workshops were organized with the following local organizations: the Rural Workers Union of Rio Pardo de Minas, the North of Minas Gerais Alternative Agriculture Center, and the Rio Pardo de Minas Farmers Union. The Mayor of the city supported the process and the appropriation meeting was planned at the municipality level.
2.4.3 Santa Maria Bulacan, Philippines
The municipality of Santa Maria lies in the Philippian province Bulacan. Over 90% of the economic activities are in the service sector, with marginal industry, agriculture and fishery sectors. The municipal boundaries were used as system boundaries. The areas included 91 km2 and 289,820 inhabitants, corresponding to a population density of 3,188 inhabitants per km2. The data was obtained from the Municipal Local Government Unit of Santa Maria Bulacan, the Santa Maria Water District, private water concessionaires, the Maynilad Water Academy, the National Irrigation Association and the municipality's Socioeconomic Plan. After the collection of data and the composition of the diagram, an appropriation meeting was conducted in Santa Maria, Bulacan. It was attended by the members of the Integrated Safe Water, Sanitation, and Hygiene (iWASH) Council and the iWASH Technical Working Group of the local government. Participants from the local government included the Municipal Administrator, the Municipal Planning and Development Coordinator, the Municipal Agriculturist, and the Municipal Environment and Natural Resources Officer. The inputs from the meeting were used to validate assumptions that had to be made due to the data gaps in the diagram.
2.4.4 Suburbs of Dakar, Senegal
Diender, Kayar and Keur Moussa are three communities in the suburbs of Dakar. Agriculture is the predominant economic activity in this water scarce area, and part of the available groundwater is exploited for the water supply of Dakar. The municipal boundaries were used as system boundaries. Diender consisted of an area of 118 km2 with 43,465 inhabitants (368 inhabitants/km2), while Kayar comprised an area of 16 km2 and 33,383 inhabitants (2,086 inhabitants/km2) and Keur Moussa stretched out on 222 km2 with 69,168 inhabitants (312 inhabitants/km2). The participatory process was led by a consultant of the local office of a Swiss NGO supported by two local partner organizations, the Environment Development Action for Natural Land Protection (ENDA Pronat) and the Federation of Agropastoralists of Diender (FAPD). The data was obtained from the Water Resources Management and Planning Department, the Office of Rural Water Wells, the Association of Borehole Users, the National Water Company of Senegal, Eau du Sénégal (water utility of urban and peri-urban areas in Senegal), and the World Health Organization. The local partner organizations planned and facilitated the meetings between the consultant, the community stakeholders, the sub-prefecture and the technical services, as well as the meeting for input from the local communities. All the meetings were held at the community level to take the voices of the most disadvantaged sections of the population into account.
3 Results
A WFD was produced for each case study location.
In Figure 2 the WFD of Bern is presented. Almost all flows are green (appropriate UWM). Abstracted groundwater was treated with ultraviolet light and distributed to private households, industry, public buildings, fountains and hydrants. The industries used some negligible volumes of untreated water for their processes. Approximately 5% of treated water was lost during the distribution in the piped network, which was below the threshold of 10% for problematic UWM defined in the user guide (Bouman and Spuhler, 2023). This, therefore, could be considered as appropriate UWM. All buildings are connected to a centralized sewer system. Most wastewater was appropriately treated in an advanced wastewater treatment plant before being discharged into the river Aare. Groundwater and river water were abstracted, used for heating and cooling, and discharged again to the water bodies without quality change. Approximately 173,000 m3 of piped water per year were used in agriculture (in addition to rain-fed water supply to the fields). The water, after use by agriculture, sometimes polluted the groundwater and surface water. Small volumes of water were exported by industry (concrete factory) and agriculture. The most interesting finding of the WFD was that ~15% of the total wastewater in the sewer system was discharged to the river Aare without treatment, which was relatively high compared to the Swiss average of 3%−4% (Staufer and Ort, 2012). The discharge happened only during heavy rainfall events, when sewer and plant capacities were exceeded. The diagram identified that improvements of the combined sewer overflow should be implemented. Potential measures for improvement consist of infrastructure adaptions or the installation of blue-green infrastructure to reduce immediate run-off after heavy rainfalls.
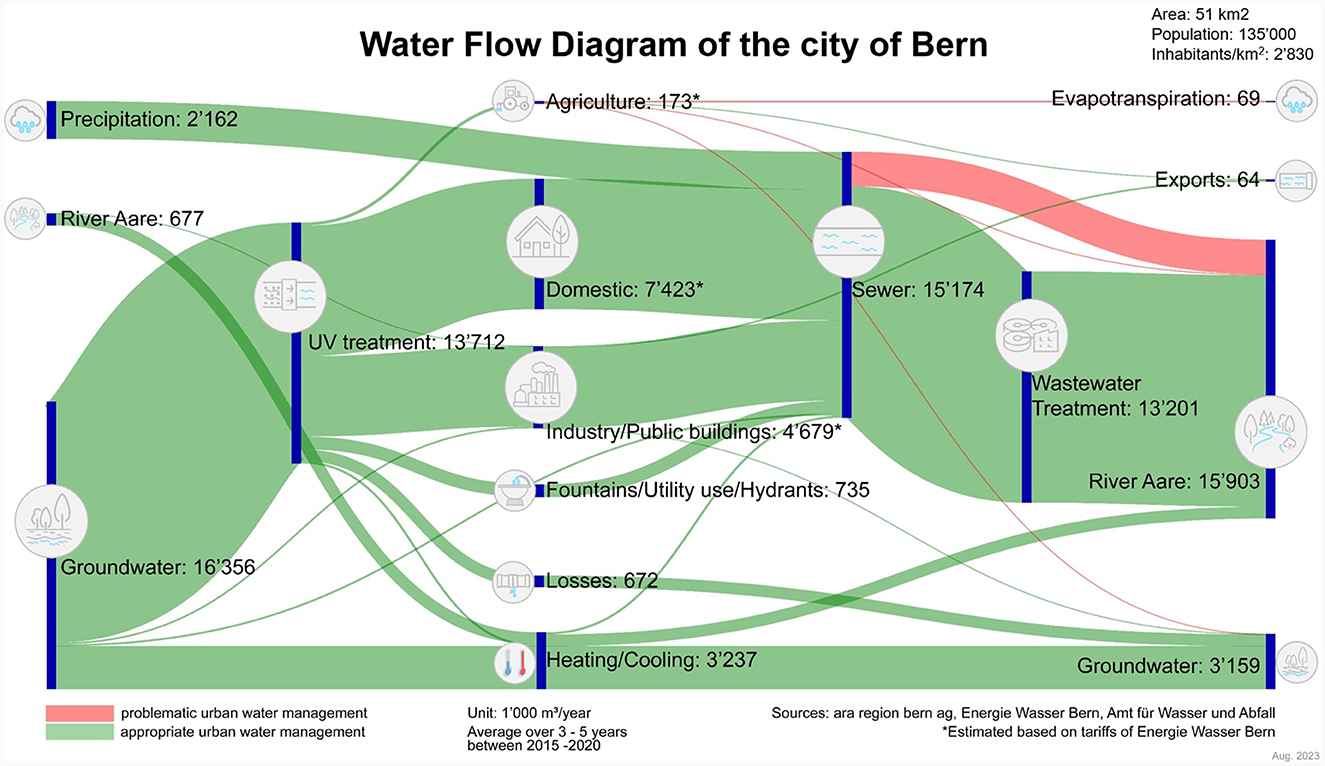
Figure 2. Water Flow Diagram of the city of Bern, Switzerland. *Percentages estimated on the basis of tariff levels.
In the case study in Rio Pardo, initially, the system boundaries chosen were of the urban populated area. Because the partner organization was particularly interested to show the water allocation among the different sectors of the entire municipality, the system boundaries were widened to the municipality. Consequently, also less populated, rural areas were included in the WFD. The water flow diagram in Rio Pardo da Minas (Figure 3) identified a majority of water flows as problematic (red). Irrigation for agriculture operated by large agrobusinesses producing cash crops consumed almost 100% of the water. The water, potentially contaminated with pesticides and fertilizers due to inadequate agricultural practices, infiltrated into groundwater and surface water. Irrigation methods caused an estimated 70% of water losses due to evapotranspiration. It was estimated that 5% of the water input into agriculture was exported with the agricultural products. The proportion of domestic, industrial and public uses of the overall water consumption were minor. Nevertheless, they polluted the surface water and groundwater, since for a large proportion of this water, there was no appropriate treatment of the wastewater. Approximately 25% of the water was lost in the piped distribution network. Although the urban dimension of the water flow is hardly visible in this WFD, its visualization triggered an intensive dialogue on water utilization and water rights amongst different relevant stakeholders and the municipality. First, the WFD was discussed in workshops together with local partner organizations as described in Section 2.4. During the subsecutive appropriation meeting at the municipal level, where the diagram was presented to the city Mayor and his Secretary, dozens of miners stormed the city auditorium and demanded to stop the activity. They argued that the analysis of the utilization of water pose a threat to the local economy. Due to this conflict, the meeting at the city auditorium was terminated and discussions about the WFD were continued only with unions and NGOs. During these discussions, it was agreed that the situation had to first calm down before making another attempt at presenting the WFD at the municipal level.
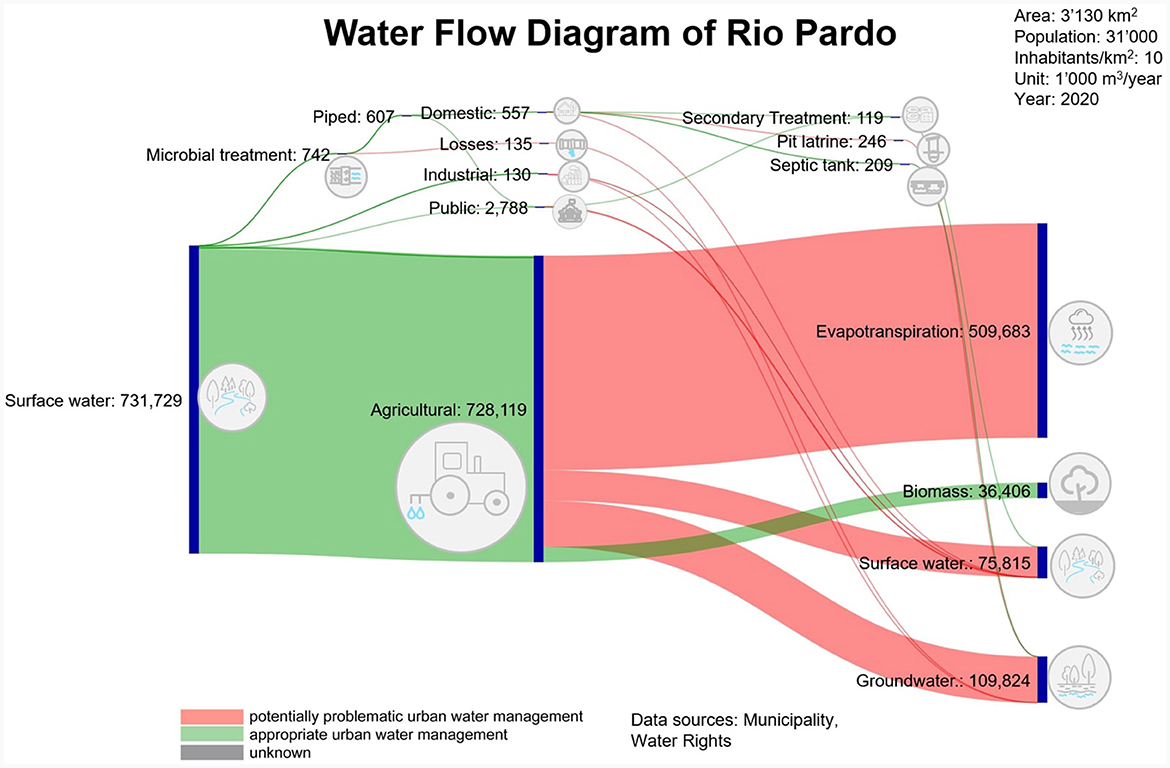
Figure 3. Water Flow Diagram of Rio Pardo de Minas, Brazil.
In Santa Maria, Bulacan, in the Philippines (Figure 4) ~30% of the drinking water originated from surface water, whereas 70% came from groundwater. After chlorination, the piped water was distributed to the different users. The domestic sector used 41% of the treated water, the industrial sector 12%, the public sector 1%, agriculture 34 and 12% were lost in the distribution network. 1% of the water used by the domestic sector was not treated prior to use. There was no sewer system and the wastewater was either collected in septic tanks (93%) and in pit latrines (4%) or was collected in open channels and directly discharged to the surface water (3%). The pit latrines were unlined and, therefore, polluted water from the pit latrines leaked into the groundwater. A small proportion of septic tanks were regularly emptied with trucks and the sludge exported, but it is unknown what happens to the rest of them (gray flow). Agriculture accounted for the major part of the water consumption. In Santa Maria, rain-fed agriculture was considered in the diagram in contrast to the other case studies. It was estimated that 19,712 m3 per year of precipitation fed into agriculture lands and that 60% of the water used in agriculture evapotranspirated, partly because inappropriate irrigation techniques were used in the area. Additionally, it was estimated that 10% of the polluted agricultural water flew into surface water bodies, 20% into groundwater and 10% of the water from agriculture was exported as agricultural products.
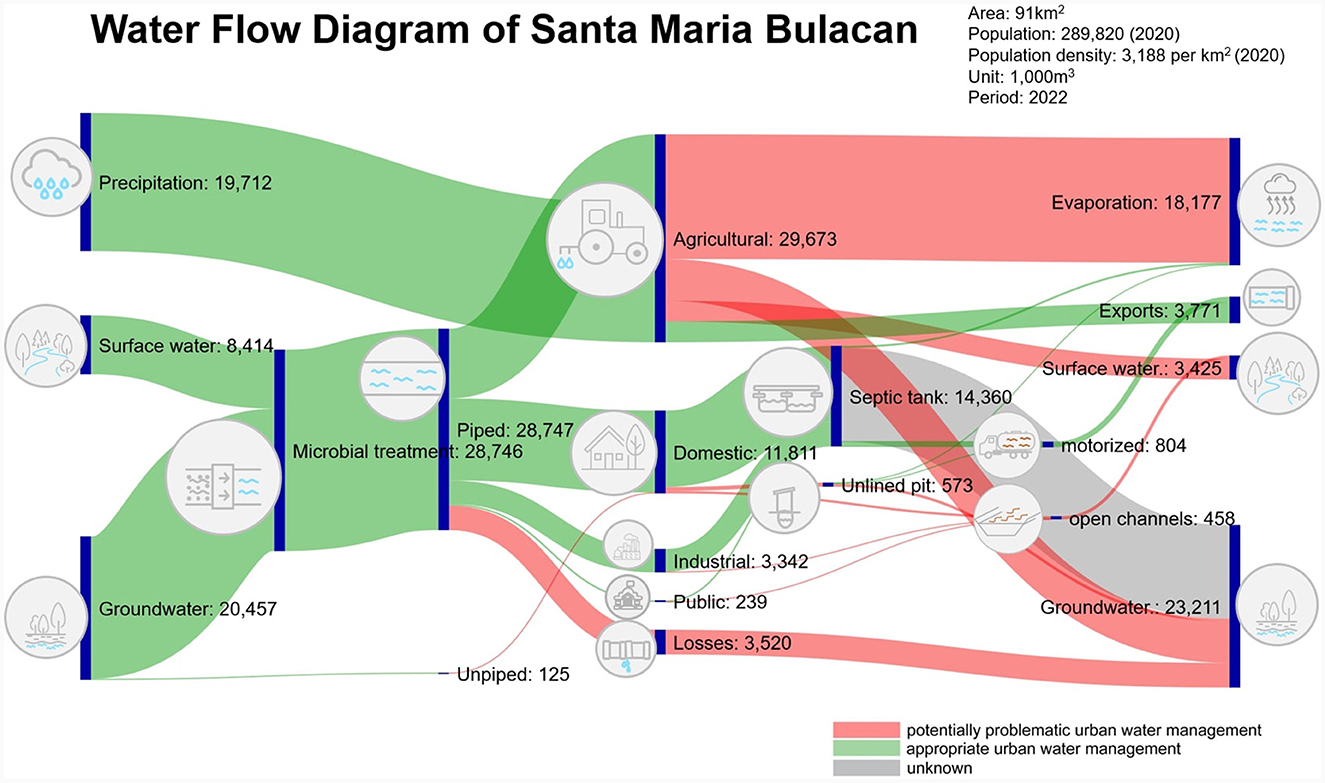
Figure 4. Water Flow Diagram of Santa Maria, Bulacan, Philippines.
Figure 5 shows the WFD of Diender, one of three diagrams from Senegal. More than half of the pumped groundwater was exported to the city of Dakar. Another 47% of the water was used for agriculture. The water that was used in agriculture was probably polluted with pesticides and fertilizers, and would have a negative impact on the groundwater. The evapotranspiration rate was estimated to be 60% because of inadequate irrigation methods in the area. Furthermore, it was estimated that 5% of the water was exported as agricultural products. Similar to the findings from the example of Rio Pardo de Minas, the water consumption for domestic, public and industrial uses were minor. Nevertheless, inappropriate sanitation systems threaten the surface water resources and the groundwater on which the city of Dakar depends. The participative process of collecting data, analyzing the diagram and formulating potential measures in Dakar was characterized by a very active stakeholder engagement at the meetings held at the community level, which were organized and facilitated by the local partner organizations. The process effectively highlighted issues in water management that had been raised by the civil society for quite some time and achieved support to mitigate these issue from the authorities. A result of the process was the formation of a committee for integrated water resources management planning in the three communities, that consists of members from the utilities and civil society. Furthermore, the Ministry of Water and Sanitation in Senegal expressed interest to replicate the WFD in other communities and to use it in local water resource management plans.
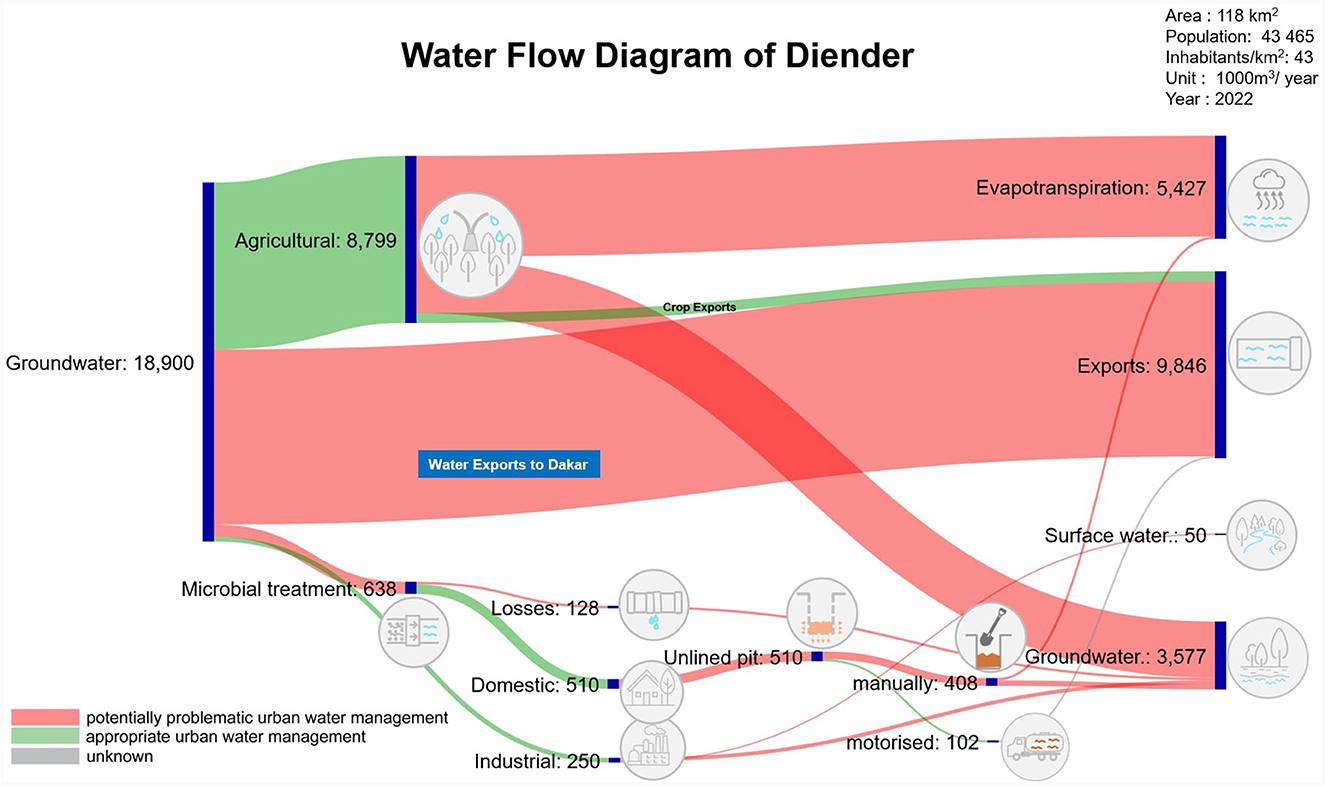
Figure 5. Water Flow Diagram of the municipality of Diender, Senegal.
4 Limitations
The applied methodology has some limitations. First, the coefficients for evapotranspiration and runoff of water to surface water and groundwater after agricultural use are difficult to measure or estimate. In the presented case studies, rough estimations were used that were derived from literature and expert consulting. Second, stakeholder consultations revealed that the irrigation and land management methods were not water efficient. Therefore, the flow toward evapotranspiration were coded as problematic (red). A better judgement is not possible without doing a more systematic assessment of the situation on the ground. Third, it was assumed that the water running off after agricultural use was contaminated with pesticides; however, this assumption is not based on solid evidence. Lastly, the specificity of the WFDs are limited and the conclusions that can be drawn from them are general. Spatial conclusions on where, for example, water resources are being polluted or where there are leakages in the distribution network cannot be made, nor can the extent of pollution be determined. An explanatory description that accompanies the WFD can overcome this limitation to some extent. However, the WFD was designed as a communication and advocacy tool that is based locally availably data sets that can be limited in precision. Therefore a detailed and precise assessment of hydrological processes is not possible.
5 Discussion
In all four case studies, the WFDs depicted the water sources used by the cities, highlighted if the water treatment was adequate and revealed how much water was allocated among the different sectors. While in Bern and Santa Maria, groundwater and surface water were abstracted to be treated, only river water was used in Rio Pardo and only groundwater in Diender. Except for the case study of Bern, where the narrower system boundaries excluded a larger part of the non-urbanized areas, the major part of water in the other three case studies was used by agriculture. For example, in the case of Rio Pardo de Minas, agriculture used up to 64,000 L/day per person. The domestic water use was 150 L/day per person in Bern, 112 L/day per person in Santa Maria Bulacan, 49 L/day per person in Rio Pardo de Minas and 32 L/day per person in Diender. In addition, except for Bern, the losses in the distribution networks were higher than 10% and therefore, categorized as problematic UWM practices. At all locations, open water resources were threatened by polluted water either from agriculture or from the lack of wastewater and sanitary infrastructure. The extent of polluted water reaching open water bodies varied across the locations, and not surprisingly was higher in less developed regions, such as in the suburbs of Dakar or Rio Pardo de Minas. Bern was the only study site where a comprehensive sewer system was in place and where the pollution of the water resources due to heavy rainfall events that overflow sewer system, sending the water directly to the river, was limited. The other study sites had primarly onsite sanitation systems installed. Polluted water leaking from those systems threatened groundwater and surface water bodies. In none of the study sites were signficiant amounts of water recycled.
The selection of system boundaries had a large impact on the conclusions that could be drawn from the diagram. If the system boundaries included large rural areas, one of the main conclusions was that a large part of the water was used by agriculture. Consequently, the impact of UWMs in systems with large rural areas was more difficult to depict and evaluate, as most urban flow arrows were too small to be compared. Yet, setting narrow system boundaries around an urban area would not show the agricultural and sometimes also industrial activities that take place outside the city boundaries. Water related activities outside city boundaries are relevant for the urban population because they impact the availability of water and the amount allocated to the different sectors and they influence water quality. One possibility to overcome this challenge is to prepare a WFD that represents the whole water catchment area of a city and a separate “zoom-in” diagram of the urban area.
The participatory processes required much time to identify all relevant stakeholders and to integrate them into each step of the process. This was especially the case in Rio Pardo de Minas and Diender where the processes to compose and discuss the WFD were highly participatory. A precondition to be able to conduct the participatory approach was that institutions and organizations were willing to participate and openly share the data. A clear explanation of the goal of the participatory process, a detailed explanation of the purpose of the WFD and an official support statement by political leaders were helpful to bring stakeholders on board. Since the goal of this study was to analyse the practical application of the WFD as a tool, the participatory processes were not analyzed in detail.
In all locations, the WFD triggerd a dialogue around sustainable water management. In Senegal, for example, the participatory discussion of the WFD led to the formation of a committee for water resource management in which the local administrative authorities were strongly involved. Furthermore, the Ministry of Water and Sanitation was interested in replicating the WFD in other communities. The experience in Rio Pardo highlighted that the utilization of water by different stakeholders is a sensitive issue and that a successful participary dialogue needs to be based on a comprehensive understanding of the subject matter and the trust of the stakeholders in the participatory process and dialogue. The protest of the miners revealed that, it needs to be communicated transparently that the WFD can highlight challenges in water management but solutions have to be identified during a joint process.
The following insights were gained regarding the application criteria outlined in the introduction:
i. The WFD methodology consists of a guide and an Excel-based data file that can be uploaded to an open online tool to make the Sankey Diagram. Final adjustments can be made in PowerPoint. During the case studies, the tools proved to be easy-to-use for people without any programming skills. Basic computer literacy and analytical skills were sufficient to produce the WFDs.
ii. In each of the case studies, the development of a WFD was initiated by different actors: researchers in Bern, a local NGO in Dakar, an international NGO in Brazil and a private consultant in collaboration with the public utility in the Philippines. Also, the settings were different with e.g., different system boundaries, population densities varying by a factor of more than 300, different main water sources, including full supply from groundwater, full supply from surface water to a balanced supply from three different sources, and different associated water challenges. In all four cases, the WFD demonstrated its capacity to visualize the challenges of a city's UWM in a single diagram, created the basis for a common understanding of these challenges, and showed opportunities for improvement. Despite its systematic approach, the results of the WFD depended on the expertise of local stakeholders and the assumptions made such as system bounderies, data estimations, and the judgement of the flows in “appropriate” or “problematic” UWM practices.
iii. In all four cases, the participatory process brought together different stakeholders and initiated consultation and joint action planning. The experiences made during these participatory processes confirmed the suitability of the WFD to be used as a tool to trigger communication about water management and to facilitate concerted negotiations toward solutions.
On the basis of insights gained during the implementation of the case studies, which confirmed the tool's compliance with the design criteria and its effect on triggering corrective measures in UWM, there should be a broader dissemination of the tool to a larger community of users. In addition, the following measures are suggested to extend the applicability of the tool:
Firstly, the total precipitation within the system boundaries could be included in an updated version of the WFD. Precipitation plays an increasingly important role in UWM, since rainfall patterns are more and more influenced by climate change. The diagram could also highlight the potential impacts of climate hazards by showing which areas of the UWM are vulnerable to heavy rainfall, drought and other climate related hazards, providing stakeholders with a tool to identify measures contributing to climate resilience. However, including precipitation in WFDs adds complexity to the diagram in the form of additional flows and nodes, and would require more data to be gathered. The advantages and disadvantages of including precipitation would need to be assessed carefully and would differ from case to case.
Secondly, an adapted version of the WFD could be developed where the system boundaries are shifted from an urban focus to the watershed level. This would allow for the consequences of land use changes on larger scales to be made visible. Remote sensing data could be used to estimate evapotranspiration and runoff, based on land cover and slope. The improved version could also show the coefficients for run-off and evapotranspiration in more detail in order to allow for the making of more evidence-based estimations of evapotranspiration, runoff and infiltration, particularly for agricultural water use. The trade-off in a diagram with wider system boundaries is that the urban water flows become less visible, as discussed earlier in this section.
Thirdly, the WFD could be used to visualize scenarios. The diagram could show how policies or interventions, for example, cause land use changes that affect urban water flows or the hydrologic cycle on the watershed level. Also, the diagram could be part of long-term monitoring at regular intervals to make changes in UWM visible. However, the diagram cannot attribute the changes to certain strategies or interventions. The changes in UWM might be caused by a certain strategy or intervention, but might as well be due to other factors, such as changing urban dynamics, changing water needs or data consistency.
Fourthly, a better understandiung of the steps required for successfully steering the participatory process and providing more specific guidance to the implementation partners will improve the application of the WFD.
Lastly, a more user friendly web application that can make WFDs more easily available could be developed.
The experiences gained during the participatory processes to develop the WFDs in the four presented cases revealed that the methodology applied for the WFD yields a suitable tool for the understanding of water flows and that it can be useful in the planning of improvements to an integrated UWM. Users can easily comprehend the tool and the information provided in the diagram facilitates the participatory processes.
Data availability statement
The datasets generated for this study can be found in the Eawag Research Data Institutional Collection. For each case study, there is a separate repository with the data and Supplementary material. Bern, Switzerland: https://doi.org/10.25678/000BZD, Rio Pardo de Minas, Brazil: https://doi.org/10.25678/000BYC, Diender, Senegal: https://doi.org/10.25678/000BXB, Santa Maria Bulacan, Philippines: https://doi.org/10.25678/000BWA. Further inquiries can be directed to the corresponding author.
Author contributions
LB: Conceptualization, Data curation, Investigation, Methodology, Software, Visualization, Writing – original draft, Writing – review & editing. DS: Conceptualization, Investigation, Methodology, Writing – original draft, Writing – review & editing. M-AB: Conceptualization, Funding acquisition, Methodology, Supervision, Writing – original draft, Writing – review & editing. AM: Investigation, Methodology, Writing – review & editing. LD: Investigation, Methodology, Writing – review & editing. OC: Investigation, Methodology, Writing – review & editing. RM: Funding acquisition, Methodology, Project administration, Supervision, Writing – original draft, Writing – review & editing.
Funding
The author(s) declare financial support was received for the research, authorship, and/or publication of this article. This research was possible through funding by the Swiss Agency for Development and Cooperation, the City of Bern and the aid organization of the Swiss protestant churches (HEKS/EPER). Open access funding by Swiss Federal Institute of Aquatic Science and Technology (Eawag).
Acknowledgments
The authors would like to thank all the stakeholders in the different case studies for contributing to the making of the Water Flow Diagrams, the water experts who provided valuable feedback on how to improve the methodology, as well as HEKS/EPER for the consistent support.
Conflict of interest
The authors declare that the research was conducted in the absence of any commercial or financial relationships that could be construed as a potential conflict of interest.
Publisher's note
All claims expressed in this article are solely those of the authors and do not necessarily represent those of their affiliated organizations, or those of the publisher, the editors and the reviewers. Any product that may be evaluated in this article, or claim that may be made by its manufacturer, is not guaranteed or endorsed by the publisher.
Supplementary material
The Supplementary Material for this article can be found online at: https://www.frontiersin.org/articles/10.3389/frwa.2024.1360515/full#supplementary-material
Supplementary Table 1. Data_bern.
Supplementary Table 2. Inventory_wfd_bern.
Supplementary Table 3. Inventory_wfd_riopardo.
Supplementary Table 4. Inventory_wfd_santamaria.
Supplementary Table 5. Inventory_wfd_diender.
Supplementary Figure 1. System_boundaries_bern.
Supplementary Figure 2. System_boundaries_diender.
Supplementary Figure 3. System_boundaries_riopardo.
Supplementary Figure 4. System_boundaries_santamaria.
References
Arnold Jr, C. L., and Gibbons, C. J. (1996). Impervious surface coverage: the emergence of a key environmental indicator. J. Am. Plan. Assoc. 62, 243–258. doi: 10.1080/01944369608975688
Bouman, L., and Spuhler, D. (2023). Water Flow Diagram - Quick guide. Eawag. Available online at: www.sandec.ch/wfd (accessed February 14, 2024).
Erban, L. E., Balogh, S. B., Campbell, D. E., and Walker, H. A. (2018). An R package for open, reproducible analysis of urban water systems, with application to Chicago. Open Water 5:26. doi: 10.3389/fbuil.2019.00124
Field, C. B. (2012). Managing the Risks of Extreme Events and Disasters to Advance Climate Change Adaptation: Special Report of the Intergovernmental Panel on Climate Change. Cambridge, MA: Cambridge University Press. doi: 10.1017/CBO9781139177245
Habitat, U. (2022). Envisaging the Future of Cities, World Cities Report 2022, UN Human Settlements Programme. Available online at: https://unhabitat.org/sites/default/files/2022/06/wcr_2022.pdf (accessed February 14, 2024).
Heberer, T., Reddersen, K., and Mechlinski, A. (2002). From municipal sewage to drinking water: fate and removal of pharmaceutical residues in the aquatic environment in urban areas. Water Sci. Technol. 46, 81–88. doi: 10.2166/wst.2002.0060
Jacobson, C. R. (2011). Identification and quantification of the hydrological impacts of imperviousness in urban catchments: a review. J. Environ. Manag. 92, 1438–1448. doi: 10.1016/j.jenvman.2011.01.018
Kay, D., Edwards, A. C., Ferrier, R. C., Francis, C., Kay, C., Rushby, L., et al. (2007). Catchment microbial dynamics: the emergence of a research agenda. Prog. Phys. Geogr. 31, 59–76. doi: 10.1177/0309133307073882
Konrad, C. P. (2003). Effects of Urban Development on Floods. Tacoma: US Geological Survey. doi: 10.3133/fs07603
Lambert, A. O. (2002). International report: water losses management and techniques. Water Sci. Technol. Water Supply 2, 1–20. doi: 10.2166/ws.2002.0115
McGrane, S. J. (2016). Impacts of urbanisation on hydrological and water quality dynamics, and urban water management: a review. Hydrol. Sci. J. 61, 2295–2311. doi: 10.1080/02626667.2015.1128084
Mitchell, V. G., and Diaper, C. (2006). Simulating the urban water and contaminant cycle. Environ. Model. Softw. 21, 129–134. doi: 10.1016/j.envsoft.2005.03.003
Nandagiri, R. (2023). 8 Billion Lives, Infinite Possibilities: The Case for Rights and Choices. New York, NY: UNFPA.
O'Driscoll, M., Clinton, S., Jefferson, A., Manda, A., and McMillan, S. (2010). Urbanization effects on watershed hydrology and in-stream processes in the southern United States. Water 2, 605–648. doi: 10.3390/w2030605
Packman, J. (1980). The Effects of Urbanisation on Flood Magnitude and Frequency. Wallingford: Institute of Hydrology
Peal, A., Evans, B., Ahilan, S., Ban, R., Blackett, I., Hawkins, P., et al. (2020). Estimating safely managed sanitation in urban areas; lessons learned from a global implementation of excreta-flow diagrams. Front. Environ. Sci. 8:1. doi: 10.3389/fenvs.2020.00001
Platts, K., and Hua Tan, K. (2004). Strategy visualisation: knowing, understanding, and formulating. Manag. Decis. 42, 667–676. doi: 10.1108/00251740410538505
Schütze, M., and Robleto, G. (2010). Challenges of Water and Wastewater Management in the Desert Megacity of Lima/Peru-How Can Macromodelling Help? Durham, NC: NOVATECH.
Sieber, J., and Purkey, D. (2015). WEAP User Guide. Somerville, MA: Stockholm Environment Institute, U.S. Center.
Staufer, P., and Ort, C. (2012). “Mikroverunreinigungen aus diffusen Quellen: Faktenblatt, Diffuse Mikroverunreinigungs-Emissionen aus Siedlungen (DIMES),” in German (Fact sheet, Diffuse micropollutantemissions from urban areas (DIMES)). Study for the Swiss Federal Office for the Environment (FOEN), Eawag, Dübendorf, Switzerland. Available online at: https://www.dora.lib4ri.ch/eawag/islandora/object/eawag%3A14774 (accessed February 14, 2024).
Van Metre, P. C, Mahler, B. J., and Furlong, E. T. (2000). Urban sprawl leaves its PAH signature. Environ. Sci. Technol. 34, 4064–4070. doi: 10.1021/es991007n
Willuweit, L., and O'Sullivan, J. J. (2013). A decision support tool for sustainable planning of urban water systems: presenting the dynamic urban water simulation Model. Water Res. 47, 7206–7220. doi: 10.1016/j.watres.2013.09.060
WorldBank (2023). Urban Development. Available online at: https://www.worldbank.org/en/topic/urbandevelopment/overview (accessed February 14, 2024).
Keywords: integrated water resource management, human right to water and sanitation, community engagement, decision support, advocacy
Citation: Bouman L, Spuhler D, Bünzli M-A, Melad A III, Diop L, Coelho O and Meierhofer R (2024) The water flow diagram. Front. Water 6:1360515. doi: 10.3389/frwa.2024.1360515
Received: 23 December 2023; Accepted: 07 February 2024;
Published: 26 February 2024.
Edited by:
Rajneesh Singh, University of Minnesota Twin Cities, United StatesCopyright © 2024 Bouman, Spuhler, Bünzli, Melad, Diop, Coelho and Meierhofer. This is an open-access article distributed under the terms of the Creative Commons Attribution License (CC BY). The use, distribution or reproduction in other forums is permitted, provided the original author(s) and the copyright owner(s) are credited and that the original publication in this journal is cited, in accordance with accepted academic practice. No use, distribution or reproduction is permitted which does not comply with these terms.
*Correspondence: Dorothee Spuhler, ZG9yb3RoZWUuc3B1aGxlckBvc3QuY2g=; Regula Meierhofer, cmVndWxhLm1laWVyaG9mZXJAZWF3YWcuY2g=