- 1Department of Civil, Construction and Environmental Engineering, Iowa State University, Ames, IA, United States
- 2Department of Human Development and Family Studies, Iowa State University, Ames, IA, United States
- 3Department of Landscape Architecture and Urban Planning, Texas A&M University, College Station, TX, United States
Consistent and accurate measurement of public perceptions of water quality is useful for understanding water use behaviors, policy development/support, and community engagement, all essential for sustainable water management. Toward consistent and accurate measurement, we refined and examined the initial psychometric properties of a Water Quality Perception Scale (WQPS). In this study, we report an exploratory factor analysis (EFA) with 18 items on a group of respondents (N = 154), which identified one primary factor, ‘Individual Water Quality Perception,’ consisting of 13 items and two additional factors represented by the remaining 5 items. Subsequently, a confirmatory factor analysis (CFA) was performed with (n = 147 participants), including both original (n = 74 assessed at a separate time from their original assessment) and new participants (n = 73). The results of the CFA affirmed the initial loadings of the 13-item WQPS in a single factor. The scale demonstrated internal consistency, with coefficients of 0.93 and 0.90 (Cronbach’s alpha) in the two samples, and the measure showed convergent validity with the Household Water Insecurity Experiences Scale (HWISE), (r = −0.41 and −0.49 in the respective samples). This scale holds promise toward consistent and accurate measurement instrument for researching public perceptions of water quality, guiding policy and public initiatives to improve water management strategies. Avenues for further development and use are discussed.
Introduction
Water quality, encompassing water’s physical, chemical, and biological attributes, remains a cornerstone of environmental sustainability, public health, and economic development (Duan et al., 2013; Gholizadeh et al., 2016). The United Nations’ Sustainable Development Goal 6 exemplifies the global emphasis on drinking water quality, which seeks to “ensure availability and sustainable management of water and sanitation for all” (Hoekstra et al., 2017). Nevertheless, the public’s understanding and perception of water quality often diverge from the objective measurements of scientists and policymakers (Eden, 1996; Pacione, 2003; Doria, 2010). This mismatch can result in non-optimal water-related behaviors, suboptimal policy support, and public resistance to critical water initiatives (Grey et al., 2013; Nelson et al., 2023).
Myriad water quality problems can affect public perception. While commendable strides in improving water quality have been made, high-profile incidents, like the lead-contaminated water crisis in Flint, Michigan, can dominate public discourse even in the most industrialized countries (Pauli, 2020). Moreover, other communities across the United States, including Newark, New Jersey, and Jackson, Mississippi, have faced water-related crises (Yang and Faust, 2019; Kim et al., 2023). These situations not only spotlight the immediate health concerns but also lead to heightened distrust in authorities and a skewed perception of overall water quality in the nation. Water quality perception involves the process through which individuals pick, structure, and decode sensory information to construct a coherent understanding of their water quality (Auslander and Langlois, 1993; Heekeren et al., 2008; Hu et al., 2011; Alhassan and Kwakwa, 2013). It confluences an individual’s experiences, deeply ingrained cultural beliefs, educational background, and prevailing media narratives (Tuan, 1990). Even if objective measures indicate that water is safe for drinking, significant mistrust or concerns over quality can lead to notable consequences, ranging from reduced consumption to increased reliance on unsustainable bottled water (Doria, 2006, 2010).
A gap between perception and reality can have tangible consequences. Distrust in public water systems can lead to increased bottled water consumption, which has environmental implications and places a financial burden on households (Nelson et al., 2023). Misconceptions about water quality can lead to negative public behaviors, hindering the implementation of necessary water infrastructure upgrades or pollution control measures (Pierce and Gonzalez, 2016). Indeed, Sarkar (2022) has suggested including a module of questions in the American Housing Survey (AHS) that would provide data to determine and track the link between the perception of water quality and local-level communication regarding it, the effectiveness of the frequency of receiving such information, and other factors that link perception and consumption (Sarkar, 2022).
Consistent and accurate measurement of water quality perceptions is needed. Such assessments are at an important intersection between the engineering, social, policy, and human aspects of water security and sustainability (Weems et al., 2023). While qualitative approaches such as interviews and focus groups offer depth, they are often constrained in scope and scalability (Goss and Leinbach, 1996; Agunbiade and Ogunleye, 2012; Davis et al., 2019). Their inherent design often limits their applicability to smaller, targeted populations. This poses challenges in generalizing findings or scaling up these methods for broader regional or national assessments. However, it is important to recognize the evolving methodologies within qualitative research that address these limitations. Various studies have demonstrated innovative methods to scale qualitative data, leveraging technologies and mixed-methods approaches that enhance data collection, analysis, and generalization capabilities (Zachariadis et al., 2013; Crespo et al., 2021). This includes the use of digital platforms for wider participant recruitment, software for data analysis, and strategic integration with quantitative methods to broaden the scope of research findings (O’Connor et al., 2016; Rupert et al., 2017).
Questionnaires, often structured and closed-ended, can be developed based on insights from qualitative work to assess large samples (Doria et al., 2009; Levêque and Burns, 2017). Conversely, responses from these questionnaires can guide the design of qualitative approaches for deeper insights (Braun et al., 2021). However, a lack of standardization in question framing, response scales, and thematic focus can lead to inconsistencies, making it challenging to conduct cross-comparative analyses or aggregate data from different studies. Furthermore, while water infrastructure decisions are often local, the factors influencing public perceptions of water quality can have regional or national resonance (Alhassan and Kwakwa, 2013; Pierce and Gonzalez, 2016; Yang and Faust, 2019). Factors such as environmental policies and media narratives can greatly influence public perception on a larger scale (Heekeren et al., 2008).
Research helping to move toward a consistent and accurate measurement instrument of water quality perceptions is needed, similar to the work done on “water insecurity” with the Household Water Insecurity Experiences (HWISE) Scale developed by Young et al. (2019). The HWISE is used in several contexts to understand water insecurity and facilitate consistency assessment across studies. To this end, this study aimed to provide initial psychometric data on a Water Quality Perception Scale (WQPS). To facilitate consistency, a large portion of the items selected for analysis in this study were initially included in a study by Doria et al. (2009). Their paper explored the influence of organoleptic properties (taste, smell, and color) on perceptions of tap water quality (Doria et al., 2009). The items from Doria’s study were adapted, sometimes directly and sometimes with modifications, to fit a broader context, attempting to make them relevant across diverse geographic and cultural environments. In the original work by Doria et al. (2009), the items were treated as separate individual indicators; however, this paper aimed to determine if these items comprise a unitary or multifaceted construct of “water quality perception.” In other words, can a set of items from tap water quality perceptions be considered separate indicators?
Data collection for this particular project was conducted in Puerto Rico. Acknowledging the significant impact of hurricanes on Puerto Rico’s water infrastructure and quality (Brown et al., 2018; Mejia Manrique et al., 2021), the research team also developed items that address these specific challenges related to the hurricane season. Hurricanes and their aftermath play a substantial role in shaping the perception of water quality and safety. In Phase 1, we describe the development of the WQPS and explore its factor structure using exploratory factor analysis (EFA). We expected there to be a core set of items but that there may be additional factors from the initial set of items tested. In Phase 2, we use confirmatory factor analyses (CFA) to replicate the factor structure identified via the EFA analyses. We also examine the WQPS’s association with a similar construct of water insecurity using the Household Water Insecurity Experiences (HWISE) Scale developed by Young et al. (2019). We predicted that the WQPS scale would be moderately (because water quality is similar but distinct from water insecurity) and negatively correlated with the HWISE (i.e., more water insecurity is associated with lowered water quality perceptions).
Methods
Initial instrument
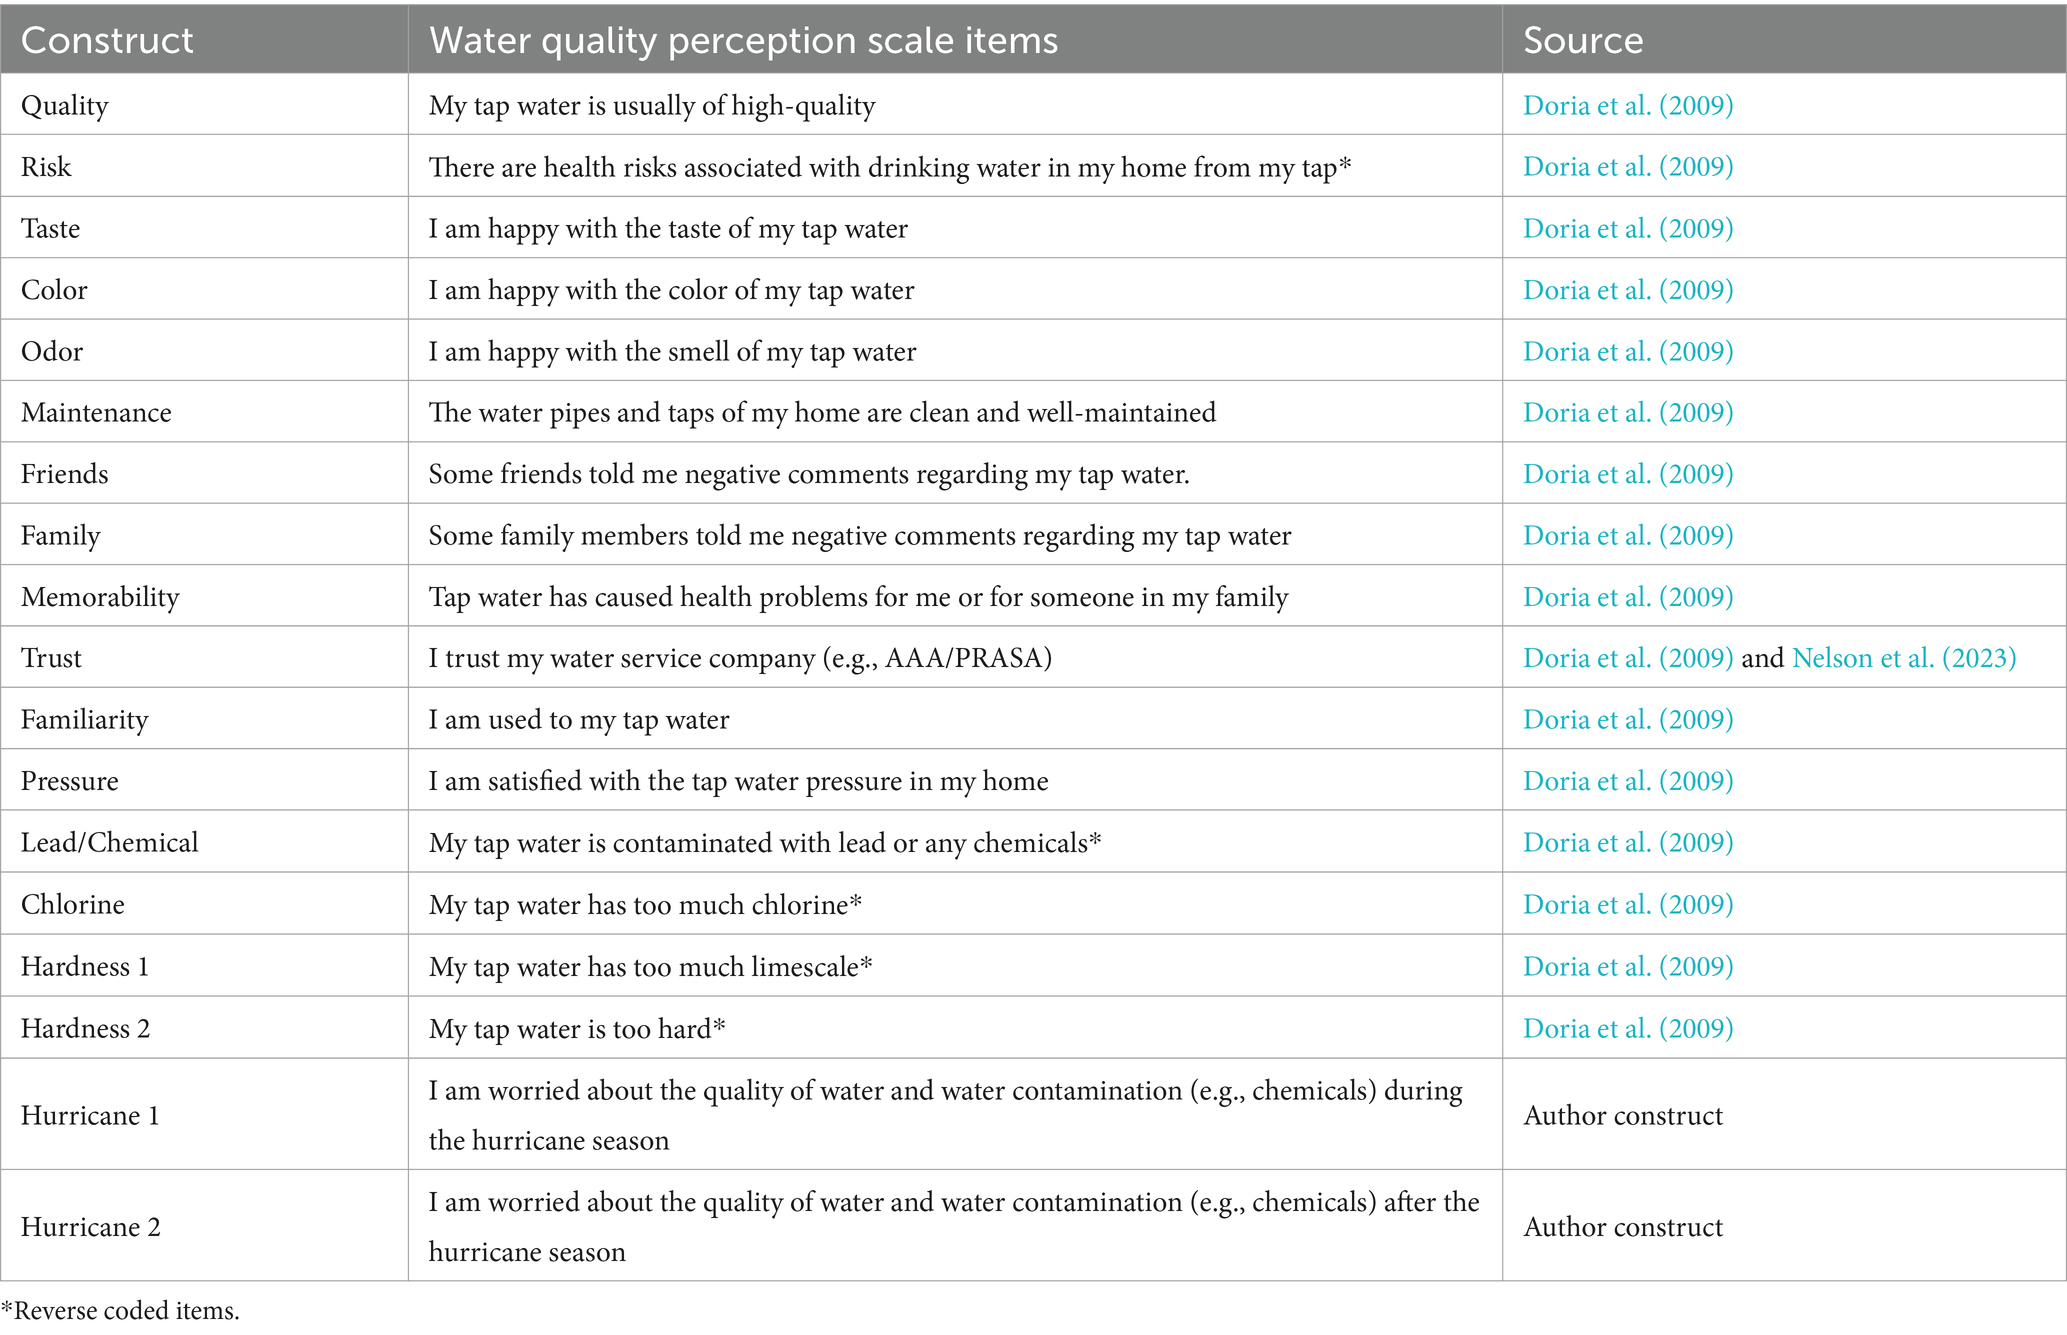
Table 1 links each WQPS item to its source.
Respondents are asked to answer each of these 18 items on a 5-point Likert-type agreement scale from strongly disagree to strongly agree. To ensure linguistic accuracy, the survey was meticulously translated into Spanish by one of our authors, who is a native of Puerto Rico, thus ensuring cultural relevance and precision in our Spanish-language questionnaire. The administration of the survey was conducted by a team of four field research assistants, who ensured the quality and consistency of the data collection process throughout the study.
Participants were also administered the Household Water Insecurity Experiences (HWISE) scale which is a version of the Water Insecurity Experiences (WISE) scale series (Young et al., 2019). There are four versions of the WISE scales. The household (HWISE) and individual (IWISE) scales ask about the frequency of experiences with 12 common water-related disturbances to emotional well-being or disruptions in daily activities. The brief (HWISE-4) and (IWISE-4) scales are based on a subset of the 4 water-related experiences. The HWISE scale consists of a set of questions that are designed to capture the frequency of various experiences related to water insecurity over a recall period, such as water shortages, concerns about water quality, and the impact of water issues on food security. Example items include (In the last 4 weeks, how frequently did you or anyone in your household worry you would not have enough water for all of your household needs? and in the last 4 weeks, how frequently has there been no useable or drinkable water whatsoever in your household?) Each of the 12 items are scored 0 (never), 1 (rarely), 2 (sometimes), or 3 (often/always), for a total score range of 0–36. A score of 12 or more is considered water insecure for the HWISE. Research suggests the items are unidimensional in factor analyses and have internal consistency estimates of Cronbach’s alpha ranging from 0.84 to 0.93 (Young et al., 2019). Previous data further suggest equivalence of measurement and meaning across sites. Predictive, convergent, and discriminant validity are available in Young et al. (2019). Internal consistency in this sample was alpha = 0.88 in both phases of the study.
Sampling strategy and data collection
These data came from a larger study of repeated disasters on water insecurity and mental health outcomes in Puerto Rican communities. Puerto Rico is an ideal study area for this initial work because while the mainland USA has faced its share of water quality challenges, Puerto Rico, a U.S. territory, navigates an even more challenging situation. This is not solely a product of infrastructure or policy but is significantly amplified by natural hazards, particularly hurricanes (Brown et al., 2018; Kaufman, 2019). Historically, Puerto Rico has faced infrastructural challenges. Aging pipelines, wastewater treatment limitations, and compromised water sources have perennially influenced the island’s water narrative (Mejia Manrique et al., 2021). The situation, complex in its own right, is exacerbated by natural hazards. Puerto Rico lies in a region frequently hit by hurricanes. Disasters like Hurricane Maria in 2017 not only affected the island’s infrastructure but also critically impacted water quality. The heavy rainfall and flooding led to the overflow of sewage systems, the runoff of contaminants from damaged industrial sites, and the mixing of fresh water with salt water, all of which contributed to widespread drinking water contamination (Rosinger, 2018; Fischbach et al., 2020; Ghosh et al., 2021).
Data was collected in four municipalities: Loiza, Aguas Buenas, Comerio, and Utuado. Loiza, characterized by its Afro-Puerto Rican heritage, encapsulates economic disparities often overshadowed by Puerto Rico’s more commercially celebrated regions (Nelson et al., 2023). A deep-seated economic marginalization in Loiza interfaces with water insecurity, necessitating a nuanced exploration. Aguas Buenas, ironically, which means “good waters” in Spanish, has been a hotspot for infrastructural challenges, especially post-hurricane devastations (Laskow, 2018). Both Hurricanes Maria and Fiona have strained its already fragile water distribution systems, inducing multifaceted adversities for its populace. The topographical intricacies of Comerio, which lies in Puerto Rico’s mountains, lead to unique challenges. Access to consistent, clean water sources remains a perennial issue, further intensified during seasonal fluctuations (Marcos, 2022). Utuado’s proximity to abundant water sources is marred by outdated water treatment. Despite its geographical proximity to freshwater sources, contamination and accessibility challenges are rampant (Holladay et al., 2021).
In the first phase of our research, we focused on the collection of survey data from 154 residents spanning three municipalities: Loiza, Comerio, and Aguas Buenas. These data were gathered prior to the devastating effects of Hurricane Maria from May 2022 to July 2022. Following the hurricane, Phase 2 was initiated, where we expanded our geographical scope to include an additional region, Utuado, following the low response rate from Loiza after Hurricane Fiona. Hence, the data for the second phase encapsulated survey data from 147 residents of Loiza, Comerio, Aguas Buenas, and Utuado, specifically after the impacts of Hurricane Fiona from September 2022 to February 2023. The methodologies and survey instruments implemented in both studies were reviewed and approved by the Institutional Review Board (IRB) of Iowa State University.
Data analysis
Phase 1: exploratory factor analysis
The 18-item items from Table 1 were initially analyzed using the pre-hurricane Fiona dataset (N = 154) with exploratory factor analysis (EFA) executed in STATA 15 statistical software. The principal axis factoring of the item correlation matrix using a Varimax rotation was used to simplify factor identification (Ohan et al., 2000; Janus and Offord, 2007). The varimax rotation was used to present a clearer, more discernible factor structure (Osborne, 2015). Maximizing the variance of the squared loadings ensures that items predominantly load onto a single factor, which considerably simplifies interpretation and subsequent utilization. Critical to the factor interpretation is the consideration of factor loadings. These loadings serve as markers, pointing toward the correlation strength between individual items and the identified constructs. Convention in the literature dictates that items with loadings above certain thresholds, often set at 0.3, significantly represent a specific factor (Beavers et al., 2013). It is through this lens that each item’s relevance to the identified constructs was determined.
Phase 2: confirmatory factor analysis
Following the EFA results in Phase 1, we conducted a Confirmatory Factor Analysis (CFA) with the post-hurricane Fiona dataset (N = 147) to confirm the factor structure of the scale items. This methodological approach tests the alignment of the proposed factor structure with the observed data (Luong and Flake, 2023). Initially, the factor model was specified based on insights from the EFA results and a robust theoretical foundation, wherein each item was systematically aligned to its hypothesized factor. Full Information Maximum Likelihood (FIML) approach was adopted for the analysis (Enders, 2001). We examined the model’s fit with the data using multiple fit indices. Specifically, the chi-square statistic, Comparative Fit Index (CFI), Tucker–Lewis Index (TLI), Root Mean Square Error of Approximation (RMSEA), and the Standardized Root Mean Square Residual (SRMR) were assessed against accepted benchmarks (Hu and Bentler, 1998). Modification indices were examined to discern potential enhancements, ensuring that any revisions were grounded both statistically and theoretically.
Convergent validity
The convergent validity of the WQPS scale was assessed by conducting Pearson correlations between the total WQPS scores and the total HWISE scores at both Phase 1 and Phase 2.
Results
Phase 1
Descriptive statistics
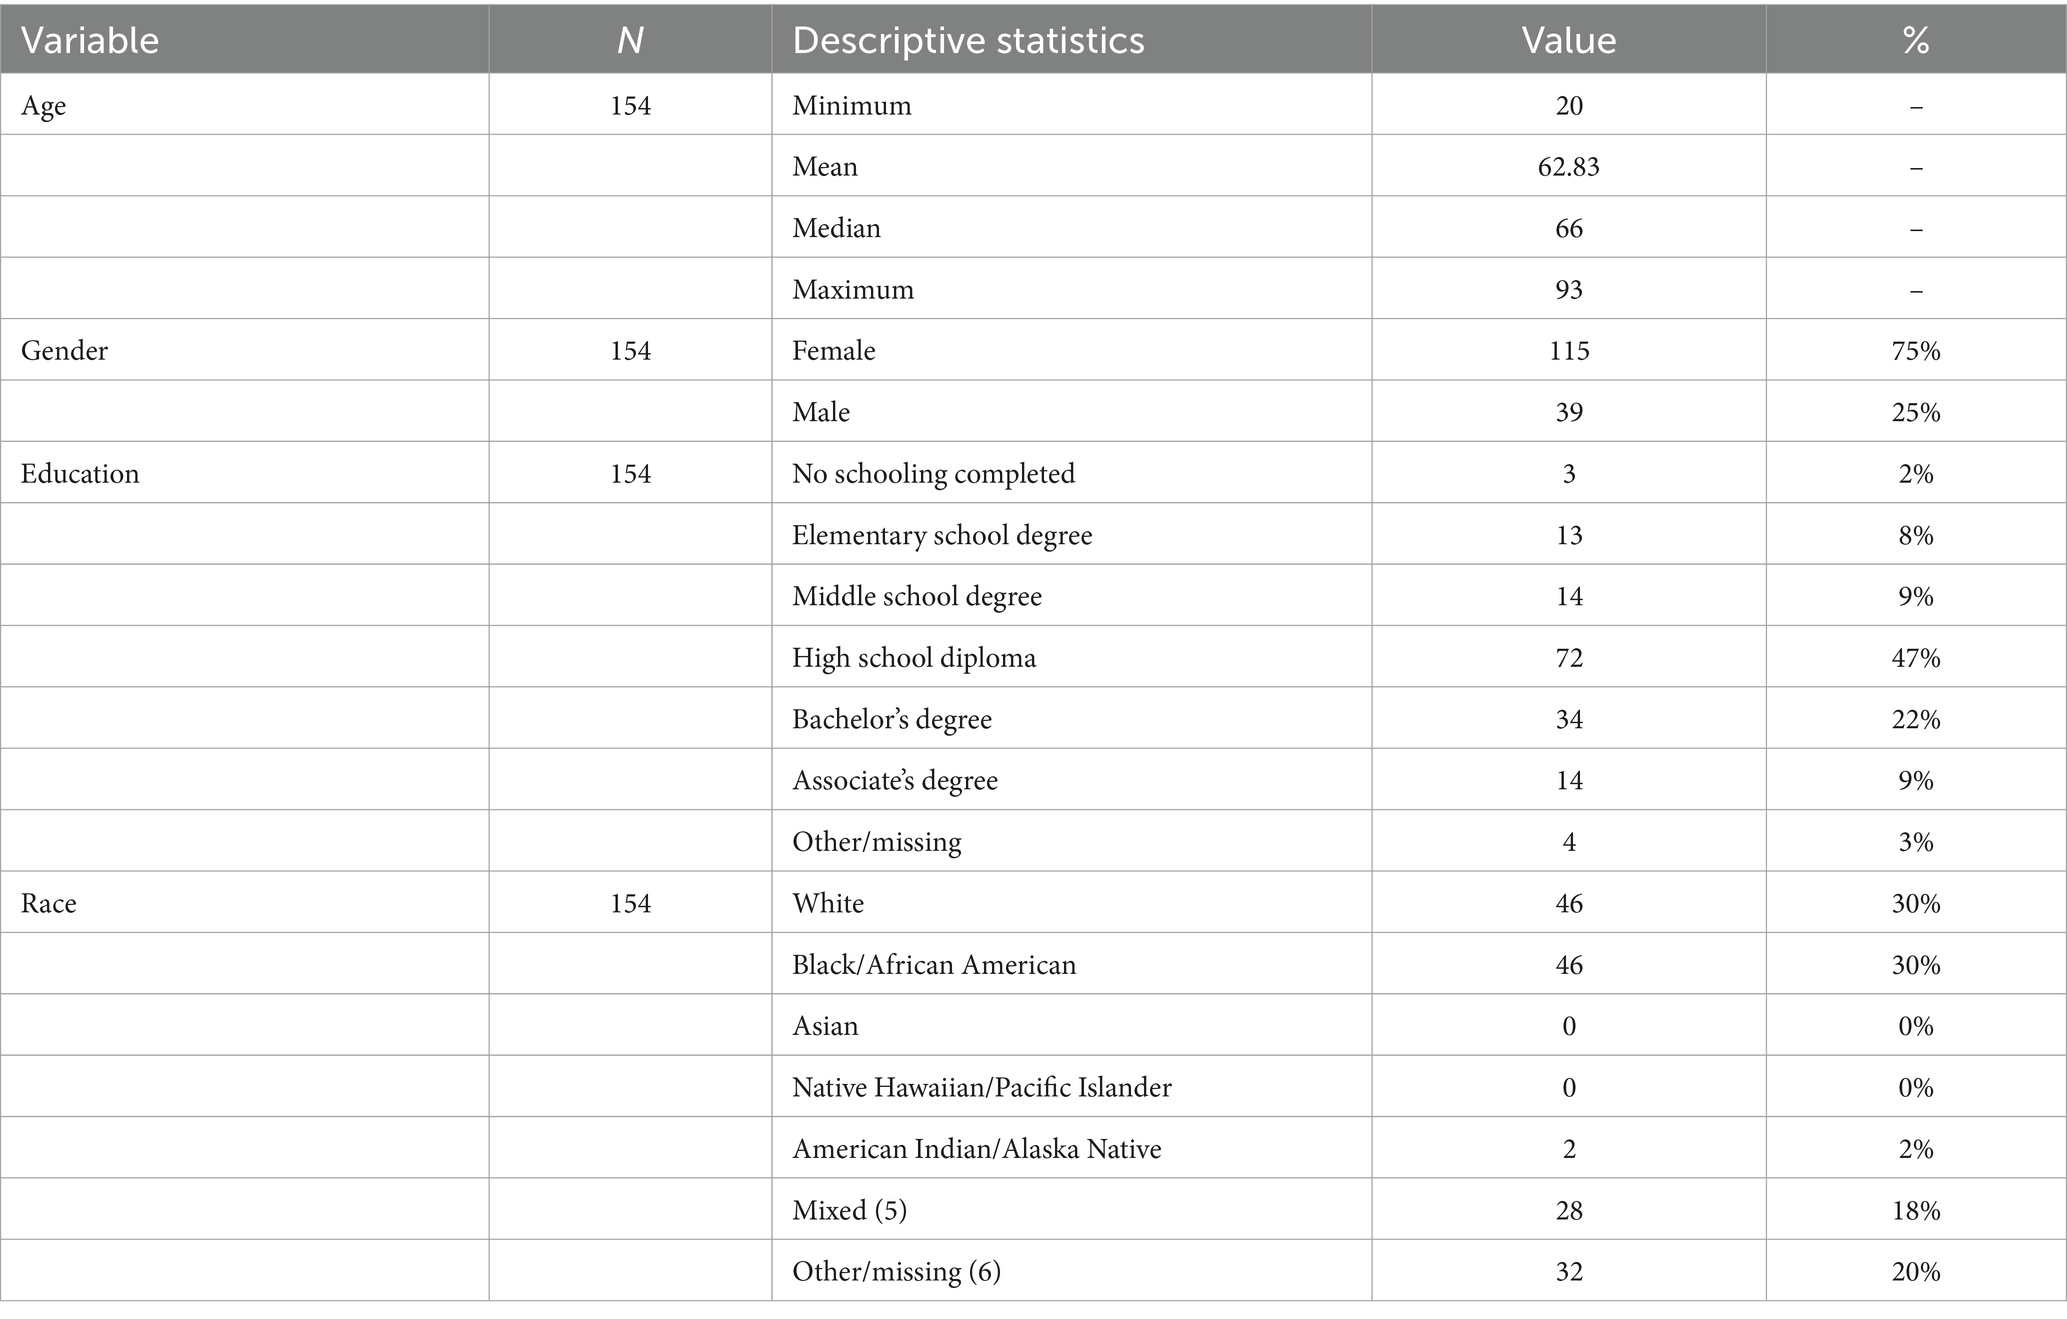
Table 2 reports the demographic characteristics of the participants in phase 1 of the study.
Correlation of WQPS items at phase 1
The Pearson correlation matrix in Figure 1 shows the relationships between the individual items of the initial 18-item WQPS. Coefficients range from −1 to 1, where 1 denotes a perfect positive correlation, −1 denotes a perfect negative correlation, and 0 indicates no correlation. The color gradient represents the direction and strength of these correlations: shades of blue indicate positive correlations, shades of red denote negative correlations, and the color’s intensity reflects the correlation’s magnitude. Most of these items indicate moderate to high correlation values among themselves. Such a pattern suggests the appropriateness of factor analysis (i.e., the items are factorable) and that each item correlated at an acceptable level with the total.
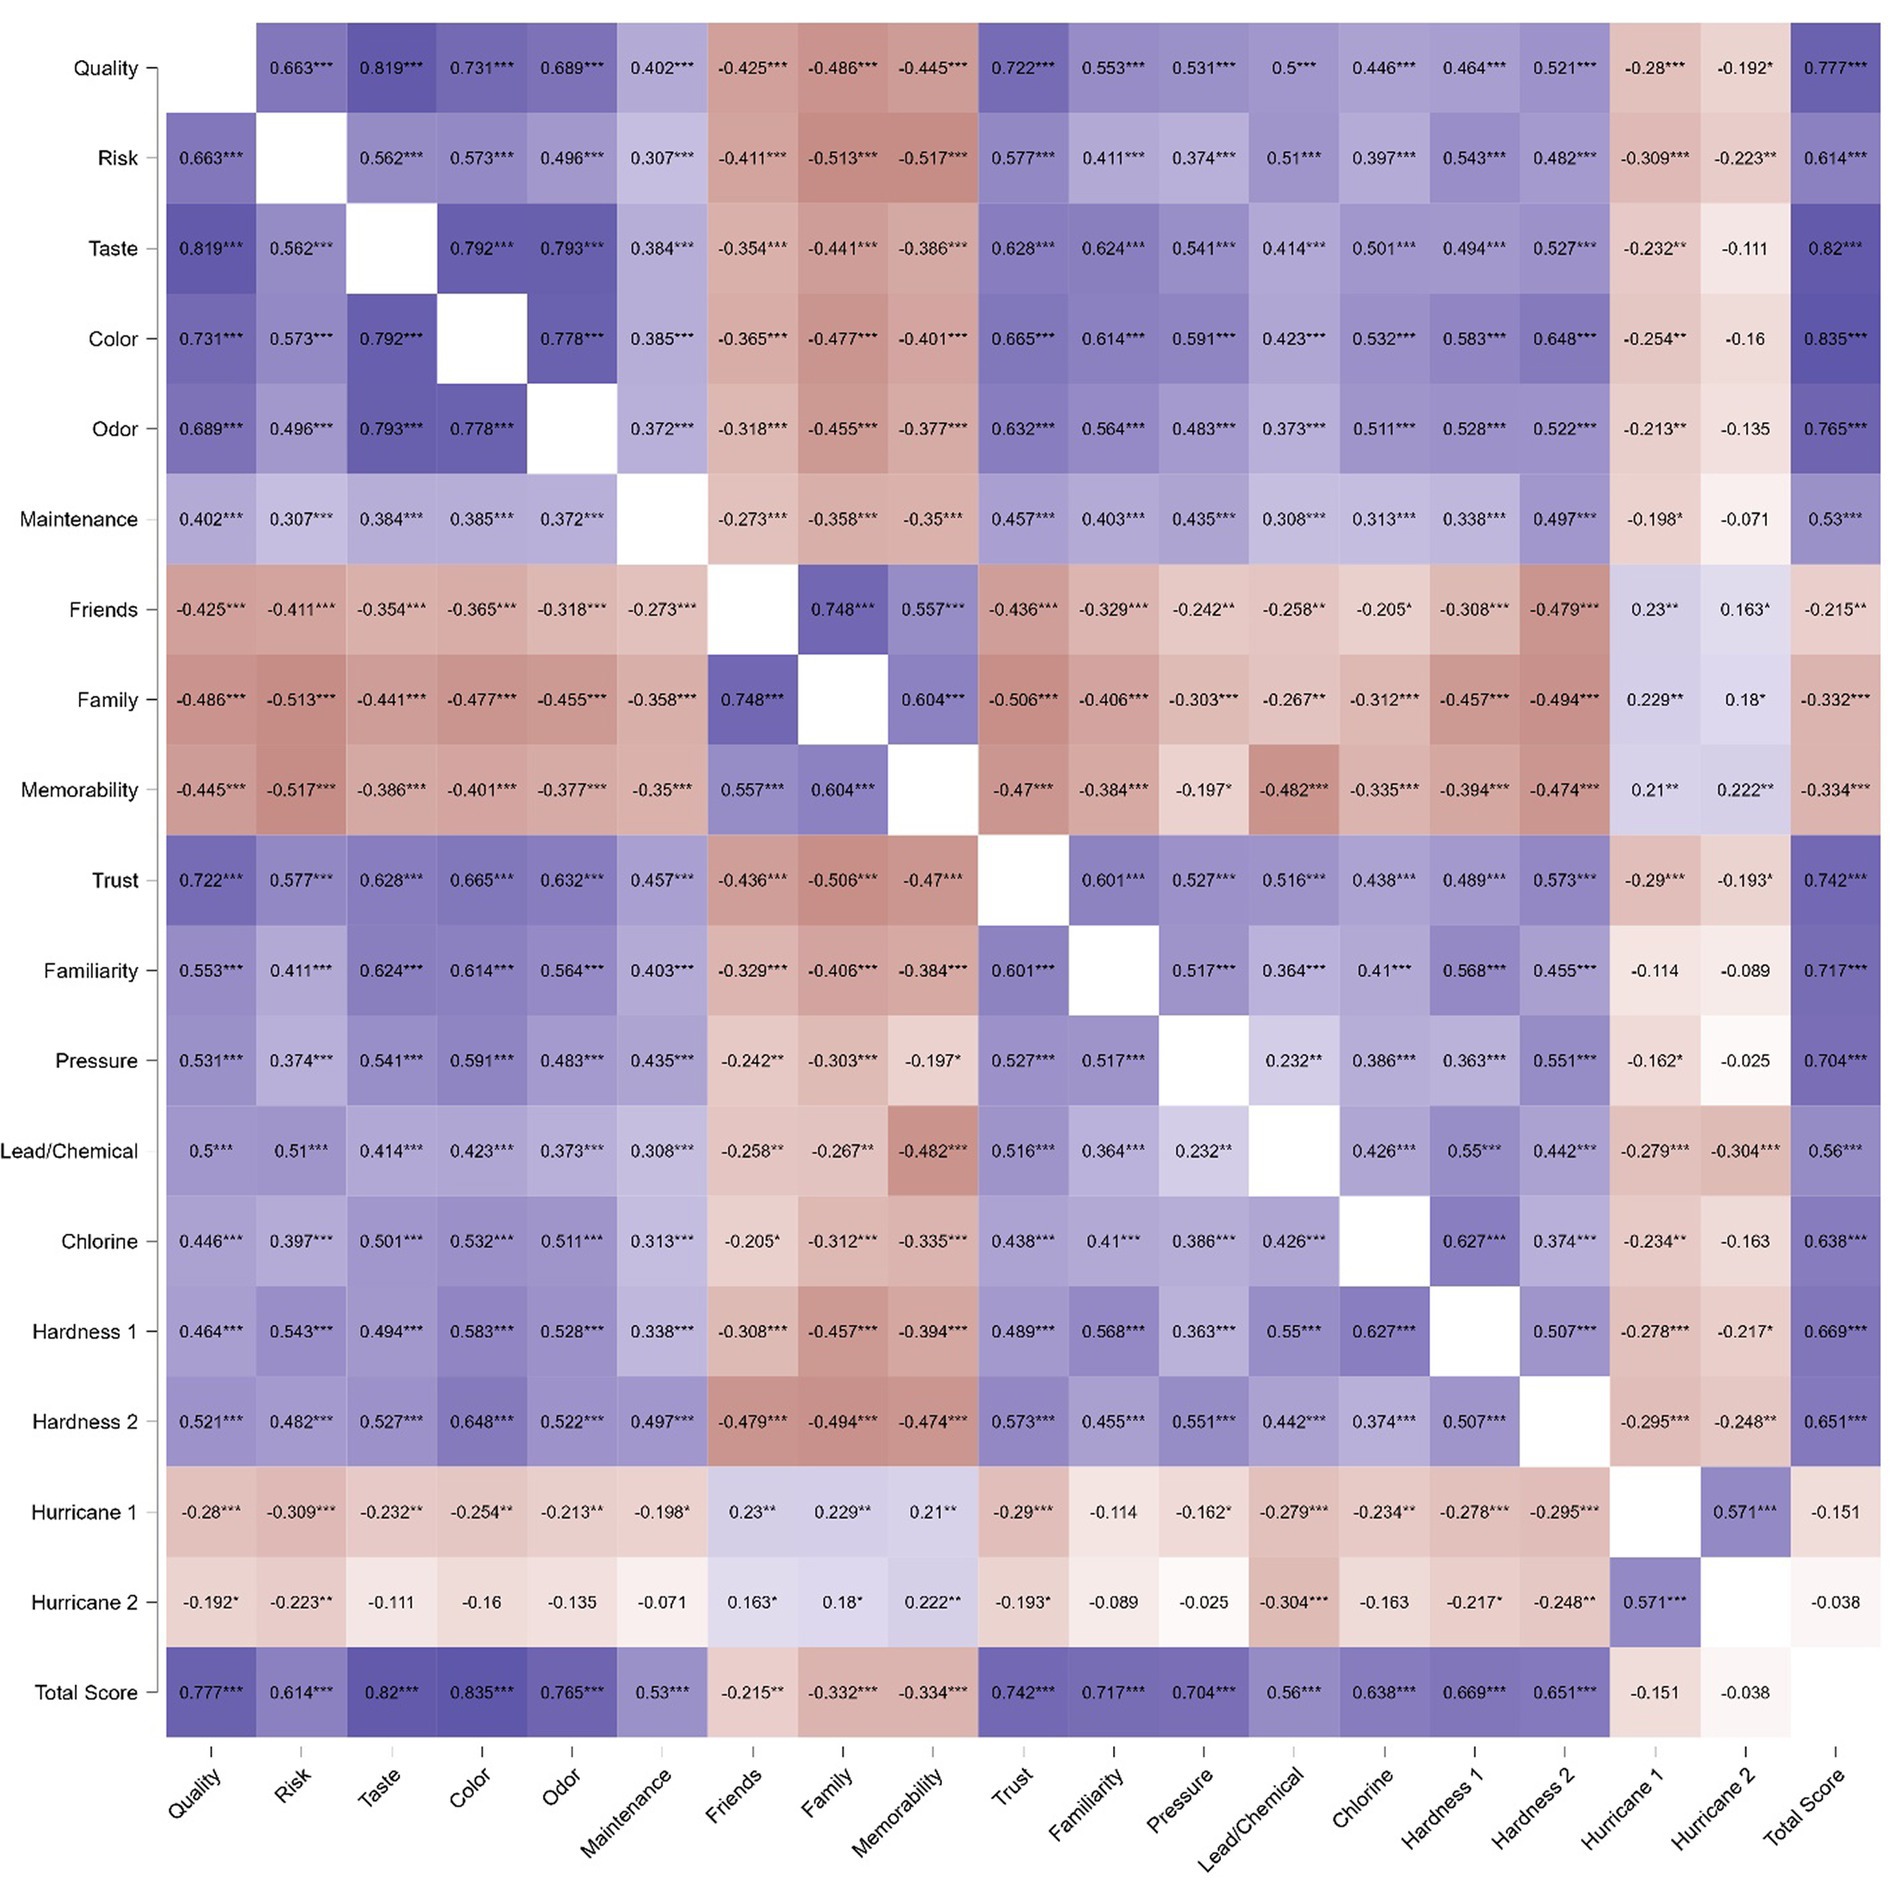
Figure 1. Pearson correlation matrix of initial WQPS items in phase 1 (***p < 0.01, **p < 0.05, *p < 0.1).
Exploratory factor analysis
The Kaiser–Meyer–Olkin (KMO) measure of sampling adequacy was 0.895, a value suggesting adequate sample size (Kaiser, 1991). Furthermore, Bartlett’s test of sphericity was significant (p < 0.001), thereby confirming that correlations between WQPS items were substantial enough to warrant factor analyses (Beavers et al., 2013). The data had a few missing values. Each item on the WQPS had between 0.65 to 9.74% missing.
A factor solution was obtained by considering Kaiser’s criterion (retaining factors with eigenvalues greater than one), the interpretability of obtained factor solutions, and the internal consistency of obtained factors provided by STATA 15, which suggested a three-factor model. Each factor potentially represented distinct dimensions of people’s perceptions related to water quality. Three factors with 18 items were extracted: (1) individual water quality perception (13 items); (2) external/family-induced water quality perception (3 items); and (3) hurricane-related water quality perception (2 items) (Table 3). Internal consistency (Cronbach’s alpha) for factors 1 was 0.93; for factors 2 and 3, internal consistency was 0.84 and 0.73, respectively (see Table 3). We identified the first factor as a reliable subscale because Cronbach’s a was larger than 0.9, which indicates excellent internal consistency (Cronbach, 1951; Taber, 2018).
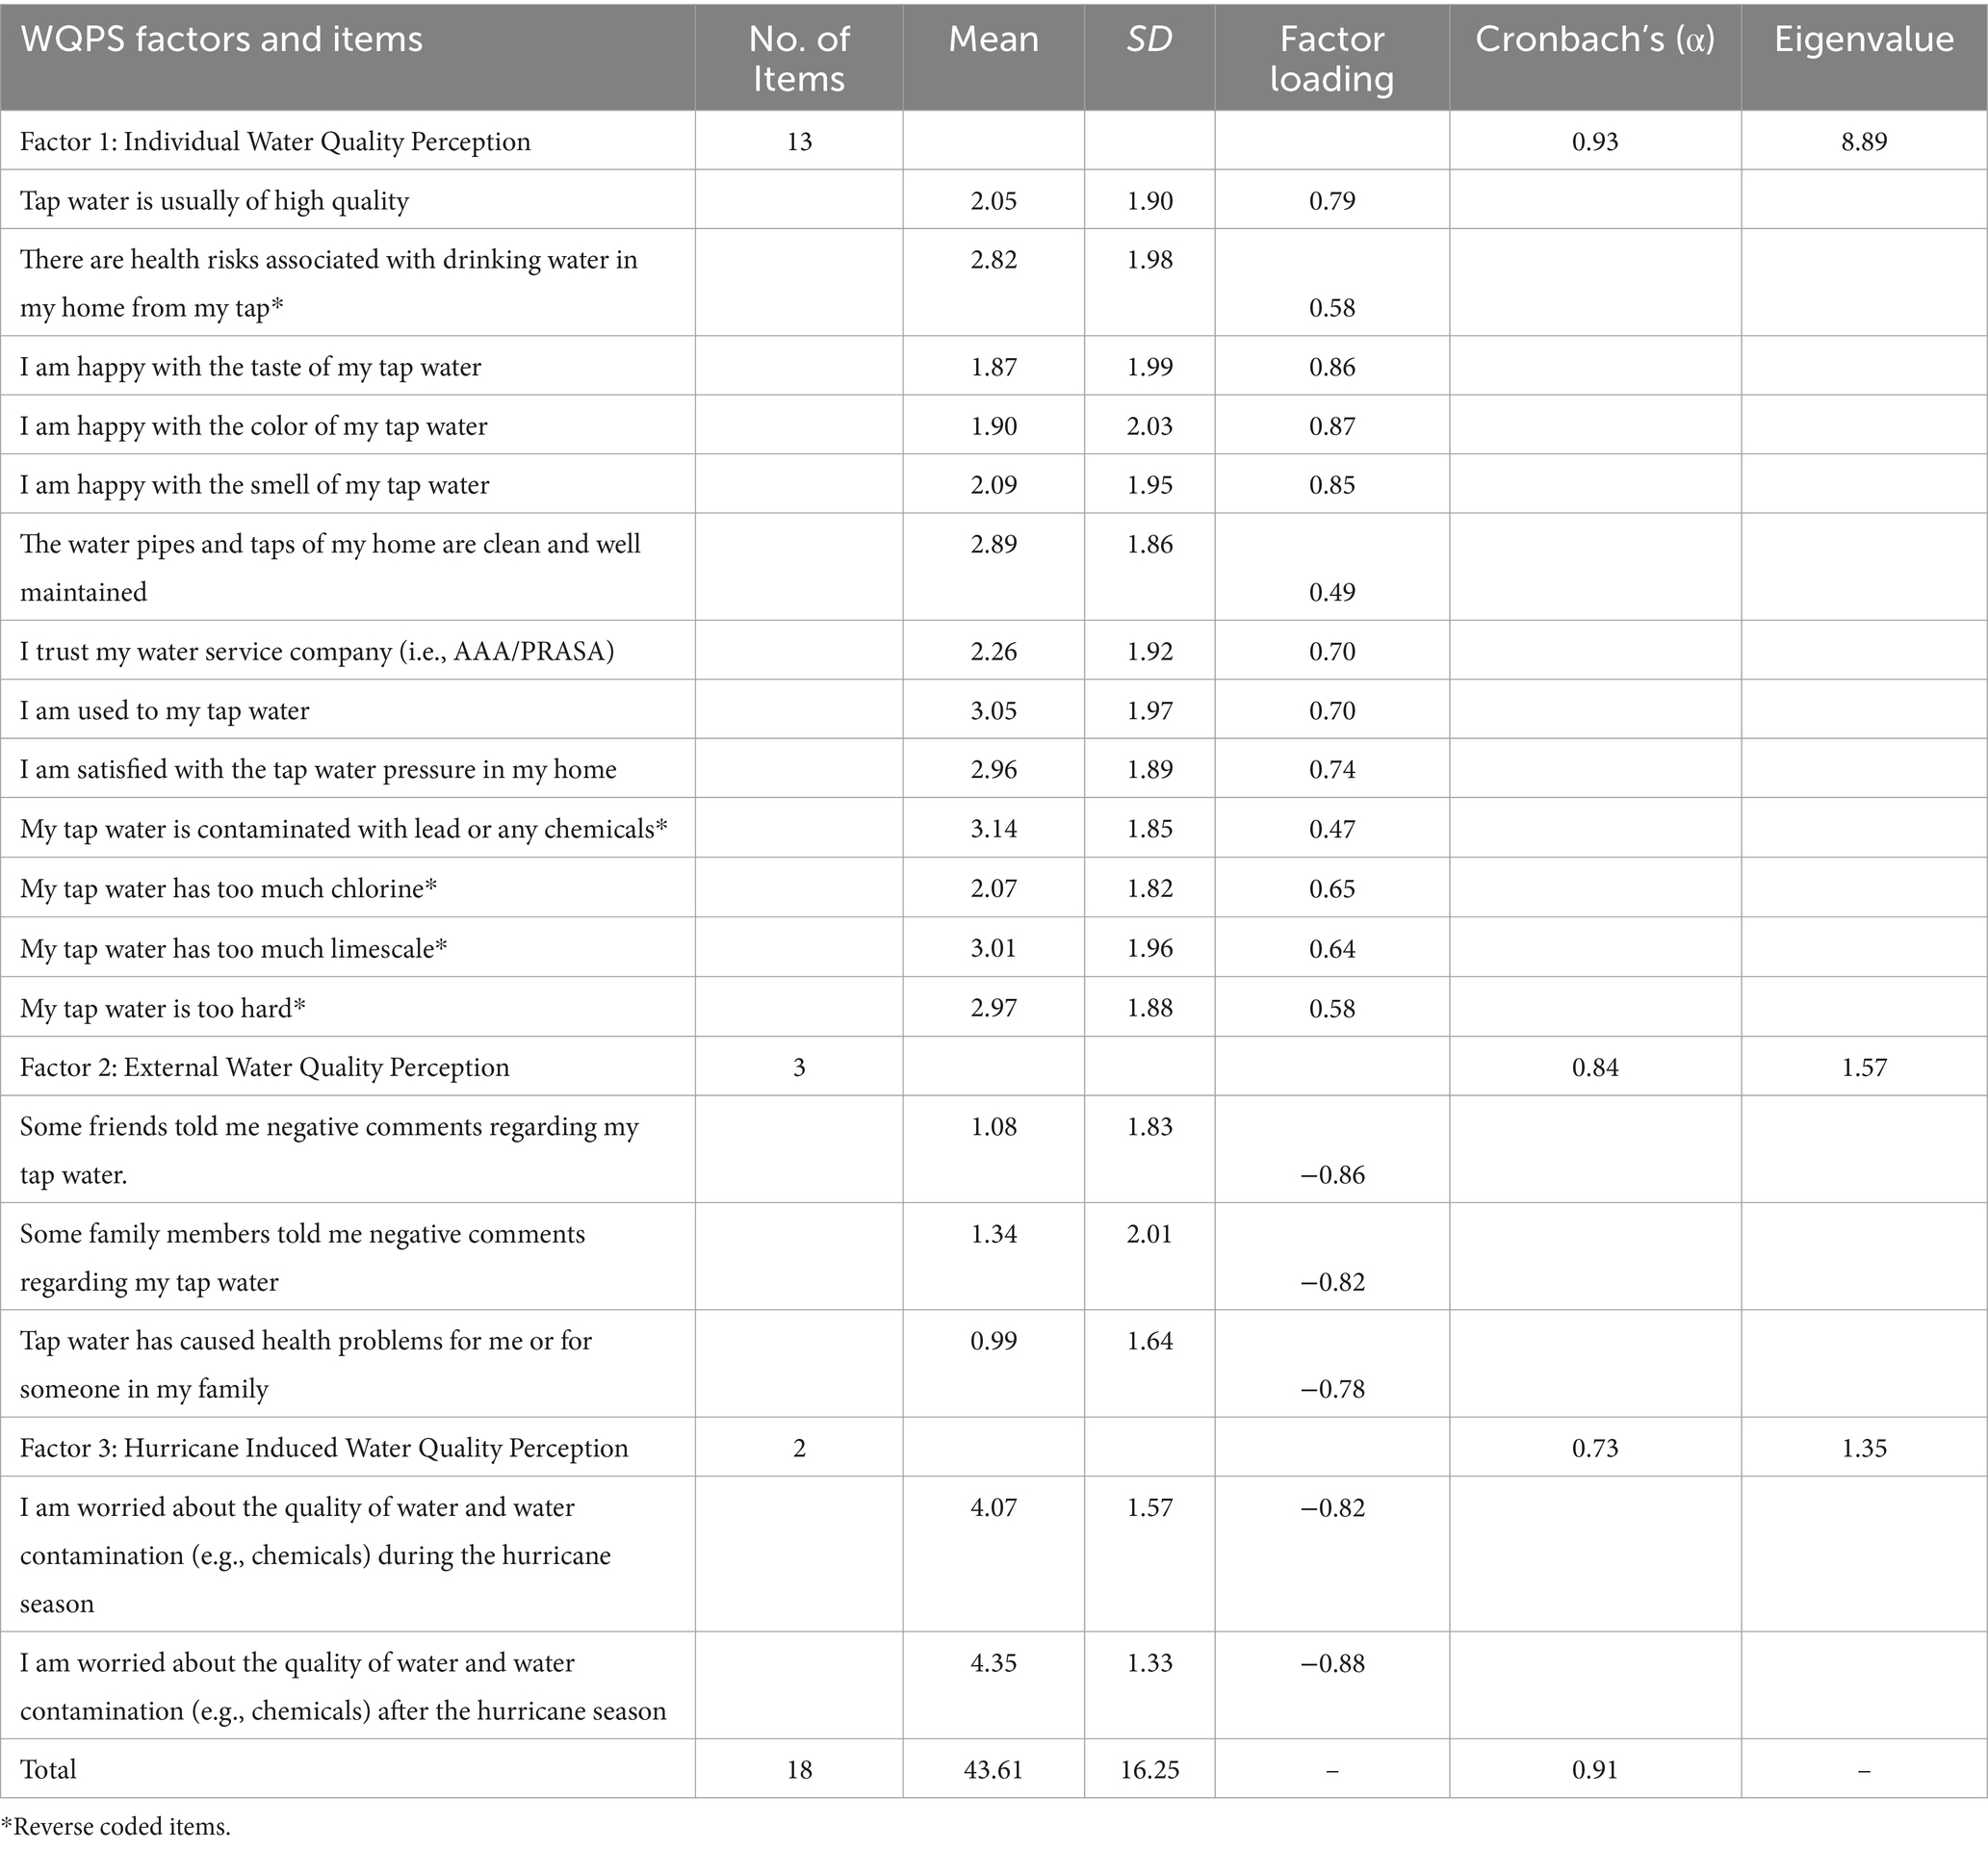
Table 3. Exploratory factor analysis of the water quality perception scale (WQPS) (all loadings >0.3).
Conceptually, factor 1 is comprised of items that directly reflect an individual’s subjective assessment of their tap water quality. Central to this factor appear to be those that directly address the sensory qualities of the water (taste, color, and smell) and health-related concerns (presence of chemicals or contaminants like lead, chlorine, or limescale). These items are critical as they are likely to have a direct and significant impact on an individual’s overall perception of water quality. Other items in this factor, like satisfaction with water pressure, trust in the water service company, and the condition of water pipes and taps, while still relevant, might be considered more peripheral. They contribute to the overall perception but might not be as directly influential as the sensory and health-related aspects. The high internal consistency of this factor suggests that these items when considered together, provide a comprehensive and reliable measure of an individual’s perception of their water quality.
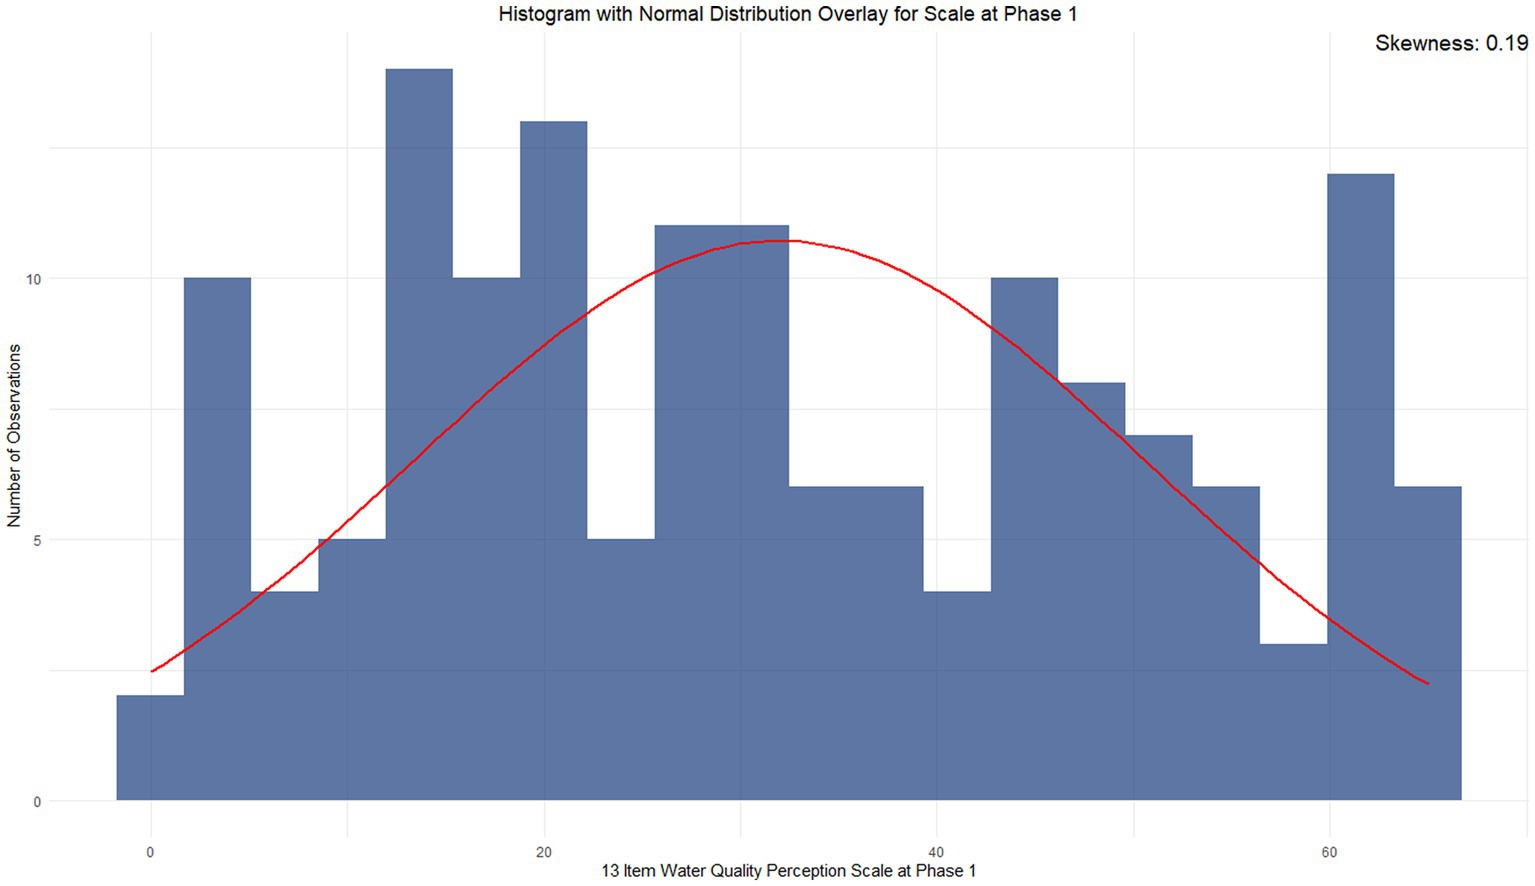
Despite the acceptable levels of internal consistency for factors 2 and 3, we encountered high skewness values that signaled a distributional bias in the responses (Dinno, 2009). Conceptually, factor 2 was external perception focused on the individual’s perception – these are on what others thought about water quality, and factor 3 was situation-dependent focusing on the hurricane. Coupled with the limited number of items for factors 2 and 3, factors 2 and 3 appear to be in need of additional refinement and additional development. Figure 2 shows the distribution curve of the total score of the 13-item WQPS at Phase 1.
Convergent validity
The Pearson correlation analysis revealed a correlation of −0.41 (p < 0.01) between the WQPS and HWISE scores. It suggests that when individuals have a high perception of their drinking water quality, they are likely to report lower levels of water insecurity, providing an estimate of convergent validity consistent with the prediction.
Phase 2
Descriptive statistics
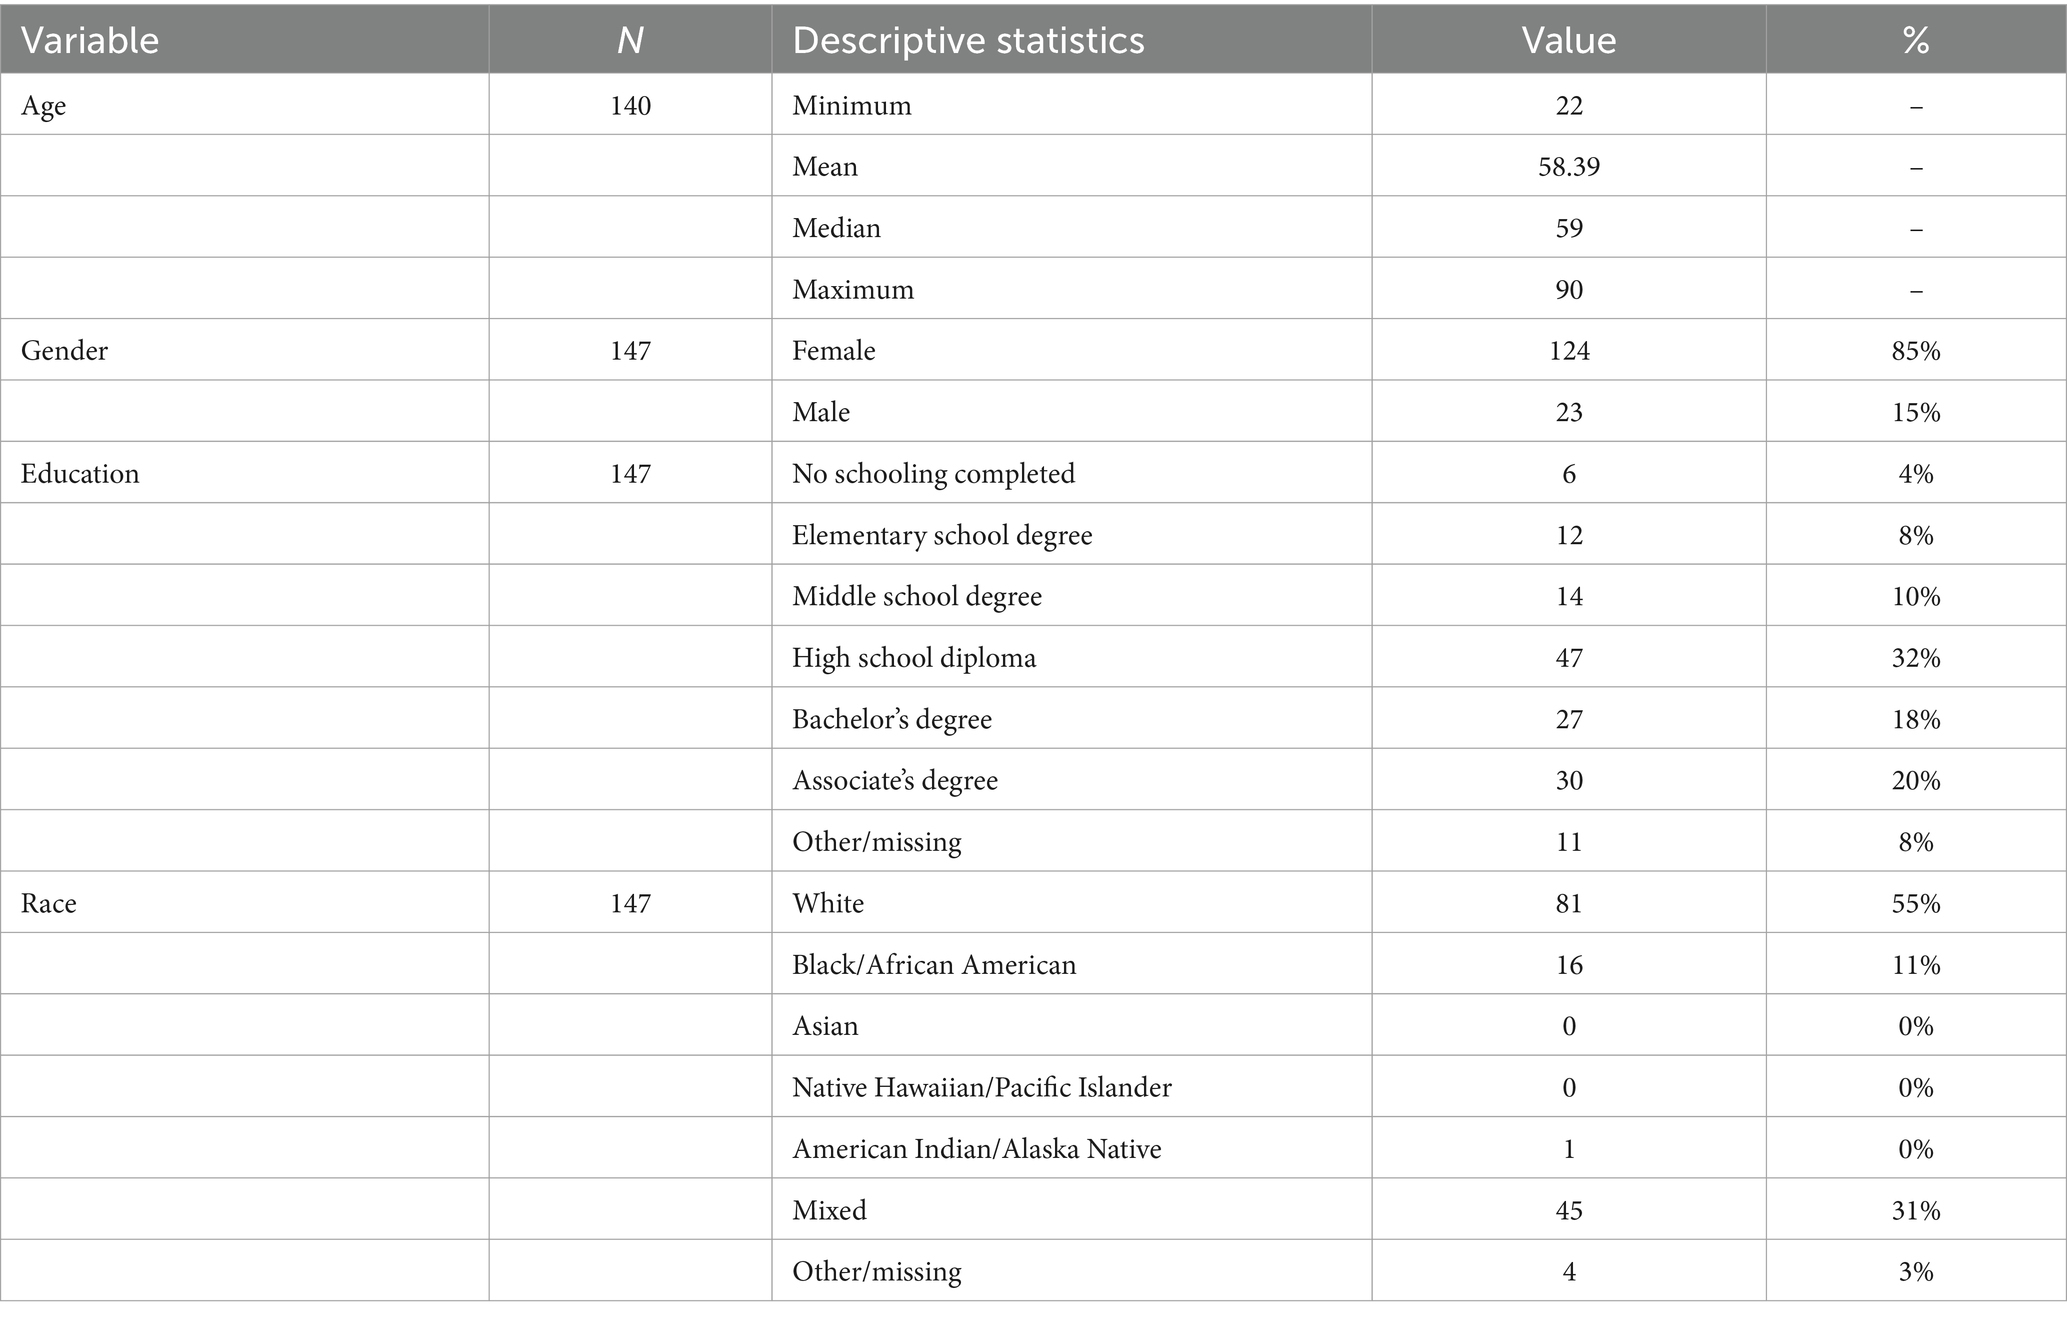
Table 4 illustrates the demographic breakdown of the participants in Phase 2 (N = 147), which included some recurring participants from Phase 1 (n = 74).
Correlation of final WQPS items at phase 2
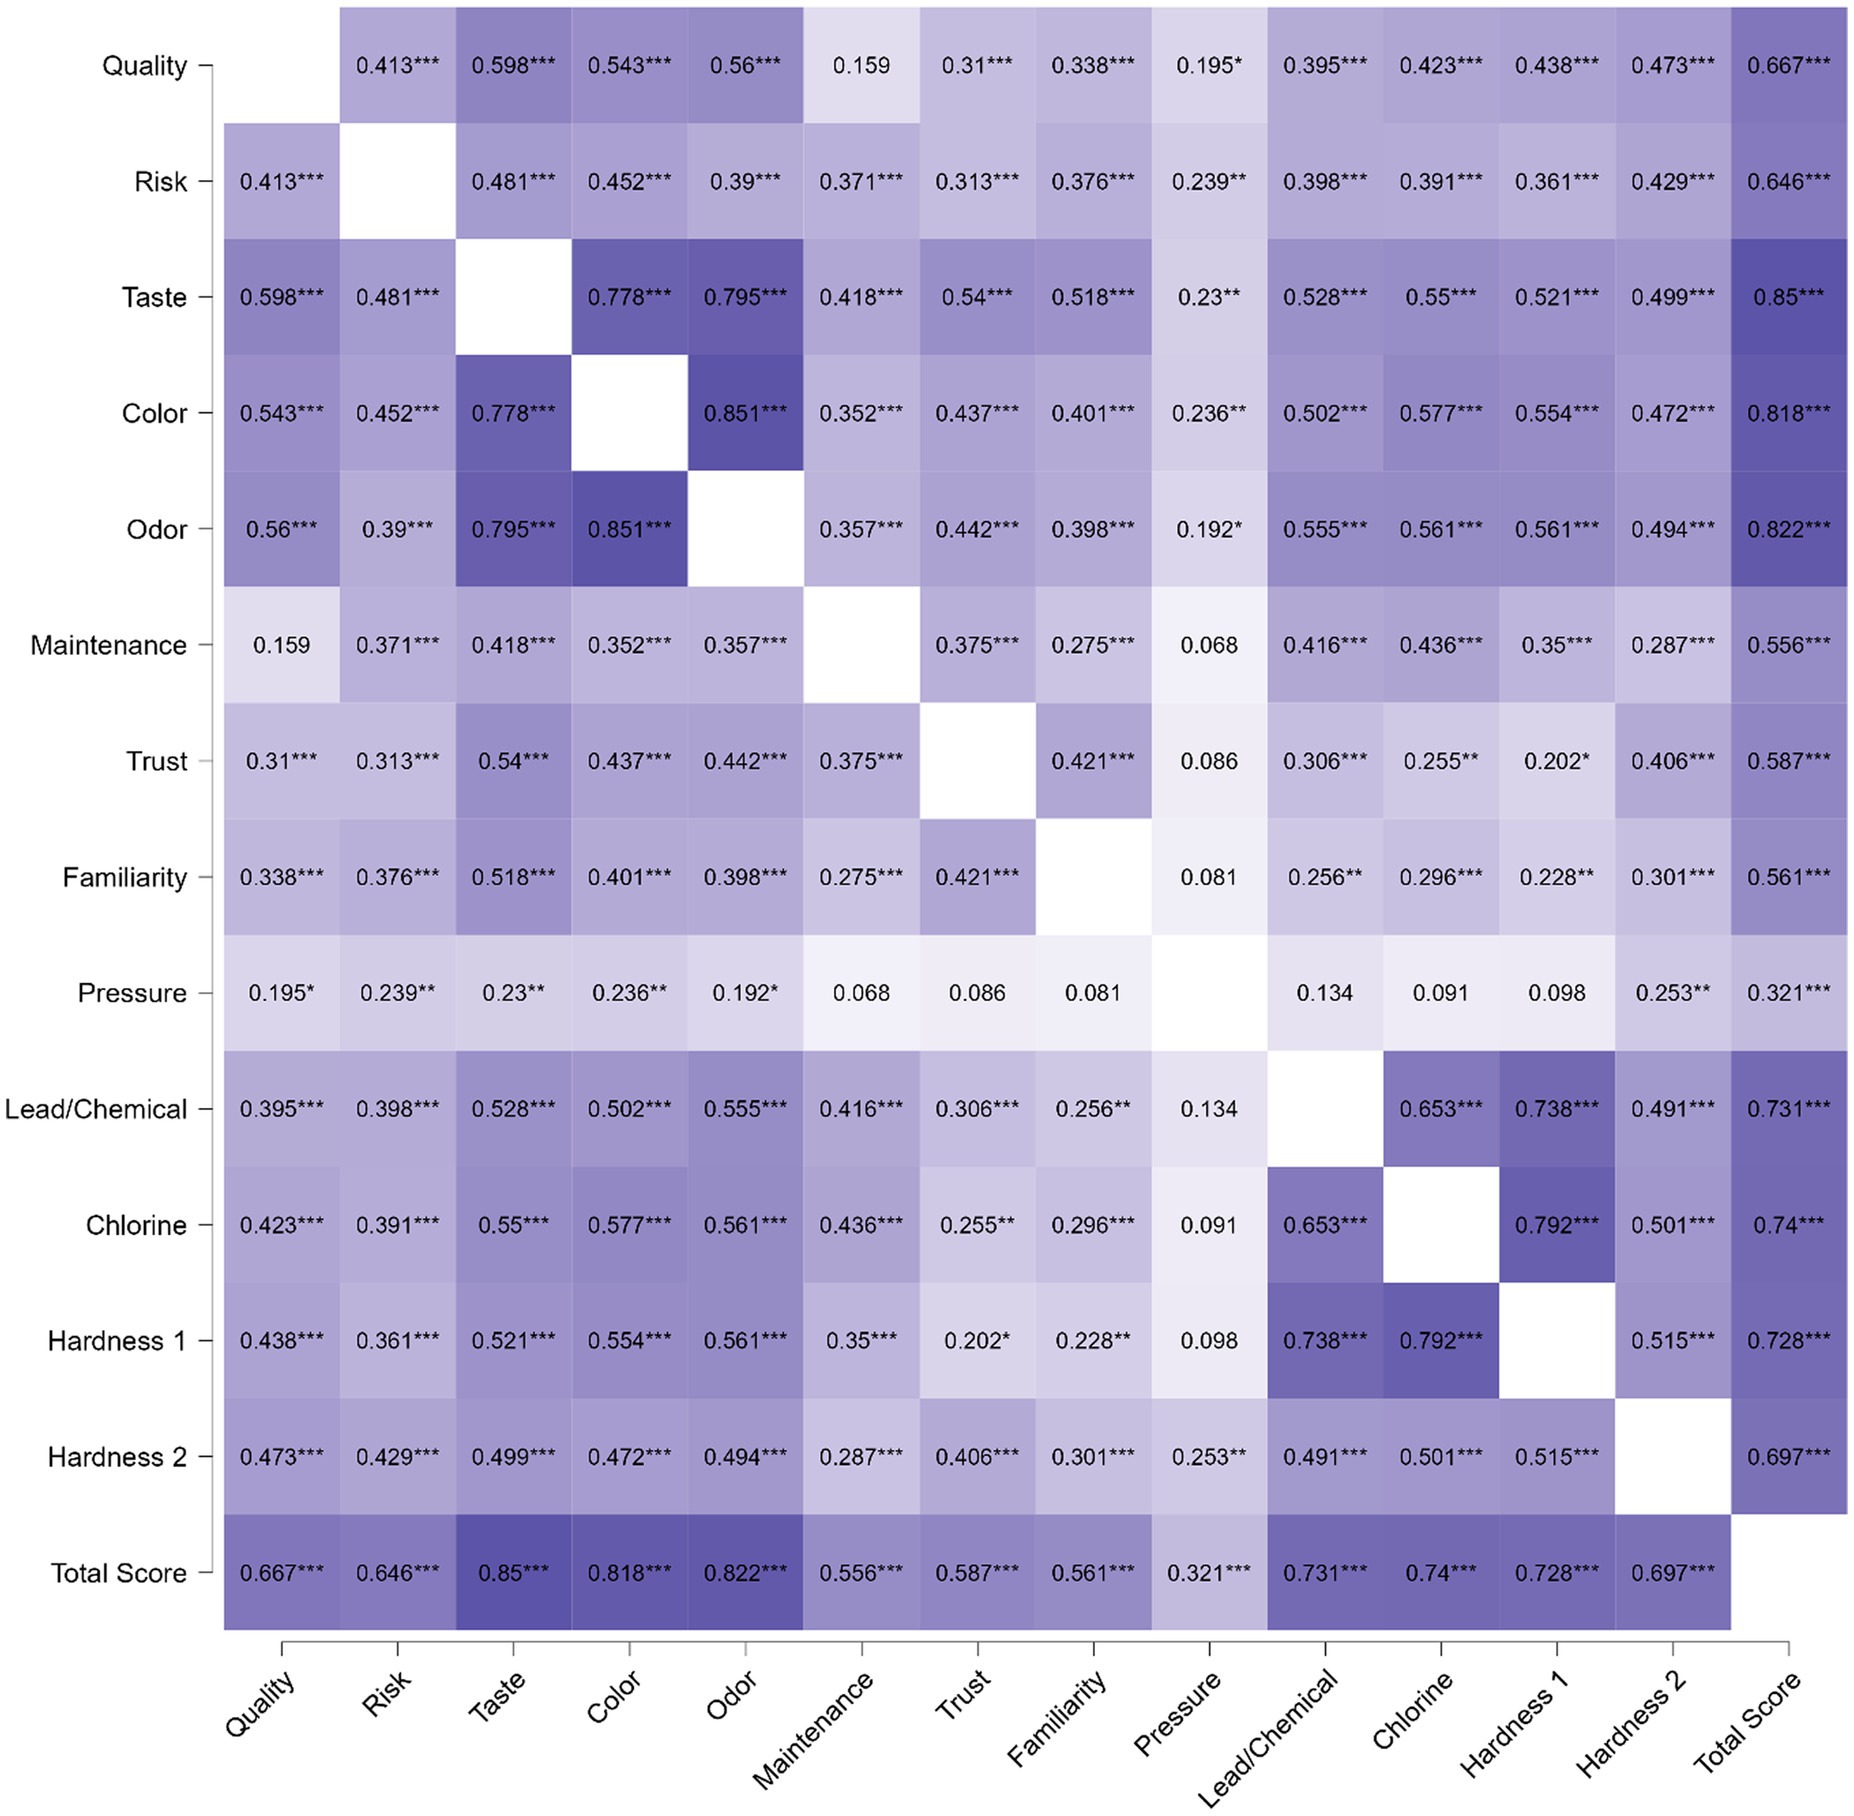
The Pearson correlation matrix in Figure 3 shows individual items of the final 13-item WQPS total score from Phase 1. The matrix again reveals, as in phase 1, that the majority of these items demonstrate moderate to high positive correlation values with each other. Such trends suggest a shared variance between these items, possibly alluding to underlying commonalities that these individual items may be addressing. Moreover, each item exhibits a positive correlation with the total score of the final WQPS, suggesting that they contribute significantly to the composite measure.
Confirmatory factor analysis
The CFA restricted loadings exclusively on the identified single factor (Marsh et al., 1998, 2020). The results of the CFA supported the adequacy of this one-factor model. Specifically, the initial fit parameters generated by STATA in the CFA were as follows: χ2(65) = 211.07 (p < 0.001), Root mean squared error of approximation (RMSEA) = 0.134, 90% confidence interval (CI) = [0.114, 0.154]. The Comparative fit index (CFI) and Tucker–Lewis index (TLI) values were 0.83 and 0.80, respectively, while the Standardized root mean squared residual (SRMR) was 0.08.
The model’s modification indices hinted that the estimation of error covariances between five item pairs could enhance the model. The five-item pairs were color-odor, color-lead/chemical, trust-familiarity, lead/chemical-hardness1, and chlorine-hardness1. Error covariances for the five-item pairs were then freely estimated. The final fit indices after modification generated by STATA in the CFA were as follows: χ2(59) = 73.67 (p = 0.095), RMSEA = 0.044, 90% confidence interval (CI) = [0.000, 0.074], indicating a good fit (Hu and Bentler, 1998). The CFI and TLI values were 0.98 and 0.97, respectively, surpassing the recommended 0.95 threshold often cited in research (Kashyap and Singh, 2017; Finch, 2020). The SRMR was 0.054, indicating an acceptable level of model fit way below the threshold of 0.09 (Cho et al., 2020).
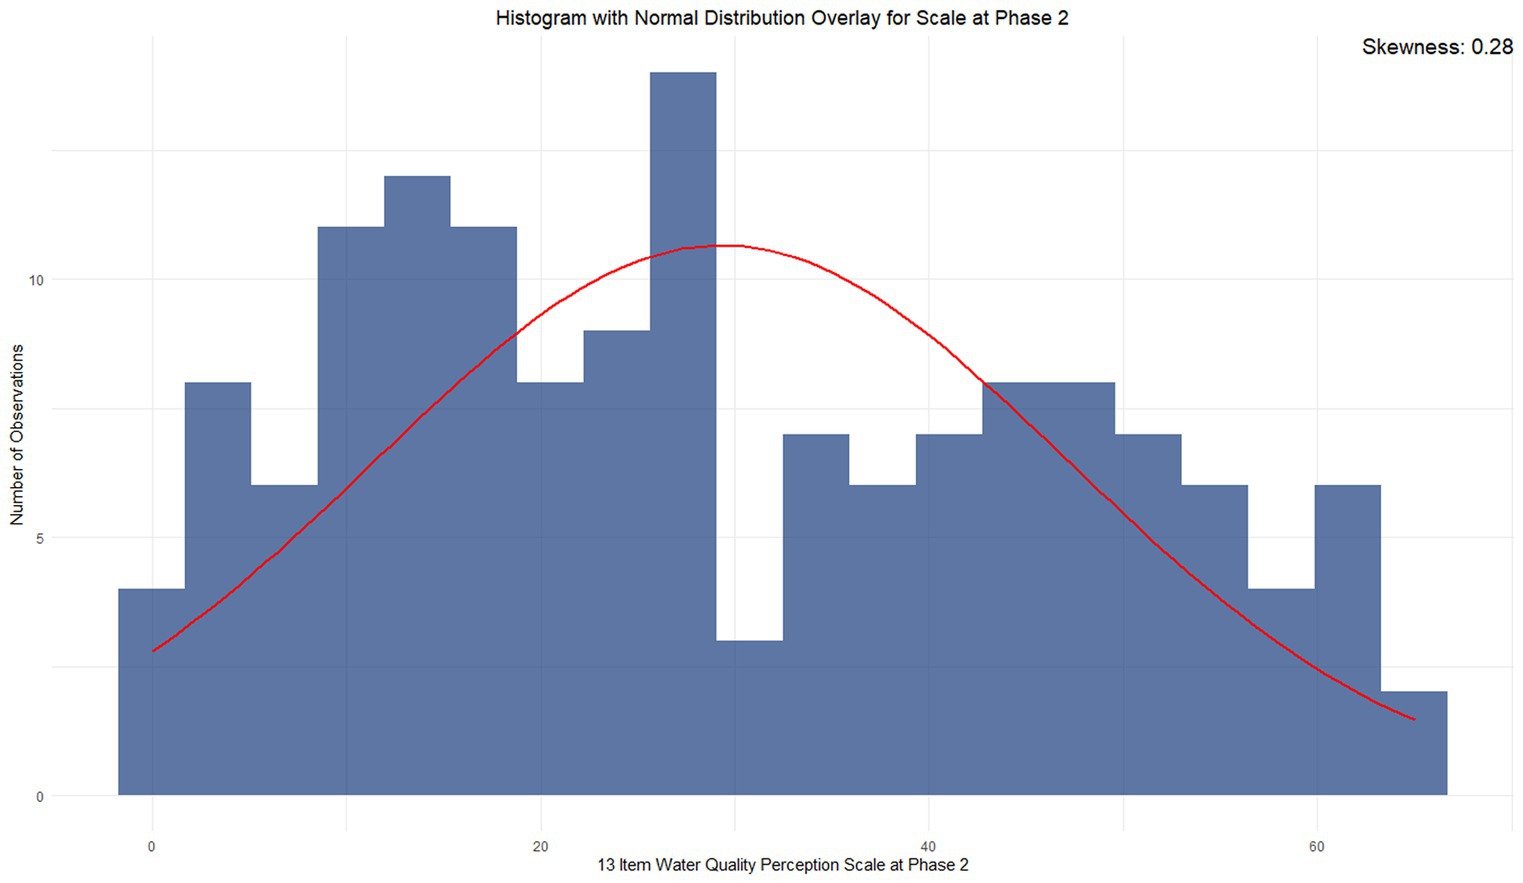
Figure 4 shows the distribution curve of the 13-item WQPS at phase 2. Finally, the internal consistency (Cronbach’s alpha) of the sample in phase was 0.90 in phase 2.
Convergent validity
The Pearson correlation revealed that the WQPS had a correlation of −0.49 (p < 0.01) with HWISE, again suggesting convergent validity.
Discussion
The analysis of water quality perceptions occupies a crucial intersection across multiple disciplines, including engineering, geosciences, and social sciences (Weems et al., 2023). This intersectionality highlights the necessity of examining both physical factors, such as the accessibility and sources of drinking water, and intangible factors, notably human water quality experiences and perceptions (Auslander and Langlois, 1993; Heekeren et al., 2008; Hu et al., 2011; Alhassan and Kwakwa, 2013). Accuracy and reliability in measuring these water quality perceptions are paramount. This study makes a significant stride toward refining the measurement of water quality perceptions, drawing parallels to the methodologies employed in assessing “water insecurity” via the Household Water Insecurity Experiences (HWISE) scale. The Water Quality Perception Scale (WQPS) developed through this research show promise for application in diverse contexts to enhance the understanding of water insecurity and promote uniformity in evaluation of water quality perceptions across different studies.
Further building on the foundational work by Doria et al. (2009), which illuminated the critical influence of sensory experiences—such as taste, color, and odor—on people’s perceptions of water quality, this research proposes a set of 13 key items that form the core of the “Individual Water Quality Perception” construct. These findings suggest a unitary construct that revolves around the direct sensory experiences that individuals have with drinking water, suggesting that water quality perceptions are integral components of how water quality is assessed and understood. Moreover, the observed negative correlation between perceived water quality (measured with the WQPS) and water insecurity (measured with HWISE) suggests that when individuals think highly of their water quality through positive sensory experiences such as clear appearance, pleasant taste, and absence of foul odors, their sense of water security increases. This correlation logically aligns with the expectation that water insecurities tend to diminish when perceptions of water quality are positive. Moreover, the internal consistency of the WQPS (Cronbach’s alpha) for the main scale was 0.93 phase 1 and 0.90 in phase 2. This is similar to previous estimates of the HWISE.
Additional findings warrant comment. First, the distributions illustrated in Figures 2, 4 are that suggesting variance in water quality perceptions was not symmetrically normal with an apparently bi-modal distribution in phase 2 (Figure 4) and somewhat multimodality in phase 1 (Figure 2). Future research is needed to examine the distributions of WQPS scores in larger samples. Second, is the Cronbach’s alpha of the HWISE which has been reported to be in the 0.84–0.93 range (Young et al., 2019) with internal consistency in this sample at alpha = 0.88 and this study provides additional support for the HWISE’s internal consistency and its convergent validity. As noted, previous data suggests the HWISE has equivalence of measurement, predictive, convergent, and discriminant validity (Young et al., 2019). Similar data is needed for the WQPS. Testing measurement invariance across reporters (e.g., sex, age, and language) and contexts is needed to ensure mean score differences that may emerge are not due to the measures functioning differently in different samples. Moreover, we predicted and found that the WQPS scale would be moderately (because water quality is similar but distinct from water insecurity) and negatively correlated with the HWISE (i.e., more water insecurity is associated with lowered water quality perceptions). How, when, and why exactly water insecurity is related to water quality perceptions is an interesting empirical and theoretical question in need of answers. This may be answered by examining different aspects of water insecurity (Stoler et al., 2023) and their linkages to water quality perceptions. Additional estimates of convergent, discriminant, and predictive validity of the WQPS are needed highlighting the limitations to this initial report.
Study limitations
The present study has several limitations but points to several areas of further study and refinement. The participant sample, chosen for an initial wide distribution of responses, may not fully represent the broader population. This calls for replication and refinement of the scale in additional settings or among additional groups. Large-scale studies of broader representative populations on drinking water vulnerabilities are needed. Moreover, the current set of items may not capture all facets of water quality perceptions that a more expansive item set could. Similarly, the question of whether specific terms like ‘limescale,’ often crucial in water quality discussions, are understood uniformly by all participants, especially considering varying educational and cultural backgrounds. Furthermore, self-reported measures always carry the risk of social desirability bias, where participants might provide responses they believe are expected rather than their true perceptions (Randall and Fernandes, 1991). However, as the scale primarily measures perception, such questioning remains a key method to capture beliefs and attitudes. Research on the linkages between different water compositions within safe drinking limits and quality perceptions may help in the refinement of future items. For instance, incorporating qualitative methods such as in-depth interviews or participatory workshops could offer richer, context-specific understandings of attitudes toward water quality (Lin et al., 2020; Nelson et al., 2023). Additionally, exploring more interdisciplinary research on sensory perception and environmental psychology can inform the development of more sophisticated items for measuring water quality perceptions. Furthermore, existing work on taste sensitivity could be applied in water quality perception research to develop more items (Puputti et al., 2018).
Language dialect differences and the translation of items, particularly for a study potentially involving multi-lingual participants, add another layer of complexity. Recognizing the importance of accurate and culturally sensitive translation, the study was translated into the Puerto Rican dialect of Spanish by one of the authors, a native of Puerto Rico. This approach indicates an understanding of the subtleties involved in translation and the impact of regional dialects on comprehension. Ensuring that participants, especially in regions where this dialect is spoken, have a consistent understanding of each item is crucial for the validity of the findings.
Lastly, while the research identified and focused on the “Individual Water Quality Perception,” it is crucial to remember that water quality perceptions are multifaceted, and other external indicators not deeply probed in this study might have significant influence. Future research should aim to address these limitations by developing and further refining the two other indicators related to “External Water Quality Perception” and “Hurricane Induced Water Quality Perception” identified in the study to provide a more comprehensive understanding of the topic.
Conclusion
This study provided initial psychometric data toward measuring and understanding public perception of water quality. Given the ever-growing concerns surrounding water insecurity globally, the WQPS items might be a valuable addition to the studies that aim to understand water crises. By complementing other similar measures, such as the HWISE scale, it may augment assessment of the myriad factors related to water security. Comprehensive, consistent and accurate measurement of water quality are at an important intersection between the engineering, social, policy, and human aspects of water security and sustainability (Weems et al., 2023) and helps answer the call for more comprehensive assessment (Stoler et al., 2023). Public perception is often an enigma for utility providers. Including this module of questions in Housing Surveys (such as the American Housing Survey) could provide data to determine and track the link between the perception of water quality and local-level communication regarding it (Sarkar, 2022), helping utility providers better understand user perceptions.
Periodic deployment of this scale in surveys can furnish utilities with real-time insights into public sentiment. Such proactive gauging of perceptions is pivotal, especially when navigating crises like contamination events or post-disaster scenarios. Addressing areas flagged by the public, whether it is the taste of tap water or concerns over contamination, allows utilities to prioritize interventions and bolster public trust. For instance, if misgivings about tap water’s taste become prominent, utility companies can engage in dual strategies: rectifying potential causes and launching awareness campaigns to educate the public, ensuring that misconceptions are addressed head-on. Public health officials, on the other hand, can also benefit from consistent and accurate assessment. An informed understanding of water quality perceptions can be helpful in devising strategies that nudge the populace from bottled water reliance to increased tap water consumption, addressing both health and environmental concerns.
Lastly, policymakers can utilize consistent and accurate assessments to shape nuanced, community-centric water policies. An in-depth grasp of public sentiment, as facilitated by the scale, ensures that policies resonate with community concerns and aspirations. During crises and disasters, such a tool may be helpful in guiding the formulation and communication of swift, effective response strategies.
Data availability statement
The original contributions presented in the study are included in the article/Supplementary material, further inquiries can be directed to the corresponding author.
Ethics statement
The studies involving humans were approved by Iowa State University Institutional Review Board. The studies were conducted in accordance with the local legislation and institutional requirements. The participants provided their written informed consent to participate in this study.
Author contributions
TN: Writing – review & editing, Writing – original draft, Visualization, Validation, Software, Methodology, Formal analysis, Data curation, Conceptualization. CP: Writing – review & editing, Writing – original draft, Validation, Supervision, Resources, Project administration, Methodology, Funding acquisition, Conceptualization. CW: Writing – review & editing, Writing – original draft, Validation, Supervision, Software, Resources, Methodology, Funding acquisition, Formal analysis, Conceptualization. KI: Writing – review & editing, Supervision, Resources, Project administration, Methodology, Funding acquisition. IG: Writing – review & editing, Supervision, Resources, Project administration, Methodology, Funding acquisition, Data curation. CR: Writing – review & editing, Supervision, Resources, Project administration, Methodology, Funding acquisition.
Funding
The author(s) declare that financial support was received for the research, authorship, and/or publication of this article. This work was supported by the U.S. Environmental Protection Agency (Award #84004001) and U.S. National Science Foundation (Award #2302205) to CP, CW, KI, IG, and CR at Iowa State University and Texas A&M University. It has not been formally reviewed by the funding agencies. The views expressed in this document are solely those of the authors and do not necessarily reflect those of the funding agencies. The funding agencies do not endorse any products or commercial services mentioned in this publication.
Conflict of interest
The authors declare that the research was conducted in the absence of any commercial or financial relationships that could be construed as a potential conflict of interest.
Publisher’s note
All claims expressed in this article are solely those of the authors and do not necessarily represent those of their affiliated organizations, or those of the publisher, the editors and the reviewers. Any product that may be evaluated in this article, or claim that may be made by its manufacturer, is not guaranteed or endorsed by the publisher.
Supplementary material
The Supplementary material for this article can be found online at: https://www.frontiersin.org/articles/10.3389/frwa.2024.1357921/full#supplementary-material
References
Agunbiade, O. M., and Ogunleye, O. V. (2012). Constraints to exclusive breastfeeding practice among breastfeeding mothers in Southwest Nigeria: implications for scaling up. Int. Breastfeed. J. 7:5. doi: 10.1186/1746-4358-7-5
Alhassan, H., and Kwakwa, P. A. (2013). When water is scarce: the perception of water quality and effects on the vulnerable. J. Water Sanit. Hyg. Dev. 4, 43–50. doi: 10.2166/washdev.2013.140
Auslander, B. A., and Langlois, P. H. (1993). Toronto tap water: perception of its quality and use of alternatives. Can. J. Public Health 84, 99–102,
Beavers, A. S., Lounsbury, J. W., Richards, J. K., Huck, S. W., Skolits, G. J., and Esquivel, S. L. (2013). Practical considerations for using exploratory factor analysis in educational research. Pract. Assess. Res. Eval. 18:6. doi: 10.7275/qv2q-rk76
Braun, V., Clarke, V., Boulton, E., Davey, L., and McEvoy, C. (2021). The online survey as a qualitative research tool. Int. J. Soc. Res. Methodol. 24, 641–654. doi: 10.1080/13645579.2020.1805550
Brown, P., Vega, C. M. V., Murphy, C. B., Welton, M., Torres, H., Rosario, Z., et al. (2018). Hurricanes and the environmental Justice Island: Irma and Maria in Puerto Rico. Environ. Justice 11, 148–153. doi: 10.1089/env.2018.0003
Cho, G., Hwang, H., Sarstedt, M., and Ringle, C. M. (2020). Cutoff criteria for overall model fit indexes in generalized structured component analysis. J. Mark. Anal. 8, 189–202. doi: 10.1057/s41270-020-00089-1
Crespo, N. F., Curado, C., Oliveira, M., and Muñoz-Pascual, L. (2021). Entrepreneurial capital leveraging innovation in micro firms: a mixed-methods perspective. J. Bus. Res. 123, 333–342. doi: 10.1016/j.jbusres.2020.10.001
Cronbach, L. J. (1951). Coefficient alpha and the internal structure of tests. Psychometrika 16, 297–334. doi: 10.1007/BF02310555
Davis, K., Minckas, N., Bond, V., Clark, C. J., Colbourn, T., Drabble, S. J., et al. (2019). Beyond interviews and focus groups: a framework for integrating innovative qualitative methods into randomised controlled trials of complex public health interventions. Trials 20:329. doi: 10.1186/s13063-019-3439-8
Dinno, A. (2009). Exploring the sensitivity of Horn’s parallel analysis to the distributional form of random data. Multivar. Behav. Res. 44, 362–388. doi: 10.1080/00273170902938969
Doria, M. F. (2006). Bottled water versus tap water: understanding consumers’ preferences. J. Water Health 4, 271–276. doi: 10.2166/wh.2006.0023
Doria, M. F. (2010). Factors influencing public perception of drinking water quality. Water Policy 12, 1–19. doi: 10.2166/wp.2009.051
Doria, M. d. F., Pidgeon, N., and Hunter, P. R. (2009). Perceptions of drinking water quality and risk and its effect on behaviour: a cross-national study. Sci. Total Environ. 407, 5455–5464. doi: 10.1016/j.scitotenv.2009.06.031
Duan, W., Takara, K., He, B., Luo, P., Nover, D., and Yamashiki, Y. (2013). Spatial and temporal trends in estimates of nutrient and suspended sediment loads in the Ishikari River, Japan, 1985 to 2010. Sci. Total Environ. 461-462, 499–508. doi: 10.1016/j.scitotenv.2013.05.022
Eden, S. (1996). Public participation in environmental policy: considering scientific, counter-scientific and non-scientific contributions. Public Underst. Sci. 5, 183–204. doi: 10.1088/0963-6625/5/3/001
Enders, C. K. (2001). The performance of the full information maximum likelihood estimator in multiple regression models with missing data. Educ. Psychol. Meas. 61, 713–740. doi: 10.1177/0013164401615001
Finch, W. H. (2020). Using fit statistic differences to determine the optimal number of factors to retain in an exploratory factor analysis. Educ. Psychol. Meas. 80, 217–241. doi: 10.1177/0013164419865769
Fischbach, J. R., Warren May, L., Whipkey, K., Shelton, S. R., Vaughan, C. A., Tierney, D., et al. (2020). After hurricane Maria: Predisaster conditions, hurricane damage, and recovery needs in Puerto Rico. RAND Corporation. Available at: https://www.rand.org/pubs/research_reports/RR2595.html.
Gholizadeh, M., Melesse, A., and Reddi, L. (2016). A comprehensive review on water quality parameters estimation using remote sensing techniques. Sensors 16:1298. doi: 10.3390/s16081298
Ghosh, A. K., Mecklenburg, M., Ibrahim, S., and Daniel, P. (2021). Health care needs in the aftermath of hurricane Maria in Puerto Rico: a Perspective from Federal Medical Shelter Manatí. Prehosp. Disaster Med. 36, 260–264. doi: 10.1017/S1049023X21000339
Goss, J. D., and Leinbach, T. R. (1996). Focus groups as alternative research practice: experience with Transmigrants in Indonesia. Area 28, 115–123,
Grey, D., Garrick, D., Blackmore, D., Kelman, J., Muller, M., and Sadoff, C. (2013). Water security in one blue planet: twenty-first century policy challenges for science. Philos. Trans. R. Soc. A Math. Phys. Eng. Sci. 371:20120406. doi: 10.1098/rsta.2012.0406
Heekeren, H. R., Marrett, S., and Ungerleider, L. G. (2008). The neural systems that mediate human perceptual decision making. Nat. Rev. Neurosci. 9, 467–479. doi: 10.1038/nrn2374
Hoekstra, A. Y., Chapagain, A. K., and Van Oel, P. R. (2017). Advancing water footprint assessment research: challenges in monitoring Progress towards sustainable development goal 6. Water 9:438. doi: 10.3390/w9060438
Holladay, P., Méndez-Lázaro, P., and Brundiers, K. (2021). From hurricanes to pandemics: community-based transformation and destination resilience in Utuado, Puerto Rico. J. Sustain. Resilience 1,
Hu, L., and Bentler, P. M. (1998). Fit indices in covariance structure modeling: sensitivity to under parameterized model misspecification. Psychol. Methods 3, 424–453. doi: 10.1037/1082-989X.3.4.424
Hu, Z., Morton, L. W., and Mahler, R. L. (2011). Bottled water: United States consumers and their perceptions of water quality. Int. J. Environ. Res. Public Health 8, 565–578. doi: 10.3390/ijerph8020565
Janus, M., and Offord, D. R. (2007). Development and psychometric properties of the early development instrument (EDI): a measure of children’s school readiness. Can. J. Behav. Sci. 39, 1–22. doi: 10.1037/cjbs2007001
Kaiser, H. F. (1991). Coefficient alpha for a principal component and the Kaiser-Guttman rule. Psychol. Rep. 68, 855–858. doi: 10.2466/pr0.1991.68.3.855
Kashyap, G. C., and Singh, S. K. (2017). Reliability and validity of general health questionnaire (GHQ-12) for male tannery workers: a study carried out in Kanpur, India. BMC Psychiat. 17:102. doi: 10.1186/s12888-017-1253-y
Kaufman, A. C. (2019). Puerto Rico’s next big crisis is water. HuffPost. Available at: https://www.huffpost.com/entry/puerto-rico-water_n_5dd2e6e9e4b0d2e79f917f43.
Kim, M., De Vito, R., Duarte, F., Tieskens, K., Luna, M., Salazar-Miranda, A., et al. (2023). Boil water alerts and their impact on the unexcused absence rate in public schools in Jackson, Mississippi. Nature. Water 1, 359–369. doi: 10.1038/s44221-023-00062-z
Laskow, S. (2018). The hidden problems with Puerto Rico’s water supply. Atlas Obscura. Available at: http://www.atlasobscura.com/articles/puerto-rico-hurricane-water-contamination.
Levêque, J. G., and Burns, R. C. (2017). A structural equation modeling approach to water quality perceptions. J. Environ. Manag. 197, 440–447. doi: 10.1016/j.jenvman.2017.04.024
Lin, Y., Sevillano-Rivera, M., Jiang, T., Li, G., Cotto, I., Vosloo, S., et al. (2020). Impact of hurricane Maria on drinking water quality in Puerto Rico. Environ. Sci. Technol. 54, 9495–9509. doi: 10.1021/acs.est.0c01655
Luong, R., and Flake, J. K. (2023). Measurement invariance testing using confirmatory factor analysis and alignment optimization: a tutorial for transparent analysis planning and reporting. Psychol. Methods 28, 905–924. doi: 10.1037/met0000441
Marcos, C. M. (2022). ‘We have not recovered’: Puerto Rico’s water supply remains vulnerable to hurricane fury. The Guardian. Available at: https://www.theguardian.com/world/2022/sep/21/puerto-rico-hurricane-fiona-drinking-water.
Marsh, H. W., Guo, J., Dicke, T., Parker, P. D., and Craven, R. G. (2020). Confirmatory factor analysis (CFA), exploratory structural equation modeling (ESEM), and set-ESEM: optimal balance between goodness of fit and parsimony. Multivar. Behav. Res. 55, 102–119. doi: 10.1080/00273171.2019.1602503
Marsh, H. W., Hau, K.-T., Balla, J. R., and Grayson, D. (1998). Is more ever too much? The number of indicators per factor in confirmatory factor analysis. Multivar. Behav. Res. 33, 181–220. doi: 10.1207/s15327906mbr3302_1
Mejia Manrique, S. A., Harmsen, E. W., Khanbilvardi, R. M., and González, J. E. (2021). Flood impacts on critical infrastructure in a coastal floodplain in Western Puerto Rico during hurricane María. Hydrology 8:104. doi: 10.3390/hydrology8030104
Nelson, T. N. T., Poleacovschi, C., Ikuma, K., García, I., Weems, C. F., Rehmann, C. R., et al. (2023). Knowledge–behavior gap in tap water consumption in Puerto Rico: implications for water utilities. Multidiscip. J. Civ. Eng. 1:04023001. doi: 10.1061/AOMJAH.AOENG-0005
O’Connor, S., Hanlon, P., O’Donnell, C. A., Garcia, S., Glanville, J., and Mair, F. S. (2016). Understanding factors affecting patient and public engagement and recruitment to digital health interventions: a systematic review of qualitative studies. BMC Med. Inform. Decis. Mak. 16:120. doi: 10.1186/s12911-016-0359-3
Ohan, J. L., Leung, D. W., and Johnston, C. (2000). The parenting sense of competence scale: evidence of a stable factor structure and validity. Can. J. Behav. Sci. 32, 251–261. doi: 10.1037/h0087122
Osborne, J. W. (2015). What is rotating in exploratory factor analysis? Prac. Assess. Res. Eval. 20:2. doi: 10.7275/hb2g-m060
Pacione, M. (2003). Urban environmental quality and human wellbeing—a social geographical perspective. Landsc. Urban Plan. 65, 19–30. doi: 10.1016/S0169-2046(02)00234-7
Pierce, G., and Gonzalez, S. (2016). Mistrust at the tap? Factors contributing to public drinking water (mis)perception across US households. Water Policy 19, 1–12. doi: 10.2166/wp.2016.143
Puputti, S., Aisala, H., Hoppu, U., and Sandell, M. (2018). Multidimensional measurement of individual differences in taste perception. Food Qual. Prefer. 65, 10–17. doi: 10.1016/j.foodqual.2017.12.006
Randall, D. M., and Fernandes, M. F. (1991). The social desirability response bias in ethics research. J. Bus. Ethics 10, 805–817. doi: 10.1007/BF00383696
Rosinger, A. Y. (2018). Household water insecurity after a historic flood: diarrhea and dehydration in the Bolivian Amazon. Soc. Sci. Med. 197, 192–202. doi: 10.1016/j.socscimed.2017.12.016
Rupert, D. J., Poehlman, J. A., Hayes, J. J., Ray, S. E., and Moultrie, R. R. (2017). Virtual versus in-person focus groups: comparison of costs, recruitment, and participant logistics. J. Med. Internet Res. 19:e6980. doi: 10.2196/jmir.6980
Sarkar, M. (2022). Perceptions of drinking water quality—A review of the literature and surveys covering the topic. U.S. Department of Housing and Urban Development Office of Policy Development and Research. Available at: https://www.huduser.gov/portal/portal/sites/default/files/pdf/Perceptions-of-Drinking-Water-Quality.pdf.
Stoler, J., Jepson, W. E., Brewis, A., and Wutich, A. (2023). Frontiers of household water insecurity metrics: severity, adaptation and resilience. BMJ Glob. Health 8:e011756. doi: 10.1136/bmjgh-2023-011756
Taber, K. S. (2018). The use of Cronbach’s alpha when developing and reporting research instruments in science education. Res. Sci. Educ. 48, 1273–1296. doi: 10.1007/s11165-016-9602-2
Tuan, Y. (1990). Topophilia: a study of environmental perception, attitudes, and values. New York: Columbia University Press.
Weems, C. F., Poleacovschi, C., and Ikuma, K. (2023). A perspective for identifying intersections among the social, engineering, and geosciences to address water crises. Front. Water 5:1280528. doi: 10.3389/frwa.2023.1280528
Yang, E., and Faust, K. M. (2019). Dynamic public perceptions of water infrastructure in US shrinking cities: end-user Trust in Providers and Views toward participatory processes. J. Water Resour. Plan. Manag. 145:04019040. doi: 10.1061/(ASCE)WR.1943-5452.0001093
Young, S. L., Boateng, G. O., Jamaluddine, Z., Miller, J. D., Frongillo, E. A., Neilands, T. B., et al. (2019). The household water in security experiences (HWISE) scale: development and validation of a household water insecurity measure for low-income and middle-income countries. BMJ Glob. Health 4:e001750. doi: 10.1136/bmjgh-2019-001750
Keywords: water quality perceptions, scale development, water insecurity, end-user perception, factor analysis
Citation: Nelson TNT, Poleacovschi C, Weems CF, Ikuma K, García I and Rehmann CR (2024) Navigating end-user perceptions: development and initial psychometric properties of a water quality perception scale. Front. Water. 6:1357921. doi: 10.3389/frwa.2024.1357921
Edited by:
Enoch Akwasi Kosoe, SD Dombo University of Business and Integrated Development Studies, GhanaReviewed by:
Ojong Baa Enokenwa, Rhodes University, South AfricaEsther Oreofeoluwa Esho, Fernando Pessoa University, Portugal
Copyright © 2024 Nelson, Poleacovschi, Weems, Ikuma, García and Rehmann. This is an open-access article distributed under the terms of the Creative Commons Attribution License (CC BY). The use, distribution or reproduction in other forums is permitted, provided the original author(s) and the copyright owner(s) are credited and that the original publication in this journal is cited, in accordance with accepted academic practice. No use, distribution or reproduction is permitted which does not comply with these terms.
*Correspondence: Toby N. T. Nelson, dG50ZWxzb25AaWFzdGF0ZS5lZHU=
 Toby N. T. Nelson
 Cristina Poleacovschi
 Carl F. Weems
 Kaoru Ikuma
 Ivis García3
 Chris R. Rehmann