
94% of researchers rate our articles as excellent or good
Learn more about the work of our research integrity team to safeguard the quality of each article we publish.
Find out more
ORIGINAL RESEARCH article
Front. Water, 02 November 2023
Sec. Water and Climate
Volume 5 - 2023 | https://doi.org/10.3389/frwa.2023.1250068
This article is part of the Research TopicGreenhouse Gas Emissions from Terrestrial Freshwater Ecosystems: Spatial and Temporal Hot SpotsView all 6 articles
 Alberto Zannella1*
 Karin Eklöf1Emma Lannergård1
 Hjalmar Laudon2Eliza Maher Hasselquist2
 Marcus B. Wallin1
Boreal watercourses are large emitters of carbon dioxide (CO2) to the atmosphere. For forestry intensive areas of the Nordic and Baltic countries, a high share of these watercourses are man-made ditches, created to improve drainage and increase forest productivity. Previous studies have suggested that terrestrial sources sustain the CO2 in these ditches and variability in hydrology is the main temporal control. However, few studies have explored ditch CO2 dynamics and its associated controls in catchments being exposed to forest harvest. An altered hydrology, increased nutrient export and light availability following forest harvest are all factors that potentially can change both levels, dynamics, and source controls of ditch CO2. Here, high-frequency (30 min) CO2 concentration dynamics together with other hydrochemical variables were studied in a forest ditch draining a fully harvested catchment in the Trollberget Experimental Area, northern Sweden. We collected data during the snow-free season from May to October. Ditch CO2 concentrations displayed a clear seasonal pattern with higher CO2 concentrations during summer than in spring and autumn. Concentrations ranged from 1.8 to 3.5 mg C L−1 (median: 2.4 mg C L−1, IQR = 0.5 mg C L−1). Strong diel cycles in CO2 developed during early summer, with daily amplitudes in CO2 reaching up to 1.1 mg C L−1. These pronounced daily cycles in CO2 were closely related to the daily sum of shortwave radiation and water temperature. Variations in hydrology had generally a low impact on the CO2 dynamics but did vary among seasons and between individual hydrological events. It was evident from our study that growing season CO2 concentrations in a forest ditch affected by clear-cut harvest were highly variable and mainly controlled by light and temperature induced metabolism. These high dynamics and the associated controls need to be considered when scaling up ditch CO2 emissions across boreal landscapes affected by intensive forestry.
Headwater streams and ditches are important sources of atmospheric CO2 emissions, estimated to contribute more than 70% of the total global fluvial CO2 emissions (Raymond et al., 2013). The importance of headwaters for emitting CO2 holds particularly true for boreal ecosystems, as they are rich in soil carbon and often closely connected with dense aquatic networks (Wallin et al., 2018). For forestry intensive areas of the Nordic and Baltic countries, a high share of these watercourses are man-made ditches, created to improve drainage and increase forest productivity during the 20th century (Päivaänen and Hånell, 2012; Norstedt et al., 2021). Given the widespread occurrence of ditch networks combined with high concentrations and emission rates of CO2, boreal ditches are important sources of atmospheric CO2 (Peacock et al., 2021). As an intrinsic characteristic, boreal headwaters show close hydrochemical connectivity with adjacent soils and receive continuously high inputs of terrestrial derived carbon from which inflows are largely controlled by variations in hydrological inputs (Billett et al., 2006; Öquist et al., 2009; Crawford et al., 2013; Leith et al., 2015; Wallin et al., 2015). This carbon can enter the aquatic network directly as CO2 that is produced in the soil via the mineralization of organic matter or from root-associated respiration (Campeau et al., 2019). In addition to terrestrial CO2 inputs, CO2 could also be produced in-situ in the watercourse from microbial decomposition or photochemical oxidation of organic matter transported from catchment soils (Köhler et al., 2002; Schelker et al., 2016a; Crawford et al., 2017). Aquatic CO2 can also serve as the carbon source in primary production (photosynthesis), hence being consumed during daytime. For boreal headwaters, in-situ decomposition of organic matter is often found to be of minor importance for the observed CO2 (Winterdahl et al., 2016) due to low residence time of the water (Catalán et al., 2016), limited light availability caused by dense tree canopies (Burrows et al., 2021), and low water temperatures (Tank et al., 2010). In addition, due to often unproductive conditions with low nutrient levels as well as restricted light availability, primary production typically also has low influence on CO2 in boreal watercourses (Lamberti and Steinman, 1997; Roberts et al., 2007).
A critical aspect to consider when unraveling the different controls and their relative importance on CO2 in watercourses is the time scale of interest. Different processes that control aquatic CO2 are operating from hourly to seasonal scales (Riml et al., 2019). Thus, interpreting the primary controls on CO2 concentration dynamics in watercourses requires continuous data collected at sufficient frequency (e.g., hourly) covering complete seasons (Wallin et al., 2020; Gómez-Gener et al., 2021). The development of sensors that monitor high-frequent CO2 data has enabled studies that explored controls on dissolved CO2 in watercourses draining various ecosystems (e.g., forest, agriculture, and wetlands) and across different climatic zones (e.g., boreal, alpine, subtropical, etc.) (e.g., Johnson et al., 2010; Dinsmore et al., 2013; Peter et al., 2014; Crawford et al., 2017; Rocher-Ros et al., 2020; Wallin et al., 2020). Studies performed in streams draining nutrient-poor forest ecosystems have shown that CO2 dynamics are generally driven by variability in stream discharge (Johnson et al., 2007; Dinsmore et al., 2013; Crawford et al., 2017; Riml et al., 2019). The hydrological response in stream CO2 is dependent on catchment-specific characteristics and variations in groundwater flow paths controlling connectivity to terrestrial CO2 sources (Leith et al., 2015; Campeau et al., 2018). In contrast, for ditch or stream systems draining landscapes with open canopies that are fully exposed to light, in-situ metabolic processes have been found to have stronger control on aquatic CO2. In such systems diel cycles in CO2 can be particularly pronounced, with large concentration differences between day and night (Nimick et al., 2011; Crawford et al., 2017; Attermeyer et al., 2021; Gómez-Gener et al., 2021). These diel cycles reflect the interplay of in-situ primary production (photosynthesis) and respiration within the watercourse (or in the adjacent soils).
Previous findings of low in-situ contribution to CO2 dynamics in boreal watercourses stem mainly from studies in low-intensively or unmanaged forest systems (Marx et al., 2017; Campeau et al., 2019). In contrast, few studies (e.g., Klaus et al., 2018) have explored CO2 dynamics in headwaters draining areas affected by clear-cut forestry, which is a common management operation for many production forests in the boreal countries. In Sweden, about 1% (or ca 230,000 ha, based on a 5-year mean 2016-2020) of the productive forest land is harvested every year (Swedish Forest Agency, 2020), and as a consequence, many forest drainage networks are affected by this practice. Following harvest, the catchment hydrology is altered due to reduced evapotranspiration leading typically to higher groundwater levels and increased runoff (Andréassian, 2004; Sørensen et al., 2009; Schelker et al., 2013). Also, dissolved organic carbon (DOC) concentrations are often increased following harvest due to higher rates of decomposition of organic matter in soils and due to greater lateral mobilization from terrestrial sources (Nieminen, 2004; Laudon et al., 2009; Schelker et al., 2012). Similarly, forest harvest often results in enhanced export of nutrients, especially nitrogen, caused by reduced uptake in vegetation and increased mineralization of organic matter (Nieminen, 2004; Schelker et al., 2016b). There is limited literature concerning the influence of forest harvesting on dissolved CO2 concentrations and emissions in connecting aquatic systems. However, Klaus et al. (2018) found that harvest increased dissolved CO2 concentrations in groundwater of the surrounding catchment soils but did not affect CO2 emissions from recipient streams. To what extent this discrepancy in observed patterns between groundwater and watercourses stems from changes in the in-situ stream CO2 controls following harvest is currently unknown.
This study aims to investigate the impact of clear-cut forestry on the dynamics of dissolved CO2 concentrations in draining watercourses. We hypothesize that dissolved CO2 dynamics following forest harvest are altered and become more variable on short time scales (daily) due to changes in light and nutrient regimes which in turn increase the potential for in-situ metabolism. To test this hypothesis we (1) quantified ditch CO2 concentration levels and dynamics for a full growing season in a forest ditch within a catchment recently being clear-cut harvested, (2) identified and explored the main temporal controls and how they vary with season, and (3) compared observed CO2 concentration patterns from the clear-cut ditch with patterns observed in a stream draining an unmanaged forest catchment in close proximity.
The study was conducted in the Trollberget Experimental Area (TEA) (64°10'N, 19°46'E), located 50 km northwest of the city of Umeå, Sweden (Figure 1A)1. The experimental area was set up in 2018 to study the environmental impacts of different types of forest management practices on aquatic ecosystems and has been embedded within the framework of the Krycklan Catchment Study (KCS) (Laudon et al., 2021). The mean annual air temperature for the area is 2.4°C and with a mean annual precipitation of 623 mm (about 30% as snow, based on data from 1980–2020 collected at the nearby Svartberget Climate station) (Laudon et al., 2021). Across the period of the growing season, the number of sunlight hours changes drastically at these northern latitudes (from about 20 h in early June to about 8 h in October).
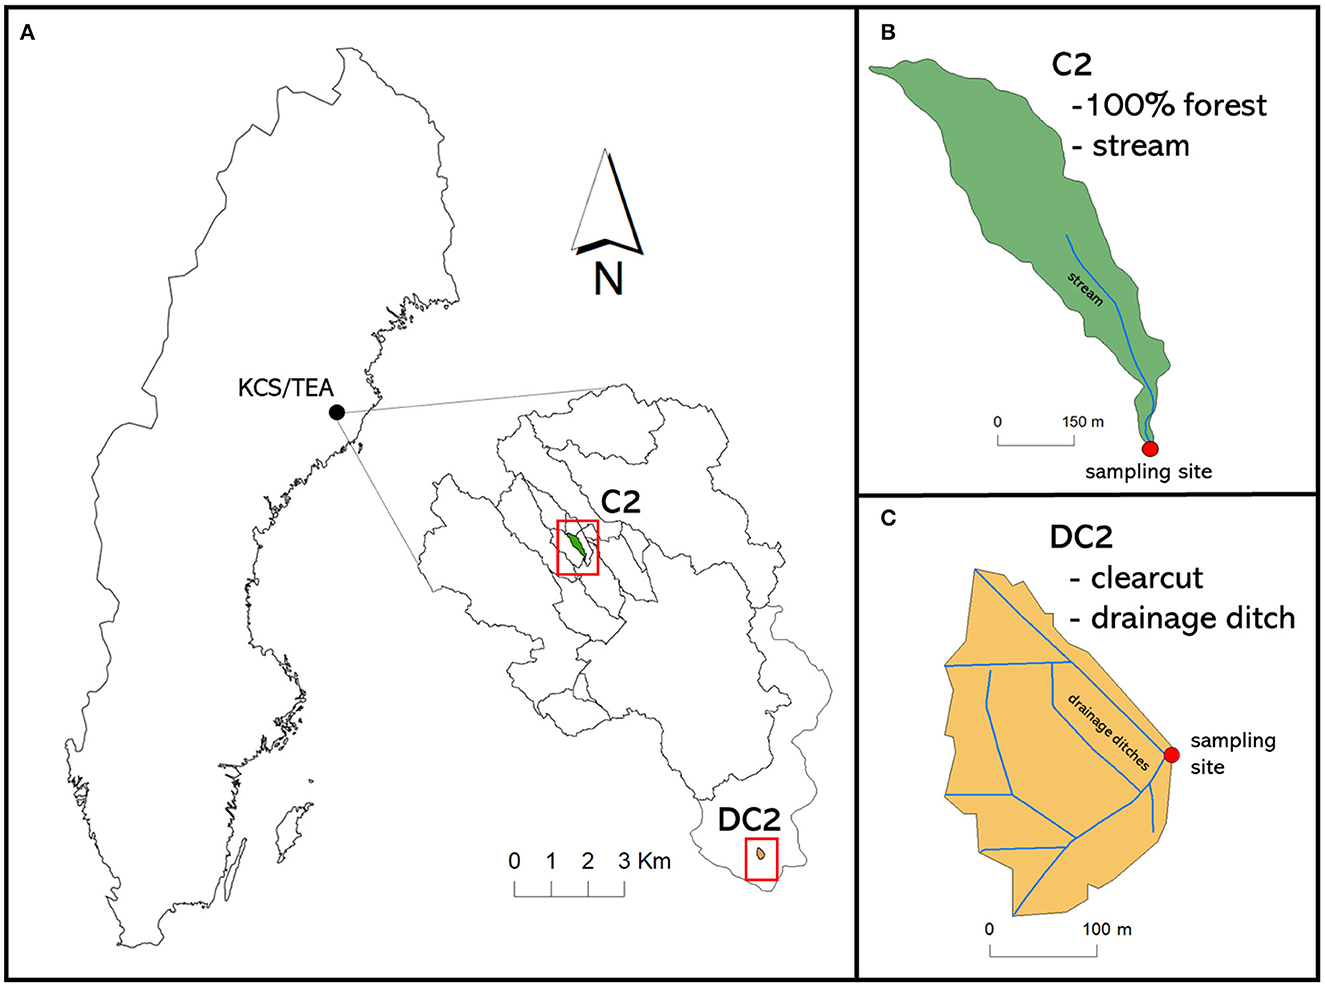
Figure 1. The (A) Krycklan catchment study including the TEA, with the (C) DC2 and (B) C2 sub-catchments highlighted.
Within TEA, we studied a 4.4 ha large catchment (DC2) characterized by a dense ditch network (total length, 1.1 km, density, 0.025 m m−2) (Laudon et al., 2021, Figure 1C). The DC2 catchment is dominated by till soils (almost 100%) with well-developed podzols including a 10–20 cm humic/partly humic layer on top. Until July 2020, DC2 was completely forest covered, mainly by Norway spruce (Picea abies) and Scots pine (Pinus sylvestris). In July 2020, the catchment was completely harvested.
A second unmanaged sub-catchment (C2, located about 10 km from DC2) of the Krycklan catchment study was used in the study for comparative analysis with the clear-cut catchment of DC2 (Laudon et al., 2013; Leith et al., 2015; Figure 1B). C2 is 100% forested and slightly larger (12 ha) than DC2 but is otherwise similar in terms of soil types and forest composition. Both DC2 and C2 have been affected by historical ditching activity that occurred in the early 20th century to improve drainage. Catchment characteristics of DC2 and C2 are shown in Supplementary Table 1.
Measurements in DC2 were conducted during the snow-free period from 8 May to 28 October 2021 (in total 174 days), encompassing a full growing season. CO2 concentration was continuously measured together with water temperature, and electrical conductivity (EC) just upstream of a V-notch weir installed at the outlet of DC2. The sensors were deployed underwater attached to a wooden structure of the weir. CO2 concentration was monitored using an eosGP sensor (range 0–2%, Eosense, Dartmouth, Canada) wrapped with copper tape to prevent biofouling. Inspection and cleaning of the sensors were performed monthly. Sensor accuracy is, according to the manufacturer, <1% of the calibrated range (0–2% CO2) + 1% of the reading corresponding to a maximum error of ca 0.1 mg C L−1 based on the maximum CO2 measured in the current study. Water temperature and EC were monitored using a thermocouple (Type T) and a CS547A-L conductivity sensor (Campbell, UK), respectively. All sensors were connected to a CR1000X data logger (Campbell, UK) measuring at a 1 min interval and storing mean values at a temporal resolution of 30 min.
Volume fraction outputs (ppmv of CO2) from the sensor were corrected for variations in water temperature, water level and atmospheric pressure (Johnson et al., 2010; Wallin et al., 2020) and expressed in milligrams of carbon per liter (mg C L−1). Finally, sensor derived CO2-C concentration data were calibrated against manually taken CO2 measurements (n = 35, see water sampling section) that were carried out in the ditch during the entire study period. Calibration was conducted through the application of a regression equation, encompassing nearly the entire range of measurements (Supplementary Figure 1). Water discharge was measured at the outlet V-notch weir using an established stage height-discharge relationship. Stream discharge gauging for rating curve definition was done using time-volume (bucket) measurements covering a wide discharge range (n = 10). Stage height was continuously recorded (60 min) using a capacitance sensor (TruTrack Logger Type WT-HR 64K). Discharge per unit of catchment area (Q) was calculated and reported in mm h−1 or mm d−1. Precipitation and air temperature were measured nearby (300 m) the DC2 catchment using an ARG100 tipping bucket rain gauge (Campbell, UK) and a shaded thermocouple Type T. Short-wave radiation (SR) was measured at 30 min intervals within DC2 about 150 m from the catchment outlet using a Huskeflux NR01 net radiometer. Atmospheric pressure was monitored at the meteorological station of Svartberget (located ca. 8.5 km from DC2) and data were downloaded from the ICOS carbon portal (https://www.icos-sweden.se/Svartberget). Stream CO2 concentrations at C2 were measured (at 5 min resolution) using a Vaisala CARBOCAP GMP221 non-dispersive infra-red (NDIR) sensor (range 0–5 %), that was hermetically sealed and covered with a gas-penetrable membrane (Johnson et al., 2010; Leith et al., 2015; Campeau et al., 2018). The outlet of C2 is equipped with a V-notch weir in a heated dam house and with stage height recorded at 5 min resolution. As in DC2, discharge in C2 was determined according to a known stage height-discharge relationship based on volume-time measurements.
Manual sampling for water chemistry at the outlets of DC2 and C2 was conducted at biweekly intervals, as part of a regular monitoring program of KCS/TEA, for a total of 15 occasions. In addition, during the 3 weeks between September 20 and October 10, DC2 was manually sampled daily as part of an intensive sampling campaign in all the ditches within the TEA. For DC2, a total of 35 grab samples were taken during the study period with a mean sampling time at ca 10:45. At C2, the mean sampling time for the grab samples was ca 13:30. For analysis of dissolved CO2, a headspace method was used where a 5 mL sample of bubble-free water was injected in a 22.5 ml glass vial sealed with a bromobutyl rubber septa (Wallin et al., 2010; Åberg and Wallin, 2014). The injection was made by using a sterile syringe which was flushed with stream water before sampling. The vial was pre-filled with 0.1 ml 85 % H3PO4 and N2 at atmospheric pressure. The samples were stored dark and cold (4°C) for a maximum of 1 week prior to analysis. Samples were analyzed on a gas chromatograph equipped with a methanizer and flame ionization detector (GC-FID). Water samples for pH and EC analysis were collected in 50 mL polyethylene bottles tightened avoiding the formation of air bubbles. In the lab, pH and EC were measured with pH and conductivity electrodes (MP220, Mettler Toledo). Grab samples for DOC analysis were collected in 250 mL polyethylene bottles, filtered [0.45 μm mixed cellulose ester (MCE) syringe filters, Millipore®] within 24 h and then acidified to remove inorganic carbon prior to analysis. Analysis was performed with a Shimadzu Total Organic Carbon Analyzer TOC-VCPH, following storage at 4°C for 2–3 days' periods (Leach et al., 2016; Campeau et al., 2018). Finally, filtered subsamples were stored at a temperature of −20°C for later analysis of nitrogen and phosphorus and their respective fractions (for more analytical details see Blackburn et al., 2017 and Mosquera et al., 2022).
All sensor data were visually inspected to examine their patterns and a 15 day moving average of CO2 concentrations was calculated to better visualize the seasonal dynamics. Linear regression analysis was used to investigate the relationships between ditch CO2 concentration or amplitude in diel CO2 concentration and discharge, water temperature and daily accumulated SR. Linear regressions were considered significant if p < 0.05. Dynamics in ditch CO2 concentration were explored and visualized on a diel (24 h) basis for the full study period, as well as for individual months, using box plots with a 30 min resolution. The response in CO2 concentration to variable discharge was analyzed by constructing C-Q relationships [log daily median C (mg L−1) vs. log specific discharge (mm d−1)]. Such C-Q plots were created on a monthly basis in order to assess whether the hydrological control was changing throughout seasons. The values of the slopes obtained from C-Q regressions were interpreted as done in Rehn et al. (2023) and following Meybeck and Moatar (2012).
To distinguish the different controls on CO2 dynamics, significant hydrological events were identified according to the method described in Lannergård et al. (2021). The method adopted for the event definition was based on the change in daily discharge (mm d−1). The events started on (1) the rising limb of the hydrograph (the previous observation should be on the falling limb), (2) with an increase <3% from one observation to the next (x1 = 0.03), (3) no threshold was set for excluding events during low flow conditions, meaning an event could start during the full study period (x2 = 0). However, events with a magnitude lower than 0.4 mm h−1 were omitted. To mark the end of an event, the decrease in discharge from one observation to the next was set to 20% (x3 = −0.2) and the observed discharge was less than the baseflow decay function. The baseflow decay function is a baseline, starting at the 1st day of the event, with a starting value of the discharge during that day. It is then decreasing with 0.1% per day (further explained in Lannergård et al., 2021). The identification of the events was done in Python 3.9.
The hydrological control on ditch CO2 concentrations was further explored using CO2-Q hysteresis analysis and where the shape and direction of the hysteresis loops of each hydrological event were identified (Evans and Davies, 1998; Wallin et al., 2020). The shape of the hysteresis loops has been related to the timing of CO2 and discharge responses depending on catchment characteristics and hydrological pathways (Evans and Davies, 1998). A clockwise shape indicates a system where CO2 peaks before discharge, and could indicate a transport limited source of CO2 but that eventually reaches a source limitation in the available catchment soil or stream bed CO2 pool. An anti-clockwise pattern typically indicates a diluting effect on CO2 suggesting a source limitation occurring already at low discharge increases (Wallin et al., 2020). A complex CO2-Q loop, instead, indicates that the CO2 pattern is not related to the changes in hydrology or that any relationship is interfered by additional controlling processes. Hysteresis indexes were calculated according to Lloyd et al. (2016) using a 20% increment of the discharge range for each event. For further analysis, the hysteresis indexes were combined with event characteristics (duration of event, season, Qmax, mean, range, peakhour, CO2mean, range, peakhour, shape) and environmental conditions (water temperature, precipitation, ECmean, range, SRtot) (Supplementary Table 2). A principal component analysis (PCA) was used to explore the entire event data set (Supplementary Table 2) and to evaluate the different temporal controls on ditch CO2 concentration dynamics.
Finally, statistical differences in chemical variables between the DC2 and C2 catchments were assessed using the non-parametric Wilcoxon test and were considered significant if p < 0.05. The software JMP Pro 15 (SAS Institute Inc., Cary, NC, USA) was used for all statistical calculations.
Mean air temperature and total precipitation registered at TEA for the full study period (8 May−28 October 2021) were 11.7°C and 571 mm, respectively (Figure 2A). Precipitation was distributed relatively evenly throughout the months of the study period (June–October, ~20%/month), with July and October being the months with the highest precipitation (118 mm each) and July 30 the day with the highest daily precipitation (57 mm). Mean ditch water temperature over the study period was 10°C and ranged from −0.4 to 19.7°C (Figure 2B). High diel variability in water temperature was evident, with daily temperature amplitudes being closely related to the daily mean SR (R2 = 0.88, p < 0.0001). Mean and median daily discharge (Q) for the study period were 1.86 and 0.98 mm d−1, ranging from 0 to 17 mm d−1 (Figure 2C). The total number of dry days (i.e., days without any registered water flow over the V-notch weir) was 19 out of 174, or 11% of the study period. According to frequency analysis, 73% of the days had a daily mean discharge below the overall mean for the study period (1.86 mm d−1), but the accumulated discharge during days with a discharge higher than the overall mean accounted for 71% of the total discharge (324 mm). Daily precipitation and discharge were positively related (R2 = 0.53, p < 0.0001, Supplementary Figure 2) with an average response time between precipitation event and discharge peak of 2 h. The mean pH was 4.6 (n = 15) and the electrical conductivity was on average 35.5 μS cm−1 (range: 22.9–66.0 μS cm−1) and was positively related to variations in discharge (R2 = 0.38, p < 0.0001).
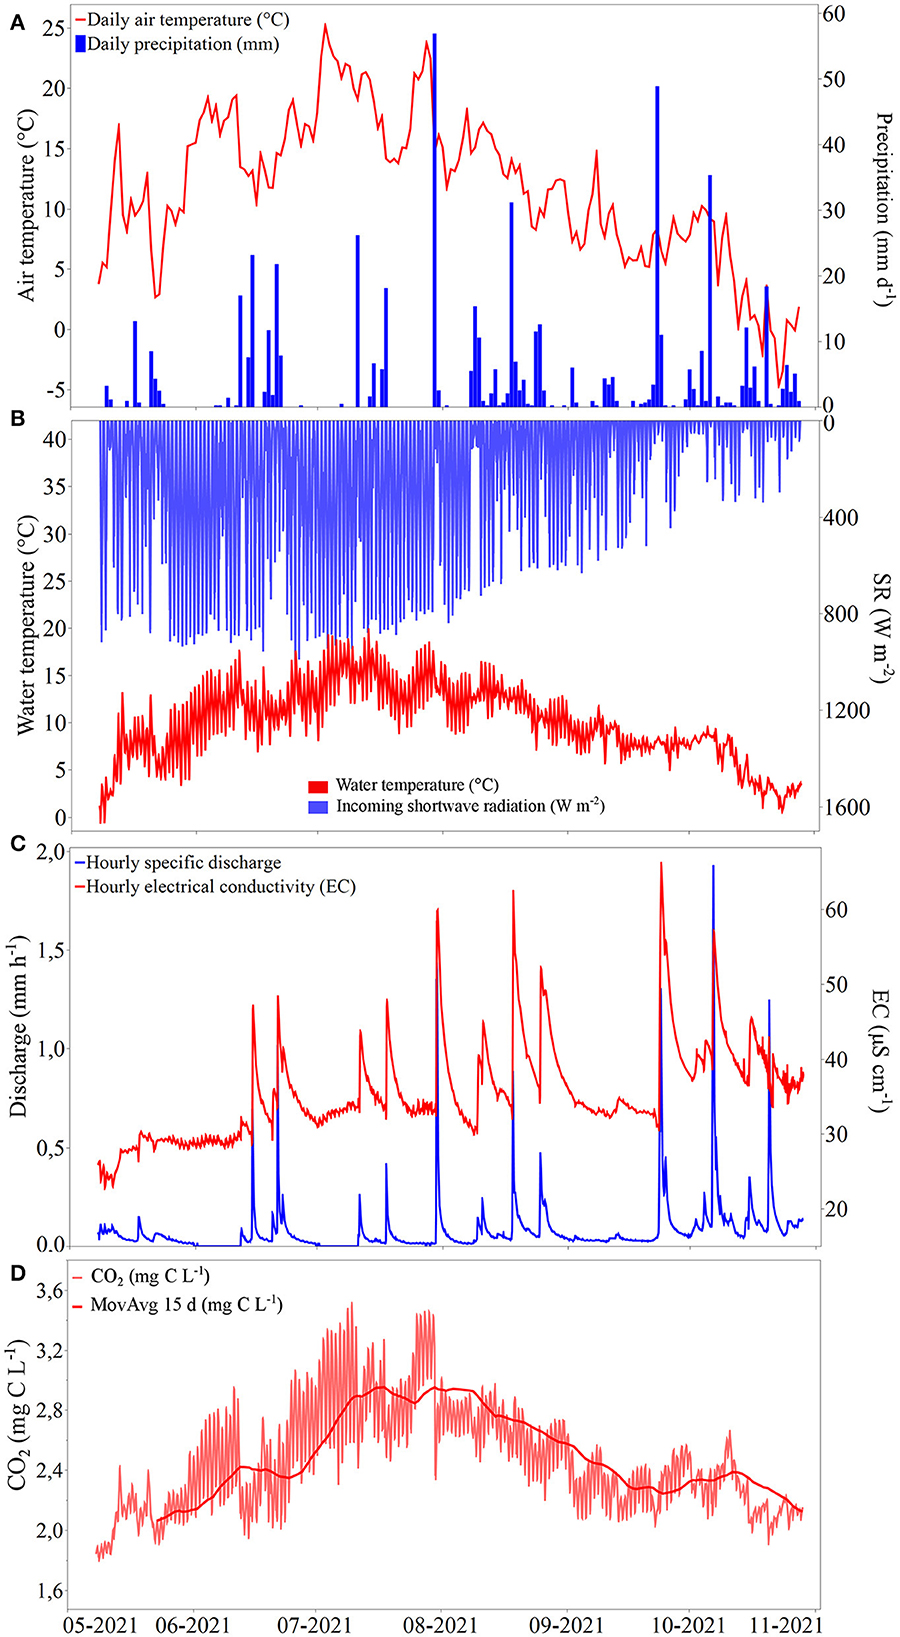
Figure 2. Time series of (A) daily mean air temperature (line) and daily precipitation (bars) registered at TEA; (B) water temperature (blue) and shortwave incoming radiation, SR (red); (C) hourly discharge and electrical conductivity (EC); (D) dissolved CO2 for the study period 8 May−28 October 2021 in DC2. Note the reverse axis for SR.
The mean CO2 concentration at DC2 for the whole study period was 2.47 mg C L−1 (IQR = 0.51 mg C L−1) [corresponding to a partial pressure (pCO2) of 2,848 μatm] and were ranging from 1.81 to 3.50 mg C L−1 (pCO2 range: 461–7,183 μatm) (Figure 2D). This should be compared with an estimated atmospheric equilibrium concentration of dissolved CO2 of 0.23 mg C L−1 (assuming an atmospheric CO2 concentration of 417 ppm and an average water temperature of 10°C representing the entire study period). Ditch CO2 concentrations displayed a clear seasonal pattern with higher CO2 during summer than in spring and autumn. CO2 increased from May until approximately the beginning of August and then started to decrease. The highest measured CO2 concentrations occurred at midnight on 9 July. The CO2 concentration displayed a bimodal distribution with frequency peaks at ~2.1 and ~2.7 mg C L−1 (Supplementary Figure 3). The higher peak (n = 1,194) represents data collected during spring and late summer as well as on many days during the autumn period, whereas the lower peak (n = 797) was attributed to some days in early June and the summer period (July–August).
Mean daily CO2 concentration was positively related to daily mean water temperature for the full study period (R2 = 0.75, p < 0.0001, Figure 3A). On a diel scale, CO2 concentrations commonly displayed a cyclic pattern that were developed during early summer, with daily CO2 amplitudes reaching maximum 1.07 mg C L−1 in July, and then progressively decreasing to reach its minimum of 0.04 mg C L−1 in October (Supplementary Figure 4). The amplitude of the diel CO2 concentration was related to the daily accumulated shortwave radiation (R2 = 0.24, p < 0.0001, Figure 3B) as well as to daily mean water temperature (R2 = 0.59, p < 0.0001, Figure 3C). During the full period of study, daily CO2 concentrations were higher during night- (22:00–7:00) than day hours (Supplementary Figure 5), with the highest and lowest concentrations within a diel cycle at around 1:00 and 14:00, respectively (mean values: 2.59 and 2.32 mg C L−1). By separating the diel analysis by month (Figure 4), the highest monthly mean CO2 concentration (3.18 mg C L−1) was measured at 00:30 in July. July also showed the largest mean daily amplitude in CO2 concentration (ΔCO2 = 0.52 mg C L−1), with the minimum values recorded at 13:30. Among the studied months (May–October), a shift in the hour of the day when CO2 peaked was noticed. Daily maximum peak, [CO2]max, was recorded at around 23:30 during May and June, at 00:30 in July, 2:30 in August, 6:00 in September and finally occurred at 7:30 in October. Daily minimum peak, [CO2]min, was recorded at 12:00 in May but gradually shifted in time, from 13:00 in June, to 13:30 in July, 14:30 in August and, finally, 16:00 in September and October.
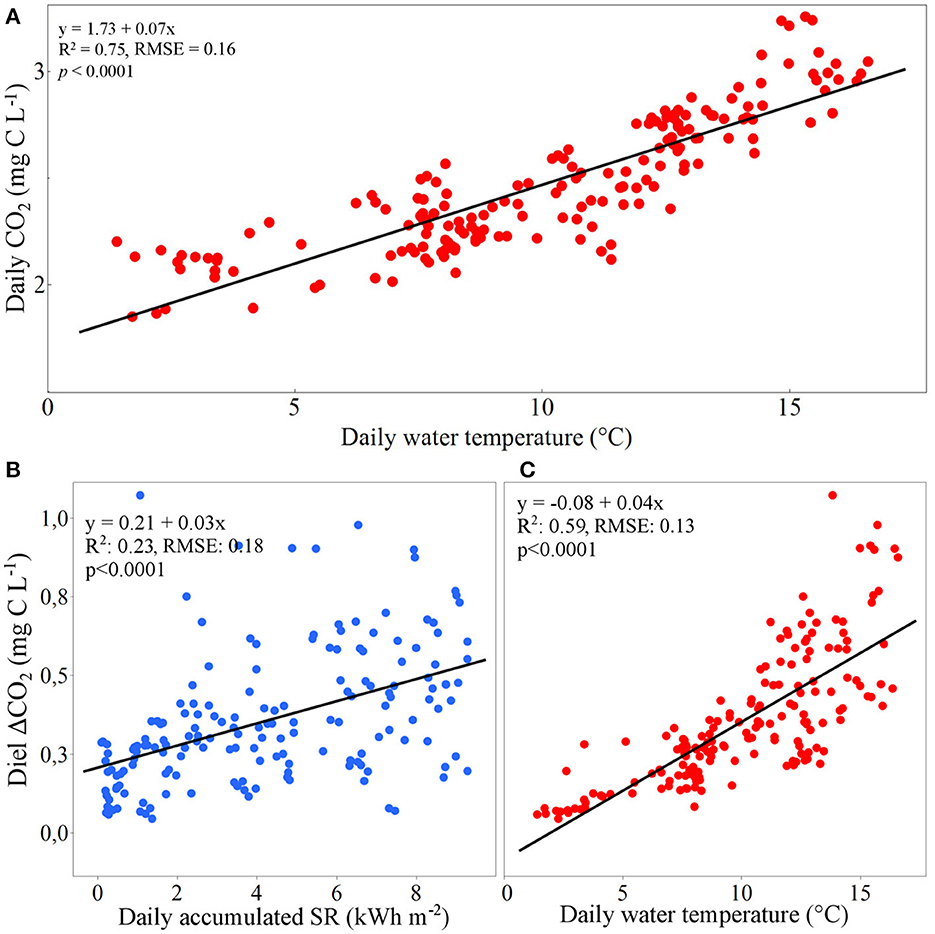
Figure 3. (A) Daily mean ditch concentration of CO2 at DC2 as a function of daily mean water temperature; Diel amplitudes in CO2 concentrations at DC2 as functions of (B) daily accumulated incoming short-wave radiation, SR and (C) water temperature.
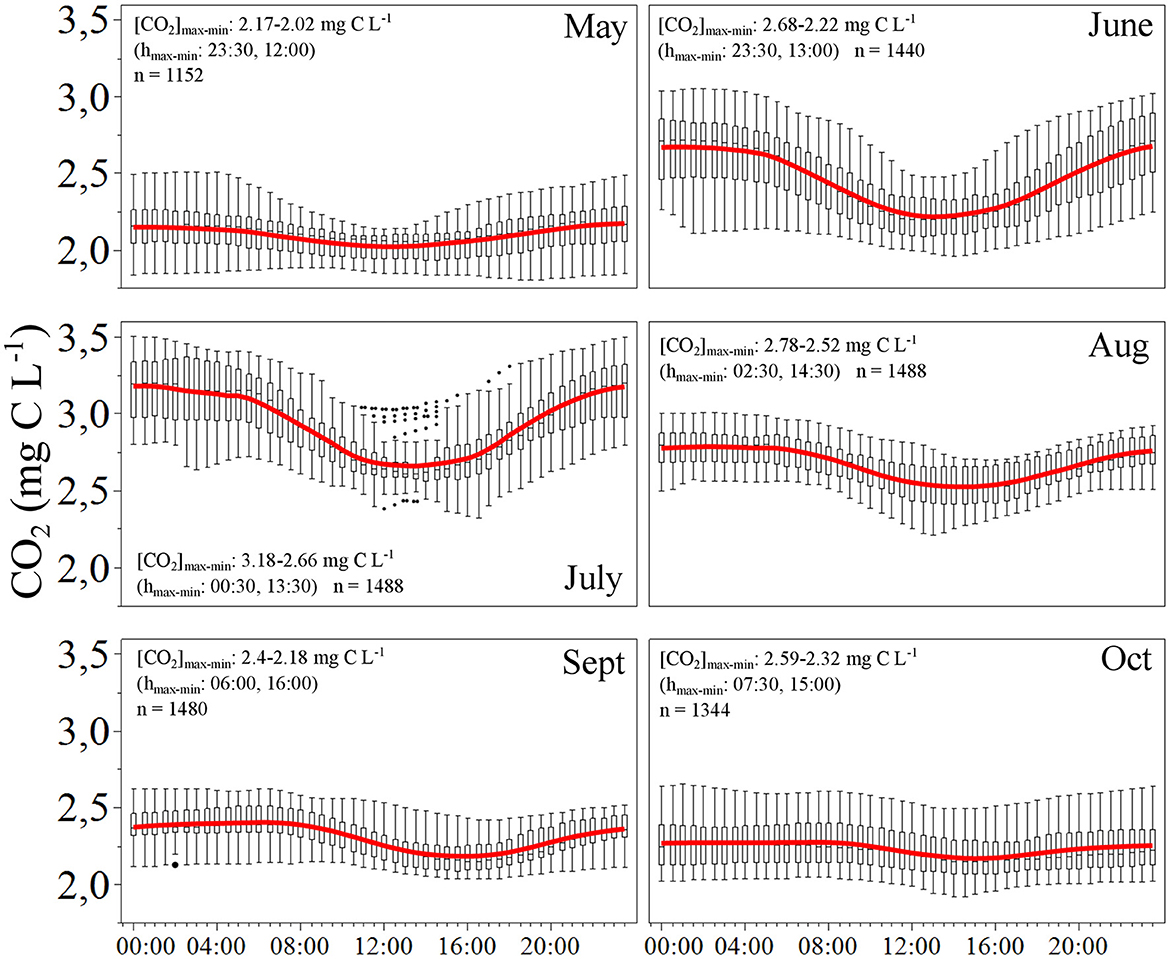
Figure 4. Monthly distribution in ditch CO2 concentrations at DC2 over the full study period presented on a diel (24 h) basis with each boxplot representing a 30 min period. The red line displays the mean diel CO2 concentration pattern.
Significant negative logCO2-logQ relationships were found on a monthly basis from May to August with variable explanatory power (R2 = 0.18–0.71) (Figure 5), with highest R2 in May and lowest in June. The slope of the logCO2-logQ relationships were classified as chemostatic for the entire study period, but progressively became less negative for every month from −0.09 in May to −0.02 in August. In contrast, during September and October no significant logCO2-logQ relationships were identified suggesting low influence of variations in runoff on CO2 at the monthly basis during autumn.
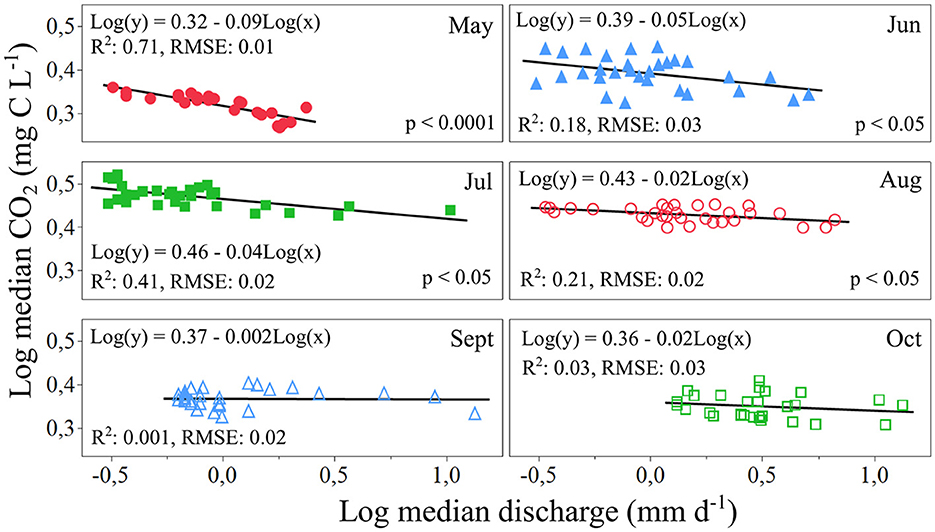
Figure 5. Log median CO2 concentrations at DC2 as a function of Log median discharge for the different months of the study period.
Based on the event identification (see method section above), 19 hydrological events were identified during the full study period (Supplementary Figure 6) with different characteristics (Supplementary Table 2). The duration of each event varied between 2 and 10 days, with an average of 5.6 days. The events further covered a wide discharge range (between 0.04 and 1.8 mm h−1, representing 92% of the monitored Q range). Three different shapes of CO2-Q loops were identified by the calculated hysteresis indexes, (1) clockwise (CW) loop with positive indexes during the full event, (2), anticlockwise (AW) loop with negative indexes during the full event, (3) complex (complex) loop that contained both positive and negative indexes during the event (Supplementary Figure 7). Out of all the CO2-Q loops, nine displayed CW shape, four displayed the AW shape and six displayed the complex “figure eight” shape (Figure 6). CW and complex hysteresis patterns occurred independent of season or size of the hydrological event. AW loops, on the other hand, were more common during the summer period and at medium discharge (0.07 < Q < 0.12 mm h−1, Supplementary Figure 7).
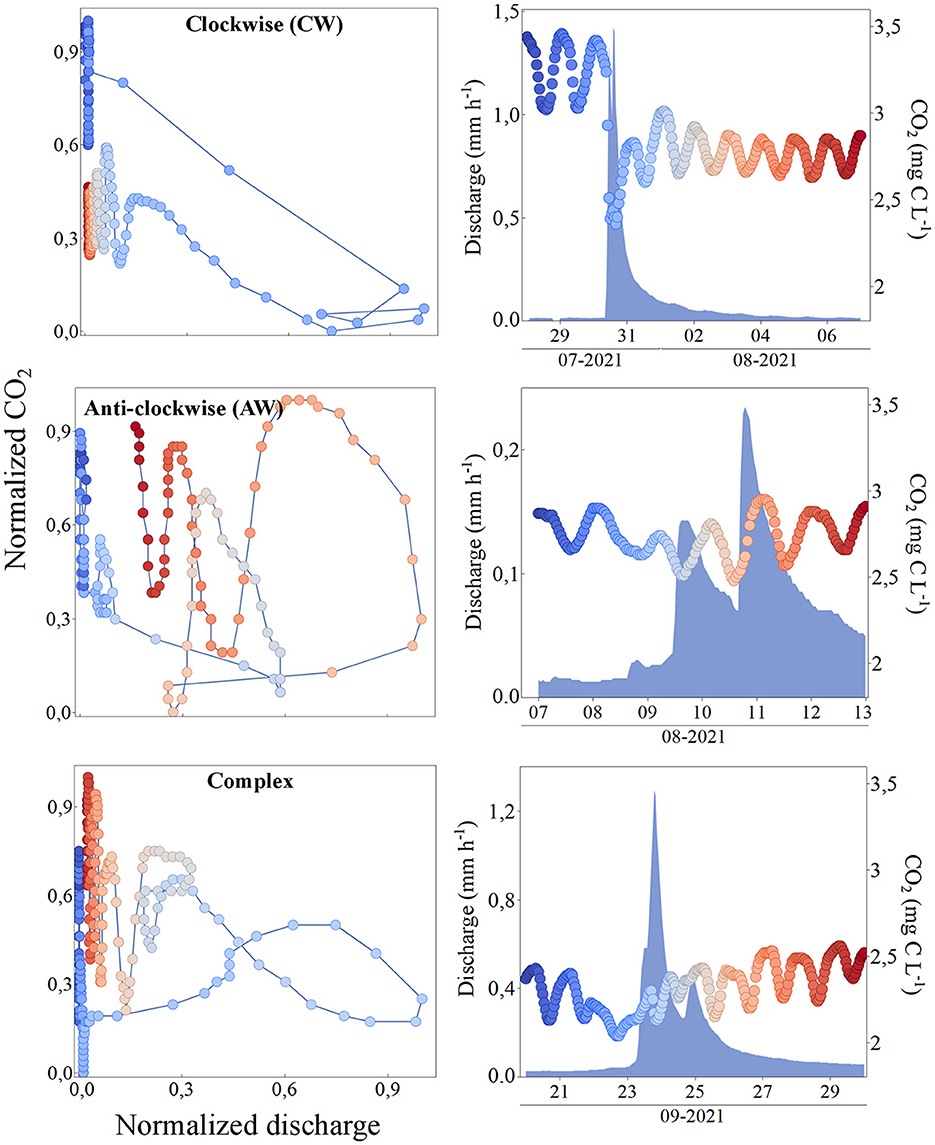
Figure 6. Examples of the three different identified event types (CW, event no. 8, AW, event no. 9 and complex, event no. 13, see Supplementary Table 2). To the left, the three types of hysteresis loops with normalized CO2 concentration (y-axis) and normalized discharge (x-axis). To the right, the time series of discharge (left y-axis) and CO2 concentration (right y-axis) over time for each event (x-axis). Cold colors (blue/light blue) represent the beginning of the event and warm (red/orange) colors the end of the event.
Results of the PCA showed that the first two principal components (PC1 and PC2) accounted for 69% of the variation (Figure 7). The PCA showed a good assemblage of the events based on their seasonality (spring, summer, and autumn), but not according to the shape of the hysteresis loops. Summer events were generally positively associated with mean CO2 and range of CO2 variation, total SR, and mean water temperature. In contrast, these descriptive characteristics were generally negatively related to autumn events. Flow related characteristics (max, range and mean Q) were not related to CO2 describing characteristics (or summer events). The total precipitation generating each event was closely related to the duration of the event, but also to the range in measured EC. The mean EC was closely associated to both the maximum (QMax) and range (QRange) in discharge generated at each event. Finally, no correlation was found between the CO2 and Q peak hours. The shapes of the hysteresis loops were not clearly related to any of the descriptive characteristics during events.
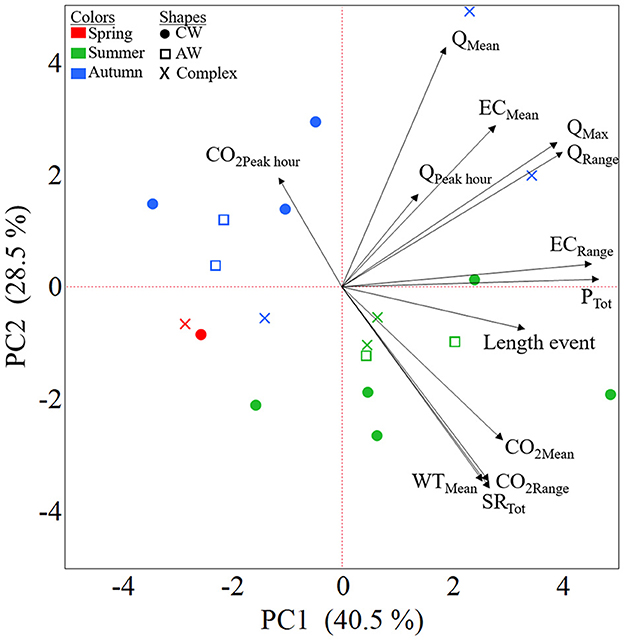
Figure 7. Biplot of the principal component analysis (PCA) based on event-specific data (Supplementary Table 2). The arrows represent the event characteristics and markers in color represent the single events. Each event is presented by (1) season, with different marker colors (red: spring, green: summer, blue: autumn) and (2) shape of the hysteresis loop, by marker type, circles: CW, squares: AW and crosses (×): Complex.
The CO2 concentration time series from DC2 where further compared with a corresponding time-series collected simultaneously from the completely forested catchment (C2) to explore any differences in the observed CO2 patterns between catchments with distinct land cover (Figure 8). It was evident from the 2-month comparison (May–June) that the two catchments differed in water chemistry (Table 1). DC2 and C2 displayed similar pH (4.6) but DC2 had generally higher EC than C2. Mean DOC concentrations in DC2 were twice the concentrations in C2. Nutrient levels were 4–14 times higher in DC2 than C2. Both the overall magnitude in CO2 concentration and its associated diel dynamics were different between the two headwater catchments. The mean CO2 concentration in DC2 for the 2 months was 2.32 mg C L−1 (range: 1.81–3.27 mg C L−1), to be compared with 1.51 mg C L−1 (range: 1.22–2.86 mg C L−1) for C2. On average, the amplitude of the diel cycle recorded at DC2 was 0.41 mg C L−1, or four times as high as in C2 (0.10 mg C L−1). All comparison between water chemistry variables at the two sites, except for pH, were significantly different (p < 0.05). The frequency distribution of CO2 concentration for DC2 showed a left-skewed unimodal distribution peaking around 2.05–2.15 mg C L accounting for 20% of the observations, while C2 has a left-skewed bimodal distribution (peak values at around 1.25–1.40 and 1.65 mg C L representing 32% and 9% of the total, respectively) (Supplementary Figure 8). The LogCO2 vs. LogQ relationship of C2 exhibited a stronger linear fit (R2 = 0.82, p < 0.0001) and a steeper slope (i.e., −0.12) than DC2 (R2 = 0.25, slope: −0.08, p < 0.0001) (Supplementary Figure 9). The water temperature time series of the two sites showed an overall similar seasonal pattern but with a much more pronounced diel water temperature amplitude (5.0°C) in DC2 than in C2 (2.0°C). It is to be noted that in C2 the initial discharge peak in May is attributed to the snowmelt that was still ongoing in the forested catchment for the two 1st weeks of the comparison. In contrast, for the clear-cut dominated DC2, the snow had already melted, and the discharge peak already passed prior to the comparing 2-month period. Despite the discharge peak induced by the snowmelt at C2, CO2 stream concentrations were relatively stable.
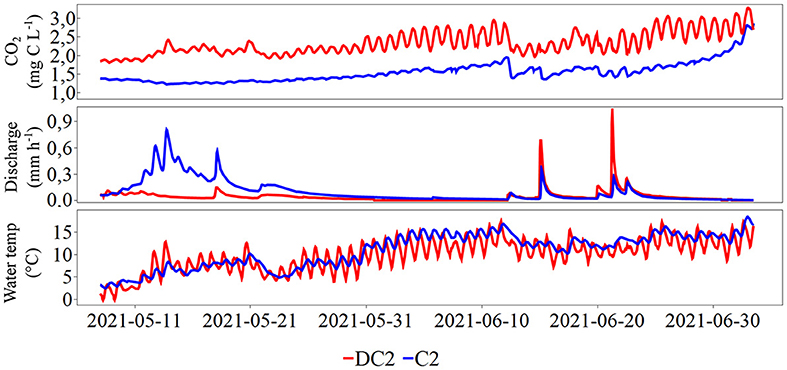
Figure 8. Time series of CO2, discharge, and water temperature for DC2 (red) and C2 (blue) during the period 8 May-5 July 2021 (2 months).
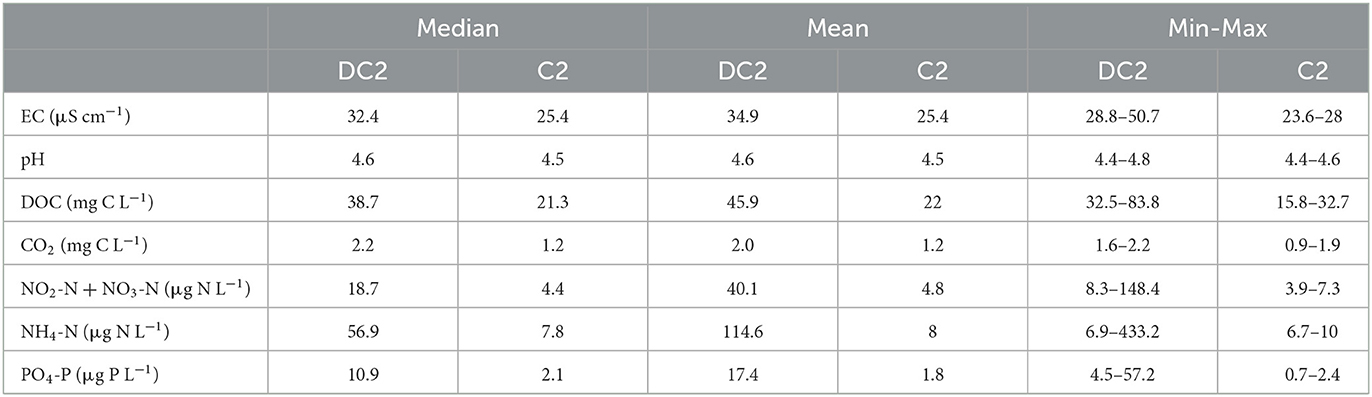
Table 1. Water chemistry at the outlets of DC2 and C2 catchments manually collected during the period 8 May-5 July 2021 (n = 6).
Headwater streams and ditches are known hotspots for atmospheric CO2 emissions, and the hydrological export of CO2 from catchment soils is commonly found as the main source in boreal regions (Striegl and Michmerhuizen, 1998; Rasilo et al., 2012; Riml et al., 2019). However, current large-scale estimates suffer from limited information regarding how these emissions are affected by human induced disturbances. Forestry is one such major disturbance, which is known to alter a wide range of hydrological and biogeochemical processes, but the effect on CO2 concentration dynamics and associated emissions in connected drainage networks are largely unknown.
Here we observed a mean clear-cut ditch CO2 concentration (2.47 mg C L−1) that was relatively high compared to both what was observed in the comparing forested catchment (C2), but also compared to other high-resolution monitoring studies of forested headwaters found in the literature. For example, mean CO2 concentration levels found in a study of streams draining different boreal and temperate forest ecosystems were generally lower (range of means: 0.73–2.13 mg C L−1) than the mean of the current study (Dinsmore et al., 2013). Furthermore, expressed as partial pressure (pCO2), the range found in our study (461–7,183 μatm) encompassed the full pCO2 range found by Crawford et al. (2017) covering multiple ecosystem types from alpine tundra (434–536 μatm) to temperate forests (2,815–6,225 μatm). The overall seasonal CO2 concentration pattern found, characterized by a summer peak in CO2, is typically observed across different types of ecosystems (i.e., arctic tundra, boreal forest, temperate forest, temperate peatlands, and alpine regions) (Crawford et al., 2017). The observed seasonal CO2 concentration pattern suggests a respiratory source further supported by the close relationship between mean daily CO2 concentration and water temperature (Figure 3A). Respiration is strongly controlled by temperature (Del Giorgio and Williams, 2005; Yvon-Durocher et al., 2012), and microbial mineralization of soil organic material is known to increase after clear-cut harvest due to increased soil temperatures caused by the absence of shading trees (Liski et al., 1998; Schelker et al., 2013).
In addition to the observed overall seasonal patterns, the high-frequency measurements allowed us to capture ditch CO2 concentration dynamics on short timescales (hourly or daily). For a majority of the study period, a clear diel signal was recorded with large day-to-night differences in CO2 concentration (mean and medium Δ: 0.35 and 0.30 mg C L−1, respectively corresponding to mean and median ΔpCO2 of 1,105 and 885 μatm). These diel CO2 cycles were particularly pronounced in amplitude during June and July (reaching up to 1.1 mg C L−1 or 4,078 μatm) but became more constrained toward the autumn. The mean of observed daily CO2 amplitudes was comparatively high in relation to other continuous CO2 measurements in low-productive arctic and alpine streams exhibiting diel fluctuations. For example, Rocher-Ros et al. (2020) registered a mean summer amplitude of about 900 μatm in a Swedish arctic tundra stream, and Peter et al. (2014) found a mean diel CO2 amplitude of about 370 μatm in an alpine stream, with amplitude values that peaked at 845 μatm in the summer during extended base flow. In contrast, much higher diel CO2 amplitudes were found in a nutrient rich agricultural stream in Sweden (medium amplitude: 2.03 mg C L−1, 2,974 μatm) (Wallin et al., 2020). We suggest that the pronounced diel cycles found in the ditch of the current study were driven by aquatic primary production consuming CO2 during daytime, as the minimum concentrations were recorded during mid-day and with a gradual shift in timing toward the afternoon during autumn (Rocher-Ros et al., 2020, 2021; Gómez-Gener et al., 2021). The pronounced diel patterns we observed further suggests that the temporal control on ditch CO2 has changed after clear-cut as a consequence of the elevated DOC and nutrient concentrations (compared to the forested catchment, C2) as well as due to increased light availability. Diel dynamics of the observed amplitude are typically observed in open canopy systems and is attributed to primary production largely driven by high light exposure (Crawford et al., 2017; Gómez-Gener et al., 2021).
Hydrology (i.e., variations in discharge) commonly plays an important role in regulating stream CO2 dynamics across different environments although with site-specific CO2-Q relationships (Dinsmore et al., 2013; Riml et al., 2019; Wallin et al., 2020). In our case study, the influence of variations in discharge on growing season ditch CO2 concentrations was complex and not easy to disentangle from the metabolic diel dynamics. Median daily ditch CO2 concentration was found negatively related to median daily discharge during spring and summer (May to August) but not during autumn (September to October) (Figure 5). However, the slopes of the monthly CO2-Q relationships indicate a general “chemostatic” response in relation to variable discharge, implying a relatively low hydrological influence on ditch CO2 concentrations. This suggests that (1) the terrestrial (or in-ditch) source for CO2 is relatively stable in its hydrological connectivity, or (2) that non-hydrological processes counterbalance any variations in CO2 caused by a variable discharge (Rehn et al., 2023). The response in CO2 following individual hydrological events was in contrast highly variable. The CO2-Q hysteresis plots were in many cases influenced by the diel CO2 fluctuations leading to tangled hysteresis shapes, making it hard to extract information. Only one extreme hydrological event (i.e., event no. 8, Figure 6) showed an unequivocal and straightforward response in CO2 concentrations from the analysis of the hysteresis loops. It is worth noting that this event registered both the highest incoming SR as well as the second highest total precipitation and had a runoff peak during day hours (Supplementary Table 2), when CO2 is consumed due to high primary production rates. Other runoff events (some with comparable intensity) had a significant impact on the CO2 level, but either had runoff peaks during night hours (e.g., events no. 4 and 13) or occurred in the autumn (e.g., events no. 16 and 18), when the SR is low. As a result, the simultaneous metabolic signals made the hysteresis plots complex. We suggest that the different hydrological responses on CO2 are related to the timing of an event, during what season the event occurs, whether the event follows an extended dry period, or when during the day (day or night) the runoff peaks. The absence of a clear response in CO2 concentration for most of the events, suggests that variations in runoff did not have a major control on ditch CO2 dynamics and were instead overridden by the stronger light and temperature induced metabolic control operating at the diel timescale (Bernal et al., 2022).
The importance of in-situ metabolic processes controlling CO2 dynamics was finally supported by the event based and control integrated PCA analysis (Figure 7). Both the magnitude in CO2 concentration and range in diel CO2 concentration amplitude were closely related to both daily total SR and mean water temperature. In contrast, the PCA displayed low influence on CO2 by any of the hydrological metrics. The elevated in-situ control on ditch CO2 following forest harvest was further evident when comparing continuous data collected from DC2 with the completely forested catchment C2 included in the KCS and located within 10 km from DC2. C2 is representative for the conditions at DC2 as they were prior to the forest harvest and is used as one of two forest control catchments within the experimental design of the TEA. From the comparative analysis between DC2 and C2 clear differences were observed, both in concentration magnitude and amplitude of the diel CO2 cycles, but also in diel water temperature patterns. This suggests that the collective conditions after clear-cut, with elevated solar radiation exposure and increased DOC and nutrient concentrations alter the in-situ ditch ecosystem function, and by that enhancing the importance of temperature- and light-induced metabolic control on the CO2 dynamics. Furthermore, the slope of the logCO2-logQ relationship observed in C2 was more negative than in DC2 (−0.12 and −0.08, respectively) suggesting a higher runoff control on CO2 concentration (Supplementary Figure 9). This comparative part of the study further supports our hypothesis that in-situ metabolism is a key driver of aquatic CO2 dynamics in clear-cut catchments.
We acknowledge that the current study only represents a single ditch and observed patterns are likely site-specific. However, we believe our finding of an increased metabolic control on CO2 dynamics in forest ditches and streams following clear-cut harvest should be valid across regions with similar climatic conditions and forest management. The increased short-term CO2 concentration dynamics following forest harvest will also lead to altered emissions patterns. To what extent these altered patterns will influence total annual emissions is uncertain and will require detailed investigations. Klaus et al. (2018) found that despite significant increases of CO2 in groundwater of clear-cut affected catchment soils, no change in GHG (including CO2) fluxes in adjacent streams were detected within 3 years after the treatment. The authors explained the mismatch in patterns between ground- and stream water with that the trees left in the riparian zones most likely acted as an effective buffer zone mitigating stream GHG emissions. The findings of the current study suggest that increased aquatic productivity might play a role in consuming the elevated soil CO2 export following forest harvest. Thus, inorganic C will be converted into organic forms shortly after being transported across the soil-water interface.
We conclude that CO2 concentration dynamics in forest ditches affected by clear-cut harvest are driven by a complex interplay of light and hydrologically induced processes. Despite the common perception of forest ditches as nutrient-poor systems typically showing low metabolic rates, our findings suggest that metabolism, and primary production specifically, exerts significant control on short-term ditch CO2 concentration dynamics. In contrast, variations in discharge displayed a comparatively less dominant influence on the variation in CO2 concentrations. The high CO2 concentration dynamics and the associated metabolic controls should be considered when scaling CO2 emissions across boreal landscapes impacted by clear-cut forestry. To improve our understanding of these processes, we recommend that future studies combine measures of C export/emission with in-situ metabolism and that these are conducted over longer time scales (i.e., >single growing season). Overall, our results emphasize the need for more comprehensive and detailed investigations of the factors regulating CO2 dynamics in forest ditches and their implications for the landscape-scale C budgets.
The raw data supporting the conclusions of this article will be made available by the authors, without undue reservation.
AZ and MW designed the study. AZ carried out most of the fieldwork, analyzed the data, and wrote the first draft of the manuscript. MW, KE, EL, EM, and HL further provided scientific insight to the analysis and interpretation of the data. All authors commented on earlier versions of this paper.
The study was supported by funding from the Swedish Research Council Formas (2019:01105) and Oscar and Lili Lamm Foundation (DO2019-0010). The KCS infrastructure and long-term data collection have been funded by the Swedish Research Council VR (SITES, Grant No. 2021-00164), several individual Formas (e.g., 2018-00723), and VR grants, SKB, as well as by the Knut and Alice Wallenberg and Kempe Foundation (Grant 2018.0259). The TEA infrastructure was initiated and co-funded by the European Union GRIP on LIFE IP project (LIFE16IPE SE009 GRIP) led by the Swedish Forest Agency.
We would like to thank the land owner Holmen Skog. Matthias Peichl is acknowledged for sharing radiation data. The authors would also like to thank all the skilled and dedicated field and lab personnel within KCS/TEA which have enabled the current study.
The authors declare that the research was conducted in the absence of any commercial or financial relationships that could be construed as a potential conflict of interest.
All claims expressed in this article are solely those of the authors and do not necessarily represent those of their affiliated organizations, or those of the publisher, the editors and the reviewers. Any product that may be evaluated in this article, or claim that may be made by its manufacturer, is not guaranteed or endorsed by the publisher.
The Supplementary Material for this article can be found online at: https://www.frontiersin.org/articles/10.3389/frwa.2023.1250068/full#supplementary-material
1. ^Laudon, H., Mosquera, V., Eklöf, K., Järveoja, J., Karimi, S., Krasnova, A., et al. (2023). Consequences of rewetting and ditch cleaning on hydrology, water quality and greenhouse gas balance in a drained northern landscape. (Manuscript submitted for publication).
Åberg, J., and Wallin, M. B. (2014). Evaluating a fast headspace method for measuring DIC and subsequent calculation of pCO2 in freshwater systems. Inl. Waters 4, 157–166. doi: 10.5268/IW-4.2.694
Andréassian, V. (2004). Waters and forests: From historical controversy to scientific debate. J. Hydrol. 291, 1–27. doi: 10.1016/j.jhydrol.2003.12.015
Attermeyer, K., Casas-Ruiz, J. P., Fuss, T., Pastor, A., Cauvy-Fraunié, S., Sheath, D., et al. (2021). Carbon dioxide fluxes increase from day to night across European streams. Commun. Earth Environ. 2, 1–8. doi: 10.1038/s43247-021-00192-w
Bernal, S., Cohen, M. J., Ledesma, J. L. J., Kirk, L., Mart,í, E., and Lupon, A. (2022). Stream metabolism sources a large fraction of carbon dioxide to the atmosphere in two hydrologically contrasting headwater streams. Limnol. Oceanogr. 67, 2621–2634. doi: 10.1002/lno.12226
Billett, M. F., Deacon, C. M., Palmer, S. M., Dawson, J. J. C., and Hope, D. (2006). Connecting organic carbon in stream water and soils in a peatland catchment. J. Geophys. Res. Biogeosci. 111, 1–13. doi: 10.1029/2005JG000065
Blackburn, M., Ledesma, J. L. J., Näsholm, T., Laudon, H., and Sponseller, R. A. (2017). Evaluating hillslope and riparian contributions to dissolved nitrogen (N) export from a boreal forest catchment. J. Geophys. Res. Biogeosci. 122, 324–339. doi: 10.1002/2016JG003535
Burrows, R. M., Jonsson, M., Fältström, E., Andersson, J., and Sponseller, R. A. (2021). Interactive effects of light and nutrients on stream algal growth modified by forest management in boreal landscapes. Forest Ecol. Manag. 492, 119212. doi: 10.1016/j.foreco.2021.119212
Campeau, A., Bishop, K., Amvrosiadi, N., Billett, M. F., Garnett, M. H., Laudon, H., et al. (2019). Current forest carbon fixation fuels stream CO 2 emissions. Nat. Commun. 10, 1–9. doi: 10.1038/s41467-019-09922-3
Campeau, A., Bishop, K., Nilsson, M. B., Klemedtsson, L., Laudon, H., Leith, F. I., et al. (2018). Stable carbon isotopes reveal soil-stream DIC linkages in contrasting headwater catchments. J. Geophys. Res. Biogeosci. 123, 149–167. doi: 10.1002/2017JG004083
Catalán, N., Marcé, R., Kothawala, D. N., and Tranvik, L. J. (2016). Organic carbon decomposition rates controlled by water retention time across inland waters. Nat. Geosci. 9, 501–504. doi: 10.1038/ngeo2720
Crawford, J. T., Stanley, E. H., Dornblaser, M. M., and Striegl, R. G. (2017). CO2 time series patterns in contrasting headwater streams of North America. Aquat. Sci. 79, 473–486. doi: 10.1007/s00027-016-0511-2
Crawford, J. T., Striegl, R. G., Wickland, K. P., Dornblaser, M. M., and Stanley, E. H. (2013). Emissions of carbon dioxide and methane from a headwater stream network of interior Alaska. J. Geophys. Res. Biogeosci. 118, 482–494. doi: 10.1002/jgrg.20034
Del Giorgio, P., and Williams, P. (2005). Respiration in Aquatic Ecosystems. Oxford: OUP. doi: 10.1093/acprof:oso/9780198527084.001.0001
Dinsmore, K. J., Wallin, M. B., Johnson, M. S., Billett, M. F., Bishop, K., Pumpanen, J., et al. (2013). Contrasting CO2 concentration discharge dynamics in headwater streams: A multi-catchment comparison. J. Geophys. Res. Biogeosci. 118, 445–461. doi: 10.1002/jgrg.20047
Evans, C., and Davies, T. D. (1998). Causes of concentration/discharge hysteresis and its potential as a tool for analysis of episode hydrochemistry. Hydrogeochem. Water Chem. 34, 129–137. doi: 10.1029/97WR01881
Gómez-Gener, L., Rocher-Ros, G., Battin, T., Cohen, M. J., Dalmagro, H. J., Dinsmore, K. J., et al. (2021). Global carbon dioxide efflux from rivers enhanced by high nocturnal emissions. Nat. Geosci. 14, 289–294. doi: 10.1038/s41561-021-00722-3
Johnson, M. S., Billett, M. F., Dinsmore, K. J., Wallin, M., Dyson, K. E., and Jassal, R. S. (2010). Direct and continuous measurement of dissolved carbon dioxide in freshwater aquatic systems – methods and applications. Ecohydrology 3, 68–78. doi: 10.1002/eco.95
Johnson, M. S., Weiler, M., Couto, E. G., Riha, S. J., and Lehmann, J. (2007). Storm pulses of dissolved CO2 in a forested headwater Amazonian stream explored using hydrograph separation. Water Resour. Res. 43, 1–8. doi: 10.1029/2007WR006359
Klaus, M., Geibrink, E., Jonsson, A., Bergström, A. K., Bastviken, D., Laudon, H., et al. (2018). Greenhouse gas emissions from boreal inland waters unchanged after forest harvesting. Biogeosciences 15, 5575–5594. doi: 10.5194/bg-15-5575-2018
Köhler, S., Buffam, I., Jonsson, A., and Bishop, K. (2002). Photochemical and microbial processing of stream and soil water dissolved organic matter in a boreal forested catchment in northern Sweden. Aquat. Sci. 64, 269–281. doi: 10.1007/s00027-002-8071-z
Lamberti, G. A., and Steinman, A. D. (1997). A comparison of primary production in stream ecosystems. J. North Am. Benthol. Soc. 16, 95–104. doi: 10.2307/1468241
Lannergård, E. E., Fölster, J., and Futter, M. N. (2021). Turbidity-discharge hysteresis in a meso-scale catchment: The importance of intermediate scale events. Hydrol. Process. 35, 1–16. doi: 10.1002/hyp.14435
Laudon, H., Hasselquist, E. M., Peichl, M., Lindgren, K., Sponseller, R., Lidman, F., et al. (2021). Northern landscapes in transition: Evidence, approach and ways forward using the Krycklan catchment study. Hydrol. Process. 35, 1–15. doi: 10.1002/hyp.14170
Laudon, H., Hedtjärn, J., Schelker, J., Bishop, K., Sørensen, R., and Ågren, A. (2009). Response of dissolved organic carbon following forest harvesting in a boreal forest. AMBIO 38, 381–386. doi: 10.1579/0044-7447-38.7.381
Laudon, H., Taberman, I., Ågren, A., Futter, M., Ottosson-Löfvenius, M., and Bishop, K. (2013). The Krycklan Catchment Study - A flagship infrastructure for hydrology, biogeochemistry, and climate research in the boreal landscape. Water Resour. Res. 49, 7154–7158. doi: 10.1002/wrcr.20520
Leach, J. A., Larsson, A., Wallin, M. B., Nilsson, M. B., and Laudon, H. (2016). Twelve year interannual and seasonal variability of stream carbon export from a boreal peatland catchment. J. Geophys. Res. Biogeosci. 121, 1851–1866. doi: 10.1002/2016JG003357
Leith, F. I., Dinsmore, K. J., Wallin, M. B., Billett, M. F., Heal, K. V., Laudon, H., et al. (2015). Carbon dioxide transport across the hillslope-riparian-stream continuum in a boreal headwater catchment. Biogeosciences 12, 1881–1902. doi: 10.5194/bg-12-1881-2015
Liski, J., Ilvesniemi, H., Mäkelä, A., and Starr, M. (1998). Model analysis of the effects of soil age, fires and harvesting on the carbon storage of boreal forest soils. Eur. J. Soil Sci. 49, 407–416. doi: 10.1046/j.1365-2389.1998.4930407.x
Lloyd, C. E. M., Freer, J. E., Johnes, P. J., and Collins, A. L. (2016). Technical note: Testing an improved index for analysing storm dischargeconcentration hysteresis. Hydrol. Earth Syst. Sci. 20, 625–632. doi: 10.5194/hess-20-625-2016
Marx, A., Dusek, J., Jankovec, J., Sanda, M., Vogel, T., van Geldern, R., et al. (2017). A review of CO2 and associated carbon dynamics in headwater streams: A global perspective. Rev. Geophys. 55, 560–585. doi: 10.1002/2016RG000547
Meybeck, M., and Moatar, F. (2012). Daily variability of river concentrations and fluxes: indicators based on the segmentation of the ratingcurve. Hydrol. Process. 26:1188–1207. doi: 10.1002/hyp.8211
Mosquera, V., Hasselquist, E. M., Sponseller, R. A., and Laudon, H. (2022). Co-occurrence of browning and oligotrophication in a boreal stream network. Limnol. Oceanogr. 67, 2325–2339. doi: 10.1002/lno.12205
Nieminen, M. (2004). Export of dissolved organic carbon, nitrogen and phosphorus following clear-cutting of three Norway spruce forests growing on drained peatlands in southern Finland. Silva Fenn. 38, 123–132. doi: 10.14214/sf.422
Nimick, D. A., Gammons, C. H., and Parker, S. R. (2011). Diel biogeochemical processes and their effect on the aqueous chemistry of streams: a review. Chem. Geol. 283, 3–17. doi: 10.1016/j.chemgeo.2010.08.017
Norstedt, G., Hasselquist, E. M., and Laudon, H. (2021). From haymaking to wood production : past use of mires in northern Sweden affect current ecosystem services and function. Rural Landsc. 8, 1–15. doi: 10.16993/rl.70
Öquist, M. G., Wallin, M., Seibert, J., Bishop, K., and Laudon, H. (2009). Dissolved inorganic carbon export across the soil/stream interface and its fate in a boreal headwater stream. Environ. Sci. Technol. 43, 7364–7369. doi: 10.1021/es900416h
Päivaänen, J., and Hånell, B. (2012). Peatland ecology and forestry – a sound approach. Helsinki: University of Helsinki Department of Forest Sciences Publications 3.
Peacock, M., Granath, G., Wallin, M. B., Högbom, L., and Futter, M. (2021). Significant emissions from forest drainage ditches - an unaccounted term in anthropogenic greenhouse gas inventories? J. Geophys. Res. Biogeosci. 126, e2021JG006478. doi: 10.1029/2021JG006478
Peter, H., Singer, G. A., Preiler, C., Chifflard, P., Steniczka, G., and Battin, T. J. (2014). Scales and drivers of temporal pCO2 dynamics in an Alpine stream. J. Geophys. Res. Biogeosci. 119, 1078–1091. doi: 10.1002/2013JG002552
Rasilo, T., Ojala, A., Huotari, J., and Pumpanen, J. (2012). Rain induced changes in carbon dioxide concentrations in the soil-lake-brook continuum of a boreal forested catchment. Vadose Zone J. 11, e39. doi: 10.2136/vzj2011.0039
Raymond, P. A., Hartmann, J., Lauerwald, R., Sobek, S., McDonald, C., Hoover, M., et al. (2013). Global carbon dioxide emissions from inland waters. Nature 503, 355–359. doi: 10.1038/nature12760
Rehn, L., Sponseller, R. A., Laudon, H., and Wallin, M. B. (2023). Long-term changes in dissolved inorganic carbon across boreal streams caused by altered hydrology. Limnol. Oceanogr. 68, 409–423. doi: 10.1002/lno.12282
Riml, J., Campeau, A., Bishop, K., and Wallin, M. B. (2019). Spectral decomposition reveals new perspectives on CO2 concentration patterns and soil-stream linkages. J. Geophys. Res. Biogeosci. 124, 3039–3056. doi: 10.1029/2018JG004981
Roberts, B. J., Mulholland, P. J., and Hill, W. R. (2007). Multiple scales of temporal variability in ecosystem metabolism rates: Results from 2 years of continuous monitoring in a forested headwater stream. Ecosystems 10, 588–606. doi: 10.1007/s10021-007-9059-2
Rocher-Ros, G., Harms, T. K., Sponseller, R. A., Väisänen, M., Mörth, C. M., and Giesler, R. (2021). Metabolism overrides photo-oxidation in CO2 dynamics of Arctic permafrost streams. Limnol. Oceanogr. 66, S169–S181. doi: 10.1002/lno.11564
Rocher-Ros, G., Sponseller, R. A., Bergström, A. K., Myrstener, M., and Giesler, R. (2020). Stream metabolism controls diel patterns and evasion of CO2 in Arctic streams. Glob. Chang. Biol. 26, 1400–1413. doi: 10.1111/gcb.14895
Schelker, J., Eklöf, K., Bishop, K., and Laudon, H. (2012). Effects of forestry operations on dissolved organic carbon concentrations and export in boreal first-order streams. J. Geophys. Res. Biogeosci. 117, 1–12. doi: 10.1029/2011JG001827
Schelker, J., Kuglerová, L., Eklöf, K., Bishop, K., and Laudon, H. (2013). Hydrological effects of clear-cutting in a boreal forest – Snowpack dynamics, snowmelt and streamflow responses. J. Hydrol. 484, 105–114. doi: 10.1016/j.jhydrol.2013.01.015
Schelker, J., Singer, G. A., Ulseth, A. J., Hengsberger, S., and Battin, T. J. (2016a). CO2 evasion from a steep, high gradient stream network: importance of seasonal and diurnal variation in aquatic pCO2 and gas transfer. Limnol. Oceanogr. 61, 1826–1838. doi: 10.1002/lno.10339
Schelker, J., Sponseller, R., Ring, E., Högbom, L., Löfgren, S., and Laudon, H. (2016b). Nitrogen export from a boreal stream network following forest harvesting: seasonal nitrate removal and conservative export of organic forms. Biogeosciences 13, 1–12. doi: 10.5194/bg-13-1-2016
Sørensen, R., Ring, E., Meili, M., Högbom, L., Seibert, J., Grabs, T., et al. (2009). Forest harvest increases runoff most during low flows in two boreal streams. Ambio 38, 357–363. doi: 10.1579/0044-7447-38.7.357
Striegl, R. G., and Michmerhuizen, C. M. (1998). Hydrologic influence on methane and carbon dioxide dynamics at two north-central Minnesota lakes. Limnol. Oceanogr. 43, 1519–1529. doi: 10.4319/lo.1998.43.7.1519
Swedish Forest Agency (2020). Swedish National Forest Inventory, 2020. Umeå: The Department of Forest Resource Management, Swedish University of Agricultural Sciences. Available online at: http://www.slu.se/nf
Tank, J. L., Rosi-Marshall, E. J., Griffiths, N. A., Entrekin, S. A., and Stephen, M. L. (2010). A review of allochthonous organic matter dynamics and metabolism in streams. J. North Am. Benthol. Soc. 29, 118–146. doi: 10.1899/08-170.1
Wallin, M., Buffam, I., Öquist, M., Laudon, H., and Bishop, K. (2010). Temporal and spatial variability of dissolved inorganic carbon in a boreal stream network: Concentrations and downstream fluxes. J. Geophys. Res. Biogeosci. 115, 1100. doi: 10.1029/2009JG001100
Wallin, M. B., Audet, J., Peacock, M., Sahlée, E., and Winterdahl, M. (2020). Carbon dioxide dynamics in an agricultural headwater stream driven by hydrology and primary production. Biogeosciences 17, 2487–2498. doi: 10.5194/bg-17-2487-2020
Wallin, M. B., Campeau, A., Audet, J., Bastviken, D., Bishop, K., Kokic, J., et al. (2018). Carbon dioxide and methane emissions of Swedish low-order streams—a national estimate and lessons learnt from more than a decade of observations. Limnol. Oceanogr. Lett. 3, 156–167. doi: 10.1002/lol2.10061
Wallin, M. B., Weyhenmeyer, G. A., Bastviken, D., Chmiel, H. E., Peter, S., Sobek, S., et al. (2015). Temporal control on concentration, character, and export of dissolved organic carbon in two hemiboreal headwater streams draining contrasting catchments. J. Geophys. Res. Biogeosci. 120, 832–846. doi: 10.1002/2014JG002814
Winterdahl, M., Wallin, M. B., Karlsen, R. H., Laudon, H., Öquist, M., and Lyon, S. W. (2016). Decoupling of carbon dioxide and dissolved organic carbon in boreal headwater streams. J. Geophys. Res. Biogeosci. 121, 2630–2651. doi: 10.1002/2016JG003420
Keywords: CO2, drainage ditches, clear-cut forestry, metabolic processes, land use change
Citation: Zannella A, Eklöf K, Lannergård E, Laudon H, Maher Hasselquist E and Wallin MB (2023) Metabolic processes control carbon dioxide dynamics in a boreal forest ditch affected by clear-cut forestry. Front. Water 5:1250068. doi: 10.3389/frwa.2023.1250068
Received: 29 June 2023; Accepted: 13 October 2023;
Published: 02 November 2023.
Edited by:
Johannes A. C. Barth, Friedrich-Alexander-Universität Erlangen-Nürnberg, GermanyReviewed by:
Danny Croghan, University of Oulu, FinlandCopyright © 2023 Zannella, Eklöf, Lannergård, Laudon, Maher Hasselquist and Wallin. This is an open-access article distributed under the terms of the Creative Commons Attribution License (CC BY). The use, distribution or reproduction in other forums is permitted, provided the original author(s) and the copyright owner(s) are credited and that the original publication in this journal is cited, in accordance with accepted academic practice. No use, distribution or reproduction is permitted which does not comply with these terms.
*Correspondence: Alberto Zannella, YWxiZXJ0by56YW5uZWxsYUBzbHUuc2U=
Disclaimer: All claims expressed in this article are solely those of the authors and do not necessarily represent those of their affiliated organizations, or those of the publisher, the editors and the reviewers. Any product that may be evaluated in this article or claim that may be made by its manufacturer is not guaranteed or endorsed by the publisher.
Research integrity at Frontiers
Learn more about the work of our research integrity team to safeguard the quality of each article we publish.