 Paige Tunby1*
 Justin Nichols1
 Asmita Kaphle1
 Aashish Sanjay Khandelwal1
 David J. Van Horn2
 Ricardo González-Pinzón1*
- 1Gerald May Department of Civil, Construction and Environmental Engineering, University of New Mexico, Albuquerque, NM, United States
- 2Department of Biology, University of New Mexico, Albuquerque, NM, United States
Anthropogenic and natural disasters (e.g., wildfires, oil spills, mine spills, sewage treatment facilities) cause water quality disturbances in fluvial networks. These disturbances are highly unpredictable in space-time, with the potential to propagate through multiple stream orders and impact human and environmental health over days to years. Due to challenges in monitoring and studying these events, we need methods to strategize the deployment of rapid response research teams on demand. Rapid response research has the potential to close the gap in available water quality data and process understanding through time-sensitive data collection efforts. This manuscript presents a protocol that can guide researchers in preparing for and researching water quality disturbance events. We tested and refined the protocol by assessing the longitudinal propagation of water quality disturbances from the 2022 Hermit's Peak—Calf Canyon, NM, USA, the largest in the state's recorded history. Our rapid response research allowed us to collect high-resolution water quality data with semi-continuous sensors and synoptic grab sampling. The data collected have been used for traditional peer-reviewed publications and pragmatically to inform water utilities, restoration, and outreach programs.
1. Introduction
1.1. Water quality disturbances and longitudinal propagation
Anthropogenic and natural disasters cause water quality disturbances, such as those generated by wildfires, oil spills, mine spills, sewage treatment facilities, and other point and non-point releases of toxic or hazardous materials (Owens et al., 1993; U.S. Environmental Protection Agency, 2000; ASCE Foundation, 2017; Ball et al., 2021). The impacts of these disturbances are most critical near the source but can propagate over many stream orders along fluvial networks, affecting agricultural, industrial, and drinking water supplies (Table 1). The fate and transport of dissolved and particulate substances that are generated from disturbances are controlled by multiple physical (i.e., advection, dispersion, mixing, deposition, resuspension, and transient storage), biological (i.e., uptake, decay, and production), and chemical processes (i.e., sorption, decay, and production) (Workshop, 1990; Abbott et al., 2016; Knapp et al., 2017; Drummond et al., 2018; González-Pinzón et al., 2022). The downstream effects of these water quality disturbances are seen as elevated levels of pollution associated with, but not limited to, nutrients, carbon, ash, sediments, metals, pathogens, micropollutants, and liquid or non-aqueous phase liquid substances (Lee et al., 2015; Robinne et al., 2018; Duval et al., 2020; Peters and Zitomer, 2021).
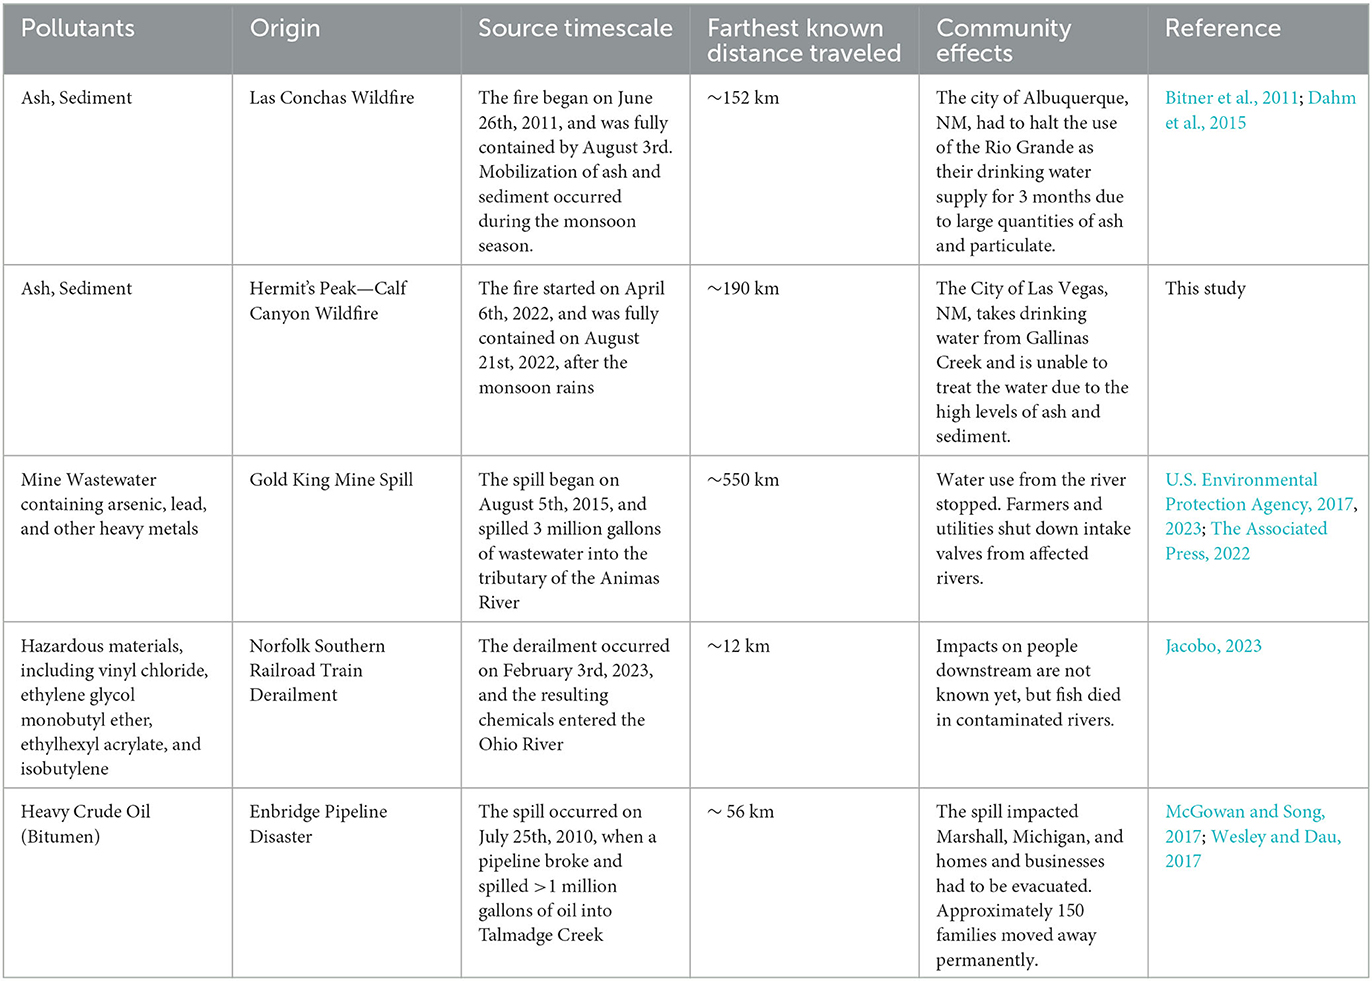
Table 1. Example of water quality disturbances propagation over many stream orders along fluvial networks.
Given the unpredictability of water quality disturbances, their potential for propagation along fluvial networks, and their impact on the environment and communities downstream, we need quantitative, early alert frameworks to anticipate their magnitude, timing, and extent. An ideal alert system would mimic the promptness of weather forecasting, which has evolved over many decades from isolated measurement with equipment and rudimentary sensors on the ground to including near-ground flux towers, long-range radar systems that detect regional weather systems, weather balloons tracing changes from the ground to the end of the stratosphere, and satellites that operate at planetary scales (National Research Council, 2012; National Center for Atmospheric Research, 2017; National Weather Service, 2022). More importantly, all these networks of sensors are connected through multi-scale spatial and temporal modeling systems that are updated in near real-time and consider historical data (National Research Council, 2012).
Unlike weather forecasting, water quality forecasting does not exist yet. While some countries have made progress in instrumenting streams, rivers, and lakes (Wagner et al., 2006; Jones et al., 2017), most of the attention is given to quantifying water quantity (i.e., discharge), and the information collected in the few sites instrumented with water quality sensors is not connected through computer models capable of processing that information in near real-time (Pacific Northwest National Lab, 2022). As such, we currently cannot forecast the effects of water quality disturbances along fluvial networks, even when we depend on access to clean water resources for agriculture, industrial activities, and drinking water supply. Therefore, when new disturbances occur, it is unclear which downstream communities will be affected and for how long.
1.2. Water quality disturbances from wildfires
Wildfires predate humans and can occur naturally (Breshears et al., 2005; Raffa et al., 2008; Allen et al., 2010; Williams et al., 2010; Weed et al., 2013). However, anthropogenic activities have altered natural fire regimes through changes to land cover and accelerated warming of the atmosphere (Breshears et al., 2005; Raffa et al., 2008; Allen et al., 2010; Williams et al., 2010; Weed et al., 2013). The increase in livestock grazing, logging, human proximity to forested areas, and fire suppression strategies have increased the severity, extension, and damage caused by wildfires. The effects of land cover changes are most significant in areas where the natural fire regime used to be frequent but low intensity (Dennison et al., 2014; Ball et al., 2021). Wildfire frequency is strongly associated with variations in spring and summer temperatures in which warmer temperatures lead to earlier spring snowmelt, longer dry seasons, and drier vegetation, all of which can contribute to larger fires (Westerling et al., 2006).
Wildfires impact hydrological processes by decreasing infiltration, evapotranspiration, and groundwater recharge (Cerda, 1998; Neary et al., 2005), leading to long-term increases in peak flows (Moody and Martin, 2001). Postfire storms generate disturbances with elevated downstream particulate and solute propagation and associated sags in dissolved oxygen (Bixby et al., 2015). Additionally, moderate to high-severity fires increase dissolved and total nutrients and metals entering streams (Sherson et al., 2015; Rust et al., 2019), which affects organisms and alters ecosystem diversity and processing in affected fluvial networks (Gresswell, 1999; Minshall et al., 2001). Ecosystem services associated with water supply for municipal, agricultural, commercial, industrial, religious, educational, and power generation demands are also impacted, as well as the availability of clean soils to grow crops and habitat for animals (Neary et al., 2005; Brauman et al., 2007; Smith et al., 2011; Rust et al., 2019). The disturbances generated and ecosystem services affected depend on the complex interactions of the fire characteristics (intensity, severity, and frequency), suppression techniques, subsequent meteorological and climatic conditions, and physical characteristics of the burned watershed and those downflow (slope and land cover, discharge, geomorphology) (Bixby et al., 2015).
1.3. Monitoring water quality disturbances from wildfires
To date, the study of wildfire disturbances in fluvial networks has relied mainly on the coincidental availability of sensors deployed for other research purposes (Dahm et al., 2015; Reale et al., 2015) and, thus, tends to lack strategic planning and execution (Ball et al., 2021). This status quo in monitoring water quality disturbances pre- and postfire contrasts with other more organized and strategic studies of terrestrial ecosystems within burned areas. Numerous terrestrial studies have utilized rapid response research teams (RRRTs from here on) before, during, and after wildfire events (Ottmar and Sandberg, 2003; Hudak et al., 2004; Robichaud et al., 2007) to generate data to inform fire managers, local land managers, and emergency response teams such as the Burned Area Emergency Response (BAER) teams (Lentile et al., 2007). Those RRRTs address logistical and safety challenges, build relationships with fire management organizations, and communicate and disseminate data to managers and other researchers. The utility of RRRTs for wildfire-related research includes a better understanding of post-fire effects on vegetation and soils and evaluating the effectiveness of fire management's actions and post-fire treatments. Those efforts have also generated data to calibrate models informing spatiotemporal terrestrial propagation of wildfires and improve tools used by fire managers (Lentile et al., 2007).
The limited data collected on disturbance propagation post-wildfire in aquatic systems has revealed impacts hundreds of kilometers downstream of the burn scar (Dahm et al., 2015; Reale et al., 2015). For example, the longitudinal propagation of wildfire disturbances from the Las Conchas Fire in New Mexico (USA) doubled the extent of streams and rivers affected within the burned area (Ball et al., 2021). That wildfire burned 634 km2 of forest in the headwaters of the Jemez River, a tributary to the Rio Grande (Dahm et al., 2015). A few weeks later, post-fire precipitation events mobilized large quantities of contamination that polluted the Rio Grande and forced the Albuquerque Water Treatment Plant, located ~140 km downstream of the burned area, to cease water intake from the river for 3 months (Bitner et al., 2011).
A new approach focused on preparation and readiness is needed to move beyond the status quo of a notable absence of downstream water quality monitoring efforts quantifying the longitudinal propagation of wildfire disturbances relative to the active research done in terrestrial ecosystems. The motivation is clear: wildfires contribute to water quality impairment and represent a significant threat to water security as they increase nutrients, metals, sediments, noxious aquatic plants, and dissolved solids, etc. Therefore, wildfire preparedness plans should include local, state, federal and international funding for both terrestrial and aquatic monitoring responses to reduce vulnerability and promote resilience. Since wildfires are unpredictable and grow quickly, new funding mechanisms are needed to equip RRRTs proximal to wildfire-prone areas to respond on demand. Additionally, RRRTs should be continuously funded so they are ready to capture watershed responses and document longitudinal behavior. For this, we must develop dynamic monitoring approaches focused on longitudinal data collection to supplement stationary (i.e., Eulerian monitoring) and longer-term monitoring programs. Clearly, dynamic monitoring should be the priority of RRRTs, and these teams should be equipped with state-of-the-art tools to document wildfire disturbance propagation.
The development of a generalized protocol is a first step toward building effective RRRTs with an aquatic focus. This will reduce the time required for preparation, securing site access, data collection, sharing data, and modeling outcomes, and increase the likelihood of capturing both first-flush and long-term data. More importantly, the methods developed for RRRTs focused on wildfires can be implemented in other monitoring efforts, such as those required after spills. With this context in mind, the goals of this manuscript are to develop a RRRT protocol with detailed descriptions to guide teams conducting rapid response research on aquatic ecosystems, and apply it to address the research question how far downstream do wildfire disturbances propagate in fluvial networks? We successfully applied and refined our protocol by deploying a RRRT to monitor the Hermit's Peak–Calf Canyon Fire (HPCC) in Las Vegas, New Mexico (USA), within 2 weeks after the fire began. The protocol is written to guide researchers in conducting rapid response research (RRR) on unknown disturbance events in fluvial networks. We explain the three phases required for conducting RRR with our protocol and detail the application of the protocol to the monitoring of water quality disturbances along a 190 km fluvial network.
2. Methods: protocol for rapid response research teams
We developed an easy-to-follow RRR protocol with flowcharts guiding an RRRT planning to monitor disturbances propagating through a fluvial network. To avoid ambiguities, we define an RRRT as a team of human and material resources that responds on-demand to a disturbance caused by a natural or anthropogenic disaster to collect relevant data. Our protocol to guide that RRRT is separated into three stages, i.e., (1) pre-incident preparedness, (2) field deployment, and (3) data collection (Figure 1). The first stage includes the tasks that must be completed before an incident occurs. The planning and communication detailed in this stage are crucial to adequately prepare to perform RRR when the timing and location of the disaster are not yet well defined (Figure 2). The second stage begins when an incident that fits the research objective occurs and builds on the groundwork completed in the first stage (Figure 3). The third phase occurs after the deployment of instrumentation and continues until it is determined that sufficient data have been collected. It includes the ongoing equipment maintenance requirements and data acquisition and processing (Figure 4).
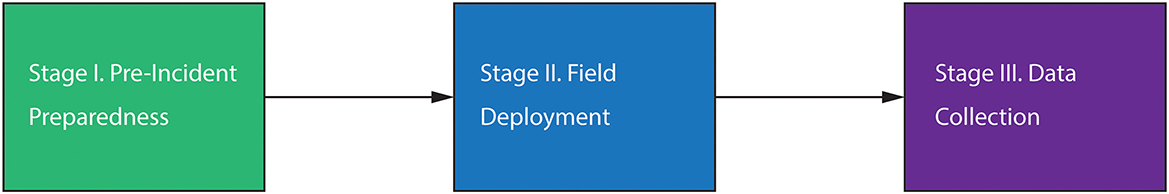
Figure 1. Overview of the flowchart for the rapid response research team (RRRT) protocol.
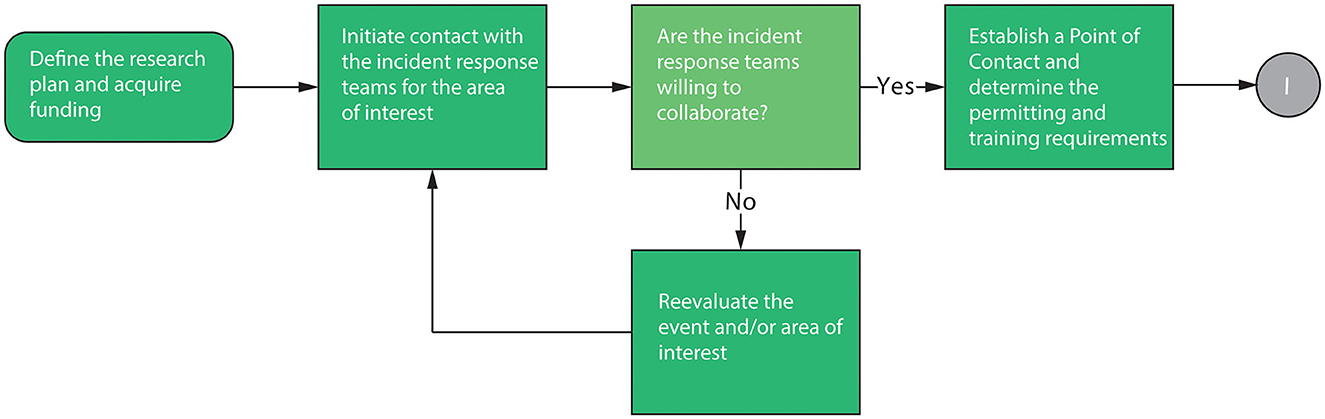
Figure 2. Flowchart phase 1 of rapid response research team (RRRT) protocol: pre-incident preparedness.
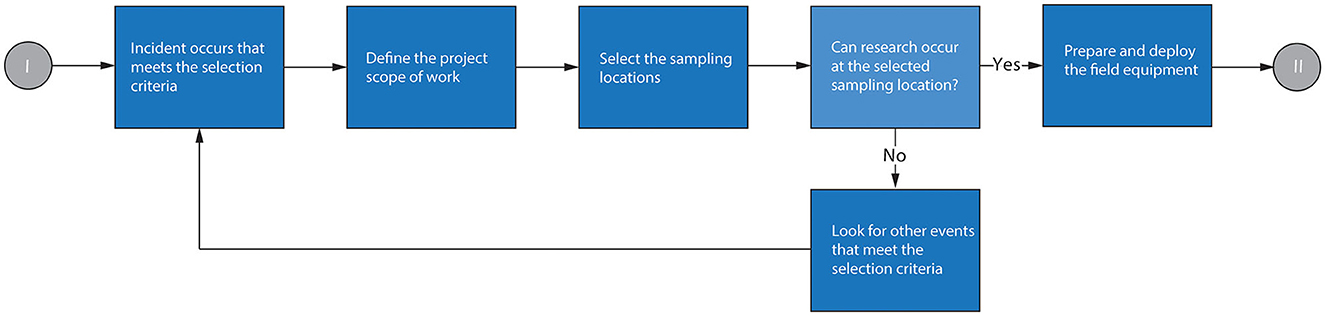
Figure 3. Flowchart phase 2 of rapid response research team (RRRT) protocol: field deployment.
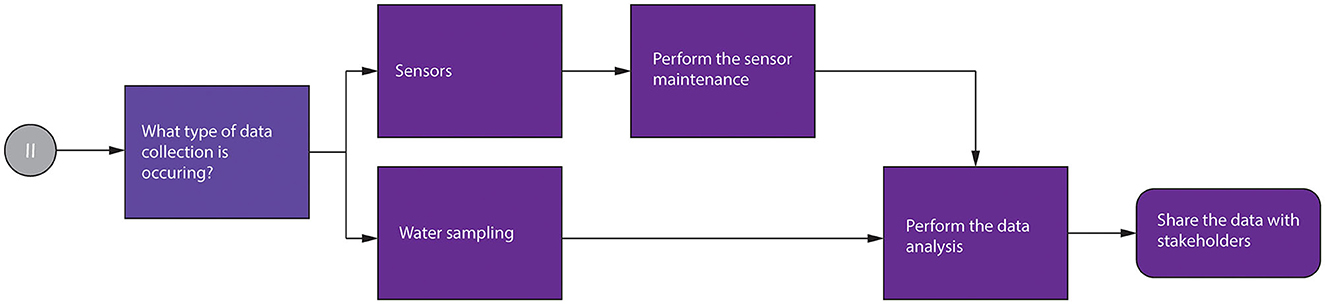
Figure 4. Flowchart phase 3 of rapid response research team (RRRT) protocol: data collection.
2.1. Stage I. Pre-incident preparedness
The pre-incident preparedness stage of RRR requires the definition of specific questions or goals delimiting the scope of the research and the characteristics of commensurate events that would trigger an RRRT response (Barroga and Matanguihan, 2022), i.e., action criteria. While these definitions are initially constrained by the availability of funding for human and material resources (Figures 1, 2), such economic resources may decrease or increase during the rapid response and, thus, the scope of the research and the types of events monitored may need to be adjusted accordingly (Lentile et al., 2007).
Next, it is key to understand that when a disaster incident occurs, the response network outside of the RRRT is complex and involves local agencies (e.g., firefighters, police), civil organizations (e.g., environmental non-governmental organizations or NGOs), and extra-local federal management teams (e.g., the US Federal Emergency Management Agency FEMA) that are focused on saving lives and properties, instead of doing research (Nowell et al., 2017). Therefore, RRRT should study previous responses to similar incidents to anticipate external priorities, timelines, and opportunities to find common interests.
Pre-incident interactions with other teams of the response network are crucial as they allow for clearer communication of ideas and coordination of plans at times of lower stress. To increase efficiency, the RRRT should prepare an executive summary describing the research scope, goals, and resources available to discuss opportunities for RRR with the highest levels of organizations expected to be part of the response network. The main goals of these pre-incident interactions are to engage with collaborators outside the RRRT to define the benefits of the work done by the RRRT for the public, establish points of contact (POC) for when an incident occurs, and determine the requirements for site access and setup of sensors, necessary training, and personal protective equipment (PPE) that may be required to perform the research safely. Communicating far ahead of an incident increases the likelihood of success and helps establish a continued collaboration between incident managers and the RRRT (Lentile et al., 2007).
Finally, in the pre-incident phase, RRRTs must acquire permitting and authorizations to complete their work while ensuring that the team does not delay vital emergency responses from other teams. The type of research tasks conducted (e.g., deployment of sensors or grab sampling), as well as the characteristics of the study area and the type of incident, will dictate permits and the level of training needed.
2.2. Stage II. Field deployment
This phase helps define the scope of the work once an incident meets the action criteria and guides the RRRT in preparing and deploying water quality sensors (Figures 1, 3).
2.2.1. Defining the scope of the work
The availability of funding, personnel, and equipment for sampling and analyses constrain the scope of the work that can be attained with a RRRT. After defining personnel availability and satisfactorily completing required training, RRRTs need to create an inventory of field gear, vehicles, in-situ, and laboratory equipment available. Also, it is important to clearly understand the analyses that can be outsourced to a third party or collaborator, accounting for the costs and associated logistics of sample collection, preservation, and timely delivery. The preparation of logistics for RRR should include explicit considerations about travel times to and from the site, the time required to complete fieldwork, and time for data analysis and communication of significant results to collaborators from the response network. These considerations are particularly important for RRRTs with less than five people available, as the upfront work required to get the project started can become taxing and impact the safety of the team and the quality of the information acquired.
To define the scope of the work and leverage historical and continuous information, RRRTs must actively search, find, and monitor contextual information of general interest, such as hydrologic and meteorologic conditions. Table 2 lists publicly available resources to monitor conditions relevant to water disturbance research in the United States. Similar resources may be available in other countries and should be readily available to RRRT personnel.
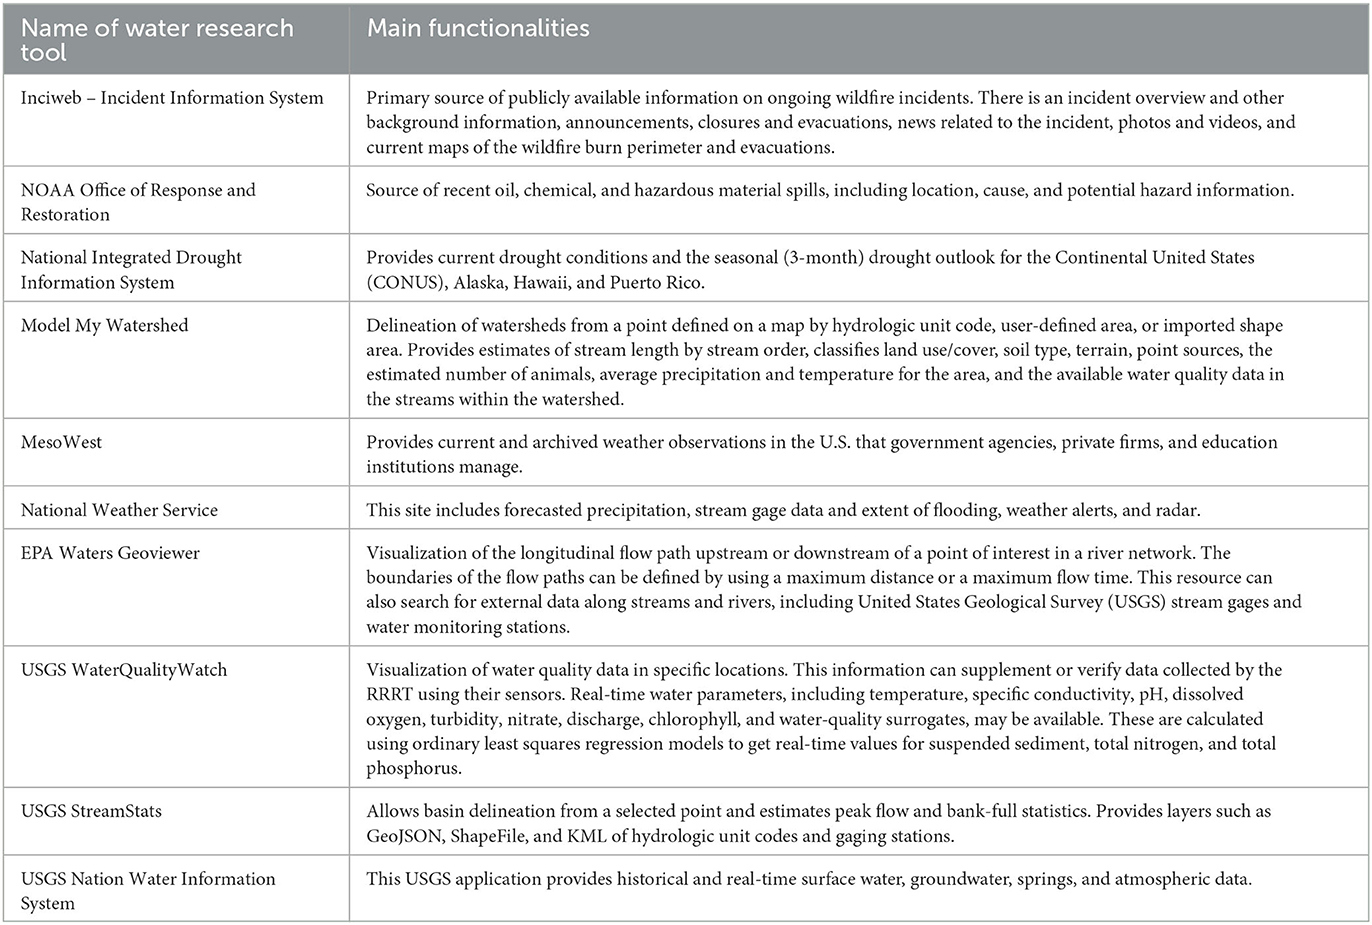
Table 2. Example of publicly available resources in the United States for remotely characterizing incidents and locations of interest in rapid response research.
2.2.2. Selection of monitoring sites and communication with points of contact
When selecting monitoring sites, it is crucial to balance scientific needs with physical site constraints, communication constraints, public engagement goals, partnership potential, and safety concerns (Jones et al., 2017). Sampling locations should be easily and safely serviceable and always accessible but also protected from vandalism. RRRT should prioritize co-locating new equipment with existing instrumentation, such as streamflow gaging stations, meteorologic stations, and water quality sensors, to better contextualize data and augment ongoing, longer-term monitoring efforts. Site selection is an iterative process that must consider the available equipment and the number of personnel needed for operation and maintenance. Due to the dynamic and uncertain expansion of some disturbances (e.g., wildfires), it is also important to define alternative monitoring sites in case some areas become inaccessible or inoperable.
Once potential monitoring sites are chosen, RRRTs must reach out to relevant points of contact (POC) to get approval to access restricted or private areas and to inform them about the location of monitoring sites outside the incident's perimeter. POC typically want to know what sensors will be deployed, the deployment timeline, what water quality parameters will be monitored, and how frequently the sensing equipment is maintained, or the data downloaded. This information allows POC forming part of the incident response network to leverage resources across teams and give private landowner POC the understanding to stay motivated to support the efforts of a RRRT.
2.2.3. Field deployment of equipment and grab sampling
After gaining approval for site access inside and outside the perimeter of the incident, the RRRT can prepare for field deployment of sensors. The materials needed can be divided into sensor equipment and power source, and tools and parts needed for site installation and protection.
The sensor equipment and power tools typically used by RRRT focused on aquatic ecosystems include water quality sensors, dataloggers, telemetry transmission devices, field computers to control sensors and download data, autosamplers, and power sources. If water quality sensors are being deployed for durations longer than a few days, then it is recommended that the RRRT install sensors that incorporate anti-biofouling devices such as a wiper or an air pump. RRRT must carefully consider whether sensors will be powered by external sources, such as rechargeable batteries and solar panels, or if they will be internally powered with replaceable batteries. Instructions to estimate rechargeable battery configurations and solar panel calculations can be found in Jones et al. (2017). When sensors are internally powered, RRRT must follow user manual guidelines and the readouts from the sensors to estimate battery replacement needs (Wagner et al., 2006; Jones et al., 2017). Before sensor deployment, sensors must be calibrated using at least two known standards covering the range of expected environmental conditions (Wagner et al., 2006), and the telemetry-based data transmission and reception must be tested. Also, due to gradual deterioration or sudden damage to sensors, it is recommended that the RRRT secures additional sensors and modular components, when available, to minimize sensor downtime if repairs are needed. If there are not additional parts available, RRRTs need to increase equipment protection strategies, such as the use of engineered barriers (i.e., metal cages), and the frequency of site visits to maintain monitoring sites and quickly correct any deterioration of equipment.
The tools and parts needed for site installation and protection include rebar, angle iron, cables, clamps, steel sensor casings, power drills (hammer and regular), three-piece stainless steel expansion bolts, and padlocks. For example, when flooding and significant debris flows are expected, drilling into cliff faces or boulders to attach a steel cage to securely house sensors is often necessary. It is also important to consider possible sensor damage due to wildlife or vandalism by securing sensors in casings with locking mechanisms. Lastly, the RRRT should also consider the flow regime of a potential monitoring site and place the sensor in a spot that will not become buried with sediment over time and at a depth in which it will not be above the water column during low flows.
When grab sampling is used to compare in-situ sensor readings with laboratory equipment or to augment the number of species monitored (e.g., metals, isotopes), the materials needed are determined by the specific solutes of interest. Grab sampling methods include isokinetic, depth-integrating, and non-isokinetic (dip, discrete, and pump) sampling (U. S. Geological Survey, 2006). The selection of such methods depends on the physical site characteristics and conditions, the equipment available and preservation needed for specific analyses, and the safety of the field personnel (U. S. Geological Survey, 2006). To help reduce costs associated with the purchase and maintenance of semi-continuous sondes and long-term grab sampling, technologies like The Integrator (González-Pinzón et al., 2019) and lower cost sensors could be used to generate comparable data at more affordable costs. Table 3 presents key references to methods used in grab sampling and standard analyses.
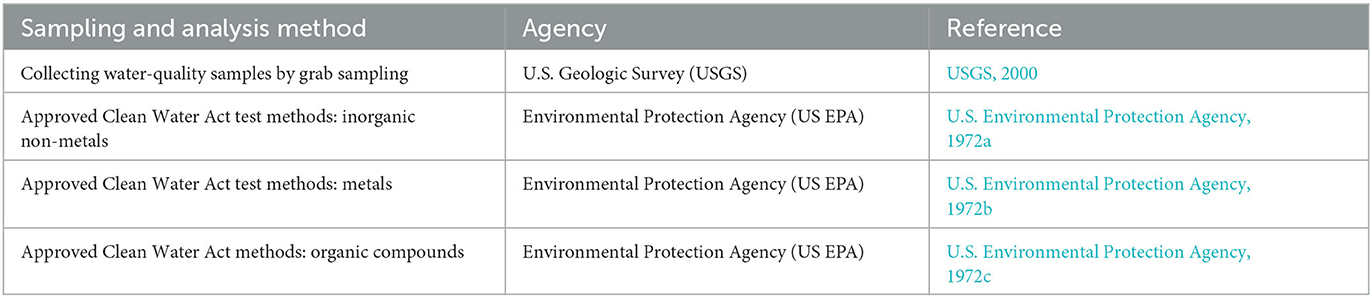
Table 3. References for key water sampling and analysis methods.
2.2.4. Personnel protection, safety, and final checks
RRRT must guarantee easy access to personal protective equipment (PPE) including life jackets, radios, and first aid kits. The protection offered to RRRT personnel includes careful training on rope access, fall hazard, drowning mitigation, etc., as well as careful consideration of travel times, weather forecasts, field activities, proper rest before and after extended fieldwork, and housing accommodations in case of multi-day events. In work involving the release of hazardous chemicals, RRRTs must prevent acute and chronic exposures that may cause human health impacts. Additional concerns related to disturbances from natural disasters include persistent risk of flooding and impacts to infrastructure that may make access to monitoring sites unsafe. RRRT should choose vehicles that can transport all field equipment and personnel and access the most remote field sites, and those vehicles should go through a proper inspection before field use. Contingencies must be made for unplanned situations that can increase the work's complexity and may lead to an increase in the time needed for travel and fieldwork. Examples include rapidly changing weather conditions or rapid changes in the incident that would delay or modify the locations of installations due to issues regarding access to a site or safety concerns.
The final step before deployment is to finalize and run safety checks. RRRT must confirm that all personnel know how to complete the research goals and respond to emergencies including flooding, shifts in fire conditions, lightning, etc. The RRRT leadership sub-team must confirm that all participating researchers have completed the necessary field training and need to oversee the completion of the objectives for each sampling site per the field deployment and sampling protocol.
2.3. Stage III. Data collection
After deploying water quality sensors, the final stage of RRR involves continued sensor maintenance, collection of water quality samples, and performing data quality control and analysis. The frequency of sensor maintenance varies as a function of the hydrologic and environmental conditions where the sensors are deployed. Previously developed general protocols for the operation and maintenance of a continuous water quality monitoring network are available (Wagner et al., 2006; Jones et al., 2017). Briefly, sensor maintenance includes conducting a site inspection, removing the sensor from the monitoring location, cleaning sensors, checking calibration, checking power supply, and returning the instrument to the monitoring location (Figures 1, 4). If routine lab calibration is needed for the sensor, it is recommended to have additional sensors to rotate between lab calibration and field deployment to limit downtimes and missing data.
During maintenance trips, it is also recommended to download the data stored on the data logger from each deployed water quality sensor. If telemetry is unavailable, data download becomes the main delay between data collection and analysis, creating lags equal to or longer than the period between site visits. When telemetry is available, data can be viewed and processed without delays, decreasing the need for frequent site visits. However, sonde maintenance and calibration trips must be regularly scheduled to generate high-quality data (Wagner et al., 2006).
The benefits of acquiring data through RRR extend beyond the scientific community. For example, if telemetry is available, RRR can provide near real-time data to direct the work of stakeholders seeking to mitigate or restore environmental conditions. Also, RRR can generate data used by drinking water, irrigation, and wastewater managers to reduce the impact of aquatic disturbances to infrastructure, humans, crops, and animals (Lentile et al., 2007). It is essential to share preliminary data with those in the extended response network, clarifying that data have not been fully processed and will later be used in scientific products. RRRTs need to understand that the relationships built between researchers, collaborators, and stakeholders are invaluable for completing RRR in the ongoing event and future ones. Promptly providing the data to the collaborators can illustrate the immediate and practical value of RRR and increase the likelihood of future collaborations (Lentile et al., 2007). RRR is typically financed through public funding and, by definition, the data belong to tax-payer communities; therefore, timely sharing of data with others affected by a disaster is not only ethical but can improve the safety and health of those affected by anthropogenic and natural disasters when most needed.
3. Results: monitoring of the Hermit's Peak-Calf Canyon fire
In this section, we describe the application of the RRRT protocol presented above to the monitoring of the Hermit's Peak-Calf Canyon (HPCC) wildfire, to date, the largest and most destructive wildfire recorded in New Mexico's history.
The HPCC wildfire began on April 6, 2022, after the Las Dispensas prescribed burn on the Santa Fe National Forest crossed the project boundary and became out of control due to high winds in the region. The Calf Canyon Fire was declared a wildfire on April 19, 2022, after a pile burn holdover from a prescribed burn in January 2022 that had remained dormant through three winter snow events reemerged. The Hermit's Peak and Calf Canyon wildfires continued to be separate fires until they merged on April 23, 2022 (United States et al., 2000), and burned 1,382 km2 through August 21, 2022.
The HPCC wildfire grew quickly due to fire-favorable weather conditions. During the first week, the wildfire was held below 33 km2 and was almost fully contained. However, strong winds caused the wildfires to merge and quickly spread past the previous containment, and a month after the fire began, it was over 600 km2 and only 20% contained. The fire grew to over 1,200 km2 at the two-month mark and was finally 70% contained around June 15th. With the arrival of the seasonal monsoon weather, the fire slowed, and containment increased. The fire was fully contained on August 21st, almost 5 months after the wildfire started (New Mexico Forest and Watershed Restoration Institute, 2022).
3.1. Stage I. Pre-incident preparedness
Our RRRT was created in late 2021 through funding from the US National Science Foundation and the New Mexico Water Resources Research Institute. The scope of our work was driven by the research question How far downstream do wildfire disturbances propagate in fluvial networks? In prior years, the members of our team had gained relevant field experience monitoring water quality dynamics with sensors and tracking those changes along fluvial networks (Dahm et al., 2015; Reale et al., 2015; Mortensen et al., 2016; Bicknell et al., 2020; Gootman et al., 2020; Regier et al., 2020; Nichols et al., 2022). This expertise, and the demand for a better understanding of wildfire impacts to water quality in the drought-stricken American Southwest, motivated us to apply our expertise to do RRR focused on wildfire disturbances. While most of the activities we completed in the pre-incident preparedness phase resulted in the creation of the sections above, in this section, we provide specific details about our response to the HPCC wildfire.
The investment of research funding toward readiness allowed us to establish relationships with relevant teams in areas where wildfires were likely due to prolonged drought conditions, as reported by the National Integrated Drought Information System (Table 1). The highest-level contact we established before the HPCC wildfire was with the Southwest Coordinating Group (SWCG), whose mission is to enhance interagency fire management activities' safety, efficiency, and effectiveness. The SWCG comprises federal and state land management agencies coordinating and supporting fire response and incident activities in New Mexico, Arizona, and west parts of Texas and Oklahoma (Southwest Coordinating Group, 2022). Initial emails were followed by video conference calls to discuss our research motivation and the sensor deployment details. The SWCG encouraged us to contact other institutions and key personnel, including teams from the University of Arizona with long experience performing wildfire research, individual forest managers who knew the local requirements for conducting wildfire-related research, and Burned Area Emergency Response (BAER) teams, which prescribe and implement emergency treatments on federal lands to protect life and property and prevent the degradation of natural resources (U.S. Forest Service, 2022).
A key benefit of holding early conversations in the pre-incident phase was an increased understanding of the logistics, and PPE needed to perform research on wildfire disturbances. For example, to do wildfire research inside burned perimeters, RRRTs need to obtain an incident qualification card, commonly referred to as the red card. This qualification requires specific training, experience, and physical fitness standards to work in wildland fire areas (National Park Service, 2018). However, obtaining certifications may be unnecessary if the research is focused on monitoring outside of the burned area. Regarding PPE, we learned that to access restricted areas, individuals would require flame-resistant clothing, proper footwear, hard hats, leather gloves, safety glasses, and fire shelters (Minnesota DNR, 2022).
Given the uncertainties associated with the timing and locations before the HPCC occurred, our efforts to search and apply for permits for sensor deployment on federal or state land during the pre-incident preparedness phase were difficult to constrain. However, our RRRT contacted the New Mexico State Lands Department and filed a natural resources authorization, understanding that it would be updated when the site locations were known. We also discussed permitting with individual forest watershed managers in Arizona and New Mexico. We learned that acquiring permits for sensor deployment requires a description of the water quality sensor setup, an estimated timeline of the deployment, and a report of any environmental disturbance that could occur from sensor installation. We also learned that private owners are key actors in gaining site access; thus, identifying how the data gathered by RRR can benefit private interests is essential.
3.2. Stage II. Field deployment
The HPCC wildfire primarily impacted four perennial streams, i.e., Gallinas Creek, Sapello River, Mora River, and the headwaters of the Pecos River (Figure 5). When the fire unfolded, we focused our RRR on Gallinas Creek, the water source for 13,000 people in the City of Las Vegas, New Mexico (City of Las Vegas Utility Service Department, 2020). Gallinas Creek drains a watershed with primarily shrub-scrub vegetation and evergreen forests (Stroud Water Research Center, 2017), and eventually flows into the Pecos River and Santa Rosa Lake, a flood and sediment control reservoir built and managed by the US Army Corps of Engineers. Gallinas Creek had US Geological Survey (USGS) stream gage data available in two locations before the fire, one upstream of the intake for the water treatment facility and one downstream of the city. In response to the HPCC wildfire, the US Army Corps of Engineers instrumented Gallinas Creek with protecting infrastructure to control erosion, and the USGS added new sensor sites to track water quality parameters and stage levels.
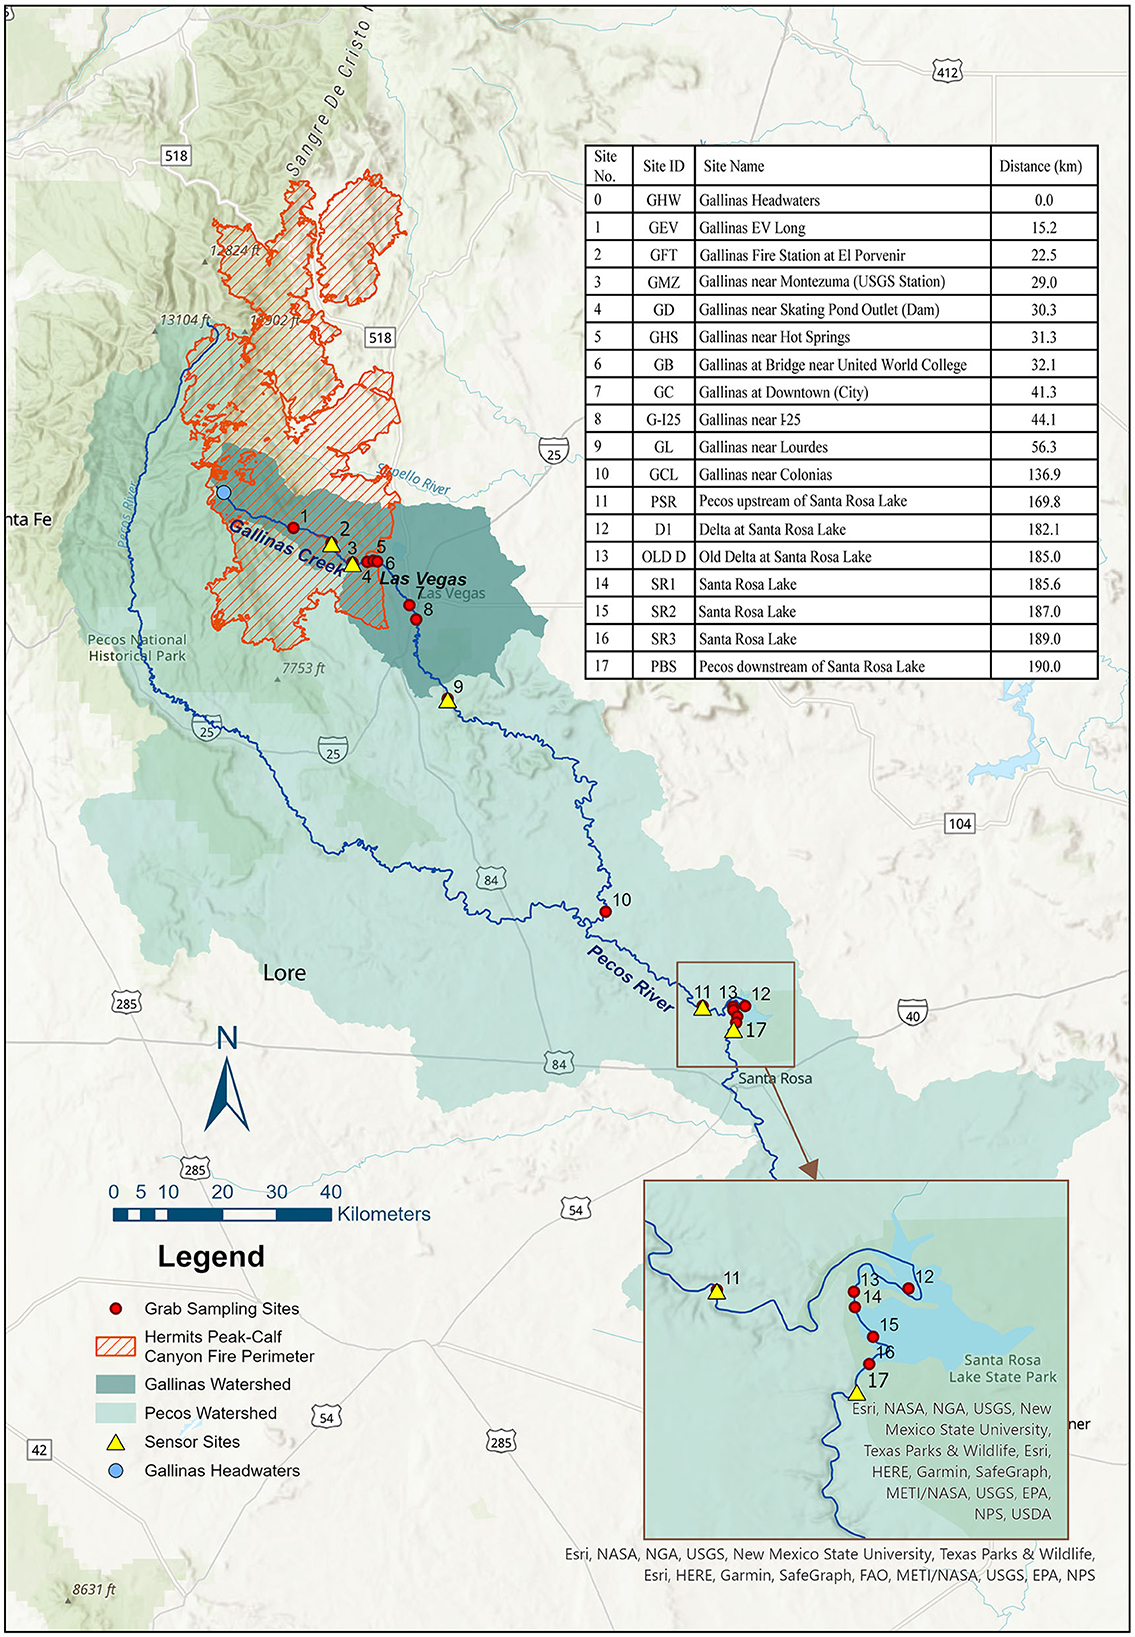
Figure 5. Locations for EXO 2 sondes and synoptic grab sampling sites along the Gallinas Creek-Pecos River-Santa Rosa Lake fluvial network. Distances are calculated from the headwaters of Gallinas Creek (0 Km).
After identifying the Gallinas Creek—Pecos River—Santa Rosa Lake as our fluvial network of interest, our RRRT routinely checked Inciweb to gather up-to-date information on the HPCC wildfire and established communication with personnel from the US Forest Service, the State Lands Department, the Soil and Watershed Program Manager, and the BAER Coordinator soon after the wildfire began. From these conversations, we started contact with the New Mexico Forest and Watershed Restoration Institute, which led to a collaboration with our RRRT, the Hermit's Peak Watershed Alliance, and New Mexico Highlands University in Las Vegas. This local collaboration was invaluable for accessing optimal sites for sensor deployment along Gallinas Creek, including access to private and city property for sensor deployment and maintenance.
Before key roads were closed, we used data from multiple open-source databases in Table 2 to guide our field reconnaissance trips. The primary source of preliminary site information was Inciweb due to the frequency with which it was updated with site conditions, area evacuations, and current fire behavior. Frequently checking those resources allowed planning our field visits while staying appraised of existing and potential safety issues. In our response, we used Google Earth Pro (Google Earth Pro, 2022) to generate map files and import EPA WATERS data (U.S. Environmental Protection Agency, 2022). The WATERS Feature Layers had surface water features, EPA Linked Data, and information on USGS stream gages. The locations of available stream gages were valuable to co-locate our water quality sensors. We determined the possible disturbance propagation flow paths using the Upstream/Downstream Search Service on EPA WATERS, which had a similar function to the WATERS GeoViewer and allows for visualization of propagation paths for a hypothetical drop of water falling on a watershed. We also used MesoWest to obtain current weather information for the area of interest. We combined gage and weather station locations into a preliminary map with existing infrastructure using ArcMap. After collecting all publicly available online data on road and site access, land ownership, infrastructure, and water control structures, our RRRT deployed to the field to assess possible sensor locations.
We next contacted the City of Las Vegas to discuss placing water quality sensors along Gallinas Creek in areas the city owns. This was strategic because it would allow the city to augment their monitoring of water quality changes upstream of the water treatment plant intake and allow us to co-locate our sensors next to the USGS Gallinas near Montezuma gage (site number 08380500). For redundancy, given the importance of monitoring water quality upstream of the water intake, we also installed a monitoring station ~6.5 km upstream of the USGS Gallinas near Montezuma on city property. Downstream from the City of Las Vegas, we installed a third monitoring station next to the USGS Gallinas at Lourdes (site number 08382000). These three monitoring stations and two other stations installed previously by the University of New Mexico (UNM) in collaboration with the US Army Corps of Engineers (USACE) in the Pecos River, upstream and downstream of Santa Rosa Lake, created a water quality monitoring network to monitor the longitudinal propagation of wildfire disturbances along ~190 km of the Gallinas Creek—Pecos River—Santa Rosa Lake fluvial network, within a month from the start of the HPCC wildfire (Figure 6). Our RRRT installed the three new monitoring sites on April 18 and 25, 2022, i.e., 3 weeks after the HPCC wildfire began, while the UNM-USACE sites were deployed in late 2020.
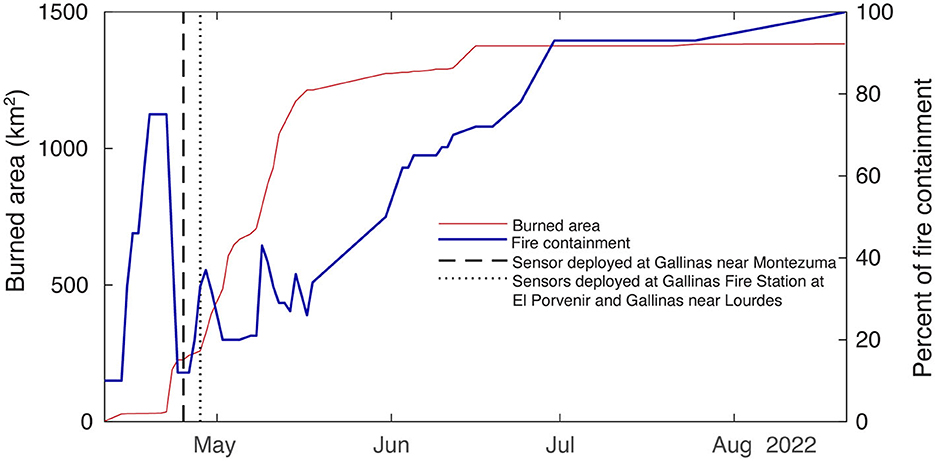
Figure 6. Timeline of sensor deployment and the cumulative burned area of the Hermit's Peak–Calf Canyon fire. The vertical lines show the first images for each location, and the first image shows the installation.
Our RRRT monitoring sites were instrumented with YSI EXO2 sondes housed in steel casings attached to boulders (Figures 5, 7). All new EXO2 sonde installations measured water temperature (°C), specific conductivity (μS/cm), dissolved oxygen (ppm), turbidity (Formazin Nephelometric Unit, FNU), fluorescent dissolved organic matter (also commonly known as fDOM) (relative fluorescence units, RFU), and pH at 15-min intervals. The sondes were sampling at 15-min, generating approximately 980,000 water quality measurements during our study. We placed the sondes in straight reaches without tributaries, anthropogenic point sources, or diversions immediately upstream, and 12 cm to 25 cm above the stream bed to ensure their submergence during low flows. The monitoring sites operated by the UNM-USACE measured the same parameters, except fDOM. The sondes deployed in the Gallinas and Montezuma sites also measured chlorophyll-a (ppb). All sensors were calibrated following instructions from the manufacturer before deployment and were serviced every two-to-three weeks.
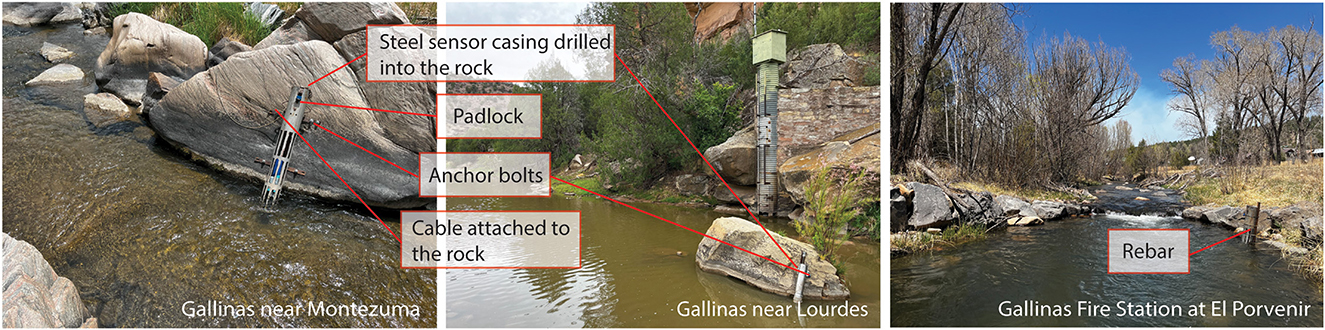
Figure 7. Example of site installation to monitor the propagation of aquatic disturbances from the Hermit's Peak-Calf Canyon wildfire.
3.3. Stage III. Data collection
We downloaded sensor data every two-to-three weeks during routine sensor maintenance. Data collected from the sensors were processed for quality assurance and quality control using Aquarius Timeseries 21.1 (Aquarius Timeseries 21.1, 2023). Erroneous outliers were eliminated using a moving average filter targeting points deviating more than 20% from a two-hour moving window. We corrected sensor drift and biofouling by comparing pre-and post-cleaning and calibration values, and applied a linear correction from the date of the previous maintenance (Wagner et al., 2006). Periods when the data or field notes indicated that the sensor was buried or out of the water column (e.g., when specific conductivity values suddenly drop to zero) were removed from the data. Lastly, a final visual inspection of the data was performed to validate their quality, e.g., sudden changes in a given water quality parameter in isolation from changes in flow conditions and changes in other parameters were flagged as outliers (Wagner et al., 2006; Jones et al., 2017).
We defined periods with distinct flow conditions to organize and analyze our data. The pre-monsoon period spans from the beginning of our monitoring through June 27th, 2022, and is characterized by low precipitation and high winds in New Mexico. The monsoon period features significant precipitation increases and spans between June 27th, 2022, and September 12th, 2022. The post-monsoon has intermediate precipitation levels and spans from September 12th, 2022, through mid-December. Our data show that at monitoring sites upstream of Santa Rosa Lake (Figure 5) (i.e., GFT, GMZ, GL, and PSR), there was an increase in discharge, stage, fDOM, and turbidity during the monsoon period compared to the pre-monsoon period (Figure 8). Also, specific conductivity decreased at those sites during the monsoon period. During the post-monsoon period, there was a decrease in discharge, fDOM, and turbidity from monsoon values, but they remained higher than what was observed during the pre-monsoon period. Unlike sites upstream of Santa Rosa Lake, the PBS monitoring site did not experience an increase in discharge, stage, or turbidity during the monsoon and post-monsoon periods, while specific conductivity remained stable across the three periods. Due to fDOM and turbidity being common surrogates of dissolved organic matter and total suspended solids (TSS) (Saraceno et al., 2009), our preliminary results indicate an increase in dissolved organic carbon (DOC) and TSS fluxes during the monsoon period at all monitoring sites upstream of Santa Rosa Lake, while these changes to water quality were not observed at the monitoring site downstream of the lake.
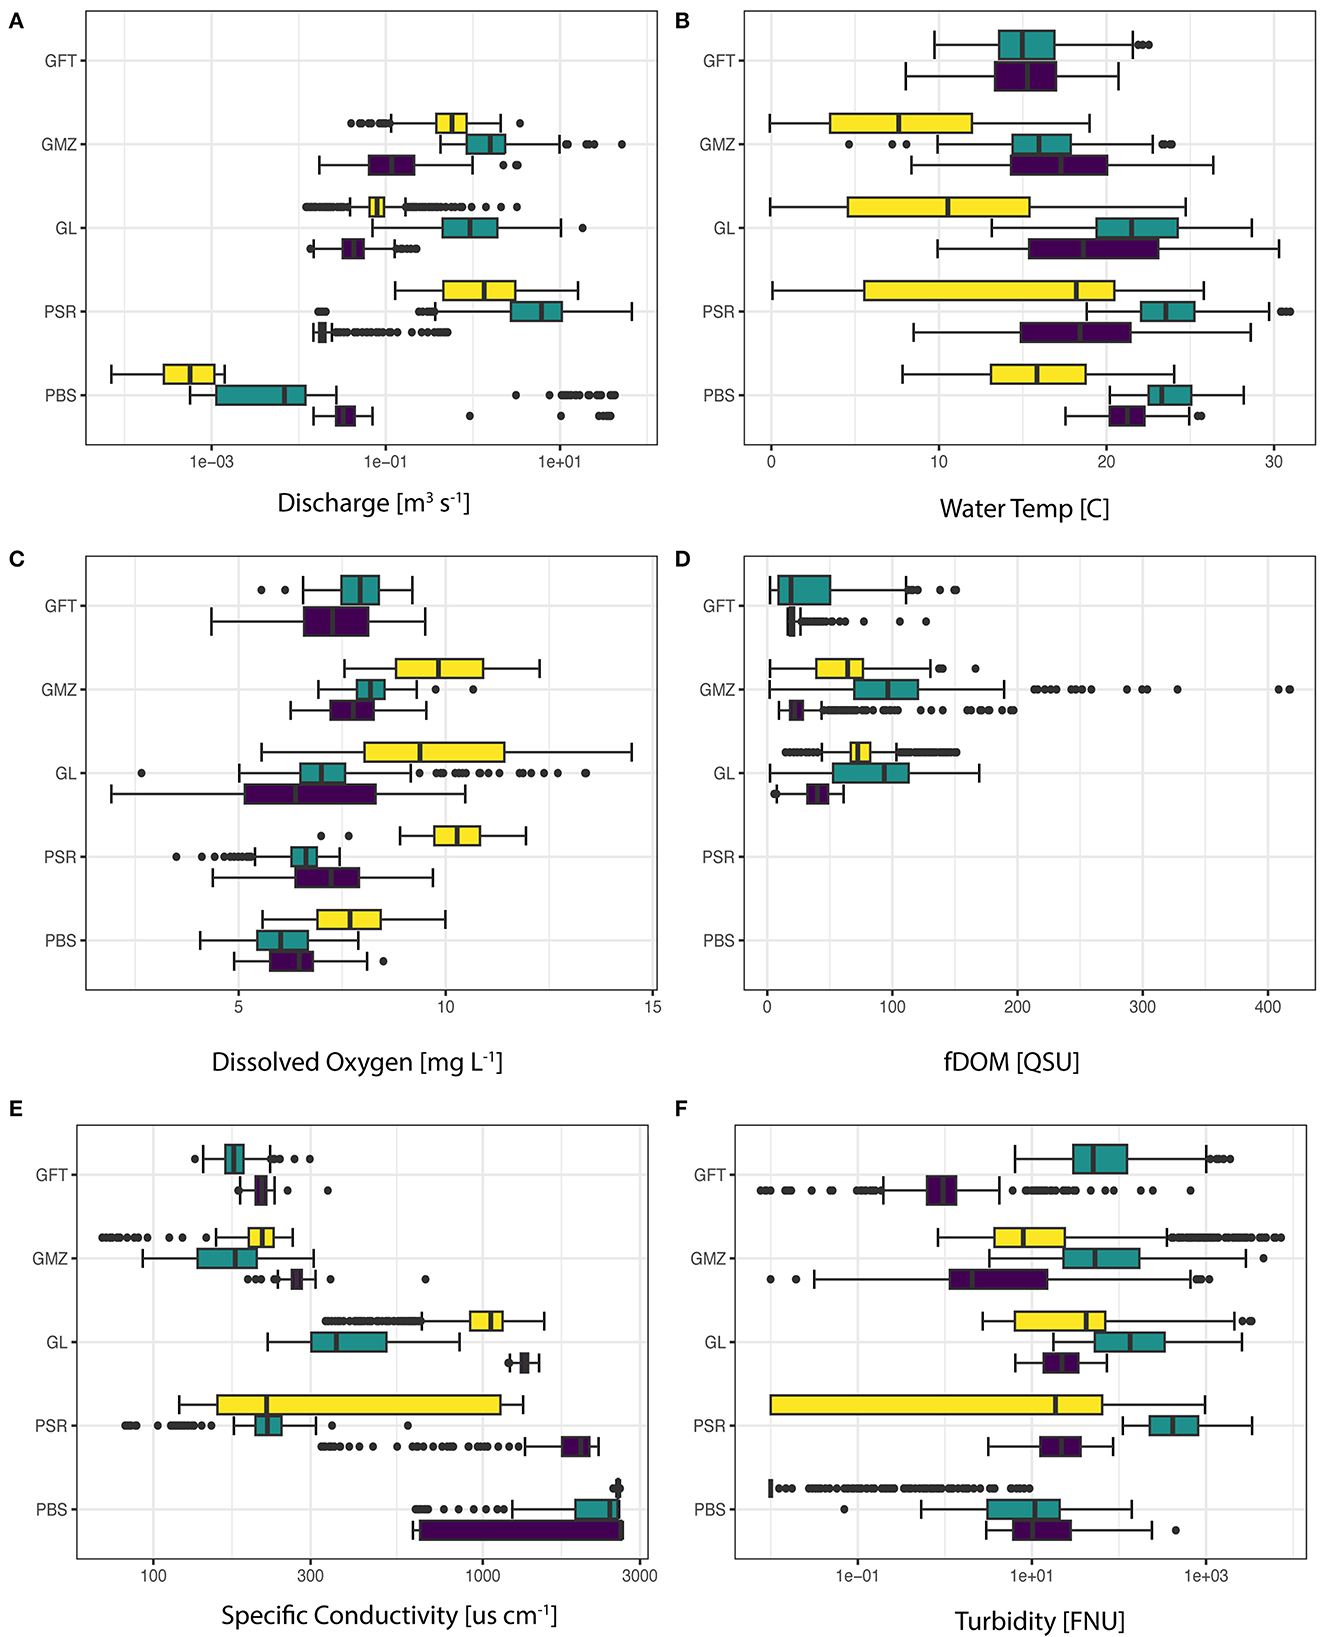
Figure 8. Boxplot of 15-min YSI EXO 2 data from the five monitoring sites. Data coverage spans from April to December 2022. (A) Discharge recorded at collocated USGS stream gages and was not measured at GFT. EXO sensor data including, (B) water temperature, (C) dissolved oxygen, (D) fluorescence dissolved organic matter (not measured at PSR and PBS), (E) specific conductivity, and (F) turbidity.
We collected synoptic grab samples from 16 sites along the Gallinas Creek—Pecos River—Santa Rosa Lake fluvial network, primarily during trips for performing sensor maintenance, but also after some of the initial storms post-fire (Figure 5). Synoptic grab sampling started on April 26, 2022, and is ongoing. There has been a total of 262 grab samples collected and analyzed before the publication of this work, i.e., 47, 143, and 72 during pre-monsoon, monsoon, and post-monsoon periods. Grab samples were filtered at the sites using nylon filters of 0.45 μm pore size to remove particulate matter and attached microorganisms and stored in 20 mL plastic bottles. Samples were stored in a field cooler and freeze at −18°C upon return to the laboratory. Grab samples were thawed before analysis for nitrate (), nitrite (), total oxidized nitrogen (TON), ammonium (), sulfate (), and phosphate () concentrations using a Thermo Fisher Scientific Gallery Discrete Analyzer (Figure 9). Grab samples are also being analyzed for selected metal species, including Pb, Al, Cr, Mn, Zn, Se, Sr, Ca, and Mg using inductively coupled plasma optical emission spectroscopy (ICP-OES). Before metal analyses, grab samples were acidified with trace metal grade nitric acid (1%) for dissolution and stabilization of the analytes of interest in the samples. The data from metal concentrations and a deep analysis of the sensor and nutrient data, including extensive statistical analysis, will be the focus of future publications.
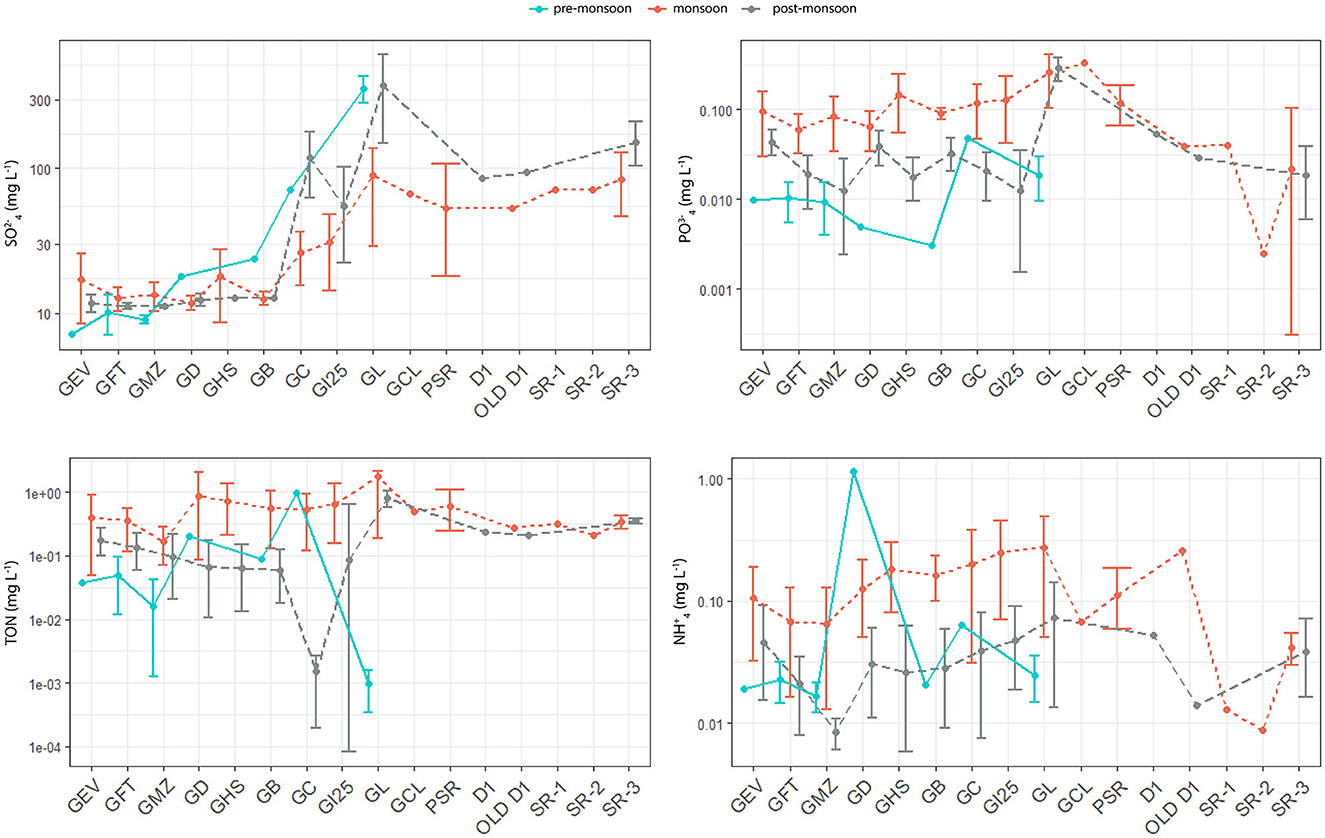
Figure 9. Synoptic sampling data describing the concentrations of sulfate (), phosphate (), total oxidized nitrogen (TON), and ammonium () from Gallinas Creek to Santa Rosa Lake.
The results from our synoptic grab sampling showed patterns (Figure 9). At most sites, ammonium, TON, and phosphate were lower during pre-monsoon season, higher during the monsoon season, and at intermediate levels during the post-monsoon season. The elevated concentrations of these nutrients during the monsoon are likely due to the propagation of nutrient-rich, wildfire disturbances from the burned area. At Gallinas near the Skating Pond outlet site (GD), the concentration of ammonium in the pre-monsoon period was the highest of all values recorded. This may be due to reduced turbulence and mixing near the dam, which decreased the volatilization of ammonia and may have caused accumulation. The concentration of TON was generally higher during the monsoon period, except at Gallinas Creek near the City of Las Vegas (GC), where higher concentrations were observed before the monsoon. This could be due to various anthropogenic sources of contamination, such as seepage from fertilized agricultural lands, municipal wastes, dumps, septic tanks, private sewage disposal systems, etc. Sulfate concentrations followed a similar trend as other nutrients in the sites close to the burned perimeter (GEV, GFT, and GMZ). However, this trend shifted further downstream, where sulfate concentrations were higher during the pre-monsoon period, likely due to anthropogenic sources of contamination, which were later diluted with higher flows during the monsoon and post-monsoon periods.
4. Discussion
Natural and anthropogenic aquatic disturbances are ubiquitous and frequent (Table 1). Given the uncertainties associated with where and when they will occur, researchers and stakeholders are typically unprepared to start monitoring them soon after their onset (Cutter and Ji, 1997; Dennison et al., 2014). We have developed a protocol to help prepare rapid response research teams (RRRTs) to move beyond this status quo. Using this protocol, RRRTs can prepare to collect vital information on short- to long-term effects of aquatic disturbances to objectively inform mitigation and restoration efforts. Even though our case study focuses on the monitoring of a wildfire disturbance, the same protocol can be used to monitor any other aquatic disturbance, as it has been written with descriptions that can be easily tailored to address individual research questions and goals. Our protocol was informed by the work of the University of Idaho and the U.S. Forest Service, which compiled the difficulties and recommendations from researchers who researched wildland fires (Lentile et al., 2007). While the manuscript by Lentile et al. guided the initial stages of our work, we built on their work to develop a protocol for RRR on aquatic disturbances in fluvial networks.
Previously, the propagation of post-fire water quality disturbances has been largely captured by sensors already deployed for other research projects (Dahm et al., 2015; Sherson et al., 2015). In response to this gap, we developed a protocol describing a simple, standardized, and flexible approach to monitoring highly dynamic and unpredictable events. This protocol was successfully validated in the study of the propagation of wildfire disturbances that resulted from the HPCC wildfire, the largest fire ever recorded in New Mexico. Using this protocol, our RRRT was able to start collecting data within 2 weeks after the wildfire began and 2 months before the first precipitation-runoff event from the monsoon season began mobilizing materials from burned areas into fluvial networks. Although discussing the intricacies of the datasets collected is not the focus of this paper, we presented some key results from our unique dataset, hoping to inspire the next generation of RRRT efforts.
We cannot overemphasize the importance of early communication with organizations involved in incident response before the start of the fire season. The most significant investment of our time came from meetings with the groups and individuals engaged in wildfire response and later impacted by the HPCC wildfire. We met with the U.S. Forest Service before the fire season and connected with the New Mexico Forest and Watershed Restoration Institute, the Hermit's Peak Watershed Alliance, New Mexico Highlands University, and the City of Las Vegas after the fire started. The local connections allowed us access to ideal monitoring locations, including private land, to deploy our sensors. Although communication with federal agencies was initially crucial for planning our research and contacting other organizations, our sensors were mainly deployed in collaboration with local and private groups. Deploying our sensors on private land likely decreased the time needed for deployment compared to if it were to occur on federal lands due to not needing additional permitting and equipment.
A second crucial lesson was that monitoring the longitudinal propagation of aquatic disturbances becomes simpler in proportion to the distance away (i.e., downstream) from the source of the disturbance and over time. For example, while accessing the burned perimeter required red card training and the use of highly specialized and expensive PPE, outside of the burned perimeter our hydrologic monitoring was largely “business as usual”, with the caveat of facing higher than normal discharges post-fire and having to protect and maintain sensors more actively. While this may not be true for all incidents, especially those involving highly hazardous chemicals, we want to convey this point because even if RRRT were not officially formed or fully trained, hydrologists could still monitor incidents from a safe distance away from the source with basic preparation. For example, we have been monitoring the HPCC since 2 weeks after it began and for a year now, and believe that the information collected 2 months after its onset (i.e., about when the rainy season began), 30–190 km away from the burned area is extremely valuable and much more informative than collecting no data due to the lack of RRRT readiness.
Our experience on the HPCC wildfire demonstrated that even when dealing with seemingly controlled situations, e.g., when the fire seemed to be contained earlier in the response, there is still potential for incidents to evolve rapidly. For example, the two most upstream sensors we deployed in Gallinas Creek were initially outside the fire perimeter. A few weeks after, the significant increase in the wind and a shift in direction caused our sensors to be enclosed in the burn perimeter. This led to delays in accessing our sensors as well as fear of damage to equipment due to fire exposure; luckily, the water column protected them. In this context, we learned that RRRT should remain flexible, have backup equipment, and plan for multiple contingencies in these highly dynamic situations that are common near the source of disturbances.
Although performing RRR can provide invaluable data that have the potential to significantly improve our response to disturbance events to protect human and environmental health, this type of research is challenged by funding acquisition due to the unknown location and timing of the events, both of which conflict with the traditional evaluation of research projects. However, our successful experience doing RRR on the longitudinal propagation of disturbances after the largest wildfire recorded in New Mexico can help change that barrier by proving the cost-effectiveness of investing in preparedness, not only to support scientific efforts but also to support immediate decision making that is relevant to local communities. In our view, this change can continue to be fostered with the availability of RRRT protocols that can be readily used to reference proven methods while acquiring funding and help guide RRRT to “hit the ground running”. While the HPCC wildfire was the first time our RRRT protocol was tested, our extensive fieldwork experience supports the notion that it can be generally applied to monitor multiple aquatic disturbances. However, RRR will benefit from evaluating our protocol on other incidents and the corresponding improvement of its robustness based on new experiences.
5. Conclusions
The rapid response research protocol developed and validated here can help guide monitoring aquatic disturbances in fluvial networks soon after they occur. We used a framework with comprehensive and easy-to-follow flowcharts and descriptions considering three key phases: pre-incident preparedness, field deployment, and data collection. This work is the first attempt to address three key recommendations for incorporating wildfires into the spatiotemporal analysis of water impairment along fluvial networks (Ball et al., 2021), i.e.,:
1. Invest funding in preparation and readiness—the timely funding made available to our RRRT by the National Science Foundation before the historic 2022 fire season allowed us to spend time on RRR preparedness for the purposeful capture of “first–flush” and long-term fluvial network responses to wildfires.
2. Increased focus on capturing longitudinal behaviors—our protocol allowed us to capture the longitudinal propagation of wildfire disturbances over ~190 km. The data were collected by deploying multiple high-frequency sensors and using longitudinal grab sampling during sensor maintenance and large rainfall-runoff events.
3. Incorporating high–frequency data in environmental monitoring—we deployed YSI EXO sensors soon after the wildfire began to monitor multiple water quality parameters every 15 min to monitor the propagation of highly dynamic disturbances over 190 km.
Our protocol and its successful validation advance the field of wildfire science and rapid response research by proposing a standardized framework that researchers can use to respond to and gather data from disturbances to ecosystems, which can be used to advance scientific and engineering mitigation and restoration efforts to protect communities and the environment. Besides contributing advances to science and engineering, our work has contributed to broader impacts to local communities. For example, we were able to inform stakeholders about water quality dynamics before and after the disturbances from the fire reached the water intake facility of the City of Las Vegas, New Mexico. We also trained undergraduate and graduate students who live near the affected areas and supported using relevant environmental data in classes instructed in schools that were very close to being burned, i.e., where the motivation for and appreciation of scientific efforts became very clear. The proposed methodology has allowed for the planning and execution of rapid response research in the study of wildfire disturbance propagation in fluvial networks. Still, our methodology can be applied to monitor other disasters with minimal adaptations.
Data availability statement
The raw data supporting the conclusions of this article will be made available by the authors, without undue reservation.
Author contributions
PT and RG-P led the development of the manuscript. RG-P and DV secured funding and mentored students. All authors contributed to the contextualization of the study, training and development of the rapid response research team, generation of figures and tables, data collection, modeling, writing, review, and editing.
Funding
The National Science Foundation supported this research through grants CBET- 2054444 and HRD- 1914490. The U. S. Army Corps of Engineers supported part of this research through Cooperative Agreement W912HZ-14-2-0014. The New Mexico Water Resources Research Institute also funded part of this research through faculty and student grants to RG-P, PT, and AK.
Acknowledgments
We thank Lea Knutson—Founder and Executive Director of the Hermit's Peak Watershed Alliance, Conrad Greaves—Monitoring Coordinator, and GIS Analyst at the Hermit's Peak Watershed Alliance and the City of Las Vegas, NM, for providing site access for our work. We thank the wildland firefighters who saved lives and property during this devastating event.
Conflict of interest
The authors declare that the research was conducted in the absence of any commercial or financial relationships that could be construed as a potential conflict of interest.
Publisher's note
All claims expressed in this article are solely those of the authors and do not necessarily represent those of their affiliated organizations, or those of the publisher, the editors and the reviewers. Any product that may be evaluated in this article, or claim that may be made by its manufacturer, is not guaranteed or endorsed by the publisher.
Abbreviations
BAER, Burned Area Emergency Response; EPA, Environmental Protection Agency; DOC, Dissolved Organic Carbon; HPCC, Hermit's Peak – Calf Canyon; fDOM, fluorescent Dissolved Organic Matter; FNU, Formazin Nephelometric Unit; GC, Gallinas at Downtown (City); GD, Gallinas near Skating Pond Outlet (Dam); GEV, Gallinas EV Long; GFT, Gallinas Fire Station at El Porvenir; GMZ, Gallinas near Montezuma (USGS Station); GL, Gallinas near Lourdes; ICP-OES, Inductively Coupled Plasma Optical Emission Spectroscopy; PSR, Pecos upstream of Santa Rosa Lake; NGO, Non – Governmental Organization; POC, Points of Contact; PPE, Personal Protective Equipment; ppm, Parts per million; RFU, Relative Fluorescence Units; RRR, Rapid Response Research; RRRT, Rapid Response Research Team; SWCG, Southwest Coordinating Group; TON, Total Oxidized Nitrogen; TSS, Total Suspended Solids; UNM, University of New Mexico; USACE, US Army Corps of Engineers; USGS, US Geological Survey.
References
Abbott, B. W., Baranov, V., Mendoza-Lera, C., Nikolakopoulou, M., Harjung, A., Kolbe, T., et al. (2016). Using multi-tracer inference to move beyond single-catchment ecohydrology. Earth-Sci. Rev. 160, 19–42. doi: 10.1016/j.earscirev.2016.06.014
Allen, C. D., Macalady, A. K., Chenchouni, H., Bachelet, D., McDowell, N., Vennetier, M., et al. (2010). A global overview of drought and heat-induced tree mortality reveals emerging climate change risks for forests. For. Ecol. Manag. 259, 660–684. doi: 10.1016/j.foreco.2009.09.001
Aquarius Timeseries 21.1 (2023). Available online at: https://aquaticinformatics.com/products/aquarius-environmental-water-data-management (accessed July 10, 2023).
ASCE Foundation (2017). 2017 Infrastructure Report Card. Virginia: American Society of Civil Engineers. Available online at: https://www.infrastructurereportcard.org/wp-content/uploads/2016/10/2017-Infrastructure-Report-Card.pdf
Ball, G., Regier, P., González-Pinzón, R., Reale, J., and Van Horn, D. (2021). Wildfires increasingly impact western US fluvial networks. Nat. Commun. 12. doi: 10.1038/s41467-021-22747-3
Barroga, E., and Matanguihan, G. J. (2022). A practical guide to writing quantitative and qualitative research questions and hypotheses in scholarly articles. J. Korean Med. Sci. 37, 1–18. doi: 10.3346/jkms.2022.37.e121
Bicknell, K., Regier, P., Van Horn, D. J., Feeser, K. L., and González-Pinzón, R. (2020). Linking hydrobiogeochemical processes and management techniques to close nutrient loops in an arid river. Front. Water. 2, 22. doi: 10.3389/frwa.2020.00022
Bitner, M. J., Barela, L., Anderson, R., Derr, J. S., Kelly, S., McHugh, T., et al (2011). Water Protection Advisory Board Annual Report. Albuquerque/Bernalillo County Water Protection Advisory Board. Available online at: https://www.abcwua.org/wp-content/uploads/2020/11/WPAB_2011_Annual_Report.pdf (accessed July 10, 2023).
Bixby, R. J., Cooper, S. D., Gresswell, R. E., Brown, L. E., Dahm, C. N., and Dwire, K. A. (2015). Fire effects on aquatic ecosystems: an assessment of the current state of the science. Freshw. Sci. 34, 1340–1350. doi: 10.1086/684073
Brauman, K. A., Daily, G. C., Duarte, T. K., and Mooney, H. A. (2007). The nature and value of ecosystem services: an overview highlighting hydrologic services. Annu. Rev. Environ. Resour. 32, 67–98. doi: 10.1146/annurev.energy.32.031306.102758
Breshears, D. D., Cobb, N. S., Rich, P. M., Price, K. P., Allen, C. D., Balice, R. G., et al. (2005). Regional vegetation die-off in response to global-change-type drought. Proc. Natl. Acad. Sci. 102, 15144–15148. doi: 10.1073/pnas.0505734102
Cerda, A. (1998). The influence of aspect and vegetation on seasonal changes in erosion under rainfall simulation on a clay soil in Spain. Can. J. Soil Sci. 78, 321–330. doi: 10.4141/S97-060
City of Las Vegas Utility Service Department (2020). 2020 Drinking Water Quality Report: City of las Vegas' Report on the Water We Drink. Las Vegas: City of Las Vegas' Water Treatment Division.
Cutter, S. L., and Ji, M. (1997). Trends In U.S. hazardous materials transportation spills. Prof. Geogr. 49, 318–331. doi: 10.1111/0033-0124.00080
Dahm, C. N., Candelaria-Ley, R. I., Reale, C. S., Reale, J. K., and Van Horn, D. J. (2015). Extreme water quality degradation following a catastrophic forest fire. Freshw. Biol. 60, 2584–2599. doi: 10.1111/fwb.12548
Dennison, P. E., Brewer, S. C., Arnold, J. D., and Moritz, M. A. (2014). Large wildfire trends in the western United States, 1984-2011. Geophys. Prospect. 41, 2928–2933. doi: 10.1002/2014GL059576
Drummond, J. D., Larsen, L. G., González-Pinzón, R., Packman, A. I., and Harvey, J. W. (2018). Less fine particle retention in a restored vs. unrestored urban stream: balance between hyporheic exchange, resuspension, and immobilization. J. Geophys. Res. Biogeosciences 123, 1425–1439. doi: 10.1029/2017JG004212
Duval, B. D., Cadol, D., Martin, J., Frey, B., and Timmons, S. (2020). Effects of the gold king mine spill on metal cycling through river and riparian biota. Wetlands. 40, 1033–1046. doi: 10.1007/s13157-019-01258-4
González-Pinzón, R., Dorley, J., Regier, P., Fluke, J., Bicknell, K., Nichols, J., et al. (2019). Introducing “the Integrator”: a novel technique to monitor environmental flow systems. Limnol. Oceanog.: Methods. 17, 415–427. doi: 10.1002/lom3.10322
González-Pinzón, R., Dorley, J., Singley, J., Singha, K., Gooseff, M., and Covino, T. (2022). TIPT: the tracer injection planning tool. Environ. Model. Softw. 156, 105504. doi: 10.1016/j.envsoft.2022.105504
Gootman, K. S., González-Pinzón, R., Knapp, J. L. A., Garayburu-Caruso, V., and Cable, J. E. (2020). Spatiotemporal variability in transport and reactive processes across a first- to fifth-order fluvial network. Water Resour. Res. 56, 263030. doi: 10.1029/2019WR026303
Gresswell, R. E. (1999). Fire and aquatic ecosystems in forested biomes of North America. Trans. Am. Fish. Soc. 128, 193–221. doi: 10.1577/1548-8659(1999)128<0193:FAAEIF>2.0.CO;2
Hudak, A. T., Robichaud, P., Jain, T., Morgan, P., Stone, C., and Clark, J. (2004). The Relationship of Field Burn Severity Measures To Satellite-derived Burned Area Reflectance Classification (Barc) Maps.
Jacobo, J. (2023). Waterways Along Ohio River Still Contaminated Following Train Derailment Carrying Hazardous Materials: Officials. Manhattan: ABC News. Available online at: https://abcnews.go.com/US/waterways-ohio-river-contaminated-train-derailment-carrying-hazardous/story?id=97195028 (accessed April 14, 2023).
Jones, A. S., Aanderud, Z. T., Horsburgh, J. S., Eiriksson, D. P., Dastrup, D., Cox, C., et al. (2017). Designing and implementing a network for sensing water quality and hydrology across mountain to urban transitions. J. Am. Water Resour. Assoc. 53, 1095–1120. doi: 10.1111/1752-1688.12557
Knapp, J. L. A., González-Pinzón, R., Drummond, J. D., Larsen, L. G., Cirpka, O. A., and Harvey, J. W. (2017). Tracer-based characterization of hyporheic exchange and benthic biolayers in streams. Water Resour. Res. 53, 1575–1594. doi: 10.1002/2016WR019393
Lee, K., Boufadel, M., Chen, B., Foght, J., Hodson, P., Swanson, S., et al. (2015). Expert Panel Report on the Behaviour and Environmental Impacts of Crude Oil Released into Aqueous Environments. Ottawa, ON: Royal Society of Canada.
Lentile, L., Morgan, P., Hardy, C., Hudak, A., Means, R., Ottmar, R., et al. (2007). Value and Challenges of Conducting Rapid Response Research on Wildland Fires. Gen. Tech. Rep. RMRSGTR-193. Fort Collins, CO: U.S. Department of Agriculture, Forest Service, Rocky Mountain Research Station. p. 11.
McGowan, E., and Song, L. (2017). The Dilbit Disaster: Inside The Biggest Oil Spill You've Never Heard Of, Part 1. Clim. News. Available online at: https://insideclimatenews.org/news/26062012/dilbit-diluted-bitumen-enbridge-kalamazoo-river-marshall-michigan-oil-spill-6b-pipeline-epa/ (accessed April 14, 2023).
Minnesota DNR. (2022). Personal Protective Equipment (PPE) – A Short Guide for Wildland Firefighters. Minnesota: Minnesota Department of Natural Resources.
Minshall, G. W., Robinson, C., Lawrence, D., Andrews, D., and Brock, J. (2001). Benthic macroinvertebrate assemblages in five central Idaho (USA) streams over a 10-year period following disturbance by wildfire. Int. J. Wildland Fire. 10, 201–213. doi: 10.1071/WF01018
Moody, J. A., and Martin, D. A. (2001). Initial hydrologic and geomorphic response following a wildfire in the Colorado front range. Earth Surf. Process. Landf. 26, 1049–1070. doi: 10.1002/esp.253
Mortensen, J. G., González-Pinzón, R., Dahm, C. N., Wang, J., Zeglin, L. H., and Van Horn, D. J. (2016). Advancing the food-energy-water nexus: closing nutrient loops in arid river corridors. Environ. Sci. Technol. 50, 8485–8496. doi: 10.1021/acs.est.6b01351
National Center for Atmospheric Research (2017). The Climate Data Guide: FLUXNET. Available online at: https://climatedataguide.ucar.edu/climate-data/fluxnet (accessed May 31, 2022).
National Park Service (2018). Wildland Fire Incident Qualifications. Available online at: https://www.nps.gov/subjects/fire/wildland-fire-incident-qualifications.htm (accessed May 10, 2022).
National Research Council (2012). The National Weather Service Modernization and Associated Restructuring: A Retrospective Assessment. Washington, DC: The National Academies Press.
National Weather Service (2022). Radiosondes. Available online at: https://www.weather.gov/jetstream/radiosondes (accessed May 31, 2022).
Neary, D. G., Ryan, K. C., and DeBano, L. F. (2005). Wildland Fire in Ecosystems: Effects of Fire on Soils and Water. Gen. Tech. Rep. RMRS-GTR-42-vol.4. Ogden, UT: U.S. Department of Agriculture, Forest Service, Rocky Mountain Research Station. p. 250.
New Mexico Forest Watershed Restoration Institute (2022). Hermits Peak and Calf Canyon Fire. Hermit's Peak Calf Canyon Fire. Available online at: https://storymaps.arcgis.com/stories/d48e2171175f4aa4b5613c2d11875653 (accessed March 28, 2023).
Nichols, J., Khandelwal, A. S., Regier, P., Summers, B., Van Horn, D. J., and González-Pinzón, R. (2022). The understudied winter: Evidence of how precipitation differences affect stream metabolism in a headwater. Front. Water. 4, 1003159. doi: 10.3389/frwa.2022.1003159
Nowell, B. L., Steelman, T. A., Velez, A. L. K., and Godette, S. K. (2017). Perspective Matters: The Challenges of Performance Measurement in Wildfire Response Networks. Amsterdam: Elsevier Inc. doi: 10.1016/B978-0-12-805196-2.00005-4
Ottmar, R. D., and Sandberg, D. V. (2003). “Predicting forest floor consumption from wildland fire in boreal forests of Alaska - preliminary results,” in Proceedings of Fire Conference 2000: The First National Congress on Fire Ecology, Prevention, and Management. Miscellaneous Publication No. 13, eds K. E. M. Galley, R. C. Klinger, and N. G. Sugihara (Tallahassee, FL: Tall Timbers Research Station), 218–224.
Owens, E. H., Taylor, E., Marty, R., and Little, D. I. (1993). An inland oil spill response manual to minimize adverse environmental impacts. Int. Oil Spill Conf. Proc. 1993, 105–109. doi: 10.7901/2169-3358-1993-1-105
Pacific Northwest National Lab (2022). Improving Knowledge and Predictions of Hyporheic Zone Respiration via Continental-Scale Interative ICON-ModEx Science. Available online at: https://www.pnnl.gov/projects/WHONDRS/icon-modex (accessed May 31, 2022).
Peters, P. E., and Zitomer, D. H. (2021). Current and future approaches to wet weather flow management: a review. Water Environ. Res. 93, 1179–1193. doi: 10.1002/wer.1506
Raffa, K. F., Aukema, B. H., Bentz, B. J., Carroll, A. L., Hicke, J. A., Turner, M. G., et al. (2008). Cross-scale drivers of natural disturbances prone to anthropogenic amplification: the dynamics of bark beetle eruptions. BioScience. 58, 501–517. doi: 10.1641/B580607
Reale, J. K., Van Horn, D. J., Condon, K. E., and Dahm, C. N. (2015). The effects of catastrophic wildfire on water quality along a river continuum. Freshw. Sci. 34, 1426–1442. doi: 10.1086/684001
Regier, P. J., González-Pinzón, R., Van Horn, D. J., Reale, J. K., Nichols, J., and Khandewal, A. (2020). Water quality impacts of urban and non-urban arid-land runoff on the Rio Grande. Sci. Total Environ. 729, 138443. doi: 10.1016/j.scitotenv.2020.138443
Robichaud, P. R., Lewis, S. A., Laes, D. Y. M., Hudak, A. T., Kokaly, R. F., and Zamudio, J. A. (2007). Postfire soil burn severity mapping with hyperspectral image unmixing. Remote Sens. Environ. 108, 467–480. doi: 10.1016/j.rse.2006.11.027
Robinne, F. N., Bladon, K. D., Miller, C., Parisien, M. A., Mathieu, J., and Flannigan, M. D. (2018). A spatial evaluation of global wildfire-water risks to human and natural systems. Sci. Total Environ. 610–611, 1193–1206. doi: 10.1016/j.scitotenv.2017.08.112
Rust, A. J., Saxe, S., Mccray, J., Rhoades, C. C., and Hogue, T. S. (2019). Evaluating the factors responsible for post-fire water quality response in forests of the western USA. Int. J. Wildland Fire 28, 769–784. doi: 10.1071/WF18191
Saraceno, J. F., Pellerin, B. A., Downing, B. D., Boss, E., Bachand, P. A. M., and Bergamaschi, B. A. (2009). High-frequency in situ optical measurements during a storm event: assessing relationships between dissolved organic matter, sediment concentrations, and hydrologic processes. J. Geophys. Res. 114, G00F09. doi: 10.1029/2009JG000989
Sherson, L. R., Van Horn, D. J., Gomez-Velez, J. D., Crossey, L. J., and Dahm, C. N. (2015). Nutrient dynamics in an alpine headwater stream: use of continuous water quality sensors to examine responses to wildfire and precipitation events. Hydrol. Process. 29, 3193–3207. doi: 10.1002/hyp.10426
Smith, H. G., Sheridan, G. J., Lane, P. N. J., Nyman, P., and Haydon, S. (2011). Wildfire effects on water quality in forest catchments: a review with implications for water supply. J. Hydrol. 396, 170–192. doi: 10.1016/j.jhydrol.2010.10.043
Southwest Coordinating Group (2022). About the Southwest Coordinating Group(SWCG). Available online at: https://gacc.nifc.gov/swcc/swcg/About_Us/About_Us.htm (accessed May 20, 2022).
Stroud Water Research Center (2017). Model My Watershed [Software]. Available online at: http://wikiwatershed.org/model.php (accessed May 22, 2022).
The Associated Press (2022). New Mexico Reaches $32M Settlement Over 2015 Gold King Mine Spill That polluted Colorado Water. Colo. Public Radio. Available online at: https://www.cpr.org/2022/06/17/new-mexico-settlement-over-2015-gold-king-mine-spill/ (accessed April 14, 2023).
U.S. Environmental Protection Agency (2022). Viewing WATERS Data Using Google Earth. Available online at: https://www.epa.gov/waterdata/viewing-waters-data-using-google-earth#Download (accessed July 10, 2023).
U.S. Environmental Protection Agency (1972b). Approved CWA Test Methods: Metals. Available at: https://www.epa.gov/cwa-methods/approved-cwa-test-methods-metals (accessed July 10, 2023).
U.S. Environmental Protection Agency (1972c). Approved CWA Test Methods: Organic Compounds. Available online at: https://www.epa.gov/cwa-methods/approved-cwa-test-methods-organic-compounds (accessed July 10, 2023).
U.S. Environmental Protection Agency (2000). Liquid Assets 2000: America's Water Resources at a Turning Point. Washington, DC: Office of Water. Available online at: http://www.epa.gov/ow (accessed March 29, 2022).
U.S. Environmental Protection Agency (2023). Emergency Response to August 2015 Release from Gold King Mine. U. S. Environ. Prot. Agency. Available online at: https://www.epa.gov/goldkingmine [accessed May 4, 2023].
U.S. Environmental Protection Agency (1972a). Approved CWA Test Methods: Inorganic Non-Metals. Available online at: https://www.epa.gov/cwa-methods/approved-cwa-test-methods-inorganic-non-metals (accessed July 10, 2022).
U.S. Forest Service (2022). Burned Area Emergency Response - BAER. Available online at: https://www.fs.usda.gov/detail/gila/landmanagement/resourcemanagement/?cid=stelprdb5374811 (accessed May, 1, 2022).
U.S. Geological Survey (2006). National Field Manual for the Collection of Water-Quality Data Chapter A4. Collection of Water Samples. Available online at: https://pubs.usgs.gov/twri/twri9a4/twri9a4_Chap4_v2.pdf (accessed January 26, 2023).
United States U.S. Fish Wildlife Service National Association of State Foresters, United States Fire Administration. (2000). InciWeb: Incident Information System. Available at: https://inciweb.nwcg.gov/ (accessed April 20, 2022).
U. S. Environmental Protection Agency (2017). Analysis of the Transport and Fate of Metals Released from the Gold King Mine in the Animas and San Juan Rivers: Executive Summary. Available online at: https://cfpub.epa.gov/si/si_public_file_download.cfm?p_download_id=530075 (accessed July 10, 2023).
USGS. (2000). Interagency Field Manual for the Collection of Water-Quality Data, Report 2000-213. Open-File Report. Reston, VA: USGS Publications Warehouse. doi: 10.3133/ofr00213
Wagner, R. J., Oblinger, C. J., and Smith, B. A. (2006). Guidelines and Standard Procedures for Continuous Water-Quality Monitors: Station Operation, Record Computation, and Data Reporting. Report 1-D3. Version 1.0. Techniques and Methods. USGS Publications Warehouse. doi: 10.3133/tm1D3
Weed, A. S., Ayres, M. P., and Hicke, J. A. (2013). Consequences of climate change for biotic disturbances in North American forests. Ecol. Monogr. 83, 441–470. doi: 10.1890/13-0160.1
Wesley, D., and Dau, L. A. (2017). Complacency and automation bias in the enbridge pipeline disaster. Ergon. Des. Q. Hum. Factors Appl. 25, 17–22. doi: 10.1177/1064804616652269
Westerling, A. L., Hidalgo, H. G., Cayan, D. R., and Swetnam, T. W. (2006). Warming and earlier spring increase Western U.S. forest wildfire activity. Science. 313, 940–943. doi: 10.1126/science.1128834
Williams, A. P., Allen, C. D., Millar, C. I., Swetnam, T. W., Michaelsen, J., Still, C. J., et al. (2010). Forest responses to increasing aridity and warmth in the southwestern United States. Proc. Natl. Acad. Sci. 107, 21289–21294. doi: 10.1073/pnas.0914211107
Keywords: rapid response research, disturbances, monitoring, water, aquatic, propagation, wildfire
Citation: Tunby P, Nichols J, Kaphle A, Khandelwal AS, Van Horn DJ and González-Pinzón R (2023) Development of a general protocol for rapid response research on water quality disturbances and its application for monitoring the largest wildfire recorded in New Mexico, USA. Front. Water 5:1223338. doi: 10.3389/frwa.2023.1223338
Received: 16 May 2023; Accepted: 04 July 2023;
Published: 24 July 2023.
Edited by:
Lorenzo Antonio Picos Corrales, Universidad Autónoma de Sinaloa, MexicoReviewed by:
Jose Ruelas-Leyva, Universidad Autónoma de Sinaloa, MexicoJesús Álvarez-Sánchez, Instituto Tecnológico de Sonora (ITSON), Mexico
Copyright © 2023 Tunby, Nichols, Kaphle, Khandelwal, Van Horn and González-Pinzón. This is an open-access article distributed under the terms of the Creative Commons Attribution License (CC BY). The use, distribution or reproduction in other forums is permitted, provided the original author(s) and the copyright owner(s) are credited and that the original publication in this journal is cited, in accordance with accepted academic practice. No use, distribution or reproduction is permitted which does not comply with these terms.
*Correspondence: Paige Tunby, cHR1bmJ5QHVubS5lZHU=; Ricardo González-Pinzón, Z29uemFyaWNAdW5tLmVkdQ==