 Prasanna Sisira Kumara Rajapakshe
 Mette Termansen
 Jouni Paavola
- 1Department of Environmental Management, Faculty of Social Sciences and Humanities, Rajarata University of Sri Lanka, Mihintale, Sri Lanka
- 2Section of Environment and Natural Resources, Department of Food and Resource Economics, University of Copenhagen, Copenhagen, Denmark
- 3School of Earth and Environment, University of Leeds, Leeds, United Kingdom
In many developing countries, lack of access to water and its unsustainable use and adverse health impacts are important policy issues. The challenge of improving water services in developing countries is not only limited to the provision of new connections for non-piped-source-dependent households but also to improving the service level for the already connected households to meet peoples' needs. We conducted an empirical study in Sri Lanka on 307 households with piped water supply. A choice experiment was used to assess the potential welfare gains from alternative water supply schemes in terms of water quality, reliability, and pressure, and how the schemes are managed. Currently, over 20 different water supply systems managed by either governmental organizations or community-based organizations (CBOs) provide piped water supply. We found that households are willing to pay a substantial amount for improved water service, particularly for water quality improvements. Using the latent class and random parameter logit models, we found evidence of heterogeneity in the preferences for water service improvements. We suggest that the heterogeneous preferences of the household groups should be considered in the cost–benefit analysis to pave a way for rational policy-making on water service improvements.
1. Introduction
The Sustainable Development Goal 6 (SDG-6) is committed to achieving universal and equitable access to safe and affordable drinking water for all by 2030. Improvements in the quality, quantity, and reliability of water supply are fundamental to meeting the SDG and could generate multiple socioeconomic benefits from the household to the macroeconomic level. Access to a safe, adequate, and affordable water supply is a key determinant of the livelihood improvements needed in developing country communities to achieve the SDGs (Mabhaudhi et al., 2019; Sachs et al., 2019).
The socioeconomic benefits of water service improvements include improved public health of the poor, avoided costs of adverse health impacts, improved labor productivity, and lower cost of prevention measures (World Bank, 1994; Hutton et al., 2007; Rajapakshe, 2014; Mabhaudhi et al., 2019). However, particularly in the developing world, financial resources for water service improvements are more limited than the demand for reasons such as low income level, lack of understanding of social cost of water pollution and water-related health impacts, and lack of well-functioning markets (Rajapakshe, 2014). Developing countries need 2–4 times more funding compared to current levels for water and sanitation services to meet the SDGs (Alaerts, 2019). According to Hutton and Varughese (2016), about 3 times more than the current capital investment is needed to achieve the SDGs related to water supply, sanitation, and hygiene (targets 6.1 and 6.2). Therefore, it is important to mobilize domestic resources and alternative sources of finance through new mechanisms and policy reforms (Alaerts, 2019; Sachs et al., 2019).
Traditionally, in developing countries, water supply projects often neglect the demand-side priorities such as consumer needs, heterogeneous preferences, and demographic and financial factors as water supply projects have been conventionally designed from the engineering and supply side points of view (Whittington et al., 1993; Altaf, 1994; Nam and Son, 2005; Rajapakshe, 2014). However, researchers and policy makers are increasingly shifting the focus on demand-oriented approaches toward water supply and sanitation, which call for a better understanding of the behavior of water consumers and their ability and willingness to pay for improved services (Whittington et al., 1990; Nam and Son, 2005; Beal et al., 2016; Otaki et al., 2019, 2020; Tortajada et al., 2019). According to Whittington et al. (1990) and Somanathan (2010), lack of publicly available information is one of the key reasons that hinder the improvement of environmental quality, and the same is true of water supply and water quality. As pointed out by Jalan et al. (2009), awareness of public goods such as environmental amenities or water quality is itself a public good. Yet, it is insufficiently supplied in a market economy and is one of the reasons for the low demand for environmental and water quality in developing countries. Therefore, it is important to demonstrate and value such demand and to document the evidence about the benefits for appraisal of investments in water service improvements.
Urban and rural sector water demand has rapidly grown in Sri Lanka in the past few decades owing to population growth, urbanization, and expansion of economic activities. However, poor water quality, service interruptions, low pressure, and insufficient maintenance are still common issues in piped water provision in Sri Lanka and in most developing countries (Whittington et al., 1990, 2002; Altaf, 1994; Lee and Schwab, 2005; Dharmaratna and Parasnis, 2012; Ahsan et al., 2021).
This situation is putting additional pressure on policy makers and water managers to provide improved quality more reliably to users while meeting the increasing demand for water. Water consumers also expect better service for what they are paying to water supply authorities. However, it is not easy for policy makers and water supply authorities to make decisions on the improvements in water service if they do not have the evidence to evaluate how and in what ways such investments will benefit the consumers with heterogeneous preferences. Research in environmental economics suggests that valuation techniques can be used to measure how beneficial such improvements would be for water consumers. Such information can be used to design water service policies to be more effective (Whittington et al., 2002; Rajapakshe, 2014; Wang et al., 2018; Ahsan et al., 2021). The benefits of water service improvements can be measured by examining the changes in human welfare related to such improvements. Both the stated preference (SP) and revealed preference (RP) approaches can be used to estimate such benefits (Birol et al., 2006b). The SP focuses on individual responses to hypothetical questions, while the RP focuses on the actual choice behavior of individuals (Freeman, 2003). This study employs one SP approach, a choice experiment (CE), to value the benefits of improved piped water supply in rural Sri Lanka. A CE is preferred as it helps derive the implicit prices of changes in water service attributes and thus, enables the prioritization of alternative investments in water supply systems.
2. Materials and methods
2.1. Study area
In the North Central Province (NCP) of Sri Lanka, piped water supply is of rather lower quality than in other provinces and water-related health impacts are common. Poor water quality has been evidenced by measurements in the area (Dissanayake, 1996; Tennakoon, 2004; Padmasiri and Jayawardana, 2010). Excessive concentrations of agrochemicals and heavy metals contribute to water-related health impacts and create additional burdens on local livelihoods. Households are taking measures to avoid these impacts such as boiling and filtering groundwater, buying bottled water, and harvesting rainwater. The costs of these preventive actions are higher than the costs of poor quality of water supply and highlight public's awareness of the impact of the poor water quality and their preferences for improved water supply.
2.2. Choice experiment method
The valuation of environmental resources has its roots in the 1960s when the contingent valuation method (CVM) and the travel cost method (TCM) were developed to estimate the recreational values of national parks in the USA. The CE method is increasingly used to value environmental resources (Hanley et al., 1998). The origin of CE lies in conjoint analysis which has been widely used in market research (Blamey et al., 1999). At present, CE is employed in diverse fields such as marketing, health, and transportation.
The primary goal of CE use is to measure the welfare effects of changes in environmental quality (especially of non-market goods and services) by presenting a series of choices between policy options (called choice sets) to respondents and requesting them to select their most preferred option by trading-off different aspects of the alternatives in the choice set (Hanley et al., 1998). Each alternative in the choice set is characterized by several attributes, including a monetary one, and each attribute can be offered at different levels. The monetary attribute measures the extent to which the respondents choose water service improvements over cheaper water provision. The trade-offs that the respondents make are the bases for valuing improvements in water quality provision.
In an early study, Blamey et al. (1999) employed CE to examine the community preferences for water service improvements in the Australian Capital Territory, concluding that compared to the CVM, CE was well-suited to evaluate the multiple options for water service improvement in terms of monetary valuation and community ranking. Health sector benefits have been an important justification for water supply improvements. Hala and Carlsson (2004) estimated the short and long-term health benefits of water quality improvements in Metropolitan Cairo using the CE method. They estimated the benefits to be about 2.6% of the average household monthly income. However, the estimated benefit was somewhat lower than the cost of water service improvements needed to generate the benefits.
Hensher et al. (2005a) estimated the willingness to pay (WTP) for drinking water and wastewater service improvements in Canberra, Australia and found that the benefits of water service improvements were significant. Yacob et al. (2011) explored the WTP for water quality, reliability, and consumer trust improvements in Selangor, Malaysia and concluded that consumers are willing to pay more than the current rate of payment. Kanyoka et al. (2008) evaluated the benefits of water supply in rural South Africa, focusing on the attributes of daily water use by households, frequency of supply, quality of water, productive uses, sources of water, and water price. This study also confirmed that people are willing to pay a substantial amount of money for water supply improvements.
Tarfasa and Brouwer (2013) calculated the benefits of water supply improvements using a CE in Ethiopia. They found that households were willing to pay 80% more on top of existing payments for improved water supply and that the poor and women valued water quality improvements the most. In the EU context, Latinopoulos (2014) estimated the benefits of improved water supply using the CE method in the Municipality of New Propontida, Greece. The results again highlighted that water service improvements were important for water users, and that they were willing to pay for water service improvements just like in the other SP studies referred to above.
Ibrahim et al. (2019) estimated the WTP for water service improvements at the domestic level by using the CE method in Terengganu, Malaysia, focusing on water quality, service disruption, water pressure, and water price as the key service attributes. They found that the higher WTP for water service improvements is explained by education, age, and income. Gschwandtner et al. (2020) employed CE in Cheongju in South Korea to examine the feasibility of the advanced water treatment system. They found that the lower bound of median WTP was about 2 USD/month for the new water treatment system, which is about the same as what participants spend to purchase bottled water for the household. Vásquez et al. (2022) used CE in the Galápagos Islands to examine the household preferences for water service improvements and the environmental impacts of desalination. Their results indicate that households have heterogeneous preferences for water quality improvements and environmental protection: households were willing to pay 27 USD/month and 30 USD/month for water quality improvements and marine ecosystem protection, respectively.
Ahsan et al. (2021) applied the CE method to estimate the urban dwellers' WTP for improved drinking water supply in Bangladesh. This study found that respondents are willing to pay for the water service characteristics of water quality, regularity, water pressure, and filtering. In the Sri Lankan context, Yang et al. (2006) estimated the demand for water service quality using conjoint analysis in Greater Negombo and the coastal strip from Kalutara to Galle in Southwest Sri Lanka. They found that the majority of the respondents preferred their current supply over the three improved water system alternatives. This was likely because a majority of the households were served by piped water supply schemes and may experience fewer service quality problems than in the rural dry zone of Sri Lanka where the current study is conducted.
Only a handful of studies have to date valued the benefits of improved piped water supply using the CE method, although it has been extensively applied to value environmental amenities in general. The lack of evaluation of welfare changes associated with water service improvements in developing countries using CE is a clear gap in the literature. Most earlier studies have employed standard CE models without examining preference heterogeneity and its implications. We address these issues by considering the service level, water quality, organizational- and price-related attributes of water supply and investigating preference heterogeneity with regard to them. Furthermore, we use choice models that allow for variations in preference such as latent class (LC) and the random parameter logit (RPL) models which will shed more light on how policies need to take into account preference heterogeneity among water users (Carlsson et al., 2003; Birol et al., 2006a).
Literature on non-market valuation highlighted that welfare improvements from water quality enhancement initiatives can be measured using the CE technique (Tarfasa and Brouwer, 2013; Ibrahim et al., 2019; Gschwandtner et al., 2020; González-Santander et al., 2022; Vásquez et al., 2022). However, earlier studies have often not included water quality data although it is important for testing whether the responses to hypothetical improvements to the perceived level of water quality are correlated with objective quality indicators. SP approaches rely on the assumption that respondents have adequate information about the goods and services they are asked to value. If communities are well-informed about the quality of their drinking water, the WTP for water quality improvements would be higher in areas where the quality is currently poor. To test such a hypothesis, it is important to collect data both on the respondents' awareness of water quality problems as well as water quality measurements.
The type of water supply provider/management organization is an important determinant of the decision to sign-up for a water supply scheme because of the level of trust and risk people associate with the quality of water supply and the different types of water service providers (Yacob et al., 2011; Brouwer et al., 2020). Therefore, we included the type of provider/management organization as one attribute in choice design, allowing people to trade off this attribute against other attributes. No previous study has done that. More specifically, we evaluated the preferences for a governmental organization-National Water Supply and Drainage Board (NWSDB) and community-based organization (CBO) as water providers.
To the best of our knowledge, this novel study is the first one conducted in a developing country to value improvements of existing piped water supply in a comprehensive choice modeling framework while also testing water samples to understand the extent and awareness of the drinking water problem and preferences for service improvements. A standard conditional logit (CL) and CL model with interaction effects are first used to examine whether observable socioeconomic characteristics of households are correlated with choice behavior. Then, more advanced LC and RPL models are used to accommodate the unobserved preference variation among the respondents for water supply improvements. Characterizing preference variation is useful for quantifying the distributional effects of improvement alternatives when estimating their welfare implications. This study also compared the calculated benefits of water service improvements with national cost estimates for water supply improvements to generate policy-relevant information on the feasibility of investing in water service improvements.
2.3. Theoretical framework and the econometric specification
Choice experiments are based on Lancaster's theory of value (Lancaster, 1966) and implemented using the random utility model developed by McFadden (1974) and Ben-Akiva and Lerman (1985). The framework assumes that the utility or value of goods and services is derived from their characteristics, also termed attributes. Following this, we assume that each household (h) chooses a water supply scheme (j) from the options available in the choice set C. The utility function for each household Uhj can then be expressed as follows:
where V(Xhj) is the deterministic component of utility and a function of the attributes (X) of the scheme alternatives. Then, ε(Xhj) is the error term which represents the unobservable factors affecting individuals' choices. The random component in the utility function allows for a probabilistic specification of a household's choice behavior (Adamowicz et al., 1998). The probability that a household (h) select alternative (j) over other alternatives (k) can be expressed as follows:
Assuming that the relationship between the given utility and the attributes is linear in parameters and that the error terms are identically and independently distributed with a type 1 extreme value (Gumbel) distribution, then the above equation [2] can be specified and estimated with a CL model specification (McFadden, 1974; Greene, 2003, p.719–720) and the probability of selecting alternative (j) can be expressed as follows:
where V(Xhj) is estimated using the following functional form,
where β specifies the alternative specific constant (ASC).
The ASC captures the effects on the utility of signing up to a policy, other than the water service attributes in the model. The subscript on the attributes 1 to n relates to the specific water service improvement alternative j and the vector of β1-βn are the coefficients of the attributes of X1-Xn.
As the CE methodology is consistent with utility maximization and demand theory (Hanemann, 1984; Bateman et al., 2003), the marginal willingness to pay (MWTP) or implicit price function for all the attributes except the monetary attribute (monthly water tariff in this study) can be expressed as [5], giving the households the WTP for change in the water-related attribute compared to the status quo.
where βj is the coefficient of the other attributes and βm represents the coefficient of the monetary attribute, the marginal utility of income.
Estimating the welfare change of the different policy alternatives is the main objective of the choice experiment analysis. The estimated change in welfare can be derived as the compensating variation (CV) from the introduction of hypothetical policy scenarios using the following formula:
where Vi indicates the utility of the initial attribute level and Vs indicates the utility of the subsequent state.
2.3.1. Advanced specifications in CE
The validity of the CL model has been much debated in the literature. Although economists are increasingly exploring and using more advanced econometric specifications, the standard CL model provides the starting point for analysis (Greene and Hensher, 2003). There are two notable limitations in the assumptions of the CL model, namely the independence of irrelevant alternatives (IIA) and respondents' homogeneous preferences, leading to the estimation of homogeneous taste parameters (Kosenius, 2010). The IIA property is often violated in the real world and there is clear evidence of variations in the preferences of respondents.
Two widely used advanced models include the LC and RPL models (the latter is also known as the mixed logit model). The main reasons for their use are that they do not rely on the IIA assumption and that they can accommodate preference heterogeneity. Many studies have shown that RPL and LC outperform the CL model in terms of overall statistical fit and welfare estimations (Carlsson et al., 2003; Birol et al., 2006a). It is often important to identify both aggregate welfare changes as well as equity concerns (who will be affected by policy changes) for environmental policy making (Boxall and Adamowicz, 2002; Birol et al., 2006a). The LC and RPL models have advantages in this regard as they can help identify and quantify differences in impacts among the affected people.
2.3.2. LC model
The LC model was initially proposed under the umbrella of the random utility model by McFadden (1986) and it was subsequently developed by Swait (1994), Boxall and Adamowicz (2002), and Greene and Hensher (2003). According to this model, the population is comprised of a finite number of classes or segments to be decided endogenously based on the data and depending on the socioeconomic characteristics of the respondents. The theory behind the LC model implies that the behavior of individuals depends on both observable attributes and the latent heterogeneity which is unobserved by the researcher. In LC models, preferences are assumed to be homogeneous within each latent segment, and thus, the utility functions vary between them (Greene, 2003; Birol et al., 2006a; Kosenius, 2010).
The LC model is specified as a RUM where the probability of water supply option j selected by household h in segments s can be expressed as follows:
where μs and βs are the scale parameters and segment-specific utility parameters, respectively. The probability of an individual's membership of segment s can be expressed as follows:
where λs denotes a vector of segment-specific parameters and α is a scale factor, which is assumed to be equal to one: each individual has a probability of belonging to a particular segment (Boxall and Adamowicz, 2002). By substituting the equations for the choice probability (7) and membership (8), the probability equation can be expressed as follows:
This integrated model allows us to explain the choice behavior in terms of both choice attribute data and individual characteristics.
There are several statistical criteria for deciding the number of segments, S, to be included in an LC model. These include the minimum Akaike Information Criteria (AIC) and the minimum Bayesian Information Criteria (BIC) along with ρ2 and the Log Likelihood Ratio (LLR) (Swait, 1994). However, it is important to select a model which provides evidence of preference variability, offers interpretative simplicity, and yields policy-relevant insights (Swait, 1994; Boxall and Adamowicz, 2002).
2.3.3. RPL model
However, not only different segments of society but also individuals within them are heterogeneous. It is important to consider also this preference variation in segments in order to derive accurate and unbiased welfare estimates (Greene and Hensher, 2003; Hensher and Greene, 2003; Birol et al., 2006a). The RPL model accounts for the heterogeneity of preferences by estimating the distribution of model parameters across individuals. In this study, the monthly payment attribute was specified as a non-random or fixed parameter (equal among all the individuals) and all other non-price parameters (including ASC) were specified as normally distributed (Revelt and Train, 1998; Train, 1998; Carlsson et al., 2003; Hensher et al., 2005a). The RPL model estimation in this study was based on 1,000 Halton draws. All CE estimations were carried out using Nlogit software (version 3) and the SPSS 18 software was used for supplementary statistical analysis.
2.4. Experimental design and data collection
Like other goods and services, water service changes can be explained and valued based on their different attributes and their levels. At the start of CE design, it is important to define the most important water service attributes and the relevant levels of attributes should be identified. Initially, an in-depth literature review was used to find out potential attributes related to water service improvements. Then expert and key informant interviews were conducted with water sector experts, policy makers, and local community leaders in the study area to firm up the attribute choices.
Water quality, reliability, pressure, water provider/management type, and monthly payment scheme were chosen as the attributes used to characterize water supply policy options in this study. Many of the same attributes have been used in earlier studies too (e.g., Kanyoka et al., 2008; Yacob et al., 2011; Latinopoulos, 2014; Ibrahim et al., 2019; Ahsan et al., 2021). The monthly payment scheme is used to calculate the implicit prices/marginal willingness to pay for different attributes relative to different policy scenarios. However, to the best of the authors' knowledge, no previous CE study has included the type of water provider/management organization as an attribute, although it is important for valuing water supply improvement options. Pilot testing was carried out for screening and validate the attributes and their respective levels. Attributes are coded as dummies except for the price for which linear coding was used (Table 1).
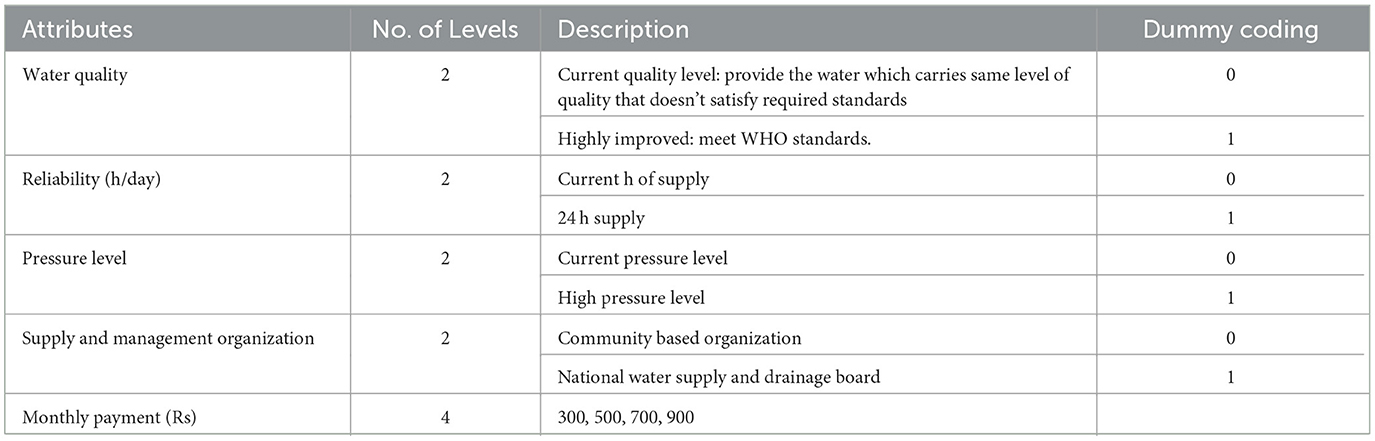
Table 1. Profile of choice design.
The experimental design (Louviere et al., 2000; Hensher et al., 2005b) is also an important step in choice experiments as it helps to create choice sets in the most efficient manner (Alpizar et al., 2003). In this study, there are 64 (24*41) combinations of choices (full factorial). As it is not possible to ask a single respondent to respond to all these combinations, a fractional factorial orthogonal design (Louviere et al., 2000; Hensher et al., 2005b) is used. This reduced the design to 8 choice cards with each choice set including two water supply alternatives A and B and the Status-Quo (SQ) option (Figure 1). The inclusion of the SQ option is an integral part of the CE to derive welfare estimates that are in line with the theory of demand (Hanemann, 1984; Louviere et al., 2000).
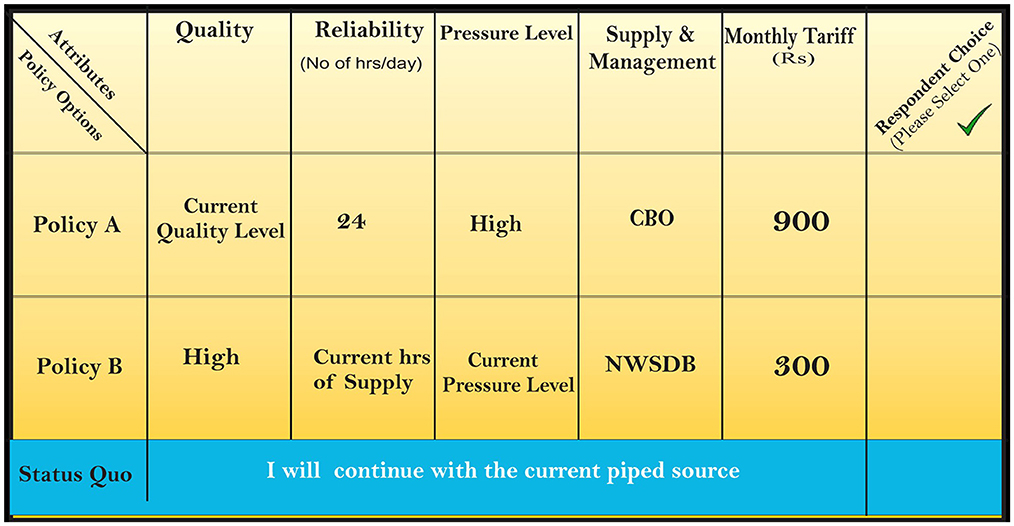
Figure 1. Example of choice card.
The data were collected from households signed up with the two types of water supply providers ensuring the inclusion of different groups and characteristics present in the community. Data collection included 3 focus group discussions, key informant interviews, and a survey of randomly selected 307 households in 15 Divisional Secretariat areas in the North Central Province of Sri Lanka. Samples of drinking water were collected as part of the survey and tested for Fluoride (F), Electrical Conductivity (EC), Hardness (H), and Total Dissolved Solids (TDS). Data on the socioeconomic and attitudinal characteristics of households were also collected as part of the survey.
3. Results
3.1. Sociodemographic characteristics of the households
The sample of 307 households included 41% male and 59% female respondents. Their average age is 44 years and an average household has about four members (Table 2). The results indicate that 60% of the households resort to averting measures in response to water quality problems and about 21% of them have experienced a water-related disease. The average household income is about Rs. 33,308 per month. The tested water samples indicate that the water supply schemes managed by the CBOs have the highest F, EC, and TDS levels.
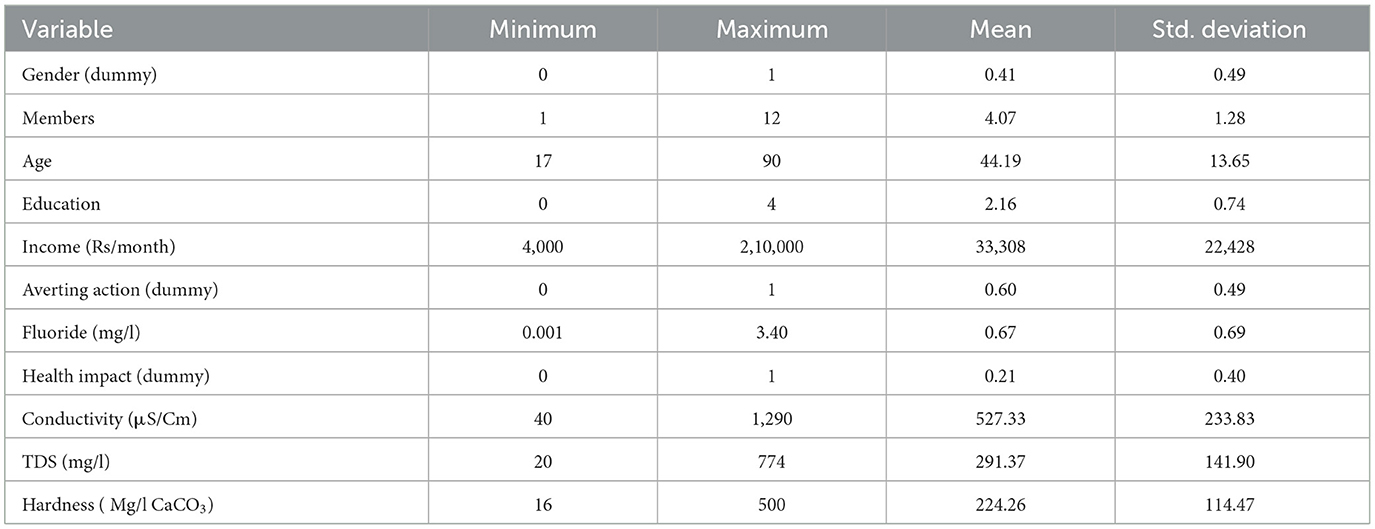
Table 2. Socioeconomic and demographic characteristics of the households.
3.2. Results of the CL and CL with interactions
First, a CL with only attributes and the ASC as an exogenous variable was specified. It was then tested by including the socioeconomic characteristics of the respondents as interaction terms with the ASC (Table 3) to accommodate the observed preference heterogeneity. Here, we report only the interaction effects with ASC to capture part of the preference heterogeneity for water supply options compared to the SQ.
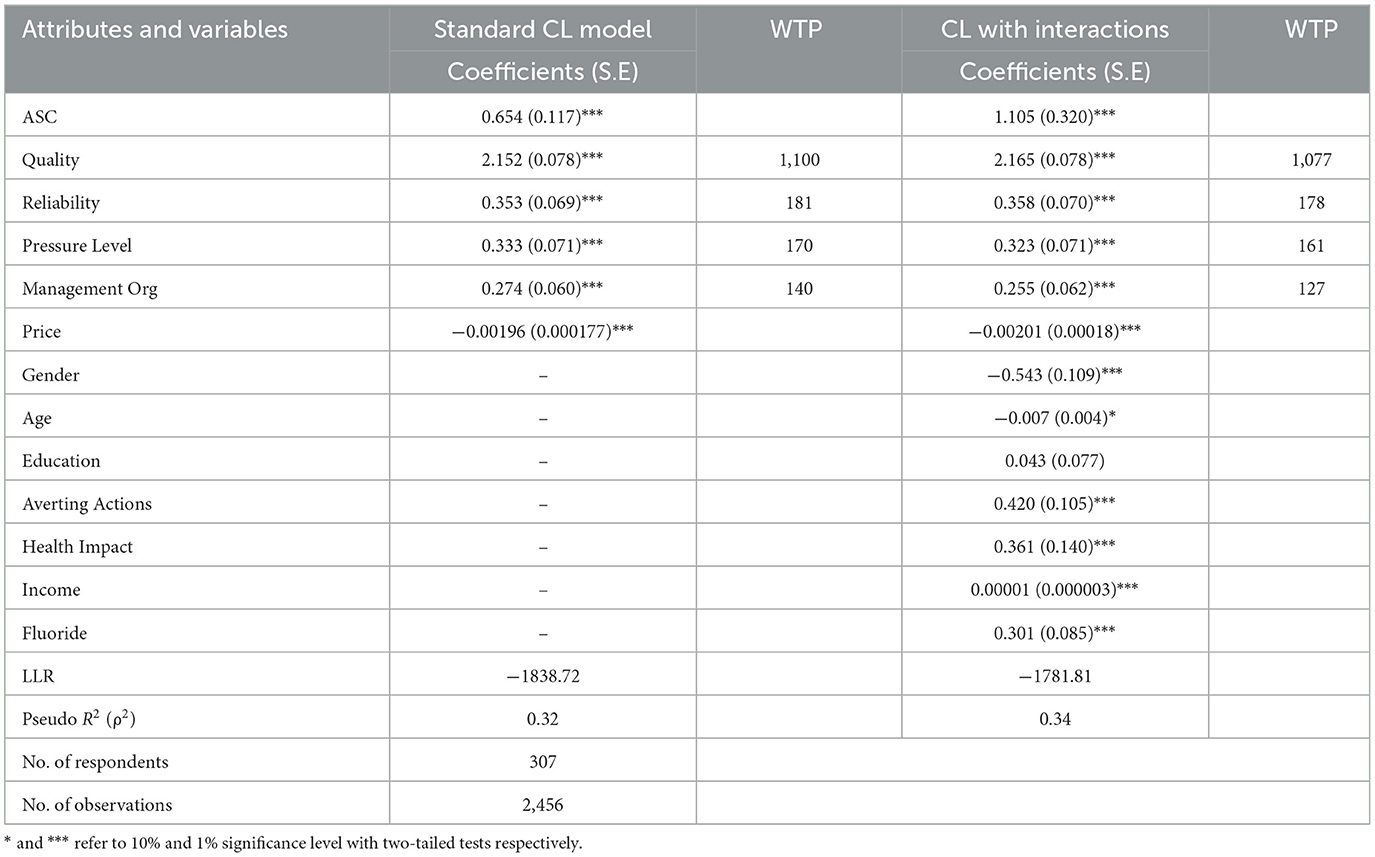
Table 3. Parameter and WTP estimates for CL and CL interaction with ASC.
Both the CL model and the interaction model have a good statistical fit in terms of McFadden's Pseudo R2 (ρ2). Although both the pseudo R2 for non-linear models and the R2 for the conventional linear regression models are measures of statistical fit, significant models are estimated at a lower level of test-statistic for the non-linear models. According to general criteria, models with ρ2 between 0.3 and 0.4 are considered well-fitted (Hensher et al., 2005b: p. 338). As reflected by the higher ρ2 and lower LLR, the interaction model provides a slightly better estimation than the CL Model.
Expected signs can be observed in all attribute parameters and they are significant at 1% level in both models. This suggests that the proposed policy options could have influenced the tradeoffs compared to the SQ (Table 3). In this study, the ASC is included in the SQ option. A positive and significant ASC means that people prefer to remain at the SQ if all other factors are being held constant, as they derive higher utility from selecting SQ compared to alternatives A or B. The interaction model highlights that the socioeconomic variables and the tested water quality parameters also explain the preferences for water supply improvement options compared to the SQ. Participants already have piped water supply and may think that it is not necessary to choose another option if they provide the same level of water service. On the other hand, they may feel that they can derive more utility by maintaining the SQ, perhaps because of the transaction costs of shifting from SQ to the options.
There is a high correlation between water quality parameters. The models have been specified using F level as a water quality indicator, as it has a significant impact on human health. As predicted, a higher utility can be obtained by choosing lower-cost alternatives as the price coefficient is negative and statistically significant.
A positive sign and high significance of a parameter of water quality highlights that people prefer water quality improvements. This is also confirmed by the positive sign and significance of the coefficient of the explanatory variable for F level—it indicates that people prefer an improved water supply if the level of F in their drinking water is relatively high.
A negative sign of the coefficient of gender means that compared to men, women prefer improved water service options. In most developing countries, household activities are carried out by women alongside looking after their children. They are likely more acutely aware of the adverse consequences of poor water quality and thus the benefits of improved water supply. We also find that there is a positive relationship between the educational attainment of the respondents and preferring an improved water supply option rather than the current service.
The results also highlight that those with higher income prefer the improved water supply options, as do those who are engaging in averting actions. The latter again may be more acutely aware of the costs of poor water supply and the benefits of an improved one because of their experience: improved water supply can help reduce the costs of averting measures and cost of illness as the averting measures are seldom fully effective.
The WTP for improvements in each attribute is the ratio between the coefficients of monetary and the other attributes related to water service improvements. Table 3 indicates that in light of the CL model people are willing to pay Rs 1,100 per month for water quality improvements, which accounts for around 70% of their total WTP for the improvements in all attributes of water service.
3.3. Latent class model results
There are many criteria for selecting the number of segments to include in the LC model. To select the most appropriate model, the LC model and one, two, and three-segment models were estimated. Models with over 3 segments could not be specified with the data. The minimum Akaike Information Criteria (AIC) and the minimum Bayesian Information Criteria (BIC) (Swait, 1994), along with ρ2 and LLR were used to select the LC Model. According to Boxall and Adamowicz (2002), these criteria can be used for general guidance but the final selection of the number of segments should also be based on the overall judgment of the model, particularly when standard criteria are inconclusive. They advise that it is more important to select a model which portrays preferences in a meaningful way and gives policy-relevant insights than rely exclusively on statistical criteria. The results suggest that the two-segment LC model is best and most realistically captures preference heterogeneity for improved water supply options (Table 4).
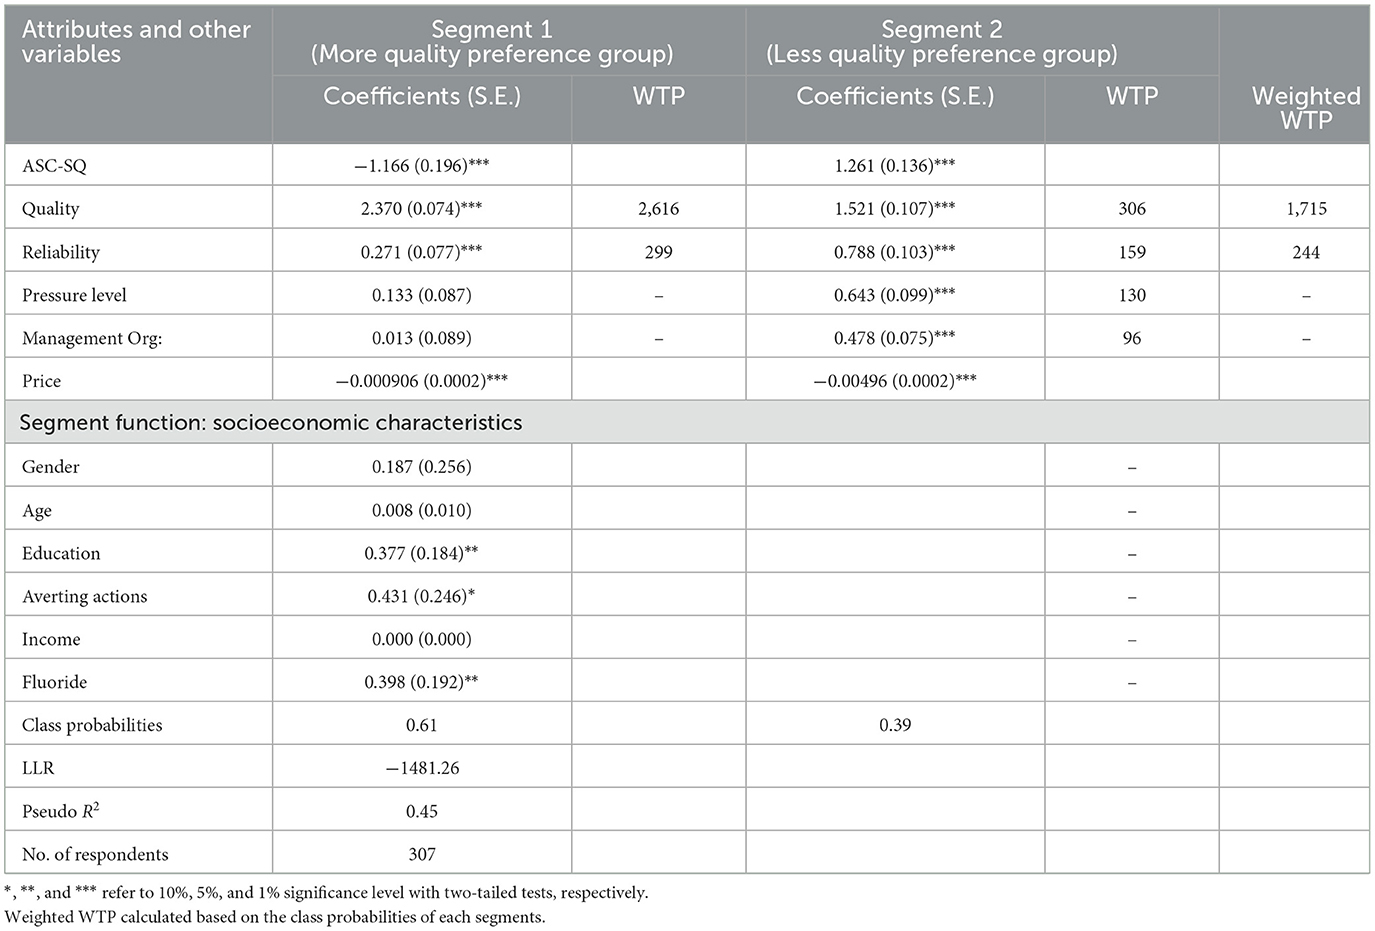
Table 4. Parameter and WTP estimates for the LC model.
The results of the LC model include the utility coefficients of the attributes, associated class-specific WTP estimates, and the segment membership coefficients characterized by the socioeconomic status of respondents. About 61% of the respondents belonged to segment 1, which consisted of people with stronger preferences for water quality improvement than segment 2, which included 39% of the respondents. The results further evidence that the majority of the households prefer improved water supply rather than the status quo. In contrast, segment 2 respondents prefer the status quo if the attributes remain constant, in line with the findings obtained using the CL models. All parameters of the attributes are significant and have expected signs in segment 2 in the LC model. Only the quality and reliability parameters are significant for the utility specification of segment 1. Respondents with a higher level of education, taking averting actions, and having high fluoride concentration in their current water supply had a higher probability of belonging to segment 1.
3.4. Profile of the respondents in the LC model
The LC model assumes that the socioeconomic and attitudinal characteristics of respondents influence their choices via segment membership. To find the sources of heterogeneity and the distributional effects of the welfare estimations, the probabilities of respondents belonging to each segment were estimated. Classifying each respondent according to the probability of belonging to a segment indicates that the segments are primarily differentiated by the quality of the current water supply and engagement with averting behavior, rather than the socioeconomic characteristics (Table 5).
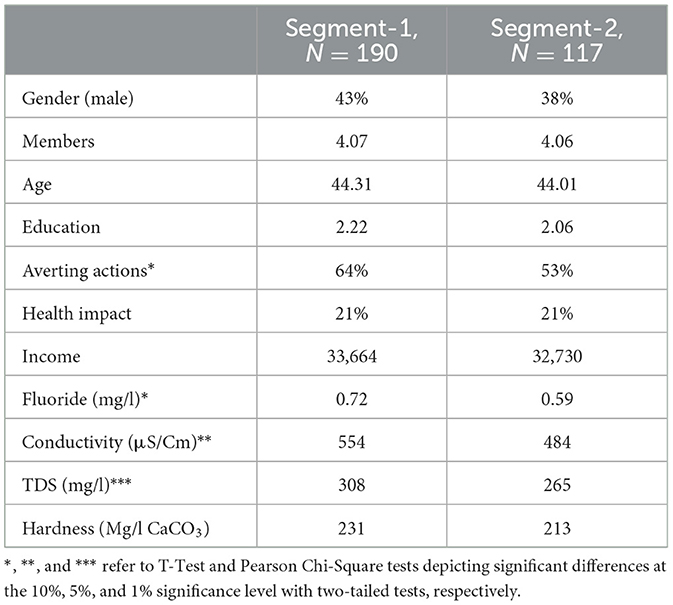
Table 5. Profile of the respondents in LC model.
3.5. RPL model results and welfare estimations
The results of the RPL model (Table 6) are based on the 1,000 Halton simulation draws. The monthly payment attribute was specified as a non-random or fixed parameter (equal among all the individuals) and all other non-price parameters, including ASC, were specified as normally distributed. All parameters of the attributes in the RPL model have expected signs and are significant at the 1% level, except the ASC which is only significant at the 10%. The positive sign of the ASC parameter indicates that the respondents prefer to maintain SQ, if all other water service attributes remain constant.

Table 6. Parameter and WTP estimates for the RPL model.
The estimated standard deviations (SD) for randomly distributed parameters are highly significant (except for the type of provider), indicating preference heterogeneity among the respondents. The randomly distributed ASC in the SQ option captured and confirmed the heterogeneity with regard to the SQ and also provided better estimation when the ASC was modeled as a fixed parameter.
The results confirmed that the RPL model outperforms all other models by achieving higher ρ2 and lower LLR, AIC, and BIC (Table 7). Therefore, it is more reliable and appropriate for welfare estimation as a guide to policy making. The WTP for water quality improvement in RPL is Rs. 1,000 per month, which is less than the WTP calculated using the CL and LC (weighted) models. Households are also willing to pay Rs. 177, Rs. 118, and Rs. 100 per month for the improvement of reliability, pressure level, and government management, respectively (Table 8).
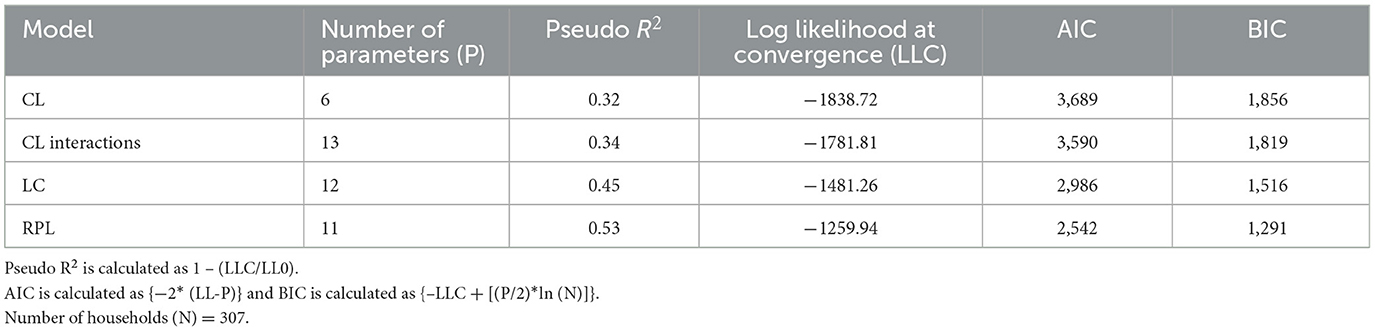
Table 7. Model selection criteria.

Table 8. Summary of the mean WTP estimates for the CL, LC, and RPL models.
The MWTP values or implicit attribute prices reported in Table 8 do not reflect the economic values of the water supply improvement options. Three alternative scenarios with different hypothetical supply improvements were created to illustrate the potential economic welfare improvements in light of the results (Table 9). The scenarios indicate that water quality improvement is a very significant factor for the value of future water service improvements.
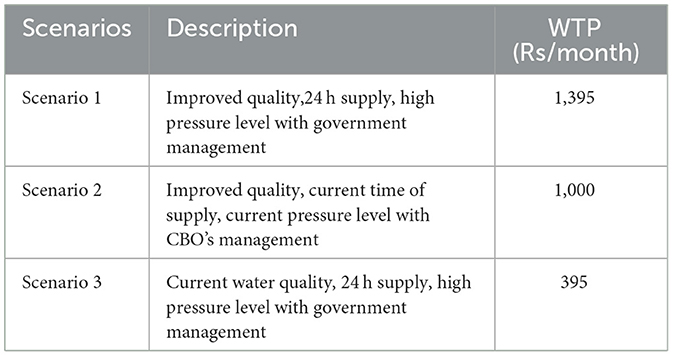
Table 9. Compensating variation under different water provision scenarios.
4. Discussion
In all models, the coefficient of ASC has a positive sign except for segment 1 of the LC model. This suggests that the respondents prefer the status quo, with the other things being equal. This may be because the respondents account for the transaction costs involved in signing up with improved water supply schemes. However, in the LC model, respondents belonging to segment 1 clearly preferred to move away from the status quo.
All tested models suggest that higher utility can be achieved by the selection of alternatives at a lower cost as a result of negative and significant price coefficients. Analyses also confirm the positive and highly significant impact of changes in the water quality parameter. This is supported by the positive coefficient of the fluoride concentration. This result implies that people may be aware of the current status of their water quality: improvements in water quality are valued more by those with lower-quality water.
The results also confirmed that the respondents' socioeconomic status and water quality parameters explain the observed preference heterogeneity for water service improvements over the SQ. Women prefer water supply improvements more than men, as reflected by the negative and highly significant coefficient of the gender variable in the CL interaction model. This gender effect has often been found in valuation studies focused on water (Whittington et al., 2002; Hensher et al., 2005a). It has also been found that there is a negative and significant relationship between age and preference for moving away from the current supply. Higher-income households likely spend more resources on averting behaviors and they are also willing to pay more for improved water quality. The LC model results indicate that educational attainment, engagement in averting behaviors, and the fluoride level of current drinking water are significant determinants of being in the higher quality preference segment.
Our results suggest that welfare estimates are sensitive to the choice of econometric specification. According to the CL and CL interaction models, households are willing to pay Rs 1,100 and Rs 1,077 per month, respectively, for the improvement of water quality. The LC model results highlighted significant preference heterogeneity between the two segments: segment 1 households are willing to pay WTP Rs. 2,616 and segment 2 households Rs. 306 per month for water quality improvements. Their weighted WTP is Rs 1,715 on the basis of the segment probabilities of the LC model. RPL is the best model in terms of statistical fit. It suggests households are willing to pay Rs 1,000 per month for water quality improvements, which accounts for around 72% of their total WTP for all water supply improvements, somewhat less than the CL and the weighted LC models suggested.
The RPL model provides richer and more reliable information than the CL and LC models. The WTP estimates were informative, showing that households are willing to pay more for water supply improvements (Table 9: Rs. 1,395 under scenario 1) and particularly for water quality improvement (Rs. 1,000 per month). The WTPs are significantly higher than the current average monthly payments for piped water supply—about Rs. 300 per month. This suggests that the estimated WTP would be sufficient to cover the long-run MC of water supply which is about Rs. 47 per unit (1,000 L) as estimated at the national level (Dharmaratna and Parasnis, 2012) and with an average household consumption of 17 units per month.
The results are highly relevant to the decision makers as they suggest that there is substantial potential for financing water supply improvements from supply charges and that there is public appetite for higher water charges if only the service and particularly water quality are improved. This is particularly so when there is an urgent need to find new sources of funding for water service improvements. The most important contribution of this research is the provision of new empirical evidence about the value of water quality improvements to the public and that it is possible to recover the cost of investments into water supply improvements from users at least in the long run. The results should also assure private investors about the economic feasibility of water supply projects or private–public partnerships in building, improving, and operating water supply systems. Such solutions would also help ensure the long-term financial sustainability of water supply projects.
The WTP estimates also confirm that water supply improvements would be affordable for the users as they are within the World Bank benchmark of affordability −4% of rural households' income. However, a subset of respondents would prefer a 24-h water supply at high pressure and with government management. The WTP for this level of service is much lower than for improved water quality. This result helps prioritize water supply improvements by strongly highlighting water quality improvement as a priority. Households prefer water supply by the NWSDB over that by the CBOs. Most CBOs have committed to participatory approaches in water provision, but lack the financial and technical capacities for effectively and sustainably operating water supply systems.
5. Conclusion
Existing piped water supply does not often meet social demand in developing countries which makes it important to elicit preferences and demand for water supply improvements. This research contributes to the literature on preferences and WTP for water supply improvements in piped water systems by applying a series of CE models. It also demonstrates how policy-relevant empirical evidence can be generated in a developing country context using the CE approach.
The results suggest that there is WTP for water supply improvements in general and especially for water quality improvements. The LC and RPL models better reflect observed data but the RPL model outperforms them in terms of statistical fit. According to the RPL model results, the mean WTP for water quality improvement is Rs. 1,000 per month and households are also willing to pay Rs. 177, Rs. 118, and Rs. 100 per month for the improvement of reliability, pressure level, and government sector water supply and management, respectively.
The results highlight the importance of considering preference heterogeneity between and within groups for public policy making. The results also suggest that privately funded improvements of water supply need to be evaluated using the cost–benefit analyses considering the demographic and socioeconomic characteristics of households.
This study only examined evidence from the NCP of Sri Lanka due to time and financial limitations. Public preferences may be different elsewhere where people have access to different water supply schemes providing different service levels. Therefore, there is a need to conduct further research of this kind in other locations in Sri Lanka. Furthermore, some households are aware of the poor quality of their drinking water, while others are not. Households were made aware of water quality indicators as part of the survey but with the time constraints of this research, it was not possible to re-evaluate preferences after the household were informed about the quality of their water. In future research, it would be important to better understand the relationship between information, preferences, and averting actions, and what difference learning can make for preferences and WTP.
Data availability statement
The original contributions presented in the study are included in the article/Supplementary material, further inquiries can be directed to the corresponding author.
Ethics statement
The studies involving human participants were reviewed and approved by Faculty Research Ethics Committee, University of Leeds. The patients/participants provided their written informed consent to participate in this study.
Author contributions
PSKR: conceptualization, methodology, data collection, data analysis, and drafting the original article. MT and JP: conceptualization, supervision, and writing-review and editing. All authors contributed to manuscript revision, read, and approved the submitted version.
Acknowledgments
Part of the content of this manuscript was presented (Poster) at the 15th Conference of the European Association of Environmental and Resource Economists (EAERE) that was held on 24–27 June, 2015 in Helsinki, Finland. This paper is part of a PhD completed in the Sustainability Research Institute, School of Earth and Environment, University of Leeds, UK and funded by the Commonwealth Scholarship Commission.
Conflict of interest
The authors declare that the research was conducted in the absence of any commercial or financial relationships that could be construed as a potential conflict of interest.
Publisher's note
All claims expressed in this article are solely those of the authors and do not necessarily represent those of their affiliated organizations, or those of the publisher, the editors and the reviewers. Any product that may be evaluated in this article, or claim that may be made by its manufacturer, is not guaranteed or endorsed by the publisher.
Supplementary material
The Supplementary Material for this article can be found online at: https://www.frontiersin.org/articles/10.3389/frwa.2023.1134660/full#supplementary-material
Abbreviations
AIC, Akaike Information Criterion; ASC, Alternative Specific Constant; BIC, Bayesian Information Criteria; CBA, Cost–Benefit Analysis; CBO's, Community Based Organizations; CE, Choice Experiment; CL, Conditional Logit; CV, Compensating Variation; CVM, Contingent Valuation Method; IIA, Independence of Irrelevant Alternatives; LC, Latent Class; LLR, Log Likelihood Ratio; MC, Marginal Cost; MWTP, Marginal Willingness to Pay; NWSDB, National Water Supply and Drainage Board; RP, Revealed Preference; RPL, Random Parameter Logit; RUM, Random Utility Model; SD, Standard Deviation; SDGs, Sustainable Development Goals; SP, Stated Preference; Rs, Sri Lankan Rupees; S.E., Standard Error; SQ, Status-Quo; TCM, Travel Cost Method; USD, United States Dollar; WHO, World Health Organization; WTP, Willingness to Pay.
References
Adamowicz, W., Louviere, J., and Swait, J. (1998). Introduction to Attribute-Based Stated Choice Methods. Report to NOAA Resource Valuation Branch, Damage Assessment Centre.
Ahsan, M., Hadiujjaman, S., Islam, M., Nasrin, N., Akter, M., Parvin, G., et al. (2021). Willingness to pay for improved safe drinking water in a coastal urban area in Bangladesh. Water Policy 23, 633–653. doi: 10.2166/wp.2021.031
Alaerts, G. J. (2019). Financing for water - water for financing: a global review of policy and practice. Sustainability 11, 821. doi: 10.3390/su11030821
Alpizar, F., Carlsson, F., and Martinsson, P. (2003). Using choice experiments for non-market valuation. Econ. Issues Stroke Trent 8, 83–110.
Altaf, M. A. (1994). Household demand for improved water and sanitation in a large secondary city: findings from a study in Gujranwala, Pakistan. Habitat Int. 18, 45–55. doi: 10.1016/0197-3975(94)90038-8
Bateman, I. J., Carson, R., Day, B., Hanemann, W., Hanley, N., Hett, T., et al. (2003). Guidelines for The Use of Stated Preference Techniques for The Valuation of Preferences for Non-Market Goods. Cheltenham, PA: Edward Elgar Publishing.
Beal, C. D., Gurung, T. R., and Stewart, R. A. (2016). Demand-side management for supply-side efficiency: modeling tailored strategies for reducing peak residential water demand. Sust. Prod. Consum. 6, 1–11. doi: 10.1016/j.spc.2015.11.005
Ben-Akiva, M. E., and Lerman, S. R. (1985). Discrete Choice Analysis: Theory and Application to Travel Demand. Cambridge: MIT Press.
Birol, E., Karousakis, K., and Koundouri, P. (2006a). Using a choice experiment to account for preference heterogeneity in wetland attributes: the case of Cheimaditida wetland in Greece. Ecol. Econ. 60, 145–156. doi: 10.1016/j.ecolecon.2006.06.002
Birol, E., Karousakis, K., and Koundouri, P. (2006b). Using economic valuation techniques to inform water resources management: a survey and critical appraisal of available techniques and an application. Sci. Total Environ. 365, 105–122. doi: 10.1016/j.scitotenv.2006.02.032
Blamey, R., Gordon, J., and Chapman, R. (1999). Choice modelling: assessing the environmental values of water supply options. Aust. J. Agric. Resour. Econ. 43, 337–357. doi: 10.1111/1467-8489.00083
Boxall, P. C., and Adamowicz, W. L. (2002). Understanding heterogeneous preferences in random utility models: a latent class approach. Environ. Resour. Econ. 23, 421–446. doi: 10.1023/A:1021351721619
Brouwer, S., Hofman-Caris, R., and van Aalderen, N. (2020). Trust in drinking water quality: understanding the role of risk perception and transparency. Water 12, 2608. doi: 10.3390/w12092608
Carlsson, F., Frykblom, P., and Liljenstolpe, C. (2003). Valuing wetland attributes: an application of choice experiments. Ecol. Econ. 47, 95–103. doi: 10.1016/j.ecolecon.2002.09.003
Dharmaratna, D., and Parasnis, J. (2012). An analysis of the cost structure of water supply in Sri Lanka. J. Asia Pac. Econ. 17, 298–314. doi: 10.1080/13547860.2012.668092
Dissanayake, C. B. (1996). Water quality and dental health in the Dry Zone of Sri Lanka. Geol. Soc. Lond. Special Public. 113, 131–140. doi: 10.1144/GSL.SP.1996.113.01.10
Freeman, A. M. (2003). The Measurement of Environmental and Resource Values: Theory and Methods. Washington, DC: Resources for the Future.
González-Santander, C., Sarrias, M., Daziano, R. A., and Roco, L. (2022). Valuing urban drinking water supply attributes: a case study from Chile. Water Resour. Econ. 39, 100204. doi: 10.1016/j.wre.2022.100204
Greene, W. H., and Hensher, D. A. (2003). A latent class model for discrete choice analysis: contrasts with mixed logit. Transport. Res. Part B Methodol. 37, 681–698. doi: 10.1016/S0191-2615(02)00046-2
Gschwandtner, A., Jang, C., and McManus, R. (2020). Improving drinking water quality in South Korea: a choice experiment with hypothetical bias treatment. Water 12, 2569. doi: 10.3390/w12092569
Hala, A. A., and Carlsson, F. (2004). Evaluating the Welfare Effects of Improved Water Quality Using the Choice Experiment Method. Working Paper in Economics 131, Department of Economics, University of Gothenburg.
Hanemann, W. M. (1984). Welfare evaluations in contingent valuation experiments with discrete responses. Am. J. Agric. Econ. 66, 332–341. doi: 10.2307/1240800
Hanley, N., Wright, R., and Adamowicz, V. (1998). Using choice experiments to value the environment. Environ. Resour. Econo. 11, 413–428. doi: 10.1023/A:1008287310583
Hensher, D., and Greene, W. (2003). The mixed logit model: the state of practice. Transportation 30, 133–176. doi: 10.1023/A:1022558715350
Hensher, D., Shore, N., and Train, K. (2005a). households' willingness to pay for water service attributes. Environ. Resour. Econ. 32, 509–531. doi: 10.1007/s10640-005-7686-7
Hensher, D. A., Rose, J. M., and Greene, W. H. (2005b). Applied Choice Analysis: A Primer. New York, NY: Cambridge University Press. doi: 10.1017/CBO9780511610356
Hutton, G., Haller, L., and Bartram, J. (2007). Global cost-benefit analysis of water supply and sanitation interventions. J. Water Health 5, 481–502. doi: 10.2166/wh.2007.009
Hutton, G., and Varughese, M. (2016). The Costs of Meeting the 2030 Sustainable Development Goal Targets on Drinking Water, Sanitation, and Hygiene. Washington, DC: World Bank. Available online at: https://openknowledge.worldbank.org/entities/publication/cfbfaf80-3930-5ffd-a5bf-6ded12a1340e (accessed March 2, 2023).
Ibrahim, N. S. C., Kamaludin, M., and Shaari, N. F. (2019). A discrete choice experiment to estimate public willingness to pay for attributes of water services in Terengganu, Malaysia. J. Ekon. Malaysia 53, 213–225. doi: 10.17576/JEM-2019-5302-16
Jalan, J., Somanathan, E., and Chaudhuri, S. (2009). Awareness and the demand for environmental quality: survey evidence on drinking water in urban India. Environ. Dev. Econ. 14, 665–692. doi: 10.1017/S1355770X08005020
Kanyoka, P., Farolfi, S., and Morardet, S. (2008). Households' preferences and willingness to pay for multiple use water services in rural areas of South Africa: an analysis based on choice modelling. Water SA 34, 715–723. doi: 10.4314/wsa.v34i6.183675
Kosenius, A. K. (2010). Heterogeneous preferences for water quality attributes: the case of eutrophication in the gulf of Finland, the Baltic Sea. Ecol. Econ. 69, 528–538. doi: 10.1016/j.ecolecon.2009.08.030
Lancaster, K. J. (1966). A new approach to consumer theory. J. Polit. Econ. 74, 132–157. doi: 10.1086/259131
Latinopoulos, D. (2014). Using a choice experiment to estimate the social benefits from improved water supply services. J. Integr. Environ. Sci. 11, 187–204. doi: 10.1080/1943815X.2014.942746
Lee, E. J., and Schwab, K. J. (2005). Deficiencies in drinking water distribution systems in developing countries. J. Water Health 3, 109–127. doi: 10.2166/wh.2005.0012
Louviere, J. J., Hensher, D. A., and Swait, J. D. (2000). Stated Choice Methods: Analysis and Application. Cambridge: Cambridge University Press. doi: 10.1017/CBO9780511753831
Mabhaudhi, T., Nhamo, L., Mpandeli, S., Nhemachena, C., Senzanje, A., Sobratee, N., et al. (2019). The water -energy - food nexus as a tool to transform rural livelihoods and well-being in Southern Africa. Int. J. Environ. Res. Public Health 16, 2970. doi: 10.3390/ijerph16162970
McFadden, D. (1974). “Conditional logit analysis of qualitative choice behaviour,” in Frontiers in Econometrics, ed P. Zarembka (New York, NY: Academic Press).
McFadden, D. (1986). The choice theory approach to market research. Marketing Science 5, 275–297. doi: 10.1287/mksc.5.4.275
Nam, P. K., and Son, T. V. H. (2005). Household demand for improved water services in Ho Chi Minh City: a comparison of contingent valuation and choice modelling estimates. Research Report, Economy and Environment Program for Southeast Asia(EEPSEA); 2005-RR3.
Otaki, Y., Honda, H., and Ueda, K. (2019). Historical self-comparison of water consumption as a water demand management tool. Water 11, 844. doi: 10.3390/w11040844
Otaki, Y., Honda, H., and Ueda, K. (2020). Water demand management: visualising a public good. PLoS ONE 15, e0234621. doi: 10.1371/journal.pone.0234621
Padmasiri, J. P., and Jayawardana, W. M. (2010). “Removal of alkalinity, hardness and fluoride in drinking water by electro coagulation:a study in Asokamalagama, Vilachchiya in Anuradhapura Distrcit,” in Symposium proceedings of the water professional day, Water Resources Research in Sri Lanka, 1st October 2010 (Peradeniya, Sri Lanka: Postgraduate Institute of Agriculture), 29–36.
Rajapakshe, P. S. K. (2014). Heterogeneous preferences for water service improvements: evidence from Anuradhapura District of Sri Lanka. J. Environ. Profess. Sri Lanka 3, 1–10. doi: 10.4038/jepsl.v3i1.7309
Revelt, D., and Train, K. (1998). Mixed logit with repeated choices: households' choices of appliance efficiency level. Rev. Econ. Stat. 80, 647–657. doi: 10.1162/003465398557735
Sachs, J., Schmidt-Traub, G., Mazzucato, M., Messner, D., Nakicenovic, N., and Rockström, J. (2019). Six transformations to achieve the sustainable development goals. Nat. Sust. 2, 805–814. doi: 10.1038/s41893-019-0352-9
Somanathan, E. (2010). Effects of information on environmental quality in developing countries. Rev. Environ. Econ. Policy 4, 275–292. doi: 10.1093/reep/req012
Swait, J. (1994). A structural equation model of latent segmentation and product choice for cross-sectional revealed preference choice data. J. Retail. Consum. Serv. 1, 77–89. doi: 10.1016/0969-6989(94)90002-7
Tarfasa, S., and Brouwer, R. (2013). Estimation of the public benefits of urban water supply improvements in Ethiopia: a choice experiment. Appl. Econ. 45, 1099–1108. doi: 10.1080/00036846.2011.613793
Tennakoon, T. (2004). “Dental Fluorosis in Anuradhapura District, Sri Lanka,” in Proceedings of the 4th International Workshop on Fluorosis Prevention and Defluoridation of water. 2–6 March 2004, Sri Lanka, 19–22. Colombo: ISFR, EnDeCo & ICOH.
Tortajada, C., Gonzalez-Gomez, F., Biswas, A. K., and Buurman, J. (2019). Water demand management strategies for water-scare cities: the case of Spain. Sust. Cities Soc. 45, 649–656. doi: 10.1016/j.scs.2018.11.044
Train, K. E. (1998). Recreation demand models with taste differences over people. Land Econ. 74, 230–239. doi: 10.2307/3147053
Vásquez, W. F., Raheem, N., Quiroga, D., and Ochoa-Herrera, V. (2022). Valuing improved water services and negative environmental externalities from seawater desalination technology: a choice experiment from the Galápagos. J. Environ. Manag. 304, 114204. doi: 10.1016/j.jenvman.2021.114204
Wang, J., Ge, J., and Gao, Z. (2018). Consumers's preferences and derived willingness-to-pay for water supply safety improvement: the analysis of pricing and incentive strategies. Sustainability 10, 1704. doi: 10.3390/su10061704
Whittington, D., Briscoe, J., Mu, X., and Barron, W. (1990). Estimating the willingness to pay for water services in developing countries: a case study of the use of contingent valuation surveys in Southern Haiti. Econ. Dev. Cult. Change 38, 293–311. doi: 10.1086/451794
Whittington, D., Lauria, D. T., Choe, K., Hughes, J. A., Swarna, V., and Wright, A. M. (1993). Household sanitation in Kumasi, Ghana: a description of current practices, attitudes, and perceptions. World Dev. 21, 733–748. doi: 10.1016/0305-750X(93)90030-D
Whittington, D., Pattanayak, S. K., Yang, J. C., and Bal Kumar, K. C. (2002). Household demand for improved piped water services: evidence from Kathmandu, Nepal. Water Policy 4, 531–556. doi: 10.1016/S1366-7017(02)00040-5
World Bank (1994). World Development Report 1994: Infrastruture for Development at Target. World Bank. Available online at: https://openknowledge.worldbank.org/handle/10986/5977 (accessed March 2, 2023).
Yacob, M. R., Radam, A., and Samdin, Z. (2011). Willingness to pay for domestic water service improvements in Selangor, Malaysia: a choice modeling approach. Int. Business Manag. 2, 30–39. doi: 10.3968/j.ibm.1923842820110202.004
Keywords: choice experiment, piped water supply, preference heterogeneity, private financing, willingness to pay
Citation: Rajapakshe PSK, Termansen M and Paavola J (2023) Public preferences for the improvement of existing piped water provision: a choice experiment in Sri Lanka. Front. Water 5:1134660. doi: 10.3389/frwa.2023.1134660
Received: 30 December 2022; Accepted: 28 March 2023;
Published: 21 April 2023.
Edited by:
Reza Kerachian, University of Tehran, IranReviewed by:
Alessandro Pagano, Istituto di Ricerca Sulle Acque IRSA-CNR, ItalySoroush Sharghi, University of Tehran, Iran
Copyright © 2023 Rajapakshe, Termansen and Paavola. This is an open-access article distributed under the terms of the Creative Commons Attribution License (CC BY). The use, distribution or reproduction in other forums is permitted, provided the original author(s) and the copyright owner(s) are credited and that the original publication in this journal is cited, in accordance with accepted academic practice. No use, distribution or reproduction is permitted which does not comply with these terms.
*Correspondence: Prasanna Sisira Kumara Rajapakshe, cHNrcjc1QHNzaC5yanQuYWMubGs=