
94% of researchers rate our articles as excellent or good
Learn more about the work of our research integrity team to safeguard the quality of each article we publish.
Find out more
ORIGINAL RESEARCH article
Front. Water, 24 March 2023
Sec. Water and Human Systems
Volume 5 - 2023 | https://doi.org/10.3389/frwa.2023.1130081
This article is part of the Research TopicWorld Water Day 2022: Importance of WASH, Equal Access Opportunities, and WASH Resilience - A Sanitation PerspectiveView all 4 articles
 Nienke Andriessen1*
 Eugene Appiah-Effah2†
 Shirley Josephine Iyamide Browne3†
 Rita al Jahjah4†Joel Kabika5†Joel Robert Kinobe6†
 Naomi Korir7†Pius Nishimwe3†
 Charles Buregeya Niwagaba8†
 Rohini Pradeep9†Prerna Prasad9†James Madalitso Tembo5†Andruga William3†Benjamin Ambuehl10
 Linda Strande1
Reasonable estimates for quantities and qualities (Q&Q) of fecal sludge that accumulate in onsite sanitation containments are fundamental for the design of appropriate management and treatment solutions, from community to city-scale. There are increasing attempts to improve Q&Q estimates, but current approaches are still at a conceptual level, and are not yet standardized with confirmed statistical relationships. To reach this level, we will need consistent approaches for planning, measuring, and global collaborations. Hence, the objectives of this study were: (1) to assess and compare Q&Q of fecal sludge from seven cities and communities, and explore statistical relationships that could be used to increase accuracy of Q&Q estimations; (2) to test and launch the Volaser device for measuring in situ volumes of fecal sludge; and (3) to capture lessons learned from field implementation with collaborators in seven countries during a global pandemic when no international travel was possible. The study took place in Ghana, India, Lebanon, Kenya, Sierra Leone, Uganda, and Zambia during the COVID-19 pandemic. Q&Qs were measured in 204 containments with a Volaser, laboratory analysis, and questionnaire. Results indicate that there are differences in Total Solids (TS) and Chemical Oxygen Demand (COD) in fecal sludge based on containment type, toilet type, source, and whether there is a water connection on the premises. Based on the results of this study, together with previously published open-source data, an empirical relationship for Volatile Solids (VS) and TS of 0.49 (R2 = 0.88) was established using 1,206 data points. For COD/TS, no significant relationship was observed. Developing such empirical relationships will be useful for planning and modeling approaches. An external evaluation was conducted to evaluate overall project management, Volaser technology transfer, and effects of collaborating during the COVID-19 pandemic. Success factors for collaborating with new and existing partners without face-to-face meetings included laboratory capacity and experience with analytical methods, study objectives that were relevant for the partner and locality, and a strong quality assurance plan to ensure comparability of results. The lessons learned can be taken forward as ways to reduce carbon footprint, and contribute to resilient, inclusive development research projects.
Fecal sludge is defined as what accumulates during storage in onsite containment of non-sewered sanitation. Fecal sludge management (FSM) could provide a long-term safe sanitation solution, if appropriate management happens across the entire sanitation service chain (i.e., capture, containment, collection, transport, treatment, and safe enduse or disposal). Unfortunately, sustainable implementations are still grossly lacking worldwide, and exposure risks to public health due to non-functional service chains remain high. For example, “uncontained” septic tanks and containment outflows that discharge directly to the urban environment (Odagiri et al., 2021), illegal dumping, and inadequate treatment (Okaali et al., 2022). However, the importance of a FSM service chain to protect public health is gaining recognition, and as a result the demand for infrastructure and services to manage fecal sludge is increasing (Vijayan et al., 2020). To succeed in achieving city-wide inclusive sanitation, sanitation cannot be a “one-size-fits-all” approach, and will need integration of multiple modes of sanitation (Gambrill et al., 2020). In order to reduce outflows, illegal dumping, and poor treatment performance, an improved understanding of the quantities and qualities (Q&Q) of fecal sludge that accumulate in onsite containment is needed. This is fundamental for the design of appropriate and sustainable infrastructure and services, from a community to city-scale, such as scheduled emptying campaigns (Mehta et al., 2019), and treatment technologies (Tembo, 2019; Wanda et al., 2021). If Q&Q of fecal sludge are not well-understood, there is a high-risk of technology failure due to treatment facilities not being sized correctly (Bassan et al., 2015), which is currently the case with over-sized facilities that are not operating as designed, or under-designed facilities that are over-loaded. Neither are providing adequate protection of public or environmental health (Klinger et al., 2019).
City-scale estimations of Q&Qs of fecal sludge are complicated by the fact that fecal sludge is stored underground, often in informal, unregulated containments, with no level of standardization (Isunju et al., 2013). In addition, fecal sludge is much more variable than municipal wastewater, with up to two orders of magnitude higher concentrations of Chemical Oxygen Demand (COD) (Strande et al., 2021). Attempts at making city-wide projections are increasing, for example in Cambodia, Cameroon, Ghana, India, Uganda and Zambia (Fanyin-Martin et al., 2017; Strande et al., 2018; Tembo et al., 2019; Andriessen et al., 2020; Eliyan et al., 2021; Prasad et al., 2021; Wanda et al., 2021). However, approaches remain time and resource intensive, highlighting the need for more efficient approaches to data collection and analysis. At the same time, progress is being made on developing methods of analysis for characteristics of fecal sludge (Velkushanova et al., 2021). However, rigorous attempts at validation of precision and ruggedness are still required prior to the development of standard methods (APHA, 2017). In addition, several tools are in development to measure Q&Q, such as a portable penetrometer for viscosity (Radford and Sugden, 2014), the Volaser volume measuring device (Koottatep et al., 2021), and the Sludge Snap (a smartphone application for predicting characteristics based on image information) (Ward et al., 2021a), but technology transfer from development into uptake and use by practitioners lags.
What is needed to tackle these needs, are global partnerships of experts from professional communities working together to ensure co-creation and ownership of knowledge (Carrard et al., 2022), which requires rigorous quality control measures and transparency. Successful research projects fulfill criteria in five dimensions: management, procedures, human factors, project related factors, and circumstances (Alias et al., 2014). To achieve this, research projects in the development and cooperation sector need to address open-access to knowledge (Carrard et al., 2022). In addition, when the SARS-CoV-2 virus was declared a global pandemic (further referred to as the COVID-19 pandemic in this paper), it greatly exacerbated every dimension of development research, increasing the need for innovative and agile project management (Sharma et al., 2022). In this project, we adapted our strategy from face-to-face field visits and in person workshops, to a fully digital project collaboration.
The objectives of this study were: (1) to assess and compare Q&Q of fecal sludge from seven cities and communities, and explore statistical relationships that could be used to increase accuracy of Q&Q estimations; (2) to test and launch the Volaser measuring device for in situ volumes of fecal sludge; and (3) to capture lessons learned from field implementation with collaborators in seven countries during a global pandemic when no international travel was possible.
The Volaser (volume-laser) is a device that can measure in situ fecal sludge volume and containment volume (Figure 1), and was developed by Eawag between 2018 and 2021. It consists of a tripod, a rod with a lidar laser distance sensor, and is operated with a smartphone application. The laser sensor is inserted through the access port of a containment, and measures the internal area of the containment and distance to sludge. A 3 m long collapsible probe is used to measure the total containment depth, and the smartphone application automatically calculates the respective volumes. A measurement takes <5 min. A Volaser can be constructed anywhere: it consists of parts that can be ordered online (e.g., the distance sensor) and parts that can be 3D printed locally. In this study, the Volaser was used to measure containment volume and fecal sludge volume. For septic tanks with multiple chambers only the first chamber was measured. Accuracy of the Volaser was determined as part of the product development phase, by reading the response of the distance laser at various distances (5, 10, 20, 30, 50, 100, 200, 300, 400, and 500 cm, measured with a measuring tape) and surfaces. The data of the accuracy tests is provided in the Supplementary material. More information on the Volaser can be found on www.sandec.ch/volaser.
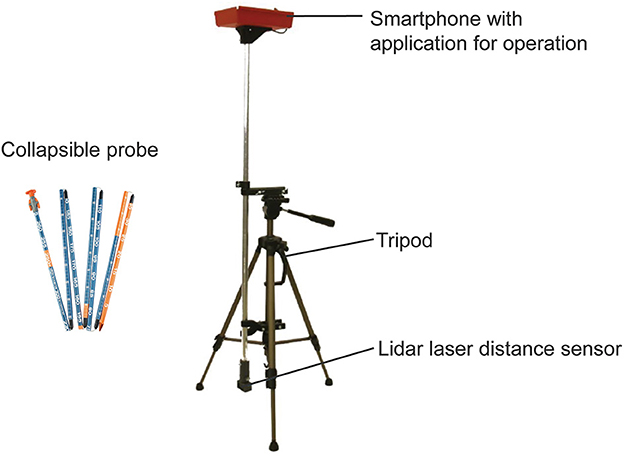
Figure 1. A Volaser device.
Originally, Eawag planned to launch the Volaser as part of a workshop on implementing the Q&Q methodology (Strande et al., 2021) at an international conference. When the COVID-19 pandemic was declared in March 2020, international conferences were canceled, travel was restricted, and this was no longer possible. Therefore, the launch was changed to a field implementation of the Q&Q methodology and Volaser technology taking place in seven countries (Ghana, India, Lebanon, Kenya, Sierra Leone, Uganda, and Zambia), with project coordination by Eawag. The funders approved to reallocate the funds due to the pandemic situation. The project took place between March 2021 and June 2022, with a flexible timeline, as lockdowns in the various countries were staggered. The overall project team included eight institutions (one research institute for overall project coordination and seven field implementation partners: three universities, two private companies, and two non-governmental organizations), with a project manager at each institution. The field partners were selected based on availability, commitment, laboratory capacity, and interest in the study objectives. One initial collaborator was not able to complete the project due to extenuating circumstances of the pandemic. At this point, a new partner was recruited.
The Q&Q methodology in Strande et al. (2021) is based on the premise that spatially analysable types of demographic, environmental and technical (DET) information (e.g., population density, elevation, containment type) could explain fecal sludge Q&Q. Following the Q&Q methodology, each partner selected the relevant sampling area, and then made a sampling plan that took into account expected DET differences, for example different containment types or geographical differences like altitude. The target was 30 samples, but was flexible based on local situation. The cities and communities where samples were taken per country are listed in Table 1. For ease of communication, in this paper we refer to the data from each partner as the country they work in. However, results are specific to the cities or communities that the samples were taken, and may not be applicable to the entire country.
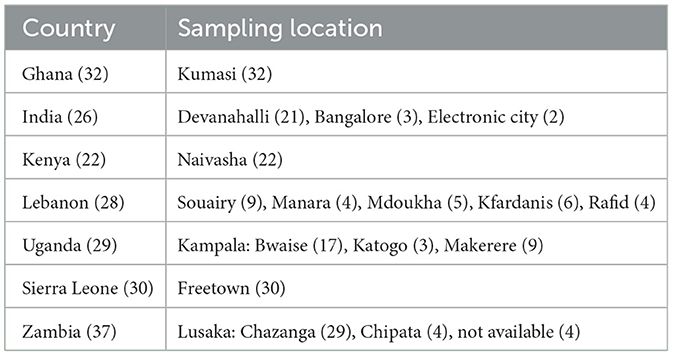
Table 1. The cities/communities where samples were taken per country, with number of samples taken in brackets.
At the start of the project, an online training was conducted to train all partners on the study setup, Q&Q methodology, quality assurance and quality control (QA/QC) strategy and Volaser use. A budget of 4,000 CHF was allocated to each partner for project management, sampling and analytical costs. All partners received a Volaser device to measure quantities of fecal sludge (Figure 1). Volasers were assembled in Switzerland and shipped to the respective partner, with the exception of the Ghanaian partner, who built the Volaser locally.
The sampling procedure was conducted according to Koottatep et al. (2021). Each field partner had a locally-built core sampler (Figure 2A) or pit sampler (Figure 2B). The pit sampler was inserted into the pit latrine three times, and a sample was taken at three different depths (bottom, middle and top of the sludge). The three samples were collected in a bucket, stirred well, and a representative composite sample was taken for analysis. The core sampler was inserted into the containment until it reached the bottom. The core sampler was closed, and pulled out of the tank. The contents of the core sampler were captured in a bucket, mixed well, and a representative composite sample was taken for analysis. Samples were stored in a cooler box during transportation to the laboratory, and stored for a maximum of 72 h in a refrigerator at 4°C until analysis.
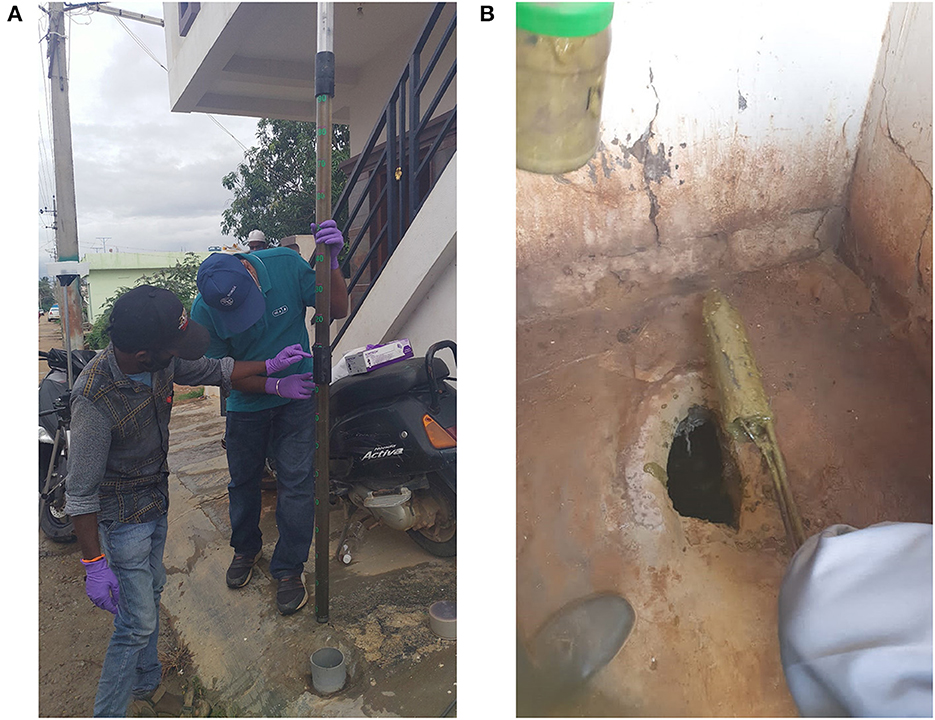
Figure 2. (A) Example of a core sampler, used in India. (B) Example of a pit sampler, used in Zambia.
At each sampling location, DET information was collected with a questionnaire using Kobo Toolbox on a mobile phone. Containment types were defined in advance: pit latrines are (partially) lined or unlined “long-drop” containments; septic tanks were defined as lined, flow-through tanks with an outflow, often with multiple chambers; holding tanks were defined as fully lined, watertight tanks without an outflow; cesspits/leach pits were defined as unlined or partially lined containments with or without an outflow, where (uncontrolled) leaching into the soil is likely happening. Access to containments for sampling was a challenge in multiple cities (e.g., access ports to septic tanks were plastered closed). Therefore, the distribution of containment types in this study are not necessarily representative of all onsite sanitation technologies on a city level. All partners used the same questionnaire, with some adaptations to make them locally appropriate. Questionnaire respondents were either the person responsible for maintaining the onsite sanitation system, or the main responsible of the household available at the time of visit. The list of questions used in the questionnaire is available in the Supplementary material and can be used as an example questionnaire for future Q&Q studies.
Laboratory analysis was done at the local laboratory of each of the collaborating institutions. Total solids (TS), volatile solids (VS), pH, and electrical conductivity (EC) were quantified according to Velkushanova et al. (2021). In Sierra Leone, VS was not measured due to a lack of required laboratory equipment. In Ghana, TS was measured gravimetrically as g/g wet weight, and was converted to concentration using a density of 1.097 kg/m3 (an average from measurements by Tembo, 2019; Ward et al., 2021b). COD was quantified by closed reflux colorimetric method in India, Ghana, Kenya, Lebanon, Uganda and Sierra Leone, and the closed reflux titrimetric method was used in Zambia.
As this study was conducted independently in seven different countries, a rigorous QA/QC approach was implemented to ensure comparability of results. QA measures to ensure consistent practices across all locations included: collaborators used existing COD method (minimizing errors with learning a new method); every collaborator had a dedicated project manager responsible for local coordination (sampling teams, laboratory analysis, coordination with PIs); all partners used the same data recording template; and the common kick-off training was recorded and available online in case it needed to be reviewed. The QC strategy for analytical work is presented in Table 2. In Uganda, single measurements for COD were done.
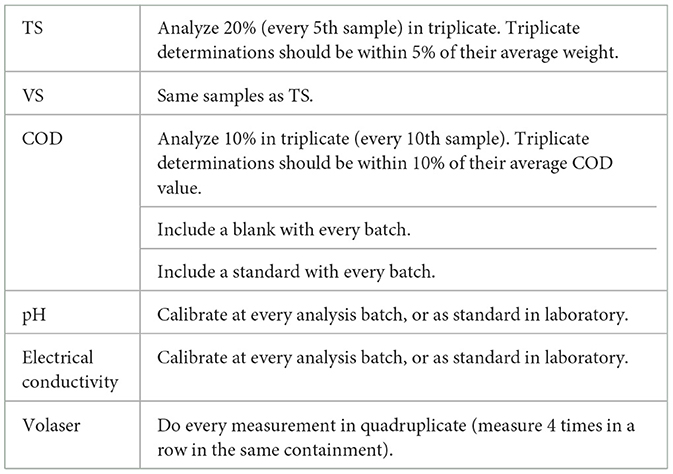
Table 2. The QC strategy used by all collaborators for laboratory analysis.
Data analysis was done in R Studio, version 1.3.1073 “Giant Goldenrod”. The full dataset is available open access online: https://doi.org/10.25678/0007KN. Normality of the laboratory parameters was tested with a Shapiro-Wilk test. Fecal sludge accumulation rate was calculated as:
If in the questionnaire the respondent answered that the containment was not fully emptied during the last emptying event, it was assumed that 50% of the volume was emptied, and the “Volume of fecal sludge measured with Volaser” was multiplied by 0.5. If an onsite sanitation system was never emptied, the containment age from the questionnaire information was used as “Time since last emptying”. Containment age was collected as categorical data, so the middle value in the category was used for “Time since last emptying”: 0.5 year for “Less than 1 year old”; 3 years for “1–5 years old”, 8 years for “6–10 years old”, and 15 years for “More than 10 years old”. A sensitivity analysis was conducted to assess the effect of these assumptions on accumulation rate results, and is provided in the Supplementary material. In Zambia, the Volaser experienced technical failures and could not be used for all data points. Therefore, in Zambia “Volume of fecal sludge” was calculated by measuring the outside of the containment with a tape measure and multiplying that by the sludge level as measured with the Volaser depth probe. Relative absolute deviations (as a percentage) were calculated for laboratory replicates and Volaser measurements by subtracting the triplicate mean from each individual replicate, dividing that by the triplicate mean and multiplying by 100. Absolute average deviations were then calculated per triplicate trio. Any data points with >50% relative deviation were removed from the analysis.
An external evaluation was conducted with members of the project team to evaluate success factors and barriers of overall project management, technology acceptance, and the influence of the pandemic. The evaluation consisted of two separate focus group discussions, in order to avoid social desirability bias: one with the Eawag team (who were responsible for overall project management) and one with the project managers of each of the other institutions. In the online focus group discussions, interviews focused on cognitive debriefing (Cheng and Clark, 2017). Cognitive debriefing provided a method to articulate data that directly addressed the three discussion points, and information related to group meanings, processes, and new inductively derived themes from the socio-cognitive perceptions of the participants (Massey, 2011). During the focus group discussions, the interviewer first presented the guiding questions. The group was then free to elaborate on aspects they identified as important. Based on specific interests and a prepared set of questions, the interviewer directed the discussion to learn more about a particular topic. The interview questions can be found in the Supplementary material. During data analysis, common themes were identified using qualitative content analyses (Mayring, 2004), and compared amongst the two groups of participants.
Accuracy of the Volaser was determined as part of the product development phase, and data from the accuracy tests are reported in the Supplementary material. The Volaser had an average deviation of 2.6 cm. In general, relative deviation was higher at shorter distances (around 20% at 5–10 cm), which matches which the specifications of the distance sensor used (TFmini Plus). Precision was evaluated in this study (i.e., how close four replicate in situ measurements were). Median relative deviation for measuring fecal sludge volume was 9.8%. Median relative deviation for measuring containment volume was 9.4%. Some devices had lower relative deviations than others. As with all QA/QC, replicates should be included and reported also with measurements.
The Volaser was designed with the goal that parts can be ordered and assembled anywhere for <$350. In this study, constructing multiple Volasers at once reduced costs per unit. Ordering the various parts was the most time intensive step, as shipping times could be long. Feedback for improvement of the device mentioned that phone compatibility is currently only with Android phones with a USB-C port, and a weak spot in the device is the point where the phone cable connects to the laser sensor. Taken together, the device is easy to use and construct, and the current restrictions identified in this study will be addressed in the next product development phase. A Volaser assembly and operation manual with accompanying videos are in preparation, and will be available early 2023 on www.sandec.ch/volaser.
Characteristics of fecal sludge in this study are presented in Figure 3. The characterization results (i.e., pH, EC, VS, TS, COD) did not follow a normal distribution (Shapiro-Wilk test <0.05), as is commonly observed with characteristics of fecal sludge (Gold et al., 2018; Englund et al., 2020; Doglas et al., 2021; Strande et al., 2021). Hence, medians are reported as more representative, or when reporting mean and standard deviation, we also report how far apart the mean and median are. For non-normal data, statistical tests that assume normality are not valid, and non-parametric tests should be used (e.g., Prasad et al., 2021). There is no standardized way of reporting Q&Q of fecal sludge data in the literature, and a multitude of reporting formats can be found (e.g. means with standard deviations, medians and quartiles, per containment type), which complicates comparison between studies. Therefore, when comparing to the literature we report both the mean and medians from this study.
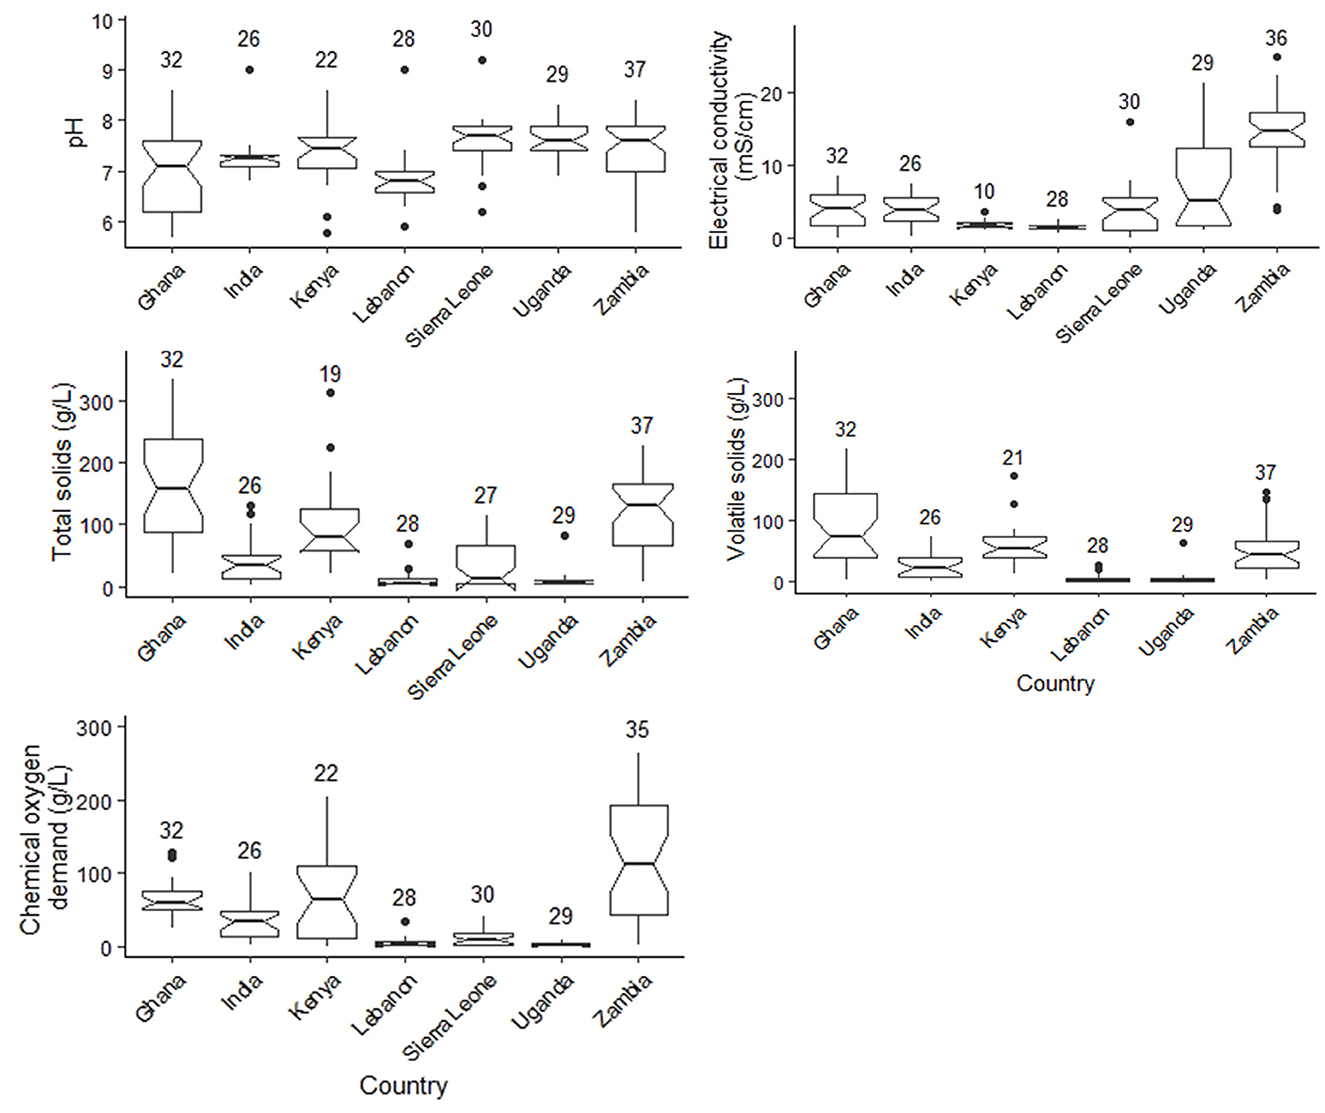
Figure 3. Characteristics of fecal sludge per location. The number above each boxplot represents the number of samples in that category (n), notches in boxplots show confidence interval around the median.
When comparing the results from the seven countries in this study to each other, Lebanon, Uganda and Sierra Leone had the lowest concentrations, Ghana, Kenya, and Zambia the highest, and India in between (Figure 3). Other than a few outliers, pH and EC values fall within reported ranges of 6.5–8.0 for pH (Strande et al., 2014), and 0.14 and 24.8 mS/cm for EC (Appiah-Effah et al., 2014; Semiyaga et al., 2017; Gold et al., 2018; Andriessen et al., 2020; Ward et al., 2021b). Comparing results by reported country, TS, VS, and COD for Zambia and India in this study were similar to what has been previously reported, whereas Kenya and Ghana were higher, and Uganda lower. TS, VS, and COD for Zambia in this study were highly variable, but within the same range as previous studies in Lusaka, including means of 208.4, 52.6, and 161.2 g/L for TS, 131.3, 70.2, and 90.9 g/L for VS, and 129.4, 72.1, and 122.6 g/L for COD (Tembo, 2019; Ward et al., 2021b). Both references report TS content gravimetrically, so for comparison here their results were converted to g/L with an average density of 1,097 kg/m3 (Tembo, 2019; Ward et al., 2021b). Results from India in this study (median 34.7 g/L TS, 22.3 g/L VS, and 33.1 g/L COD) were also comparable to those observed in Prasad et al. (2021), with median 26.8 g/L TS, 17.8 g/L VS, and 32.0 g/L COD. In contrast to this study where mean TS was 155.0 g/L for pit latrines and 59.2 g/L for septic tanks, Mugambi et al. (2020) report an average TS of 12.8 g/L for residential pit latrines and 7.5 g/L for septic tanks in Naivasha, Kenya. In Ghana, this study showed higher values for TS: 157.4 g/L, VS: 73.6 g/L, and COD: 60.0 g/L, than values ranging from 0.75 to 63.1 g/L for TS, 0.55 to 0.89-g/L for VS, and 0.8 to 48 g/L for COD reported by Ahmed et al. (2019). However, the data from Ahmed et al. (2019) is from Accra, whereas the results in this study are from Kumasi. In this study, TS, VS, and COD concentrations in Kampala, Uganda are much lower and less variable than what has previously been reported, 11.9-255.1 g/L for TS, 7.1–88.5 g/L for VS, and 7.8–176.1 g/L for COD (Semiyaga et al., 2017; Gold et al., 2018; Strande et al., 2018). Generally, in Zambia, Ghana and Kenya values were higher and more variable than in other countries (for TS, VS, EC, and COD). In Lebanon, characteristics had very low variability, which could be explained that in this country almost exclusively cesspits/leach pits were sampled, this was different than for the other countries (Figure 4). To the best of our knowledge, characteristics for fecal sludge in Sierra Leone and Lebanon are not reported in the literature. Overall, the results of this study confirm that characteristics of fecal sludge are highly variable, and although characteristics are context specific, variability exists between studies within the same city conducted at different times.
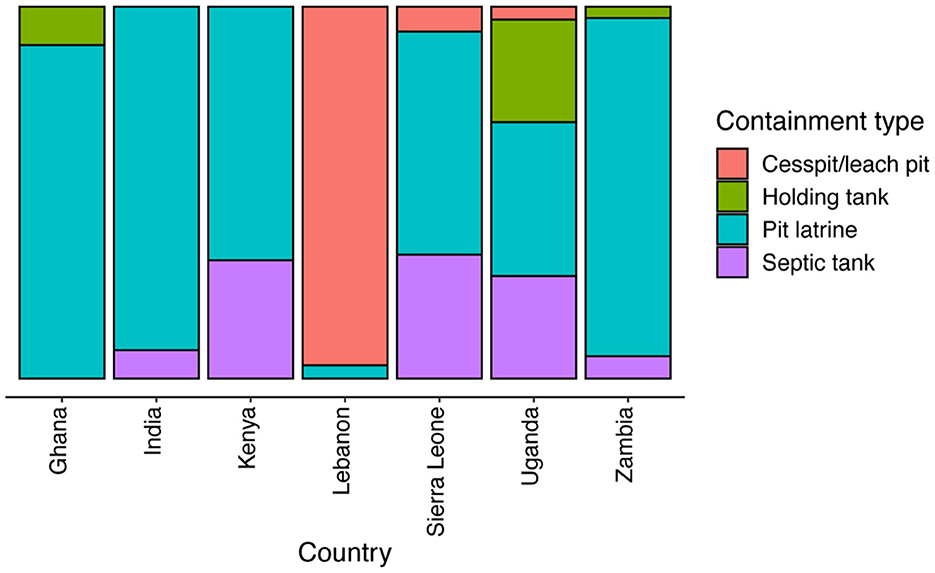
Figure 4. Distribution of the different containment types sampled by each partner.
Characteristics of fecal sludge were analyzed for differences based on the collected categories of DET data (e.g., number of users, rainy season, containment type). Overall, pit latrines had a significantly higher concentration of TS, VS, and COD than other containment types (Figure 5). Toilet type also explained variation in TS, VS, and COD, where dry toilets had higher values than pour-flush toilets and cistern flush toilets. This is expected, as water added during the flush will increase dilution of the sludge. Whether there was a water connection on the premises or not was another DET factor that made a difference in TS, VS, and COD, as has also been observed in other studies (Strande et al., 2018; Eliyan et al., 2021).
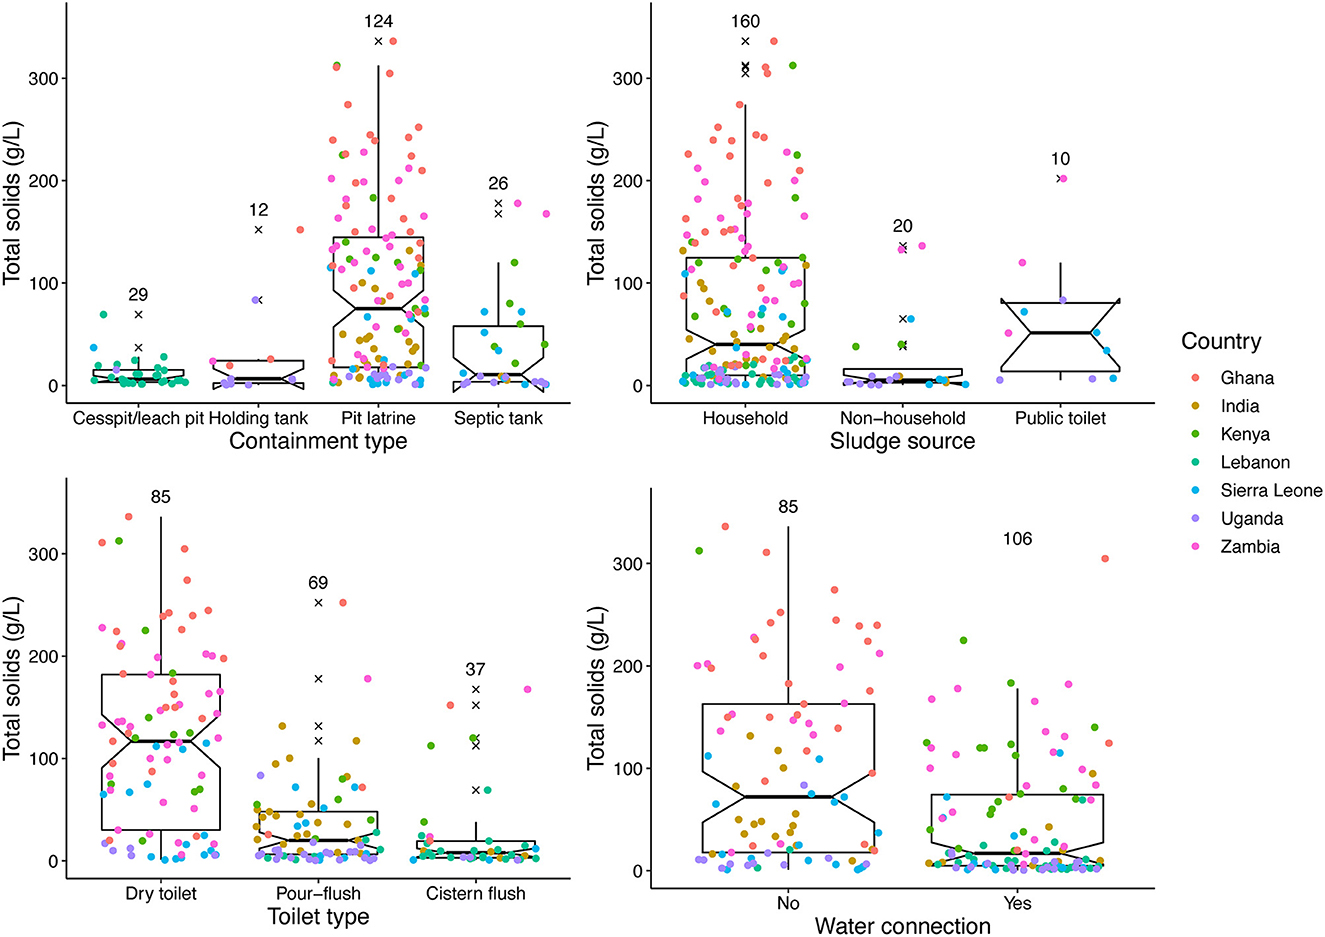
Figure 5. Boxplots with TS by categories of containment type, sludge source, toilet type, and water connection. The number above each boxplot represents the number of samples in that category (n), notches in boxplots show confidence interval around the median, outliers are marked with a ×.
When analyzing DET data per country, in three countries (Kenya, India, Ghana) there was a significant difference between pit latrines and other containment types for TS, VS, and COD, but for other countries there were not enough data points in each containment category to make statistical conclusions (e.g., no boxplot could be produced). This confirms that collecting more data points per location is useful to improve resolution of results, and to focus on collecting a more or less even distribution of data points across containment types. This was also the case for other parameters (e.g., sludge source). The goal of Q&Q data analysis is to find the DET parameters that best predict characteristics, and use them to calculate a weighted average.
Based on these results, together with previous studies evaluating characteristics of fecal sludge, containment type (i.e., pit latrine vs. other containments), toilet type (i.e., dry toilet vs. other pour-flush or cistern flush), source (i.e., household vs. non-household sources), and whether there is a water connection on the premises (i.e., yes or no) are consistently the strongest predictors of TS and COD (and less clearly also VS) (Fanyin-Martin et al., 2017; Semiyaga et al., 2017; Strande et al., 2018; Andriessen et al., 2020; Krueger et al., 2021; Wanda et al., 2021; Ward et al., 2021b). These empirical relationships should be further validated in future studies and meta-analysis of existing datasets. Synthesizing and validating these generalized relationships could overall improve the accuracy of community- to city-wide projections of accumulating fecal sludge, and improved planning and design of fecal sludge treatment plant for the protection of public health and the environment.
It could be especially useful to identify consistent relationships among characteristics not only for individual cities, but also across regions, which would provide another way to increase accuracy of predictions while reducing costs (Englund et al., 2020). For example, the planning and design of municipal wastewater treatment plants, relations like VSS/TSS ratio of 0.74–0.85 for untreated wastewater are commonly assumed (Rieger et al., 2012; Tchobanoglous et al., 2014). As shown in Figure 6A, in this study a strong correlation between VS and TS (R2 = 0.88) with a slope of 0.52 was observed with data from all seven countries. In addition, when combining the VS/TS in this study with 1,206 data points from six previously reported open data sets, a very similar correlation is observed (Figure 6B). The equation slope of 0.49 is also consistent with other reported values for VS/TS of 0.64 ± 0.12 and 0.50 ± 0.16 (Semiyaga et al., 2017); 0.67 ± 0.09 (Wanda et al., 2021), 0.54 ± 0.20 and 0.56 ± 0.17 (Ward et al., 2021b); 0.77 ± 0.01 and 0.80 ± 0.02 (Appiah-Effah et al., 2014). Observed VS/TS ratios for fecal sludge are lower than for wastewater, which is as expected, because fecal sludge undergoes varying levels of stabilization during storage in onsite containment, while wastewater is directly transported via the sewer to the treatment plant. Although a significant relation exists, it is important to note that with a R2 of 0.88 there is still ±12% variance (Figure 6B). In addition, the nature of VS in fecal sludge appears to be less readily biodegradable than in wastewater (Maqbool et al., in preparation).
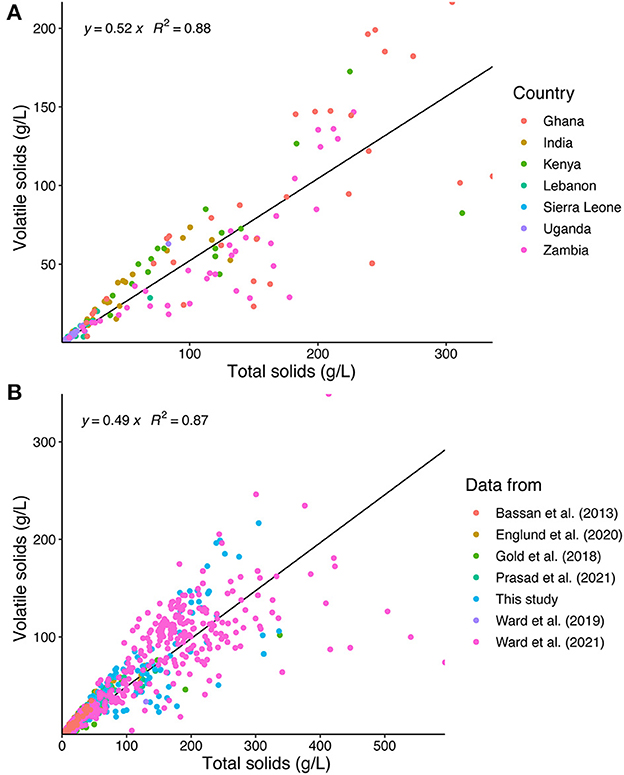
Figure 6. Linear correlation between TS and VS, with trend lines forced through origin. (A) For all locations in this study combined. (B) This study with other available datasets (total n = 1,206): Burkina Faso (n = 56) (Bassan et al., 2013); Uganda and Vietnam (n = 240) (Englund et al., 2020); Japan, Switzerland, Uganda, Vietnam (n = 91) (Gold et al., 2018); India (n = 164) (Prasad et al., 2021); Ghana, India, Kenya, Lebanon, Sierra Leone, Uganda, Zambia (n = 204) (this study); Senegal and Tanzania (n = 25) (Ward et al., 2019); and Zambia (n = 426) (Ward et al., 2021b).
In contrast, as shown in Figure 7A, COD/TS ratios in this study did not follow any overall trends. Uganda, India, Ghana and Zambia display strong correlations of R2 > 0.75, while for other countries there is no clear correlation. Only Zambia had a COD/TS of the range reported in Strande et al. (2021), of 0.89–1.20 with an R2 of 0.80–0.93 for five cities. This has also been observed in other studies, for example a COD/TS of 0.86 (R2 = 0.93) in Nairobi, Kenya (Junglen et al., 2020). These relations seem to be particularly influenced by samples with a lower COD/TS ratio. For example, for Kenya there are a couple of such outliers that affect the slope of the linear model. For some countries, as in Sierra Leone where many unlined pit latrines were sampled, the low COD/TS could be due to higher soil content in the fecal sludge, although sand or soil content was not measured in this study. The overall average COD/TS in this study was 0.94 ± 1.3, or 0.33–1.05 from 1st to 3rd quartile, which is much higher than the 0.60–0.65 that can be expected for municipal wastewater influent (Tchobanoglous et al., 2014). To account for the skewed data, COD/TS was analyzed in a log10 scale, which did improve the linear model fit for most locations (Figure 7B). When evaluating local trends with very skewed (non-normal) Q&Q data, it is advisable to attempt fitting the data on a log scale, but it is important to keep in mind that clear statistical patterns may not be observed everywhere. What is clear from this study, is that COD/TS does not follow as clear of a trend as VS/TS, and there is much greater variability in the results.
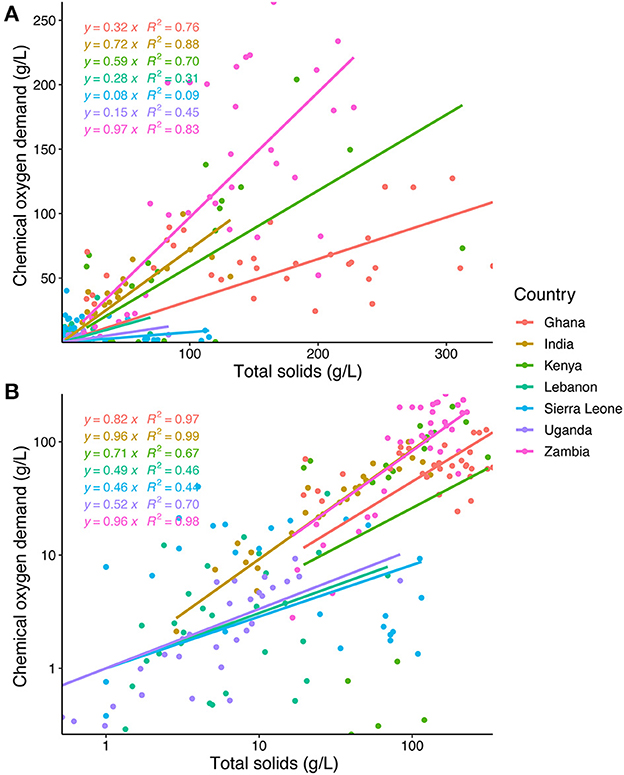
Figure 7. (A) Linear correlations between TS and COD for each country in this study, with the regression lines forced through the origin. One outlier was removed from the Uganda dataset. (B) Linear correlations between TS and COD on a log10 scale.
In this collaboration, where laboratory analysis was conducted in parallel in seven countries, it was of utmost importance that all partners followed the same QA/QC protocol. Without proper QA/QC, conclusions cannot be made about the accuracy or precision of measurement values, and it is not possible to compare values amongst each other, within a city, between countries, or to the literature. Relative absolute deviations were calculated to assess the variation between laboratory replicates. For TS, the range of relative deviation between laboratory replicates was 0.01–30.6%, with a median of 6.1%. For VS, the range of relative deviation between laboratory replicates was 0.01–37.6%, with a median of 8.3%. For COD, the range of relative deviation between laboratory triplicates was 0.04–24.5%, with a median of 4.3%. There was no correlation between TS concentration of sludge and relative deviation of TS, VS, and COD measurements, confirming that it is not more difficult to obtain precise replicate measurements for thicker fecal sludge than for more liquid sludge. For exact QA/QC values, see the complete raw dataset: https://doi.org/10.25678/0007KN. As these results show, variation between replicate measurements is to be expected. However, most of the laboratory replicates in this study have an acceptable variation of <10%, albeit more than 5%, which is the standard for wastewater analysis (APHA, 2017). Although progress is being made on method development, standard methods and standards for laboratory error specifically for fecal sludge have not yet been established (Velkushanova et al., 2021). Precise and accurate measurements of fecal sludge are challenging, and as standards are developed, it needs to be determined what acceptable variations are. Replicates for QC increase the total number of analyses, and impinge on available resources, but opting for more samples without QC is not meaningful. What is needed to move the sector toward standard methods, and what this study would have benefited from, is to evaluate split samples in multiple laboratories. This was beyond the scope of this study, but is a planned activity of the Global Partnership of Laboratories for Fecal Sludge Analysis.
Overall accumulation rates for this study are presented in Table 3. The results are heavily skewed, as highlighted by the large difference between the mean and median. There are a few extremely high outliers, which were mainly cesspits/leach pits in Lebanon. All but one of these did not have an outflow, explaining the need for frequent emptying. This has also been observed elsewhere in the region, where in the West Bank with the same type of containments, cesspits/leach pits are emptied 7–24 times per year (Thaher et al., 2022). In general, cesspits had significantly larger containment volumes than other containment types had the most dilute sludge (i.e., median TS was lowest for this category), and were all from households. As shown in Figure 8, cesspits/leach pits operated in this fashion have highly variable accumulation rates, including much higher rates than the 300 L/cap·year reported by Koottatep et al. (2012).
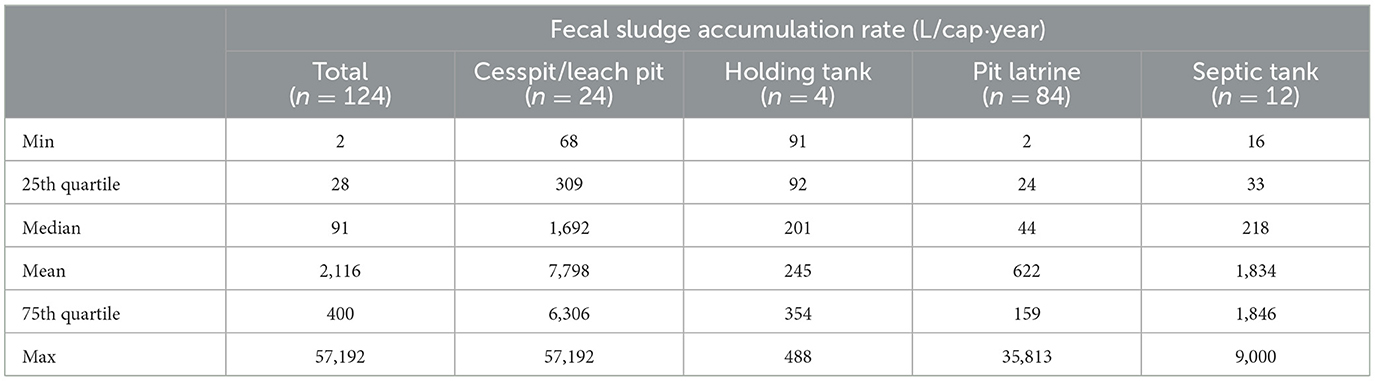
Table 3. Descriptive statistics of fecal sludge accumulation rate, for all data combined, and per containment type.
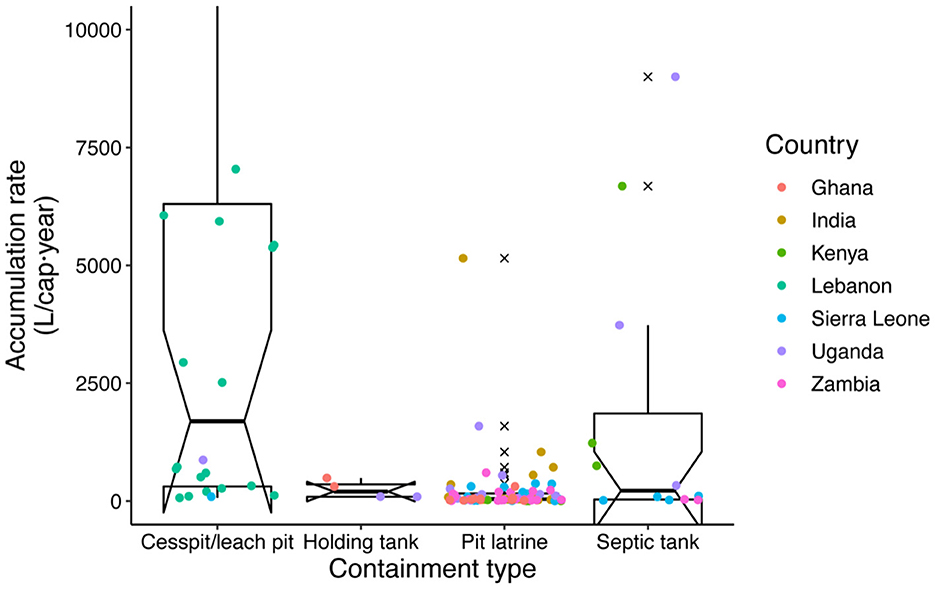
Figure 8. Boxplot of fecal sludge accumulation rate by containment type. The y-axis is capped at 10,000 L/cap·year to improve readability, but actually runs until 60,000 L/cap·year. Notches in boxplots show confidence interval around the median, outliers are marked with a ×.
In this study, the highest accumulation rates were all from recently emptied (<1 year) containments, which were also emptied frequently (i.e., emptying interval of emptied monthly up to <1 year). High emptying frequency is clearly tied to high accumulation rates, and has also been observed in other studies (Koottatep et al., 2012; Mills et al., 2014; Strande et al., 2018; Andriessen et al., 2020; Mac Mahon et al., 2022). Median accumulation rates in this study also correspond to ranges reported by others, including 50–280 L/cap·year for septic tanks (Strande et al., 2018; Mac Mahon et al., 2022), and 14–270 L/cap·year for pit latrines (Mills et al., 2014; Lugali et al., 2016; Strande et al., 2018). Across all types of DET data, the strongest predictor of accumulation rate was containment type. In addition, higher accumulation rates were observed when a water connection was present, which has also been previously observed (Strande et al., 2018; Andriessen et al., 2020). Accumulation rates are much more variable and can be orders of magnitude higher than the 37–51 L/cap·year that has been historically recommended for the design of pit latrines in rural areas (Wagner and Lanoix, 1958). In conclusion, accuracy of predictions at the community- to city-wide scale will be improved by a weighted average of local measurements, taking into account groupings of containment type and water connection, rather than trying to use universal values. It is important to note that the accumulation rates calculated in this study are based on what remains within the containment as a defined system boundary, as an estimate of what will need to be emptied, or delivered to treatment facilities. These values do not include any leaching or outflow into the surrounding environment. From a public health perspective, stopping direct flows of fecal sludge into the urban environment is a management concern of the utmost priority (Okaali et al., 2022).
A general limitation in estimating accumulation rates is the accuracy of the collected data, for example with time since last desludging, containment age and containment size. Accumulation rates could not be calculated for every containment in this study, as these factors were not always known. Especially when people are not financially responsible for construction and emptying costs they are not aware of them, and hence guess widely ranging estimates. In this study, we tried to reduce variability by providing multiple choice answers for ranges of containment age (<1, 1–5, 6–10, <10 years, I don't know). Another strategy could be asking people to remember if the last emptying was related to a specific event (e.g., wedding, holiday), which could increase accuracy of remembering dates. 66% of the questionnaire respondents did not know the size of their containment. This highlights the importance of developing more accurate methods of data collection, than questionnaire data alone. In this study, estimations based on questionnaires were 455% different in volume from what was measured with the Volaser, with the majority of the questionnaire respondents estimated their containment to be larger than what was measured with the Volaser. A sensitivity analysis was conducted to assess the effect of uncertain questionnaire responses on accumulation rates. Variations in time since last desludging had the largest effect on accumulation rates, but did not significantly change the outcomes of this study. The results of the sensitivity analysis are included in the Supplementary material. Volaser measuring devices could be used by emptiers for transparency of fees per volume emptied, practitioners or academics when determining fecal sludge accumulation (Wanda et al., 2021), or authorities when conducting public health surveys or building compliance checks.
Focus group discussions concentrated on getting thematic feedback from the entire project team and identifying areas of converging and diverging opinions. Themes were: success factors and barriers of overall project management, technology acceptance and knowledge transfer, and the influence of the pandemic. For the majority, opinions were converging, any diverging opinions are highlighted here.
In terms of the overall collaboration, the entire project team mentioned that the partnership was transparent, goal-oriented and based on trust, and it also aligned with their own interests, motivations and existing expertise in FSM, which were key success factors of the project. The Eawag team additionally mentioned the team spirit and collective psychological ownership for the project by all team members over the project. All field partners felt positive about being able to make independent decisions on adapting the sampling plan to the local reality, which increased their sense of commitment to the project.
In terms of technology transfer of the Volaser, one barrier to success that the field partners mentioned, was troubleshooting. The exclusive online communication hampered troubleshooting and was identified as a substantial contributor to problems experienced by the field partners. However, problems in using the Volaser independently could be overcome with continuous remote support of the Eawag team. Overall, the partners themselves perceived the ease of using and the importance of the technology as key factors for acceptance. There were varying levels of ownership of the Volaser technology between field partners and the Eawag team. The Eawag team had greater feelings of invested ownership due to the previous years they had spent developing the Volaser. For the field teams, invested ownership was lower, due to less involvement in the technology design and transfer. Due to the pandemic, the Volasers were constructed by Eawag and shipped to each partner. The result was assigned ownership, rather than personal investment. It was identified by the field partners, that one way to increase ownership would have been self-construction of the Volaser. Additionally, improved access to training and supporting materials would help increase ownership:
So I think that for it to be our technology and to be used beyond us, I think we need to promote it a bit more and also extend this training to practitioners, not only academics. We can't say it's our technology, […] it was just sent to us to use.
In conclusion, a collaborative implementation project can provide an invaluable step in increasing technology transfer from developers into uptake. However, technology uptake ultimately requires invested ownership, which could be increased by co-involvement in technology design and construction. Uptake will also be improved with adequate training materials, and opportunities for collaborators to themselves train practitioners.
Regarding influence of the COVID-19 pandemic, the field partners reported that it heavily influenced their work. However, other than some difficulties related to the fieldwork, the field partners mentioned mainly the positive aspects of financial support and hope. In this way, working on the project made coping with the pandemic easier. Specific feedback included:
And as you can imagine, there was a lot of anxiety during the lockdown. […] Such collaboration gave us hope. […] So I think that this kind of work came at a good time to catch up with the people we have been working with, whom we are separated from because of the pandemic.
The Eawag team also underlined positive aspects resulting from the experience. Even though some organizational workload was increased, they perceived higher commitment and increased engagement from the entire project team. For the Eawag team, having a unified QA/QC strategy was also helpful in streamlining the data collection.
There was general consensus among the entire project team that success factors for remote project management were the same as before the COVID-19 pandemic, when on-site, in-person visits were part of overall project management. Additionally, they shared the view that the quality of the work in general was not affected due to the pandemic. However, misunderstandings and other small problems (e.g., delays) were encountered more quickly or detected later, and accuracy of the contextual understanding was hampered (i.e., technical incompatibilities for the Volaser in very specific, individual containments). To overcome this, more understanding of individual barriers and thus flexibility in management are needed. In this case, exchanges between the project team happened with greater frequency and more spontaneity. In conclusion, due to the jointly built trust, expertise and commitment of everyone, this research project successfully co-created knowledge during a highly uncertain time.
Knowledge developed in this study can help to improve the efficiency and accuracy of estimations for Q&Q of fecal sludge at city-scales. Differences in characteristics were observed based on containment type, toilet type, sludge source, and water connection (for TS, COD, and to a lesser extent VS), and for rates of accumulation based on containment type. These relationships are in line with previously published studies, and should therefore be used as a minimum for setting up data collection, or calculating projections of Q&Q at the city-scale. For example, locally determining accumulation rates for different containment types will affect design of scheduled emptying campaigns, or making a weighted average of expected solids concentrations depending on sludge source (e.g., household vs. non-household) could inform treatment and resource recovery practices. This dataset provides a starting point for further estimation of Q&Qs in general, and specifically for the seven locations in this study. One short-coming for using this data for city-scale estimates, is that the number of containments sampled per city was limited. To scale up estimations, data must ensure adequate representation of the categories containment type, toilet type, sludge source, and water connection. In addition, these factors should be supplemented with the most relevant types of locally available demographic, environmental, and technical data for the specific context. When using containment type as a predictor, it is important to note that labels like “septic tank” or “pit latrine” alone are not adequate, and physical characteristics of containment categories need to be clearly defined in advance (e.g., fully lined, partially lined, unlined, outflow, no outflow). A direct “copy and paste” method for estimating Q&Qs, that can be universally implemented based on generalized or “standard” values, is not recommended. Collaborative technology transfer and uptake (such as with the Volaser in this study) could further improve estimates of Q&Q in the future.
Establishing universal relationships among characteristics of fecal sludge can help reduce analytical costs through reduced sample numbers. Based on the results of this study, together with previously published open-source data, an empirical relationship for VS/TS of 0.49 was established using 1,206 data points. Although a significant relation exists, it is important to note that with a R2 of 0.88 there is still ±12% variance (Figure 6A). Therefore, this could be a reasonable estimate for the level of accuracy needed for city-wide planning, developing sanitation master plans, or overall modeling approaches. An increased level of accuracy is required for operation, optimization, and monitoring of treatment facilities. In contrast, a COD/TS relationship that was observed in previous studies was not observed for all individual countries in this study, and therefore needs to be evaluated more carefully on a case-by-case basis.
A strength of the reported characteristics of fecal sludge in this study, is that they were collected and reported in a transparent fashion, with a strong QA/QC strategy. Experience shows that a high variability between replicates can be expected for fecal sludge analysis, making QA/QC especially important for comparisons. Acceptable margins of error for analysis still need to be established, but should always be reported. Accepting slightly higher error margins for fecal sludge (e.g., here we used 10% variability between triplicates instead of 5% that is used in wastewater standard methods) might be needed. If measurements fall outside the predefined error range, they should be discarded and/or reanalyzed if possible, based on viability of storage conditions. Worldwide, there is a growing network of people with experience in improving estimates for Q&Qs of fecal sludge, which will be invaluable toward developing reliable and standard methodologies. An important step in ensuring this happens will be practitioners and scientists sharing their data open access so we can mutually learn and build on the growing body of knowledge, as with the larger analysis in this study.
One benefit in initiating a complex international project like this, was that the initiator of the project had an established network of collaborators. Long-term partnerships are extremely valuable, even more so during a pandemic, and meant that partners were already aware of each other's capacities, and a mutual level of trust existed. For newly established collaborations, capacities, trust, and expectations were clarified in bilateral online discussions prior to the start of the project. Success factors for collaborating without any face-to-face contact included mutual commitment and trust, laboratory capacity and experience with wastewater or fecal sludge analysis, and study objectives that were relevant for each partner and locality. Another success factor was that one partner took the overall lead in project coordination, with designated country project managers for each partner. The experience and lessons learned during this project can now be taken forward as ways to reduce carbon footprint, and to participate in resilient, inclusive development research projects.
The datasets generated for this study can be found in the Eawag Research Data Institutional Collection (ERIC) repository: https://doi.org/10.25678/0007KN.
NA and LS conceived of the project idea. NA led the project, conducted the data analysis, and took the lead in writing the manuscript. EA-E, SB, RJ, JKa, JKi, NK, PN, CN, RP, PP, JT, and AW were responsible for local project management, collected the data, and provided feedback on the manuscript. BA designed and conducted the external evaluation, conducted the data analysis, and wrote the respective sections of the manuscript. LS was the principal investigator and senior scientist, contributed to project management, data interpretation, and co-writing. All authors contributed to the article and approved the submitted version.
Funding was provided by Eawag discretionary funding and the Swiss Development Corporation under the Water, Behavior Change and Environmental Sanitation: Sustainable Solutions to Research, Knowledge and Professionalism (WABES) programme.
The authors would like to thank Venkatachala Reddy K. V., Rajashekar Reddy K. S., Ravikumar A. G., Thimmesh R., Nandish D., Cornelius Makai, Thandiwe M. Tembo, Geofrey Lwanja, Reagan Chapula, Laura Sebi, David Gitau, Charbel Hankache, Joelle el Haber, Ramya B., Praveen Raje Urs, Dan Mkandawire, Enock M. Mutati, Derrick Muwowo, Lwiindi Kozozo Phiri, Gomezyo Mhone, Ritah Nakazibwa, Godwin Armstrong Duku, Joseph Kwarko-Kyei, and Abdul Rashid Bashiru for providing support during sample collection and laboratory analysis. The authors would also like to extend gratitude to Mingma Gyalzen Sherpa and Siddhartha Shakya for their contributions.
RJ was employed by CubeX SAL. NK was employed by Sanivation Limited.
The remaining authors declare that the research was conducted in the absence of any commercial or financial relationships that could be construed as a potential conflict of interest.
All claims expressed in this article are solely those of the authors and do not necessarily represent those of their affiliated organizations, or those of the publisher, the editors and the reviewers. Any product that may be evaluated in this article, or claim that may be made by its manufacturer, is not guaranteed or endorsed by the publisher.
The Supplementary Material for this article can be found online at: https://www.frontiersin.org/articles/10.3389/frwa.2023.1130081/full#supplementary-material
Ahmed, I., Ofori-Amanfo, D., Awuah, E., and Cobbold, F. (2019). A comprehensive study on the physicochemical characteristics of faecal sludge in greater Accra region and analysis of its potential use as feedstock for green energy. J. Renew. Energy 2019, 8696058. doi: 10.1155/2019/8696058
Alias, Z., Zawawi, E. M. A., Yusof, K., and Aris, N. M. (2014). Determining critical success factors of project management practice: a conceptual framework. Proc. Soc. Behav. Sci. 153, 61–69. doi: 10.1016/j.sbspro.2014.10.041
Andriessen, N., Scheidegger, A., Tembo, J. M., Kabika, J., and Strande, L. (2020). Faecal Sludge Quantities and Qualities (Q&Q) in Lusaka. Eawag: University of Zambia.
APHA (2017). Standard Methods for the Examination of Water and Wastewater. Washington DC: American Public Health Association (APHA)/Americal Water Works Association (AWWA)/Water Environment Federation (WEF).
Appiah-Effah, E., Nyarko, K. B., and Awuah, E. (2014). Characterization of public toilet sludge from peri-urban and rural areas of ashanti region of Ghana. J. Appl. Sci. Environ. Sanit. 9, 175–184.
Bassan, M., Koné, D., Mbéguéré, M., Holliger, C., and Strande, L. (2015). Success and failure assessment methodology for wastewater and faecal sludge treatment projects in low-income countries. J. Environ. Plann. Manag. 58, 1690–1710. doi: 10.1080/09640568.2014.943343
Bassan, M., Tchonda, T., Yiougo, L., Zoellig, H., Mahamane, I., Mbéguéré, M., et al. (2013). “Characterization of faecal sludge during dry and rainy seasons in Ouagadougou, Burkina Faso,” in 36th WEDC International Conference (Nakuru).
Carrard, N., Willetts, J., and Mitchell, C. (2022). Placing sustainability at the centre of water, sanitation and hygiene: Knowledge co-production for sectoral transformation. Curr. Res. Environ. Sustain. 4, 100154. doi: 10.1016/j.crsust.2022.100154
Cheng, K. K. F., and Clark, A. M. (2017). Qualitative methods and patient-reported outcomes:measures development and adaptation. Int. J. Qual. Methods 16, 1609406917702983. doi: 10.1177/1609406917702983
Doglas, B., Kimwaga, R., and Mayo, A. (2021). Variability of faecal sludge characteristics and its implication for dewaterability across different on-site sanitation containments in unplanned settlements in dar es Salaam, Tanzania. Water Pract. Technol. 16, 1182–1193. doi: 10.2166/wpt.2021.052
Eliyan, C., Vinnerås, B., Zurbrügg, C., Koottatep, T., Sothea, K., and McConville, J. (2021). Factors influencing physicochemical characteristics of faecal sludge in Phnom Penh, Cambodia. J. Water Sanit. Hyg. Dev. 12, 129–140. doi: 10.2166/washdev.2021.193
Englund, M., Carbajal, J. P., Ferré, A., Bassan, M., Vu, A. T. H., Nguyen, V. -A., et al. (2020). Modelling quantities and qualities (Q&Q) of faecal sludge in Hanoi, Vietnam and Kampala, Uganda for improved management solutions. J. Environ. Manag. 261, 110202. doi: 10.1016/j.jenvman.2020.110202
Fanyin-Martin, A., Tamakloe, W., Antwi, E., Ami, J., Awarikabey, E., Apatti, J., et al. (2017). Chemical characterization of faecal sludge in the Kumasi metropolis, Ghana [version 1; peer review: 1 approved, 1 approved with reservations]. Gates Open Res. 1, 1–12. doi: 10.12688/gatesopenres.12757.1
Gambrill, M., Gilsdorf, R. J., and Kotwal, N. (2020). Citywide inclusive sanitation—Business as unusual: shifting the paradigm by shifting minds. Front. Environ. Sci. 7, 201. doi: 10.3389/fenvs.2019.00201
Gold, M., Harada, H., Therrien, J.-D., Nishida, T., Cunningham, M., Semiyaga, S., et al. (2018). Cross-country analysis of faecal sludge dewatering. Environ. Technol. 39, 1374472. doi: 10.1080/09593330.2017.1374472
Isunju, J., Etajak, S., Mwalwega, B., Kimwaga, R., Atekyereza, P., Bazeyo, W., et al. (2013). Financing of sanitation services in the slums of Kampala and Dar es Salaam. Health 5, 783–791. doi: 10.4236/health.2013.54104
Junglen, K., Rhodes-Dicker, L., Ward, B. J., Gitau, E., Mwalugongo, W., Stradley, L., et al. (2020). Characterization and prediction of faecal sludge parameters and settling behavior in informal settlements in Nairobi, Kenya. Sustainability 12, 9040. doi: 10.3390/su12219040
Klinger, M., Gueye, A., Sherpa, A. M., and Strande, L. (2019). Scoping Study: Faecal Sludge Treatment Plants in South-Asia and Sub-saharan Africa. Eawag/Sandec, Delvic: ENPHO.
Koottatep, T., Ferré, A., Chapagain, S., Fakkaew, K., and Strande, L. (2021). “Faecal sludge sample collection and handling,” in Methods for Faecal Sludge Analysis, eds K. Velkushanova, L. Strande, M. Ronteltap, T. Koottatep, D. Brdjanovic, and C. Buckley (London: IWA Publishing).
Koottatep, T., Surinkul, N., Paochaiyangyuen, R., Suebsao, W., Sherpa, M., Liangwannaphorn, C., et al. (2012). Assessment of Faecal Sludge Rheological Properties. Bankok: Asian Institute of Technology.
Krueger, B. C., Fowler, G. D., and Templeton, M. R. (2021). Critical analytical parameters for faecal sludge characterisation informing the application of thermal treatment processes. J. Environ. Manage. 280, 111658. doi: 10.1016/j.jenvman.2020.111658
Lugali, Y., Zziwa, A., Banadda, N., Wanyama, J., Kabenge, I., Kambugu, R., et al. (2016). Modeling sludge accumulation rates in lined pit latrines in slum areas of Kampala City, Uganda. Afr. J. Environ. Sci. Technol. 10, 253–262. doi: 10.5897/AJEST2016.2106
Mac Mahon, J., Knappe, J., and Gill, L. W. (2022). Sludge accumulation rates in septic tanks used as part of the on-site treatment of domestic wastewater in a northern maritime temperate climate. J. Environ. Manage. 304, 114199. doi: 10.1016/j.jenvman.2021.114199
Maqbool, N., Sam, S. B., Khan, S. J., and Strande, L. (in preparation). Anaerobic digestion of faecal sludge, co-digestion with organic food waste.
Massey, O. T. (2011). A proposed model for the analysis and interpretation of focus groups in evaluation research. Evaluat. Prog. Plann. 34, 21–28. doi: 10.1016/j.evalprogplan.2010.06.003
Mayring, P. (2004). “Qualitative content analysis,” in A Companion to Qualitative Research, eds U. Flick, E. von Kardorff, and I. Steinke (London: Sage Publications).
Mehta, M., Mehta, D., and Yadav, U. (2019). citywide inclusive sanitation through scheduled desludging services: emerging experience from India. Front. Environ. Sci. 7, 188. doi: 10.3389/fenvs.2019.00188
Mills, F., Blackett, I. C., and Tayler, K. (2014). “Assessing on-site systems and sludge accumulation rates to understand pit emptying in Indonesia,” in 37th WEDC International Conference (Hanoi).
Mugambi, J. K., Windberg, C., Ddiba, D., Ogol, T., Andersson, K., Gicheru, T., et al. (2020). “Organic waste and ongoing resource recovery activities,” in Setting the Stage for the Circular Economy (Stockholm: Stockholm Environment Institute).
Odagiri, M., Thomas, A., Listyasari, M., Mills, F., Bain, R. E. S., Muhammad, Z., et al. (2021). Safely managed on-site sanitation: a national assessment of sanitation services and potential faecal exposure in Indonesia. Int. J. Environ. Res. Public Health 18, 8204. doi: 10.3390/ijerph18158204
Okaali, D. A., Bateganya, N. L., Evans, B., Ssazi, J. G., Moe, C. L., Mugambe, R. K., et al. (2022). Tools for a comprehensive assessment of public health risks associated with limited sanitation services provision. Environ. Plann. B Urban Anal. City Sci. 49, 2091–2111. doi: 10.1177/23998083221120824
Prasad, P., Andriessen, N., Moorthy, A., Das, A., Coppens, K., Pradeep, R., et al. (2021). Methods for estimating quantities and qualities (Q&Q) of faecal sludge: field evaluation in Sircilla, India. J. Water Sanit. Hyg. Dev. 11, 494–504. doi: 10.2166/washdev.2021.269
Radford, J. T., and Sugden, S. (2014). Measurement of faecal sludge in-situ shear strength and density. Water SA 40, 183–188. doi: 10.4314/wsa.v40i1.22
Rieger, L., Gillot, S., Langergraber, G., Ohtsuki, T., Shaw, A., Takacs, I., et al. (2012). Guidelines for Using Activated Sludge Models – Scientific and Technical Report No. 22. London: IWA Publishing.
Semiyaga, S., Okure, M. A. E., Niwagaba, C. B., Nyenje, P. M., and Kansiime, F. (2017). Dewaterability of faecal sludge and its implications on faecal sludge management in urban slums. Int. J. Environ. Sci. Technol. 14, 151–164. doi: 10.1007/s13762-016-1134-9
Sharma, M., Luthra, S., Joshi, S., and Joshi, H. (2022). Challenges to agile project management during COVID-19 pandemic: an emerging economy perspective. Operat. Manag. Res. 15, 461–474. doi: 10.1007/s12063-021-00249-1
Strande, L., Englund, M., Andriessen, N., Carbajal, J. P., and Scheidegger, A. (2021). “Estimating quantities and qualities (Q&Q) of faecal sludge at community to citywide scales,” in Methods for Faecal Sludge Analysis, eds K. Velkushanova, L. Strande, M. Ronteltap, T. Koottatep, D. Brdjanovic, and C. Buckley (London: IWA Publishing).
Strande, L., Ronteltap, M., and Brdjanovic, D. (2014). Faecal Sludge Management: Systems Approach for Implementation and Operation. London: IWA Publishing.
Strande, L., Schoebitz, L., Bischoff, F., Ddiba, D., Okello, F., Englund, M., et al. (2018). Methods to reliably estimate faecal sludge quantities and qualities for the design of treatment technologies and management solutions. J. Environ. Manage. 223, 898–907. doi: 10.1016/j.jenvman.2018.06.100
Tchobanoglous, G., Stensel, H. D., Tsuchihashi, R., Burton, F., Abu-Orf, M., Bowden, G., et al. (2014). Wastewater Engineering: Treatment and Reuse, 5th Edn. New York, NY: McGraw Hill Education.
Tembo, J. M. (2019). Faecal Sludge Characterisation for Enhanced Sanitation Provision in Peri-Urban Areas of Lusaka (PhD thesis). Lusaka: University of Zambia.
Tembo, J. M., Matanda, R., Banda, I. N., Mwanaumo, E., Nyirenda, E., Mambwe, M., et al. (2019). Pit latrine faecal sludge solid waste quantification and characterization to inform the design of treatment facilities in peri-urban areas: a case study of Kanyama. Afr. J. Environ. Sci. Technol. 12, 260–272. doi: 10.5897/AJEST2019.2694
Thaher, R. A., Mahmoud, N., Al-Khatib, I. A., and Hung, Y.-T. (2022). Cesspits as onsite sanitation facilities in the non-sewered palestinian rural areas: users' satisfaction, needs and perception. Water 14, 849. doi: 10.3390/w14060849
Velkushanova, K., Reddy, M., Zikalala, T., Gumbi, B., Archer, C., Ward, B. J., et al. (2021). “Laboratory procedures and methods for characterisation of faecal sludge,” in Methods for Faecal Sludge Analysis, eds K. Velkushanova, L. Strande, M. Ronteltap, T. Koottatep, D. Brdjanovic, and C. Buckley (London: IWA Publishing).
Vijayan, V., Mallik, M., and Chakravarthy, S. K. (2020). Performance Evaluation: How Faecal Sludge Treatment Plants are Performing. New Delhi: Centre for Science and Environment.
Wagner, E. G., and Lanoix, J. N. (1958). Excreta Disposal for Rural Areas and Small Communities. Geneva: World Health Organization.
Wanda, C., Kengne, E. S., Wafo, G. V. D., Nzouebet, W. A. L., Nbendah, P., Ngandjui, Y. A. T., et al. (2021). Quantification and characterisation of faecal sludge from on-site sanitation systems prior the design of a treatment plant in Bangangte, West Region of Cameroon. Environ. Challenges 5, 100236. doi: 10.1016/j.envc.2021.100236
Ward, B. J., Allen, J., Escamilla, A., Sivick, D., Sun, B., Yu, K., et al. (2021a). “Sludge snap: a machine learning approach to faecal sludge characterization in the field,” in Proceedings of the 42nd WEDC International Conference.
Ward, B. J., Andriessen, N., Tembo, J. M., Kabika, J., Grau, M., Scheidegger, A., et al. (2021b). Predictive models using “cheap and easy” field measurements: can they fill a gap in planning, monitoring, and implementing faecal sludge management solutions? Water Res. 196, 116997. doi: 10.1016/j.watres.2021.116997
Keywords: accumulation rate, characteristics, statistical relations, standardized approaches, distance sensor, fecal sludge
Citation: Andriessen N, Appiah-Effah E, Browne SJI, al Jahjah R, Kabika J, Kinobe JR, Korir N, Nishimwe P, Niwagaba CB, Pradeep R, Prasad P, Tembo JM, William A, Ambuehl B and Strande L (2023) Quantities and qualities of fecal sludge: Experiences from field implementation with a Volaser in 7 countries during a pandemic. Front. Water 5:1130081. doi: 10.3389/frwa.2023.1130081
Received: 22 December 2022; Accepted: 08 March 2023;
Published: 24 March 2023.
Edited by:
Tosin Somorin, University of Strathclyde, United KingdomReviewed by:
Nuhu Amin, University of Technology Sydney, AustraliaCopyright © 2023 Andriessen, Appiah-Effah, Browne, al Jahjah, Kabika, Kinobe, Korir, Nishimwe, Niwagaba, Pradeep, Prasad, Tembo, William, Ambuehl and Strande. This is an open-access article distributed under the terms of the Creative Commons Attribution License (CC BY). The use, distribution or reproduction in other forums is permitted, provided the original author(s) and the copyright owner(s) are credited and that the original publication in this journal is cited, in accordance with accepted academic practice. No use, distribution or reproduction is permitted which does not comply with these terms.
*Correspondence: Nienke Andriessen, bmllbmtlLmFuZHJpZXNzZW5AZWF3YWcuY2g=
†These authors have contributed equally to this work and share second authorship
Disclaimer: All claims expressed in this article are solely those of the authors and do not necessarily represent those of their affiliated organizations, or those of the publisher, the editors and the reviewers. Any product that may be evaluated in this article or claim that may be made by its manufacturer is not guaranteed or endorsed by the publisher.
Research integrity at Frontiers
Learn more about the work of our research integrity team to safeguard the quality of each article we publish.