
94% of researchers rate our articles as excellent or good
Learn more about the work of our research integrity team to safeguard the quality of each article we publish.
Find out more
ORIGINAL RESEARCH article
Front. Water, 29 June 2023
Sec. Water and Critical Zone
Volume 5 - 2023 | https://doi.org/10.3389/frwa.2023.1099660
This article is part of the Research TopicWomen in Critical Zone ScienceView all 7 articles
 Katrina E. Bennett1*
 Jon Schwenk1
 Claire Bachand1
 Eve Gasarch1
 Jemma Stachelek1William R. Bolton2
 Joel C. Rowland1
Introduction: Climate change impacts, including changing temperatures, precipitation, and vegetation, are widely anticipated to cause major shifts to the permafrost with resulting impacts to hydro-ecosystems across the high latitudes of the globe. However, it is challenging to examine streamflow shifts in these regions owing to a paucity of data, discontinuity of records, and other issues related to data consistency and accuracy.
Methods: Recent trends for long-term periods (1990–2021, 1976–2021) in observed minimum, mean, and maximum seasonal and annual streamflow were analyzed for a range of watersheds across North America affected by varying degrees of permafrost coverage.
Results: Streamflow trend analysis revealed that areas affected by permafrost are changing variably over the periods in terms of maximum, mean, and minimum seasonal and annual streamflow. These changes indicate a significant shift occurring in the most recent 46 years towards increasing mean streamflow for the dominant (> 50%) permafrost systems. Meanwhile, minimum streamflow increases for all permafrost-dominant systems and many of the other permafrost-affected systems across the seasons and annual periods considered, with the greatest number of significant changes in streamflow over other metrics. Maximum streamflow is shifting variably with significant increases in the permafrost-dominant systems in winter and fall over longer time periods of analysis. Our analysis suggests that streamflow trends are driven by climate (precipitation, followed by temperature), while variables such as permafrost coverage only appear important in the most recent 32-year period.
Discussion: The increases in streamflow trends observed in this study are reflective of deepening active layers and thawing permafrost, indicating that the entire hydrograph is undergoing change within permafrost-dominant streamflow systems as the Arctic moves towards a warmer future under climate change. Despite the many challenges to understanding changing streamflow in cold regions, there are new products and datasets in development that are increasingly allowing researchers to better understand the patterns of change in Arctic and subarctic systems affected by permafrost, offering a range of new tools, which, along with continued observational records, may help in improved understanding of changing Arctic streamflow patterns.
The globe and in particular, the Arctic and subarctic regions of the world are experiencing enhanced warming and increased movement of atmospheric and terrestrial water through the hydrologic system (Huntington, 2006; England et al., 2021; Chylek et al., 2022; Wendisch et al., 2022), along with accelerated thaw of the permafrost (ground that remains frozen for more than 2 years, Rowland et al., 2010; Lawrence et al., 2012; Chadburn et al., 2017; Nitze et al., 2018; Biskaborn et al., 2019). As these changes occur, complex processes result in deeper soil active layers (the seasonally thawed layer at the top of the permafrost) and thinner permafrost (Hayes et al., 2014), more extensive talik (i.e., holes in the permafrost) formation (Parazoo et al., 2018; Liu et al., 2021), larger areas of discontinuous permafrost (Biskaborn et al., 2019), and less ground ice (Liljedahl et al., 2016).
In the Arctic and subarctic, hydrological intensification also results in increased water flow, both off the land surface and in rivers, deeper snowpack, more summer rain, and more extreme events (Peterson et al., 2002; McClelland et al., 2006; Rawlins et al., 2010; Prowse et al., 2015). Both hydrologic cycle rates and permafrost thaw have positive feedbacks to the vegetation, water quality (i.e., heat, sediment, and carbon/mercury mobilization), and energy exchanges (i.e., water vapor feedback, permafrost extent, snowpack, evapotranspiration, and soil moisture changes) across the Arctic and subarctic landscapes and oceans (Peterson et al., 2002; Rawlins et al., 2010; Bring et al., 2016; Stuefer et al., 2017; Durocher et al., 2019; Zheng et al., 2019; Koenigk et al., 2020; Feng et al., 2021). These changes are anticipated to enhance positive feedbacks to global climate impacts, leading to even more rapid changes and further increasing greenhouse gas concentrations in the atmosphere (Schuur et al., 2015).
Arctic and subarctic river outflows to the Arctic Ocean have been noted to be increasing over the past 50 years (Peterson et al., 2002; McClelland et al., 2006; Bring et al., 2016; Durocher et al., 2019). A particular focus has been on the annual discharge of the largest Eurasian rivers (e.g., Lena, Ob, and Yenisei) as these rivers input a large percentage (55%) of fresh water annually to the Arctic Ocean compared with 28% from North American (NA) systems (Shiklomanov et al., 2021). While Eurasian rivers are unquestionably increasing in annual mean streamflow (Shiklomanov et al., 2021), if and how NA Arctic river discharges are changing remains in question. For example, in the Mackenzie River basin, no obvious trends were found in terms of changing annual flow magnitudes from 1973 to 1999, although variability was noted to be increasing (Zhang et al., 2001; Woo and Thorne, 2003). Updated work showed increases over a longer time frame (early-to-mid 1900's-2013; Rood et al., 2017). On the other hand, Déry and Wood (2005) found trends of decreasing annual streamflow discharge from 1964 to 2003 at coastal stations in Arctic Canada. An updated paper in 2009 extended the time series by 4 years (1964–2007), which revealed a trend reversal toward increasing annual streamflows and streamflow variability (Déry et al., 2009). NA river basin annual discharges to the Arctic Ocean were noted to be decreasing from 1964 to 2000 by McClelland et al. (2006) while Zhang et al. (2001) found increasing trends in some basins from 1967 to 1996. More recent work by Durocher et al. (2019) showed that annual river discharges around the Hudson, James, and Ungava bays in northern Canada increased significantly while other NA systems increased as well (although results were not significant at p-values < 0.05). Déry et al. (2016) noted increasing annual flows in northern Canada (18%) over the latter part of the 1964–2013 (1989–2013) time period. Annual discharge in 2020 from the two large NA rivers contributing to the Arctic (Mackenzie and Yukon) was ~25% greater than the 1981–2010 average, largely owing to a very wet summer in 2020 (Druckenmiller et al., 2021). Overall, the consensus is toward increasing NA river flows on the order of 1 km3 per year from the larger NA river systems (Druckenmiller et al., 2021; Shiklomanov et al., 2021).
Previous research has focused on the causal relationships for changing streamflow patterns. Some authors have linked changing streamflow to specific climate variability indexes, such as the Pacific Decadal Oscillation (Rood et al., 2017) or the Arctic Oscillation (Déry and Wood, 2004), although no significant relationships were found by Durocher et al. (2019) for either climate variability index Peak streamflow within high latitude systems is largely driven by snowmelt processes, a seasonal phenomenon that is highly influenced by climate warming (Wang et al., 2016). Peak streamflow carries with it important constituents, including sediment, carbon, oxygen, and nutrients from river systems into the ocean, which may strongly affect nearshore environments and deltas (Holmes et al., 2008, 2012; Rawlins et al., 2010). Low flows, which occur during summer and fall in Arctic and subarctic systems, are largely driven by summer rainfall and baseflow conditions. Deeper active layers and subsidence from permafrost thaw may change low flows by increasing the storage of water in the active layer and the movement of water through the soil profile and into rivers (Walvoord and Striegl, 2007; St. Jacques and Sauchyn, 2009; Walvoord and Kurylyk, 2016). Low flow increases in permafrost regions also have important ramifications for exports of nutrients from Arctic systems (McNamara et al., 2008; Frey and McClelland, 2009; Neilson et al., 2018). Finally, streamflow may be changing in the Arctic due to shifting climate and water balance relationships over long timeframes. Rivers in northwestern Canada were observed to have declining magnitudes of annual snowmelt peaks (Cunderlik and Ouarda, 2009). Further, precipitation minus evaporation (P-E) relationships in these basins are likely changing (Serreze et al., 2000; Zhang et al., 2000; Huang et al., 2022).
Challenges in defining streamflow trends and linkages to increased precipitation may be due in part to sparse measurements and cold season biases in precipitation observations (Adam and Lettenmaier, 2003; Yang et al., 2005; Cherry et al., 2007). Indeed, sparse spatial and temporally short observations, low-quality data, and intermittency in the records limit the ability of researchers to conclusively determine the direction and magnitude of changes and to properly attribute these changes (Ahmed et al., 2020). While many studies on changing Arctic streamflow use established methods to infill data (Pigott, 2001; Teegavarapu and Nayak, 2017; Dembélé et al., 2019) and new techniques utilizing machine learning and modeling methods to gap fill records show promise (Zhang and Post, 2018; Arriagada et al., 2021), no current review of infilling in Arctic systems data has been conducted. Thus, determining trends in streamflow records accurately using high quality streamflow gage records along with process-based and statical tools to model streamflow is considered a grand challenge for cold regions hydrological sciences (Blöschl et al., 2019).
Our objective in this work is to consider NA streamflow trends for recent and longer-term periods within gaged basins affected by varying amounts of permafrost coverage. We aim to (1) quantify differences and trends in annual and seasonal streamflow discharges for mean, minimum, and maximum streamflow and (2) assess whether these vary with permafrost coverage across their basins. We look at 74 gaged sites in North America, ranging from 1 to 90% permafrost coverage. We consider the seasonal and annual response in these differences and trends for varying amounts of permafrost coverage and use multiple tools along with newly available datasets and machine learning methods to examine the drivers of change within the basins. Our goal is to highlight changes in streamflow, identify the drivers of shifts within these systems, and to discuss the challenges associated with identifying trends and their drivers in Arctic and subarctic hydrologic systems.
We considered streamflow data from across the North American (NA) Arctic, focusing on river basins that contained at least some permanently frozen ground (i.e., permafrost is ground that is frozen for more than 2 years). Thus, our study basins span Alaska and Canada, and range from those draining to the Chukchi Sea in the west to Hudson Bay, Quebec, Canada in the east with latitudes spanning 55° N to 70° N and basin sizes ranging between 27 to 50,200 km2 (Figure 1).
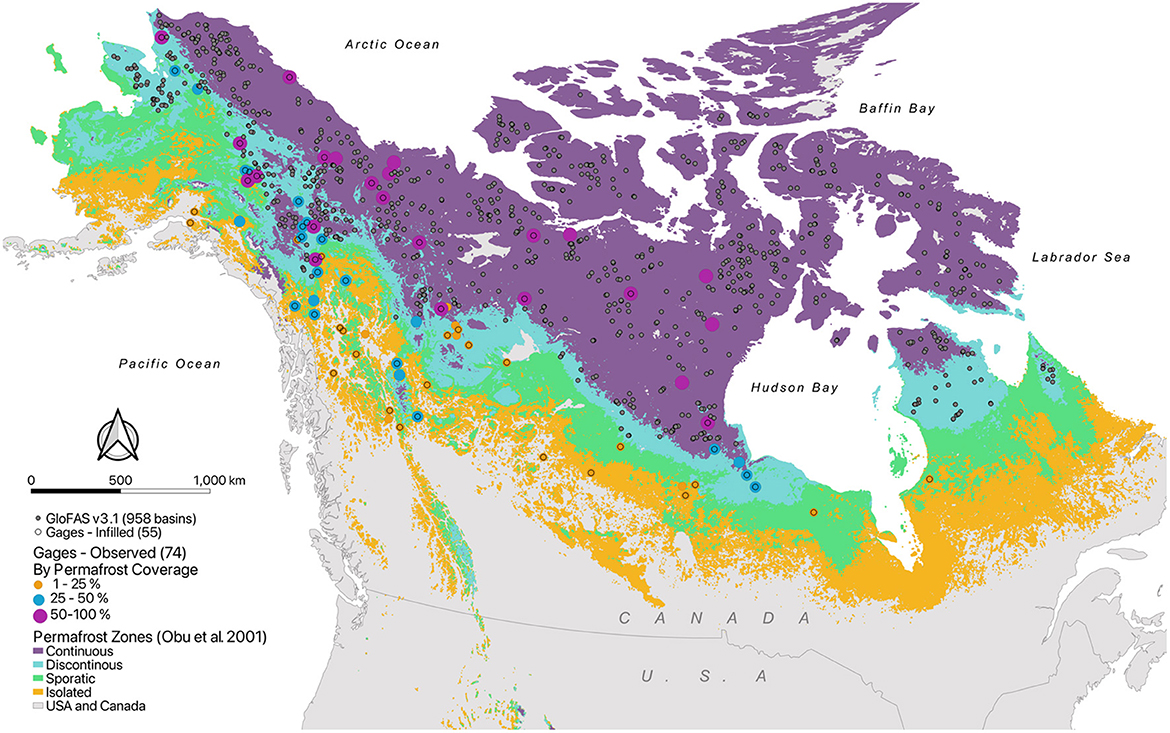
Figure 1. Streamflow gages (observed, n = 74) by permafrost coverage percentages with infilled gages (n = 55, open circles), and GloFAS v3.1 watersheds (gray circles, n = 958) shown over (Obu et al., 2019) permafrost zones for North America.
To compute basin characteristics needed for gage selection and analysis (e.g., permafrost coverage, topographic slope, aspect, and others) we used the River and Basin Profiler (rabpro, Schwenk et al., 2022). Rabpro automatically delineates watersheds by snapping gage points to appropriate MERIT-Hydro (Yamazaki et al., 2019) flowlines and performing digital-elevation model-based pixel-tracing to identify all pixels draining to the snapped location. After basins were delineated, we used rabpro to compute basin attributes that were necessary to further downselect gages and characterize their basins.
We selected streamflow gages based on several criteria aimed at obtaining a high-quality network of gages that would be reliable for trend analysis. Most importantly, we selected gages affected by frozen ground with mostly complete data records. Gage selection was performed through the Veins of the Earth data platform (https://www.essoar.org/doi/10.1002/essoar.10509913.2). Our initial set of gages (n = 967) included those in the United States Geological Survey (USGS) and Environment and Climate Change Canada (ECCC)'s Hydat databases that contained a minimum of 15 years of continuous data, excluding gages that could not be automatically snapped to flowlines via rabpro. Further downselection was performed using the Reference Hydrometric Basin Network (RHBN 2020 Update, https://www.canada.ca/en/environment-climate-change/services/water-overview/quantity/monitoring/survey/data-products-services/reference-hydrometric-basin-network.html) and GAGES-II (Falcone, 2011) to exclude basins with significant anthropogenic impacts. Daily streamflow time series were downloaded using the tidyhydat (Hydat; Albers, 2017) and dataRetrieval (USGS) R packages. Additionally, real time station data was downloaded manually from ECCC for Canadian stations and merged into a matrix (1975–2022). From this set, we chose stations that had more than 75% of their records complete within the most recent 32-year period, 1989–2021. We then further removed stations that had significant upstream lakes, reservoirs, or glaciers. We also excluded gages located below 55°N whose basins were comprised of <10% permafrost coverage (Obu et al., 2019), and gages located on the same river system and in the same permafrost group (see below) to arrive at the final subset of 74 streamflow gages and basins. This process intentionally selected gages where winter snow was the predominant driver of peak streamflow.
We considered the most recent 32-year period (1990–2021, referred to herein as recent-32) and divided the period into two equal length records, 1990–2005, referred to herein as early, and 2006–2021, referred to herein as late, for comparative trend analysis. We also separately considered a longer period (1976–2021, referred to herein as recent-46) with records of 1976–1998 (early), and 1999–2021 (late). Because we downselected stations using the recent-32 period, a few gages were missing larger percentages of data in the recent-46 period. Seasonal streamflow values were calculated from daily data for Winter (November-April), Spring (May-June), Summer (July-August), and Fall (September-October). Annual results are calculated based on the hydrological water year from November-October. We considered minimum, maximum, and mean streamflow for each of the time periods and seasons described above. All data sets associated with this publication can be found in Bennett and Schwenk (2023).
We separated out the stations by percentage of their catchments underlain by permafrost using three groups: 1–25% (non-dominant), 25–50% (moderate), and >50% (dominant) permafrost coverage for our analysis. We did not use the normal classifications of isolated (10% or less), sporadic (10–50%), discontinuous (50–90%), and continuous (90–100% of area) because the watersheds that we examined (particularly the sites located in southern regions) were comprised of a mixture of these zones. Thus, we used rapbro to characterize average present-day permafrost coverage (%) based on the permafrost extent map from Obu et al. (2019) for our study watersheds.
Multiple approaches were used to synthesize our results. We looked at average monthly hydrographs for each permafrost group (km3 yr−1) and discuss the first part of the period (referred to as records, early) compared to the second part of the periods (late). Further, we examined 5-year rolling streamflow means were normalized and centered around three (to remove any confusion around negative value being misinterpreted, unitless). Trends were calculated for periods only using Sen's slope and Mann-Kendall significance tests with the zyp.R software package (Bronaugh and Werner, 2009). Streamflow autocorrelation, or the relationship in the streamflow trends to its lagged values, which can be an issue in trends analysis, was addressed in the trends by following methods of Yue et al. (2002). Streamflow trends are reported in km yr−1 per 30 year (where we calculated the trends per year and then multiply that value by 30, which placed all trends values on the same time interval) and are square root transformed to adjust for outliers for some figures. Trends were considered detectable based on a threshold of the Mann-Kendall p-value of 0.1 for each unit of interest (i.e., season or annual minimum, mean, or maximum streamflow or climate variable), with p-value ≤ 0.05 noted in some cases. These trend analysis and data synthesis methods were also applied to the climate data analysis described below.
To consider impacts of seasonal climate factors on annual streamflow trends, we extracted ERA5-Land data, a global reanalysis data product developed by the European Center for Medium-Range Weather Forecasts (ECMWF) at hourly time steps for surface variables at a resolution ~9 km and is based on the model H-TESSEL (Muñoz-Sabater et al., 2021). The ERA5-Land data used here was extracted using Google Earth Engine (Gorelick et al., 2017) and rabpro. We retrieved monthly rainfall, snow water equivalent, and temperature time series for each basin and calculated seasonal and annual trends.
Finally, average regional streamflow trends across the three permafrost groups for the recent-46 period were estimated at 55 of the sites with the most complete data. GF3.1 was used to infill gage station data and to reduce biases caused by missing data. Average regional annual and seasonal trends were considered for each of the permafrost groups at p-values ≤ 0.1, and p-values ≤ 0.05.
We used the caret R package (Kuhn, 2008) to run tens of machine learning algorithms to determine the best fit model between annual streamflow trends and a suite of climate and physiographic features, including seasonal mean rainfall, snow water equivalent, and air temperature. We used R2 and RMSE to select the best-performing machine learning approach against a test data set and refined the suite of features for further modeling by removing highly correlated features. A single, best performing algorithm (random forest, Breiman, 2001; adjusted R2 > 70%) and 10 features were selected, tuned, and used to develop models of maximum, mean, and minimum annual streamflow trends.
In addition to trend analysis, we also investigated the probable features that account for observed trends and their changes within permafrost-dominant systems. This analysis was focused only across permafrost-dominant systems. For more robust statistical analyses, we used reanalysis streamflow data from the Global Flood Awareness System (GloFAS) v3.1 (GF3.1, Harrigan et al., 2020), available globally from 1979-present. We pseudo-randomly selected basins from GF3.1 (ensuring a minimum of 1/2° spacing between each sample), resulting in 958 new basins after using the same physiographic down-selection criteria that we applied to the gage data (see Section 2.1). We used these basins as training data for our machine learning model. To ensure the GF3.1 accurately represented trends observed across the permafrost-dominated gaged basins, we compared biases and trends in GF3.1 daily streamflow records with those of the permafrost-dominated gages (see Section 3).
Random forests are based on decision trees, which consist of a series of yes/no questions that lead to a predicted value (Breiman, 2001). Random forests can be applied to either classification or regression problems. In our case, we use the random forest for regression to predict a continuous variable (trend). In a random forest, individual decision trees are applied as an ensemble, each of which creates a vote for some value and the average vote across all trees is applied for the final prediction (Liaw and Wiener, 2002). Random forests generally are not impacted by reasonable levels of correlation between input predictor variables and can be developed to avoid over-fitting due to built-in feature randomization and tunable hyperparameters. However, because of the complexity of these models, it can be difficult to understand and control the output of a random forest.
Prior to running the random forest model, we scaled and centered the data and used a grid-search function to optimize the number of variables used in the splits (mtry = 1–10) and the number of trees in the forest (ntree = 50). We applied a 10-fold, repeat (three times) cross-validation, which randomly divided the datasets into 10 non-overlapping parts and then trained on nine of those and tested on one, repeated 10 times to test each subset, and completed this process three times. This approach was used to resample the dataset during hyper parameter selection to avoid overfitting. Ultimately, our final models accurately predicted trends in minimum, mean, and maximum streamflow over both periods (R2 > 75%) and was used to determine feature importance (Section 2.3.3).
Feature importance using caret's varImp function was assessed for these models to determine the most important features for predicting mean, minimum, and maximum annual streamflow trends across the two different periods (recent-32 and recent-46). varImp measures feature importance using the MeanDecreaseAccuracy approach. With this method, a variable's importance is measured by randomizing that variable and then measuring the decrease in out-of-bag accuracy for each individual decision tree in the random forest. Decrease in accuracy is measured as percent change in mean squared error. These decreases in accuracy are then averaged across all trees in the forest to determine the mean decrease in accuracy, which becomes the feature importance of that variable. A larger mean decrease in accuracy means that the variable is more important.
Table 1 includes an overview of the different sites utilized in this study, based on rabpro and gage metadata analysis and GF3.1 reanalysis data, and Supplementary Table 1 includes all the observational gages used in this work, ordered by permafrost coverage (%). Figure 1 illustrates the site locations across the NA Arctic/subarctic. Gages in the non-dominant permafrost group (n = 28) were generally at the lowest latitudes (average 59.06° N) with the lowest average drainage areas (26,859 km2) and an average elevation of 781.4 m. Gages in the moderate permafrost group (n = 23) were at moderate latitudes (average 61.51° N), at an average elevation of 884.2 m, and had average drainage areas similar in size to the non-dominant systems (26,493 km2). Gages in the dominant-permafrost group (n = 23) were highest in latitude (average 65.52° N), at an average elevation of 555.6 m, and had the largest drainage basin areas (44,291.3 km2). Average annual temperatures range from −2.6, −4.4, and −7.6°C, while precipitation (rain) values range from 16.8 (9.8), 15.8 (9.4), and 21.1 (12.2) km3 yr−1 in the non-dominant, moderate, and dominant permafrost groups, respectively.
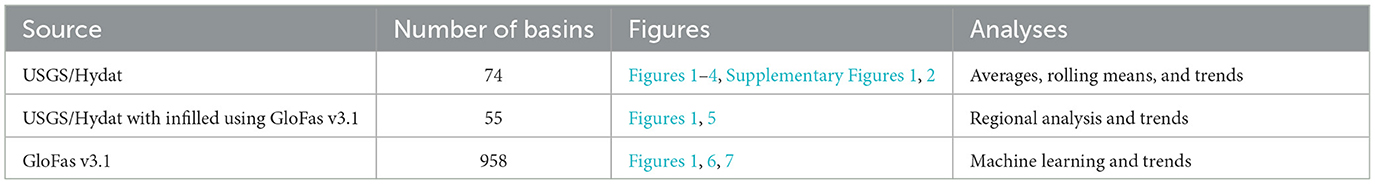
Table 1. Different streamflow basins sources, number of basins, figures, and analyses used in this study.
Average maximum, minimum, and mean seasonal and annual streamflow hydrographs for the recent-32 and recent-46 periods are given in Figure 2 (with values below expressed as the difference between the late and the early record for the recent-32 period. Shaded values in Figure 2 are the average maximum and minimum ranges for monthly streamflow, with the first part of the record (early) showing in gray and the second part of the record (late) shown in pink.
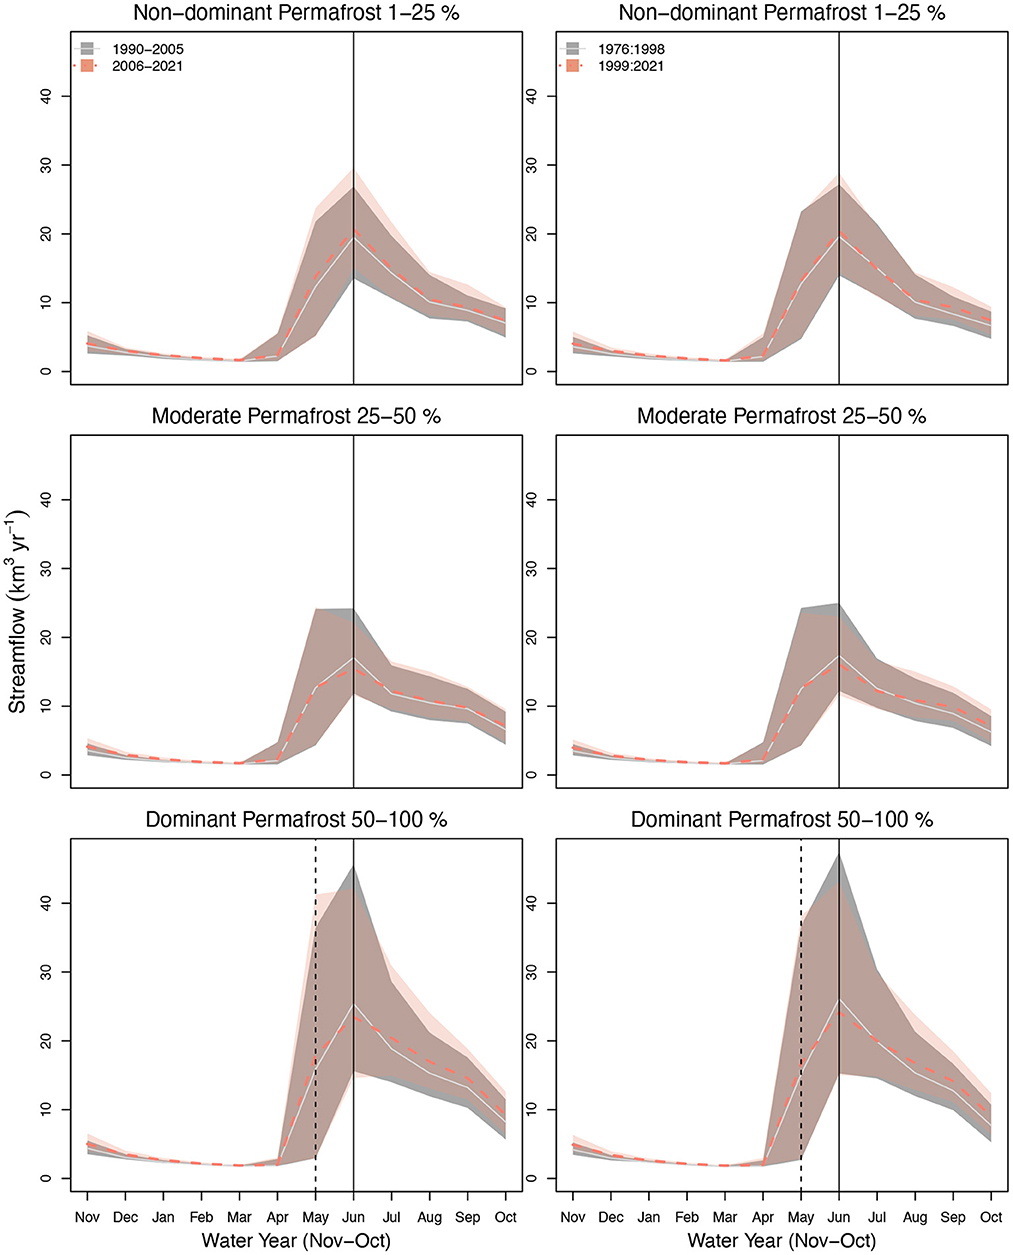
Figure 2. Average maximum and minimum ranges for monthly streamflow hydrographs (shaded areas, km3 yr−1), from the non-dominant permafrost (1–25%, n = 28), moderate (25–50%, n = 23), and permafrost-dominant (>50%, n = 23) systems for the early and late records (see legend) in 1990–2021 (left) and 1976–2021 (right). Average mean monthly streamflow is shown with a solid gray (early) and dashed pink (late) lines. Specific months are demarcated with vertical lines, solid black (June), dashed black line (May, permafrost-dominant systems).
The hydrographs show the variation between the late and early records of streamflow averages within each permafrost group. For example, the non-permafrost-dominant systems had, on average, higher annual maximum streamflow during the late record (1.95 km3 yr−1), with little to no change in the peak timing (see top left panel, Figure 2). The moderate permafrost systems, on average, showed peak flow in June in the early records. The late record shows a reduction in the June peak flows, with an overall decrease in maximum spring flows (−2.27 km3 yr−1) and minimum flows (−0.22 km3 yr−1) compared to the early record. Permafrost-dominant systems peak in June in both early and late records but exhibited an earlier and higher May streamflow (+4.77 km3 yr−1) with a lower June maximum (−3.55 km3 yr−1) and minimum (−0.99 km3 yr−1), on average. Minimum streamflow was lower in spring for the < 50 % permafrost groups (recent-32) and moderate permafrost systems (recent-32 and recent-46) in the late compared to the early record, while it was higher for the permafrost-dominant group (0.56 km3 yr−1), and generally exhibited increases in all other seasons and annually.
The standardized and scaled 5-year rolling means for seasonal and annual mean streamflow over the recent-46 years (minus the first 5 years, 1980–2021) are provided in Figure 3, with the recent-32 period indicated by orange dashed lines. For most winter and fall seasons and annual, lower streamflow transitions toward much higher streamflow in the end of the period. Winter and fall mean streamflow patterns indicated that the permafrost-dominated systems were lower earlier in the period compared with other permafrost groups. After 1990, the >50% permafrost systems followed similar trajectories and transitioned to much higher streamflow toward the end of the period. Spring and summer showed coherence across the permafrost groups with substantial interannual variability but no visible patterns. Annual signals showed the permafrost-dominant systems responded differently compared to the other permafrost groups from ~1998 to 2015, and then increased toward the end of the period while the < 50% permafrost groups decreased. Minimum streamflow (Supplementary Figure 1) showed increases across the periods in these systems overall, particularly for winter and fall seasons, and annually. Dominant permafrost systems showed increased flows earlier in time compared to the < 50% permafrost systems. Supplementary Figure 2 shows maximum streamflow rolling means, where strong annual decreases were observed toward the end of the period for all permafrost groups.
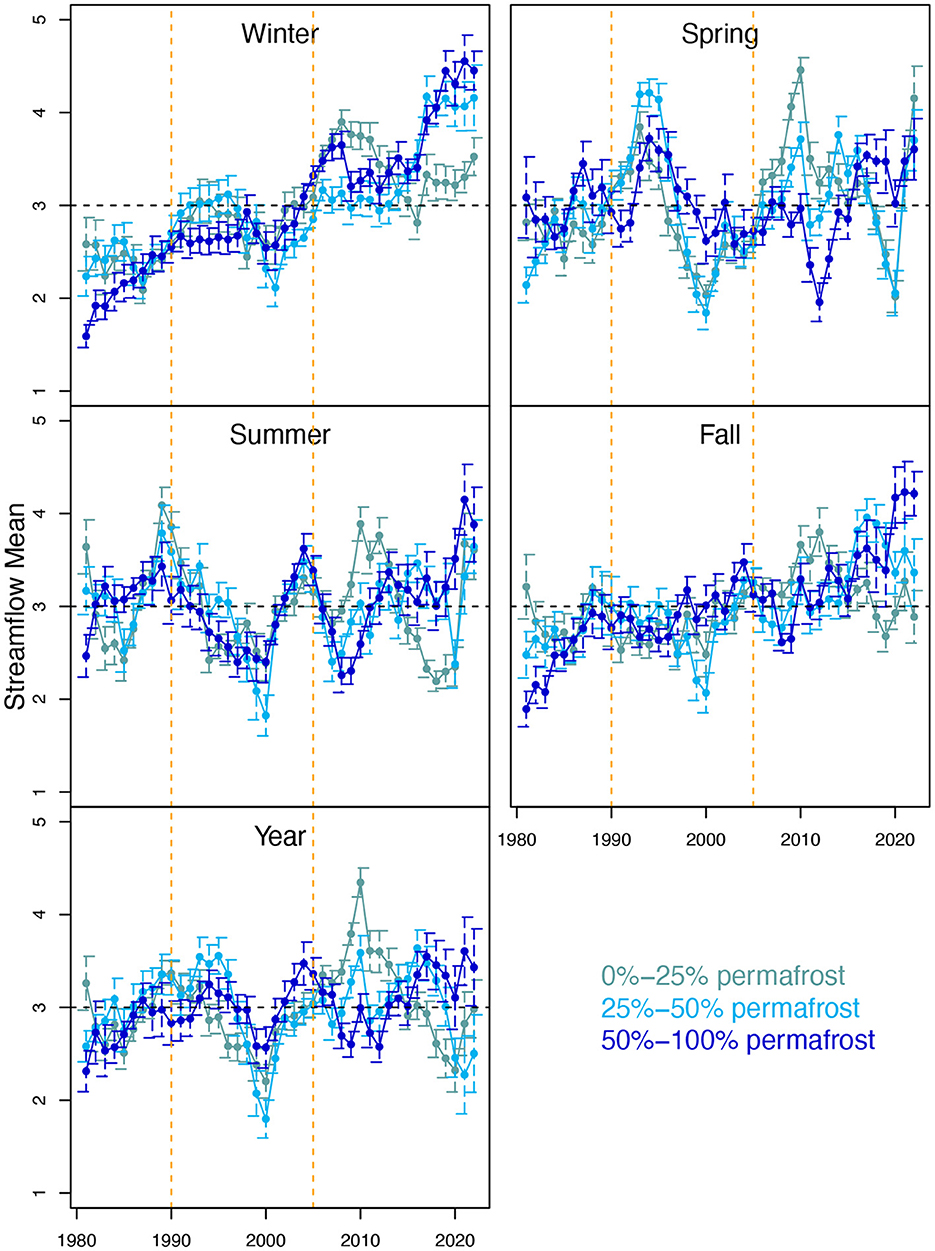
Figure 3. Five-year rolling means for mean streamflow (scaled and centered around 3, unitless) across permafrost groups for seasons and annually. Time periods for the rolling means are the 1980 to 2021 (42 years). Boundaries for the shorter period (recent-32) are shown with orange dashed lines. Minimum and maximum streamflow are shown in Supplementary Figures 1, 2.
Trends in minimum, mean, and maximum streamflow for individual systems are shown in Figure 4 (with average values for all periods provided in Table 2) for recent-32 and recent-46 periods, using a p-value threshold of 0.1 to identify detectable trends. Overall, a lot of variability exists across the seasons, periods, and permafrost groups. Minimum streamflow trends are generally increasing, with some decreases for a few seasons and periods, such as during spring (non-dominant permafrost group) for the recent-32 (Table 2). The permafrost-dominant group exhibited the strongest positive annual minimum streamflow trend for the recent-46 period (0.25 km3 yr−1 30 yrs for annual trends, Table 2), with almost half (49%) of the systems exhibiting significant positive seasonal and annual trends (Figure 4). The permafrost-dominant group also exhibited the strongest positive annual mean streamflow trends for the recent-46 period (1.82 km3 yr−1 30 yrs, Table 2), with ~1/3 (34%) of the systems exhibiting significant seasonal and annual trends (Figure 4). Trends in maximum annual streamflow were mixed, with negative annual trends for most seasons in both periods (Table 2). The strongest decline in maximum streamflow occurs in the permafrost-dominant group during the recent-32 period (−9.51 km3 yr−1 30 yrs, Table 2). Maximum streamflow had the least number of significant records, with some of the moderate permafrost systems having no significant trends (Figure 4, Table 2).
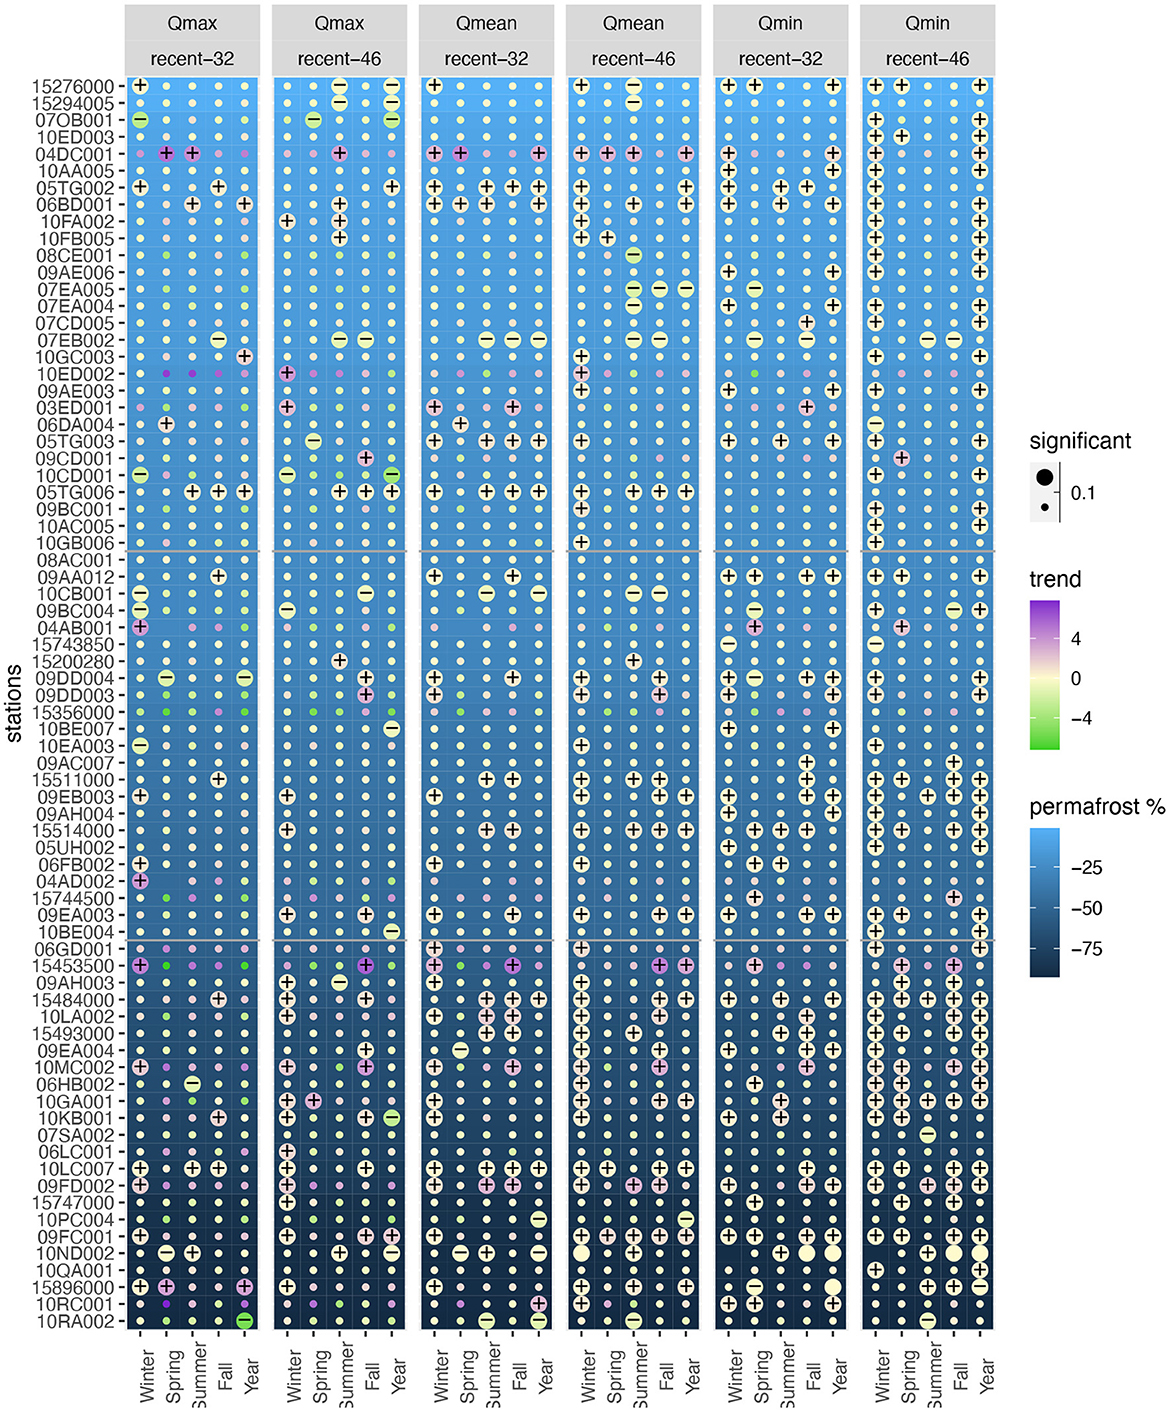
Figure 4. Maximum, minimum, and mean streamflow trends for winter, spring, summer, fall, and annual, recent-32 and recent-46 periods, for all 74 systems, ordered by permafrost % (separate groups shown by a gray line). Negative and positive values are shown for trends and large/small circles show trend significance at a p-value threshold of 0.10.
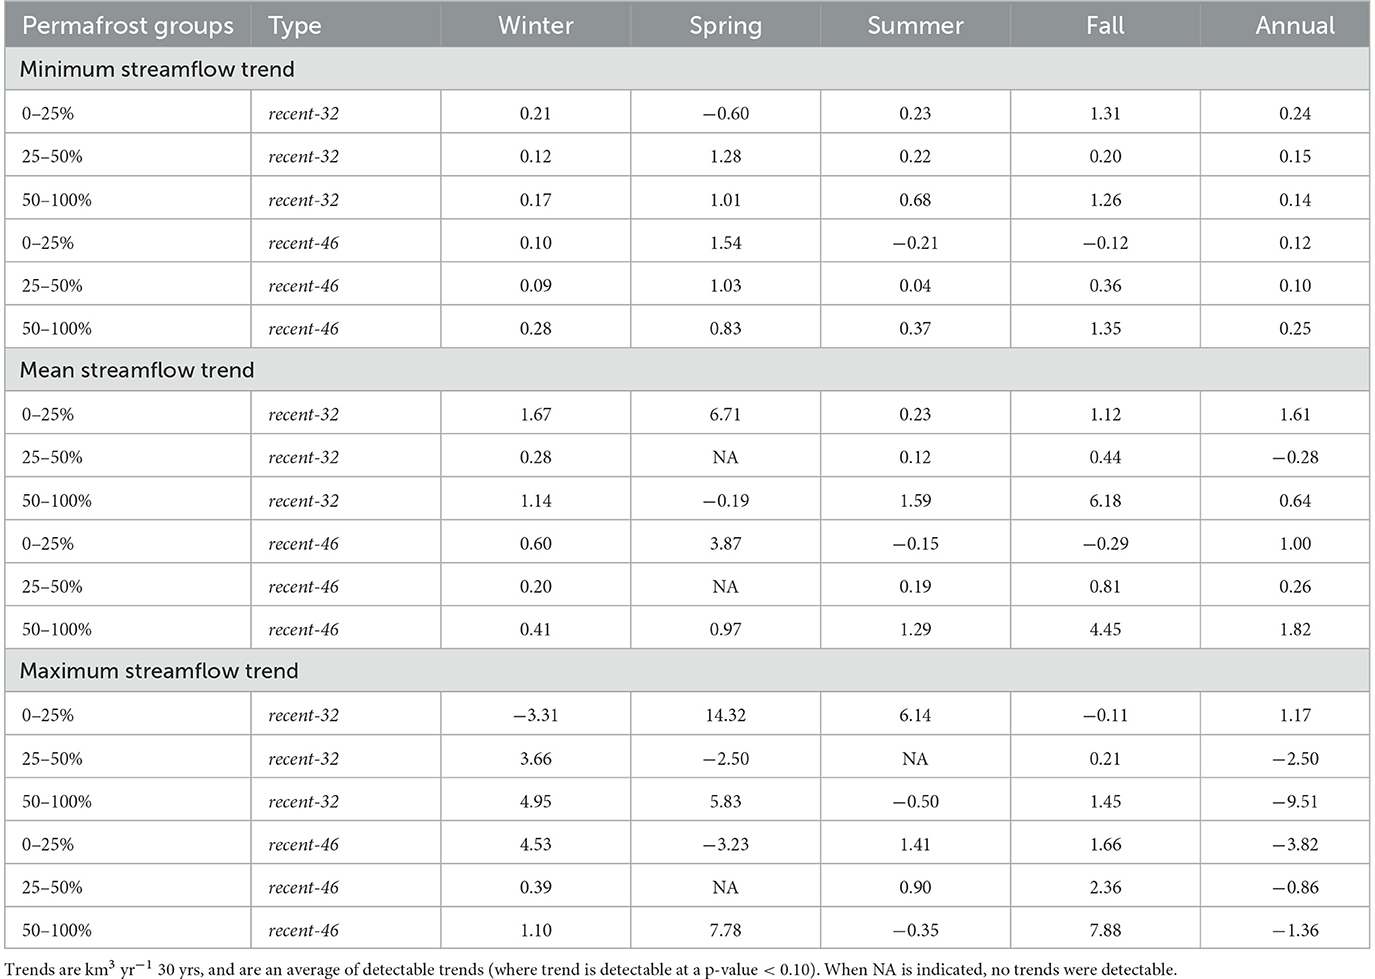
Table 2. Permafrost groups, record/period type, seasonal and annual trends for minimum, mean, and maximum streamflow.
The regional streamflow averages across 55 systems were examined for permafrost groups for the recent-46 period in Figure 5 and trend results for minimum, mean, and maximum streamflow are given in Table 3, with significant results at p-value = 0.1 (0.05) denoted in italics (bold italics). Overall, only increasing streamflow trends are significant. Minimum and mean streamflow have more significant trends than maximum streamflow (n = 9, 6, 2, respectively). Minimum and mean streamflow are significantly increasing in winter and fall in almost all permafrost groups (with the exception of the non-dominant mean streamflow in fall). Minimum streamflow trends are significantly increasing in permafrost-dominant systems in all seasons. The largest significant streamflow trend is for maximum streamflow in permafrost-dominant systems in the fall (69.7 km3 yr−1 43 yrs), followed by mean streamflow in permafrost-dominant systems in the fall (65 km3 yr−1 43 yrs). Maximum streamflow is increasing significantly only in permafrost-dominant systems in winter and fall. Annually, minimum streamflow trends are significantly increasing for all permafrost groups, while mean streamflow is only increasing in permafrost-dominant systems, and maximum streamflow are not changing significantly.
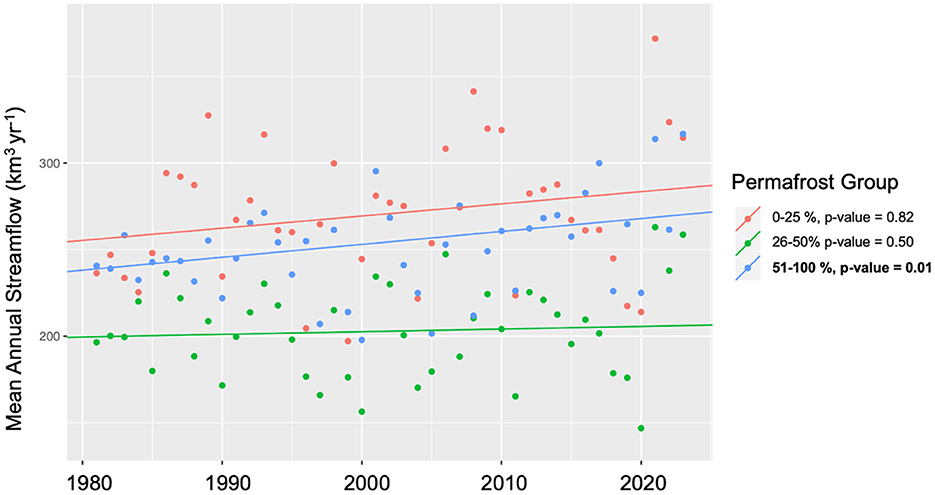
Figure 5. Regional mean annual streamflow averaged across 55 gages. Non-dominant (red) and moderate (green) are not significant, while only dominant permafrost systems are significantly increasing. The non-dominant and dominant permafrost systems have a similar trend (~32 km3 yr−1 for 46 years).
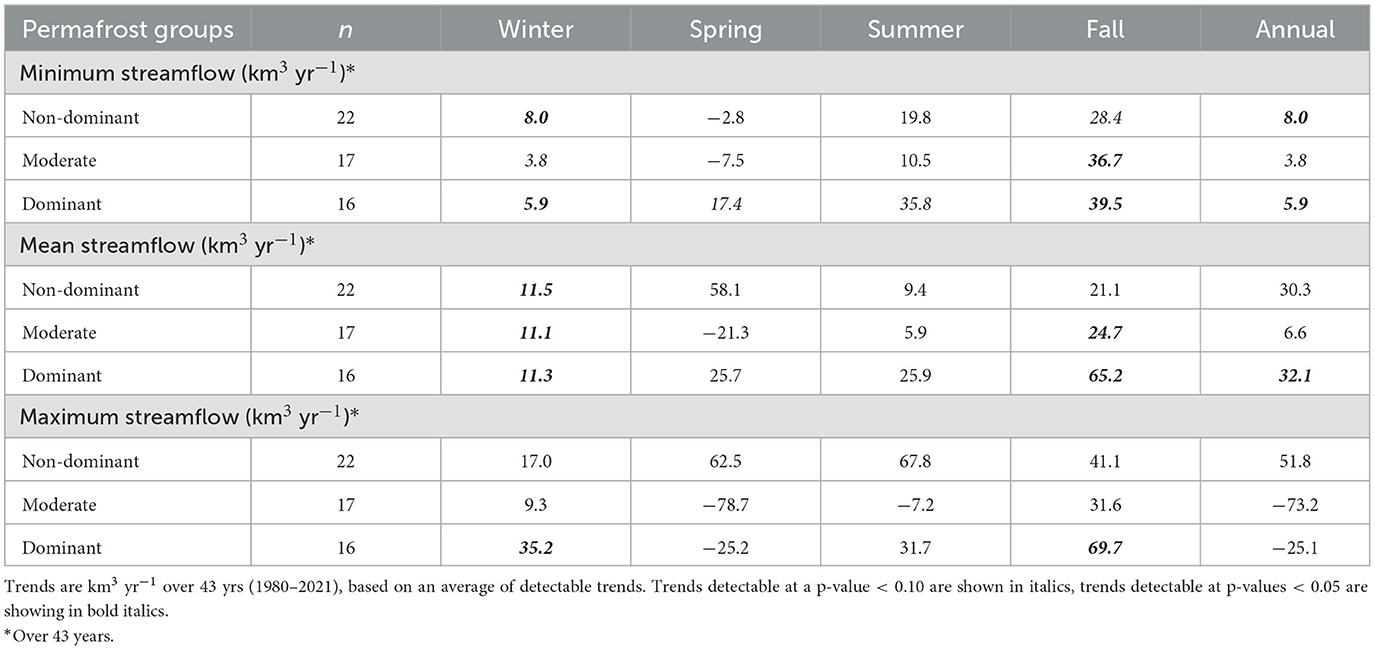
Table 3. Trends for permafrost groups, seasons, and annual for minimum, mean, and maximum regionalized streamflow (n = 55).
Figure 6 compares observed and GF3.1 mean annual streamflow values for the 23 permafrost-dominant systems. GF3.1 showed strong coherence with the observations of streamflow at these sites (adjusted R2 ≥ 0.9) annually and for all seasons (Supplementary Table 2). This finding justified the use of randomly selected permafrost systems from the GF3.1 reanalysis (n = 958) as training data for machine learning models, which we use to consider the drivers of changes in streamflow. Features used in these machine learning models are given in Supplementary Table 3. Out of the 10's of machine learning models we tested, random forest models performed best in the testing period (i.e., maximized R2, Supplementary Table 4).
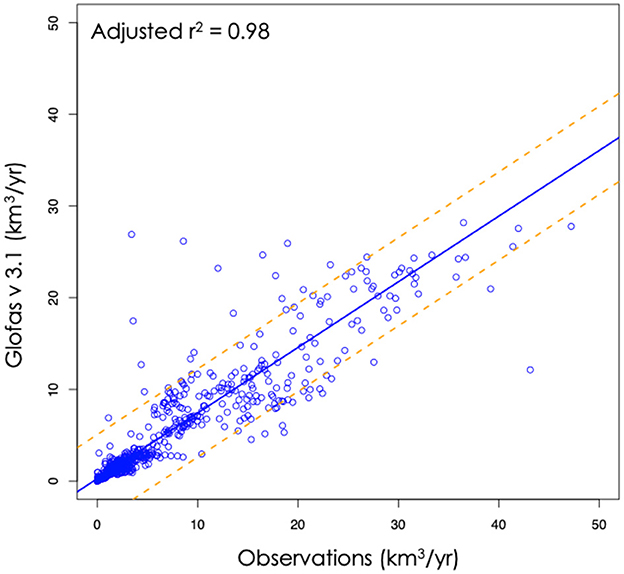
Figure 6. Comparison of the observations against the GloFas v 3.1 data sets for annual mean streamflow within the 23 permafrost-dominant systems (km3 yr−1). Orange line are two times the standard deviation.
Ultimately, we trained six random forest models using trends in seasonal ERA5 climate variables and static features as input data (nine inputs total). We trained one model each for predicting trends in annual minimum, maximum, and mean streamflow for the two different periods (recent-32 and recent-46). After training these models, we examined feature importance (Figure 7).
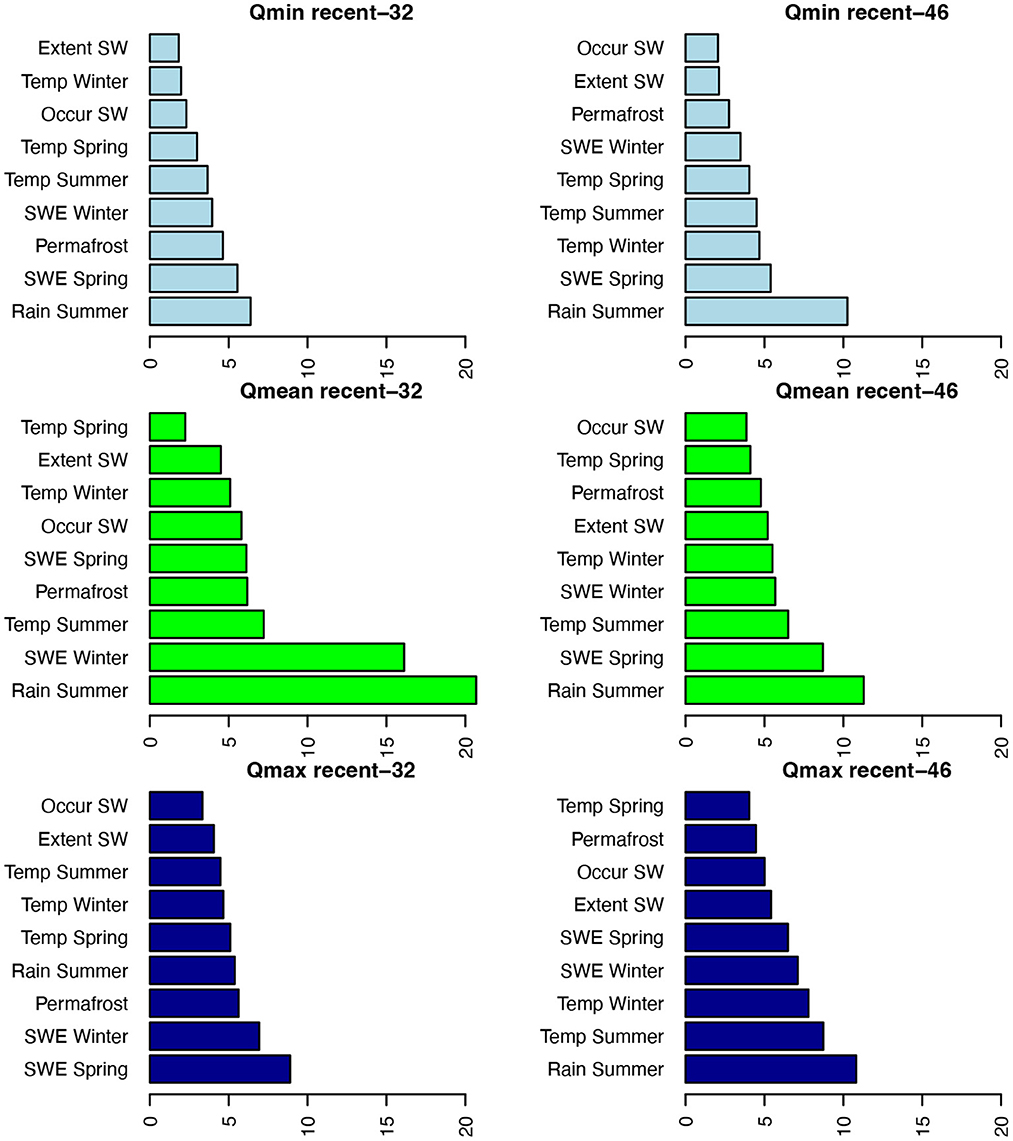
Figure 7. Feature importance for random forest predictor variables (Qmin = minimum streamflow, light blue, Qmean = mean streamflow, green, and Qmax = maximum streamflow, dark blue), the recent-32 period (left), and the recent-46 period (right). Climate variables are trends over the period of interest and are derived from ERA5. Features are defined in Supplementary Table 3.
Generally, trends in seasonal climate features such as summer rain and winter and spring snow water equivalence (SWE), and temperature in summer for one model (maximum streamflow, recent-46), rank above static features such as permafrost coverage in feature importance (Figure 7). Additionally, precipitation trends were generally ranked as more important than temperature trends.
We found that features importances changed depending on the random run we considered, an important caveat of this work, therefore we present only the most important variables and general findings herein. For annual minimum streamflow trends, which represent the low flow season, i.e., fall/winter, the top two predictor variables are summer rain and spring SWE for both periods. Permafrost is ranked as the third most important variables in the recent-32 period, while temperature variables are ranked as third, fourth, and fifth most important in the recent-46 period, with other static variables being generally ranked low in importance. For annual mean streamflow, we see again that climate trends are ranked higher than other features, with summer rain, winter SWE (recent-32), and spring SWE (recent-46) ranked as the top variables. Static variables such as permafrost is ranked as fourth, while other static variables are lower in importance. In maximum streamflow trends, spring SWE (recent-32) and rain in summer (recent-46) are the most important variables, followed by winter SWE (recent-32) and temperature in summer (recent-46). This is the only time that temperature variables are ranked in the top two in terms of importance. Permafrost coverage is ranked as third in the recent-32 period, but second to lowest in the recent-46 period.
Overall, permafrost seems to be most important for predicting streamflow trends for the recent-32 period compared to the recent-46 period.
Seasonal and annual streamflow patterns within permafrost-affected systems shifted in unique ways which can be examined using various methods, as considered in this work. Minimum streamflow increased across all permafrost systems regardless of the percentage of permafrost coverage, particularly for winter seasons, and annually; trends that held whether we considered individual systems or regional patterns. Annual trends in maximum streamflow were decreasing in the recent-46 (for all permafrost-affected systems) and over the recent-32 period (for the >25% permafrost systems). However, for regional trends, the only significant changes (increases) in maximum streamflow was for permafrost-dominant systems during the winter and fall, a new finding that may be reflective of increasing minimum streamflow patterns, owing to increases in storage within deepening active layers, as presented by other authors (St. Jacques and Sauchyn, 2009; Walvoord et al., 2012; Bring et al., 2016; Walvoord and Kurylyk, 2016; Cooper et al., 2023). The changes in annual maximum streamflow, which is indicative of changing peak streamflow, likely reflect a lower snowpack during the spring snowmelt period, and a shift toward an earlier or “flatter” spring streamflow peak, with the non-dominant permafrost systems experiencing no change in timing and a higher peak (Bokhorst et al., 2016; Rixen et al., 2022). As temperatures continue to warm in high latitude regions and peak streamflow moves earlier in the spring season, the streamflow hydrograph may become flatter as observed in our systems (increasing minimum flows and decreasing maximum flows in the spring), leading to a less dramatic peak flow and a flatter hydrograph overall (Stadnyk et al., 2021).
Overall, mean streamflow increased in our permafrost systems and most prominently in permafrost-dominant systems (regional and individual systems), with more significant results compared to maximum streamflow trends across the metrics we considered. This finding is well-documented for permafrost systems across the Arctic (McClelland et al., 2006; Durocher et al., 2019; Ahmed et al., 2020; Shrestha et al., 2021). The strong shift toward increasing flows may be indicative of accelerated streamflow runoff conditions in permafrost dominated systems. Permafrost-dominant systems are very likely changing with regards to their active layers and surface conditions (Makarieva et al., 2019; Wang et al., 2021; Wright et al., 2022), a feature that appears to be already leading to increased mean streamflow now, with stronger increases anticipated in the future (Stadnyk et al., 2021). Interestingly, our overall trend results for permafrost-dominated systems align very closely with recent estimates of increased streamflow for the Mackenzie and Yukon River systems (Druckenmiller et al., 2021; Shiklomanov et al., 2021).
Aside from differences in permafrost extent, the unique changes in permafrost-dominant systems compared to non-dominant permafrost systems could be in part due to differences in elevation and precipitation between permafrost systems. More of the non-dominant permafrost systems are headwater (higher elevation) vs. lowland systems and snowpack change under warming is elevation-dependent (Solander et al., 2018; Rottler et al., 2019), leading to unique changes in streamflow between permafrost systems. Further, permafrost-dominant systems considered here also had higher precipitation compared to the other systems.
The drivers of streamflow changes within our permafrost-dominated systems can be examined using reanalysis tools and models such as ERA5-Land and ERA5-GloFAS datasets in conjunction with machine learning techniques, although these results will be affected by biases within the climatic drivers and modeled streamflow at ungaged basins. As well, our results come with a caveat that the methodology is susceptible to data availability, randomness in the tools we applied, and methodological approach overall. Nevertheless, we saw notable differences in the grouping of climate trends and static features driving streamflow trends in our models. Overall, climate appeared to be a much stronger feature in the streamflow trends examined in these systems compared to the basin characteristics such as permafrost percent, with precipitation being ranked as more important than temperature features. Further, in the different records, basin characteristics did not usually outrank temperature variables, except for a few cases. Only for trends in streamflow in the most recent time period did we see permafrost percent start to become an important variable, which may be indicative of enhanced thawing of permafrost in more recent years, as this process begins to play an increasingly focal role in changing streamflow trends across all components of the streamflow hydrograph.
An important issue in streamflow trend analysis for Arctic and subarctic systems is the high variability that confounds the signal-to-noise within these systems. Part of this is due to the lack of streamflow gages, data intermittency, and lack of long term (i.e., 100+ years) data sets. Intermittency arises from the wintertime freezing of rivers and difficulties associated with maintaining and recording remote streamflow gage data. Longer records were associated with significant increases in statistically significant trends in our data sets; but at the same time, the more recent period showed shifts that may be indicative of enhanced warming and thawing within permafrost basins of the high latitudes. Further, as temperatures rise, precipitation and rain/snow partitioning are shifting, along with changes in the permafrost conditions, all of which can cause increases and decreases in streamflow that obscure changes in the systems. Thus, considering observations alone may be insufficient to clearly evaluate streamflow trends in a statistically robust manner. However, these limitations will likely diminish in the future given the work being done on new datasets, infilling techniques, and improved remote sensing and modeling tools (Muskett and Romanovsky, 2009; Biancamaria et al., 2016; Solander et al., 2017; Harrigan et al., 2020; Feng et al., 2021).
Our conclusions for NA streamflow system affected by permafrost are:
• Minimum streamflow significantly increased for permafrost-dominant systems over both periods analyzed, with the strongest annual increases occurring for the longer-term trends over the past 46 years.
• Mean streamflow changed with significant increases in mean streamflow trends in permafrost-dominant systems over the past 46 years.
• Maximum streamflow is changing variably, with the strongest declines in the past 32 years for the permafrost-dominant systems. The only significant longer-term changes occur in the permafrost-dominant systems in fall and winter (increases).
• Statistically significant trends were observed most clearly when regional streamflow trends longer than ~46 years.
• Increases in mean and maximum flows in permafrost-dominant systems are reflective of increasing low flows, deepening active layers, and thawing permafrost, indicating that the entire hydrograph is undergoing change within these streamflow systems.
• Climate drivers of streamflow trends are largely precipitation (rain, SWE), followed by temperature, and then by static drivers such as permafrost coverage.
• Summer rain trends were the most important predictor variable in five out of six of the variables/periods (otherwise ranked fourth), followed by SWE in spring (in the top 2 predictors for 3/6) and SWE in winter (in the top 2 predictors for 2/6).
• Percent of the basin covered by permafrost was not ranked highly (i.e., top 2) overall as a driver of streamflow trends but was the third and fourth most important in streamflow trends for the most recent 32-year period.
• Despite the many challenges to understanding changing streamflow in cold regions, there are new products and datasets in development that are increasingly allowing researchers to better understand the patterns of change in Arctic and subarctic systems affected by varying degrees of permafrost, offering a range of new tools, which, along with continued observational records, may help in improved understanding of changing Arctic streamflow patterns.
The datasets presented in this study can be found in online repositories. The names of the repositories and accession numbers can be found at: https://data.ess-dive.lbl.gov/view/doi:10.15485/1985921.
KB conceived of the work, performed data collection, analysis, original writing, and editing of the paper. JSc and JSt curated all datasets used in analysis except streamflow time series and contributed to writing and editing of the original text. CB provided original writing and edits to the text. EG provided data analysis, figure development, and editing of original text and through the review phases. WB provided feedback on concepts, data consultations, and review of original text and revisions. JR provided feedback on work concepts, review of original text and revisions, and funding as project PI. All authors contributed to the article and approved the submitted version.
This research was funded as part of the Interdisciplinary Research for Arctic Coastal Environments (InteRFACE) project through the Department of Energy, Office of Science, Biological and Environmental Research Earth and Environment Systems Sciences Division's Regional and Global Model Analysis (RGMA) program. Awarded under contract grant: #89233218CNA000001 to Triad National Security, LLC (Triad). The funder was not involved in the study design, collection, analysis, interpretation of data, the writing of this article, or the decision to submit it for publication.
We thank Alessandro Cattaneo for providing important review and discussions of results during the process of conceptualization, analysis, and writing of this manuscript. We also thank a reviewer for providing valuable and insightful comments on an early iteration of this work.
The authors declare that the research was conducted in the absence of any commercial or financial relationships that could be construed as a potential conflict of interest.
All claims expressed in this article are solely those of the authors and do not necessarily represent those of their affiliated organizations, or those of the publisher, the editors and the reviewers. Any product that may be evaluated in this article, or claim that may be made by its manufacturer, is not guaranteed or endorsed by the publisher.
The Supplementary Material for this article can be found online at: https://www.frontiersin.org/articles/10.3389/frwa.2023.1099660/full#supplementary-material
Supplementary Figure 1. Five-year rolling means for minimum streamflow across permafrost groups for seasons and annually. Time periods for the rolling means are the 1980 to 2021 (42 years). The shorter record transitions are shown with orange dashed lines. Values are scaled and centered around 3.
Supplementary Figure 2. Five-year rolling means for maximum streamflow across permafrost groups for seasons and annually. Time periods for the rolling means are the 1980 to 2021 (42 years). The shorter record transitions are shown with orange dashed lines. Values are scaled and centered around 3.
Adam, J., and Lettenmaier, D. P. (2003). Adjustment of global gridded precipitation for systematic bias. J. Geophys. Res. 108, 4257–4271. doi: 10.1029/2002JD002499
Ahmed, R., Prowse, T., Dibike, Y., Bonsal, B., and O'Neil, H. (2020). Recent trends in freshwater influx to the arctic ocean from four major arctic-draining rivers. Water 12, 1189. doi: 10.3390/w12041189
Albers, S. J. (2017). tidyhydat: Extract and tidy Canadian hydrometric data. J. Open Sour. Softw. 2, 511. doi: 10.21105/joss.00511
Arriagada, P., Karelovic, B., and Link, O. (2021). Automatic gap-filling of daily streamflow time series in data-scarce regions using a machine learning algorithm. J. Hydrol. 598, 126454. doi: 10.1016/j.jhydrol.2021.126454
Bennett, K., and Schwenk, J. (2023). Recent Streamflow Trends Across Permafrost Basins of North America: Datasets. Interdisciplinary Research for Arctic Coastal Environments (InteRFACE), ESS-DIVE Repository. Available online at: https://data.ess-dive.lbl.gov/datasets/ess-dive-b0a5daa23f59da2-20230612T161059390 (accessed June 12, 2023).
Biancamaria, S., Lettenmaier, D. P., and Pavelsky, T. M. (2016). “The SWOT mission and its capabilities for land hydrology,” in Remote Sensing and Water Resources, eds A. Cazenave, N. Champollion, J. Benveniste, and J. Chen (Berlin: Springer), 117–147. doi: 10.1007/978-3-319-32449-4_6
Biskaborn, B. K., Smith, S. L., Noetzli, J., Matthes, H., Vieira, G., Streletskiy, D. A., et al. (2019). Permafrost is warming at a global scale. Nat. Commun. 10, 264. doi: 10.1038/s41467-018-08240-4
Blöschl, G., Bierkens, M. F., Chambel, A., Cudennec, C., Destouni, G., Fiori, A., et al. (2019). Twenty-three unsolved problems in hydrology (UPH)–a community perspective. Hydrol. Sci. J. 64, 1141–1158. doi: 10.1080/02626667.2019.1620507
Bokhorst, S., Pedersen, S. H., Brucker, L., Anisimov, O., Bjerke, J. W., Brown, R. D., et al. (2016). Changing Arctic snow cover: A review of recent developments and assessment of future needs for observations, modelling, and impacts. Ambio 45, 516–537. doi: 10.1007/s13280-016-0770-0
Bring, A., Fedorova, I., Dibike, Y., Hinzman, L., Mård, J., Mernild, S. H., et al. (2016). Arctic terrestrial hydrology: A synthesis of processes, regional effects, and research challenges. J. Geophys. Res. 121, 621–649. doi: 10.1002/2015JG003131
Bronaugh, D., and Werner, A. (2009). Package “zyp”. CRAN Repository. Available online at: http://cran.r-project.org/web/packages/zyp/zyp.pdf (accessed June 9, 2023).
Chadburn, S. E., Burke, E. J., Cox, P. M., Friedlingstein, P., Hugelius, G., and Westermann, S. (2017). An observation-based constraint on permafrost loss as a function of global warming. Nat. Clim. Change 7, 340–344. doi: 10.1038/nclimate3262
Cherry, J. E., Tremblay, L. B., Stieglitz, M., Gong, G., and Déry, S. J. (2007). Development of the pan-arctic snowfall reconstruction: new land-based solid precipitation estimates for 1940-99. J. Hydrometeorol. 8, 1243–1263. doi: 10.1175/2007JHM765.1
Chylek, P., Folland, C., Klett, J. D., Wang, M., Hengartner, N., Lesins, G., et al. (2022). Annual mean arctic amplification 1970–2020: Observed and simulated by CMIP6 climate models. Geophys. Res. Lett. rs 49, e2022GL099371. doi: 10.1029/2022GL099371
Cooper, M. G., Zhou, T., Bennett, K. E., Bolton, W. R., Coon, E. T., Fleming, S. W., et al. (2023). Detecting permafrost active layer thickness change from nonlinear baseflow recession. Water Resour. Res. 59, e2022WR033154. doi: 10.1029/2022WR033154
Cunderlik, J. M., and Ouarda, T. B. (2009). Trends in the timing and magnitude of floods in Canada. J. Hydrol. 375, 471–480. doi: 10.1016/j.jhydrol.2009.06.050
Dembélé, M., Oriani, F., Tumbulto, J., Mariéthoz, G., and Schaefli, B. (2019). Gap-filling of daily streamflow time series using Direct Sampling in various hydroclimatic settings. J. Hydrol. 569, 573–586. doi: 10.1016/j.jhydrol.2018.11.076
Déry, S. J., Hernández-Henríquez, M. A., Burford, J. E., and Wood, E. F. (2009). Observational evidence of an intensifying hydrological cycle in northern Canada. Geophys. Res. Lett. 36, L13402. doi: 10.1029/2009GL038852
Déry, S. J., Stadnyk, T. A., MacDonald, M. K., and Gauli-Sharma, B. (2016). Recent trends and variability in river discharge across northern Canada. Hydrol. Earth Syst. Sci. 20, 4801–4818. doi: 10.5194/hess-20-4801-2016
Déry, S. J., and Wood, E. F. (2004). Teleconnection between the Arctic Oscillation and Hudson Bay river discharge. Geophys. Res. Lett. 31, L18205. doi: 10.1029/2004GL020729
Déry, S. J., and Wood, E. F. (2005). Decreasing river discharge in northern Canada. Geophys. Res. Lett. 32, 22845. doi: 10.1029/2005GL022845
Druckenmiller, M. L., Moon, T. A., Thoman, R. L., Ballinger, T. J., Berner, L. T., Bernhard, G. H., et al. (2021). The Arctic. Bullet. Am. Meteorol. Soc. 102, S263–S316. doi: 10.1175/BAMS-D-21-0086.1
Durocher, M., Requena, A. I., Burn, D. H., and Pellerin, J. (2019). Analysis of trends in annual streamflow to the Arctic Ocean. Hydrol. Process. 33, 1143–1151. doi: 10.1002/hyp.13392
England, M. R., Eisenman, I., Lutsko, N. J., and Wagner, T. J. W. (2021). The recent emergence of arctic amplification. Geophys. Res. Lett. 48, e2021GL094086. doi: 10.1029/2021GL094086
Falcone, J. A. (2011). GAGES-II: Geospatial Attributes of Gages for Evaluating Streamflow. Available online at: https://pubs.er.usgs.gov/publication/70046617 (accessed June 9, 2023).
Feng, D., Gleason, C. J., Lin, P., Yang, X., Pan, M., and Ishitsuka, Y. (2021). Recent changes to Arctic river discharge. Nat. Commun. 12, 6917. doi: 10.1038/s41467-021-27228-1
Frey, K. E., and McClelland, J. W. (2009). Impacts of permafrost degradation on arctic river biogeochemistry. Hydrol. Process. 23, 169–182. doi: 10.1002/hyp.7196
Gorelick, N., Hancher, M., Dixon, M., Ilyushchenko, S., Thau, D., and Moore, R. (2017). Google Earth Engine: Planetary-scale geospatial analysis for everyone. Remote Sens. Environ. 202, 18–27. doi: 10.1016/j.rse.2017.06.031
Harrigan, S., Zsoter, E., Alfieri, L., Prudhomme, C., Salamon, P., Wetterhall, F., et al. (2020). GloFAS-ERA5 operational global river discharge reanalysis 1979–present. Earth Syst. Sci. Data 12, 2043–2060. doi: 10.5194/essd-12-2043-2020
Hayes, D. J., Kicklighter, D. W., McGuire, A. D., Chen, M., Zhuang, Q., Yuan, F., et al. (2014). The impacts of recent permafrost thaw on land–atmosphere greenhouse gas exchange. Environ. Res. Lett. 9, e045005. doi: 10.1088/1748-9326/9/4/045005
Holmes, R. M., McClelland, J. W., Peterson, B. J., Tank, S. E., Bulygina, E., Eglinton, T. I., et al. (2012). Seasonal and annual fluxes of nutrients and organic matter from large rivers to the Arctic Ocean and surrounding seas. Estuar. Coasts 35, 369–382. doi: 10.1007/s12237-011-9386-6
Holmes, R. M., McClelland, J. W., Raymond, P. A., Frazer, B. B., Peterson, B. J., and Stieglitz, M. (2008). Lability of DOC transported by Alaskan rivers to the Arctic Ocean. Geophys. Res. Lett. 35, 32837. doi: 10.1029/2007GL032837
Huang, Q., Ma, N., and Wang, P. (2022). Faster increase in evapotranspiration in permafrost-dominated basins in the warming Pan-Arctic. J. Hydrol. 615, 128678. doi: 10.1016/j.jhydrol.2022.128678
Huntington, T. G. (2006). Evidence for intensification of the global water cycle: Review and synthesis. J. Hydrol. 319, 83–95. doi: 10.1016/j.jhydrol.2005.07.003
Koenigk, T., Key, J., and Vihma, T. (2020). “Climate change in the arctic,” in Physics and Chemistry of the Arctic Atmosphere Springer Polar Sciences, eds A. Kokhanovsky and C. Tomasi (Cham: Springer International Publishing), 673–705. doi: 10.1007/978-3-030-33566-3_11
Kuhn, M. (2008). Building predictive models in R using the caret package. J. Stat. Softw. 28, 1–26. doi: 10.18637/jss.v028.i05
Lawrence, D. M., Slater, A. G., and Swenson, S. C. (2012). Simulation of present-day and future permafrost and seasonally frozen ground conditions in CCSM4. J. Climate 25, 2207–2225. doi: 10.1175/JCLI-D-11-00334.1
Liaw, A., and Wiener, M. (2002). Classification and regression by randomForest. R News 2, 18–22. Available online at: https://cran.r-project.org/doc/Rnews/Rnews_2002-3.pdf
Liljedahl, A. K., Boike, J., Daanen, R. P., Fedorov, A. N., Frost, G. V., Grosse, G., et al. (2016). Pan-Arctic ice-wedge degradation in warming permafrost and its influence on tundra hydrology. Nat. Geosci. 9, 312–318. doi: 10.1038/ngeo2674
Liu, W., Fortier, R., Molson, J., and Lemieux, J.-M. (2021). A conceptual model for talik dynamics and icing formation in a river floodplain in the continuous permafrost zone at Salluit, Nunavik (Quebec), Canada. Permafrost Periglacial Process. 32, 468–483. doi: 10.1002/ppp.2111
Makarieva, O., Nesterova, N., Post, D. A., Sherstyukov, A., and Lebedeva, L. (2019). Warming temperatures are impacting the hydrometeorological regime of Russian rivers in the zone of continuous permafrost. Cryosphere 13, 1635–1659. doi: 10.5194/tc-13-1635-2019
McClelland, J. W., Déry, S. J., Peterson, B. J., Holmes, R. M., and Wood, E. F. (2006). A pan-arctic evaluation of changes in river discharge during the latter half of the 20th century. Geophys. Res. Lett. 33, 25753. doi: 10.1029/2006GL025753
McNamara, J. P., Kane, D. L., Hobbie, J. E., and Kling, G. W. (2008). Hydrologic and biogeochemical controls on the spatial and temporal patterns of nitrogen and phosphorus in the Kuparuk River, arctic Alaska. Hydrol. Process 22, 3294–3309. doi: 10.1002/hyp.6920
Muñoz-Sabater, J., Dutra, E., Agustí-Panareda, A., Albergel, C., Arduini, G., Balsamo, G., et al. (2021). ERA5-Land: A state-of-the-art global reanalysis dataset for land applications. Earth Syst. Sci. Data 13, 4349–4383. doi: 10.5194/essd-13-4349-2021
Muskett, R. R., and Romanovsky, V. E. (2009). Groundwater storage changes in arctic permafrost watersheds from GRACE and in situ measurements. Environ. Res. Lett. 4, e045009. doi: 10.1088/1748-9326/4/4/045009
Neilson, B. T., Cardenas, M. B., O'Connor, M. T., Rasmussen, M. T., King, T. V., and Kling, G. W. (2018). Groundwater flow and exchange across the land surface explain carbon export patterns in continuous permafrost watersheds. Geophys. Res. Lett. 45, 7596–7605. doi: 10.1029/2018GL078140
Nitze, I., Grosse, G., Jones, B. M., Romanovsky, V. E., and Boike, J. (2018). Remote sensing quantifies widespread abundance of permafrost region disturbances across the Arctic and Subarctic. Nat. Commun. 9, 5423. doi: 10.1038/s41467-018-07663-3
Obu, J., Westermann, S., Bartsch, A., Berdnikov, N., Christiansen, H. H., Dashtseren, A., et al. (2019). Northern Hemisphere permafrost map based on TTOP modelling for 2000–2016 at 1 km2 scale. Earth-Sci. Rev. 193, 299–316. doi: 10.1016/j.earscirev.2019.04.023
Parazoo, N. C., Koven, C. D., Lawrence, D. M., Romanovsky, V., and Miller, C. E. (2018). Detecting the permafrost carbon feedback: Talik formation and increased cold-season respiration as precursors to sink-to-source transitions. Cryosphere 12, 123–144. doi: 10.5194/tc-12-123-2018
Peterson, B. J., Holmes, R. M., McClelland, J. W., Vorosmarty, C. J., Lammers, R. B., Shiklomanov, A. I., et al. (2002). Increasing river discharge to the Arctic Ocean. Science 298, 1077445. doi: 10.1126/science.1077445
Pigott, T. D. (2001). A review of methods for missing data. Educ. Res. Eval. 7, 353–383. doi: 10.1076/edre.7.4.353.8937
Prowse, T., Bring, A., Mård, J., Carmack, E., Holland, M., Instanes, A., et al. (2015). Arctic freshwater synthesis: Summary of key emerging issues. J. Geophys. Res. 120, 1887–1893. doi: 10.1002/2015JG003128
Rawlins, M. A., Steele, M., Holland, M. M., Adam, J. C., Cherry, J. E., Francis, J. A., et al. (2010). Analysis of the arctic system for freshwater cycle intensification: Observations and expectations. J. Climate 23, 5715–5737. doi: 10.1175/2010JCLI3421.1
Rixen, C., Høye, T. T., Macek, P., Aerts, R., Alatalo, J. M., Anderson, J. T., et al. (2022). Winters are changing: Snow effects on Arctic and alpine tundra ecosystems. Arctic Sci. 8, 572–608. doi: 10.1139/as-2020-0058
Rood, S. B., Kaluthota, S., Philipsen, L. J., Rood, N. J., and Zanewich, K. P. (2017). Increasing discharge from the Mackenzie River system to the Arctic Ocean. Hydrol. Process. 31, 150–160. doi: 10.1002/hyp.10986
Rottler, E., Kormann, C., Francke, T., and Bronstert, A. (2019). Elevation-dependent warming in the Swiss Alps 1981–2017: Features, forcings and feedbacks. Int. J. Climatol. 39, 2556–2568. doi: 10.1002/joc.5970
Rowland, J. C., Jones, C. E., Altmann, G., Bryan, R., Crosby, B. T., Hinzman, L. D., et al. (2010). Arctic landscapes in transition: Responses to Thawing Permafrost. Eos Transact. Am. Geophys. Union 91, 229–230. doi: 10.1029/2010EO260001
Schuur, E. A., McGuire, A. D., Schädel, C., Grosse, G., Harden, J. W., Hayes, D. J., et al. (2015). Climate change and the permafrost carbon feedback. Nature 520, 171–179. doi: 10.1038/nature14338
Schwenk, J., Zussman, T., Stachelek, J., and Rowland, J. C. (2022). rabpro: Global watershed boundaries, river elevation profiles, and catchment statistics. J. Open Source Softw. 7, 4237. doi: 10.21105/joss.04237
Serreze, M. C., Walsh, J. E., Chapin, F. S., Osterkamp, T., Dyurgerov, M., Romanovsky, V., et al. (2000). Observational evidence of recent change in the northern high-latitude environment. Climatic Change 46, 159–207. doi: 10.1023/A:1005504031923
Shiklomanov, A., Déry, S., Tretiakov, M., Yang, D., Magritsky, D., Georgiadi, A., et al. (2021). “River freshwater flux to the arctic ocean,” in Arctic Hydrology, Permafrost and Ecosystems, eds D. Yang and D. L. Kane (Cham: Springer International Publishing), 703–738. doi: 10.1007/978-3-030-50930-9_24
Shrestha, R. R., Pesklevits, J., Yang, D., Peters, D. L., and Dibike, Y. B. (2021). Climatic controls on mean and extreme streamflow changes across the permafrost region of Canada. Water 13, 626. doi: 10.3390/w13050626
Solander, K. C., Bennett, K. E., Fleming, S. W., Gutzler, D. S., Hopkins, E. M., and Middleton, R. S. (2018). Interactions between climate change and complex topography drive observed streamflow changes in the Colorado river basin. J. Hydrometeorol. 19, 1637–1650. doi: 10.1175/JHM-D-18-0012.1
Solander, K. C., Reager, J. T., Wada, Y., Famiglietti, J. S., and Middleton, R. S. (2017). GRACE satellite observations reveal the severity of recent water over-consumption in the United States. Sci. Rep. 7, 8723. doi: 10.1038/s41598-017-07450-y
Stadnyk, T. A., Tefs, A., Broesky, M., Déry, S. J., Myers, P. G., Ridenour, N. A., et al. (2021). Changing freshwater contributions to the Arctic: A 90-year trend analysis (1981–2070). Elementa 9, e00098. doi: 10.1525/elementa.2020.00098
St. Jacques, J.-M., and Sauchyn, D. J. (2009). Increasing winter baseflow and mean annual streamflow from possible permafrost thawing in the Northwest Territories, Canada. Geophys. Res. Lett. 36, L01401. doi: 10.1029/2008GL035822
Stuefer, S. L., Arp, C. D., Kane, D. L., and Liljedahl, A. K. (2017). Recent extreme runoff observations from coastal arctic watersheds in Alaska. Water Resour. Res. 53, 9145–9163. doi: 10.1002/2017WR020567
Teegavarapu, R. S. V., and Nayak, A. (2017). Evaluation of long-term trends in extreme precipitation: Implications of in-filled historical data use for analysis. J. Hydrol. 550, 616–634. doi: 10.1016/j.jhydrol.2017.05.030
Walvoord, M. A., and Kurylyk, B. L. (2016). Hydrologic impacts of thawing permafrost—A review. Vadose Zone J. 15, 10. doi: 10.2136/vzj2016.01.0010
Walvoord, M. A., and Striegl, R. G. (2007). Increased groundwater to stream discharge from permafrost thawing in the Yukon River basin: Potential impacts on lateral export of carbon and nitrogen. Geophys. Res. Lett. 34, 30216. doi: 10.1029/2007GL030216
Walvoord, M. A., Voss, C. I., and Wellman, T. P. (2012). Influence of permafrost distribution on groundwater flow in the context of climate-driven permafrost thaw: Example from Yukon Flats Basin, Alaska, United States. Water Resour. Res. 48, 111595. doi: 10.1029/2011WR011595
Wang, P., Huang, Q., Pozdniakov, S. P., Liu, S., Ma, N., Wang, T., et al. (2021). Potential role of permafrost thaw on increasing Siberian river discharge. Environ. Res. Lett. 16, e034046. doi: 10.1088/1748-9326/abe326
Wang, R., Kumar, M., and Link, T. E. (2016). Potential trends in snowmelt-generated peak streamflows in a warming climate. Geophys. Res. Lett. 43, 5052–5059. doi: 10.1002/2016GL068935
Wendisch, M., Brückner, M., Crewell, S., Ehrlich, A., Notholt, J., Lüpkes, C., et al. (2022). Atmospheric and surface processes, and feedback mechanisms determining arctic amplification: A review of first results and prospects of the (AC)3 project. Bullet. Am. Meteorol. Soc. 104, 208–242. doi: 10.1175/BAMS-D-21-0218.1
Woo, M. K., and Thorne, R. (2003). Streamflow in the Mackenzie Basin, Canada. Arctic 56, 328–340. doi: 10.14430/arctic630
Wright, S. N., Thompson, L. M., Olefeldt, D., Connon, R. F., Carpino, O. A., Beel, C. R., et al. (2022). Thaw-induced impacts on land and water in discontinuous permafrost: A review of the Taiga Plains and Taiga Shield, northwestern Canada. Earth-Sci. Rev. 232, 104104. doi: 10.1016/j.earscirev.2022.104104
Yamazaki, D., Ikeshima, D., Sosa, J., Bates, P. D., Allen, G. H., and Pavelsky, T. M. (2019). MERIT hydro: A high-resolution global hydrography map based on latest topography dataset. Water Resour. Res. 55, 5053–5073. doi: 10.1029/2019WR024873
Yang, D., Kane, D., Zhang, Z., Legates, D., and Goodison, B. (2005). Bias corrections of long-term (1973–2004) daily precipitation data over the northern regions. Geophys. Res. Lett. 32, L19501. doi: 10.1029/2005GL024057
Yue, S., Pilon, P., Phinney, B., and Cavadias, G. (2002). The influence of autocorrelation on the ability to detect trend in hydrological series. Hydrol. Process. 16, 1807–1829. doi: 10.1002/hyp.1095
Zhang, X., Harvey, K. D., Hogg, W. D., and Yuzyk, T. R. (2001). Trends in Canadian streamflow. Water Resour. Res. 37, 987–998. doi: 10.1029/2000WR900357
Zhang, X., Vincent, L. A., Hogg, W., and Niitsoo, A. (2000). Temperature and precipitation trends in Canada during the 20th century. Atmos. Ocean 38, 395–429. doi: 10.1080/07055900.2000.9649654
Zhang, Y., and Post, D. (2018). How good are hydrological models for gap-filling streamflow data? Hydrol. Earth Syst. Sci. 22, 4593–4604. doi: 10.5194/hess-22-4593-2018
Keywords: streamflow, trends, permafrost, climate change, snow, North America, Arctic
Citation: Bennett KE, Schwenk J, Bachand C, Gasarch E, Stachelek J, Bolton WR and Rowland JC (2023) Recent streamflow trends across permafrost basins of North America. Front. Water 5:1099660. doi: 10.3389/frwa.2023.1099660
Received: 16 November 2022; Accepted: 30 May 2023;
Published: 29 June 2023.
Edited by:
Lixin Jin, The University of Texas at El Paso, United StatesReviewed by:
Katherine B. Lininger, University of Colorado Boulder, United StatesCopyright © 2023 Bennett, Schwenk, Bachand, Gasarch, Stachelek, Bolton and Rowland. This is an open-access article distributed under the terms of the Creative Commons Attribution License (CC BY). The use, distribution or reproduction in other forums is permitted, provided the original author(s) and the copyright owner(s) are credited and that the original publication in this journal is cited, in accordance with accepted academic practice. No use, distribution or reproduction is permitted which does not comply with these terms.
*Correspondence: Katrina E. Bennett, a2Jlbm5ldHRAbGFubC5nb3Y=
Disclaimer: All claims expressed in this article are solely those of the authors and do not necessarily represent those of their affiliated organizations, or those of the publisher, the editors and the reviewers. Any product that may be evaluated in this article or claim that may be made by its manufacturer is not guaranteed or endorsed by the publisher.
Research integrity at Frontiers
Learn more about the work of our research integrity team to safeguard the quality of each article we publish.