
95% of researchers rate our articles as excellent or good
Learn more about the work of our research integrity team to safeguard the quality of each article we publish.
Find out more
ORIGINAL RESEARCH article
Front. Water , 15 June 2023
Sec. Water Resource Management
Volume 5 - 2023 | https://doi.org/10.3389/frwa.2023.1081850
This article is part of the Research Topic Potential and Limitations of Nature-based Solutions (NbS) to Global Water Challenges View all 5 articles
 Thea Wübbelmann1,2*
 Kristian Förster3,4
 Laurens M. Bouwer1
 Claudia Dworczyk2Steffen Bender1Benjamin Burkhard2,5
Urban areas are mostly highly sealed spaces, which often leads to large proportions of surface runoff. At the same time, heavy rainfall events are projected to increase in frequency and intensity with anthropogenic climate change. Consequently, higher risks and damages from pluvial flooding are expected. The analysis of Flood Regulating Ecosystem Services (FRES) can help to determine the benefits from nature to people by reducing surface runoff and runoff peaks. However, urban FRES are rarely studied for heavy rainfall events under changing climate conditions. Therefore, we first estimate the functionality of current urban FRES-supply and demand under changing climate conditions. Second, we identify the effects of Nature-based Solutions (NbS) on FRES-supply and demand and their potential future functionality and benefits concerning more intensive rainfall events. A district of the city of Rostock in northeastern Germany serves as the case study area. In addition to the reference conditions based on the current land use, we investigate two potential NbS: (1) increasing the number of trees; and (2) unsealing and soil improvement. Both NbS and a combination of both are applied for three heavy rainfall scenarios. In addition to a reference scenario, two future scenarios were developed to investigate the FRES functionality, based on 21 and 28% more intense rainfall. While the potential FRES-demand was held constant, we assessed the FRES-supply and actual demand for all scenario combinations, using the hydrological model LEAFlood. The comparison between the actual demand and supply indicates the changes in FRES-supply surplus and unmet demand increase. Existing land use structures reached a FRES capacity and cannot buffer more intense rainfall events. Whereas, the NbS serve FRES benefits by increasing the supply and reducing the actual demand. Using FRES indicators, based on hydrological models to estimate future functionality under changing climate conditions and the benefits of NbS, can serve as an analysis and decision-support tool for decision-makers to reduce future urban flood risk.
Heavy rainfall is projected to increase in frequency and intensity due to climate change (Jacob et al., 2014; Rajczak and Schär, 2017; IPCC, 2021). Consequently, rainfall changes will have a major impact on pluvial flooding in urban areas. Flood Regulating Ecosystem Services (FRES) can function as a measure to mitigate pluvial flooding. Ecosystem Services (ES) are defined as the linkage of ecosystems and society with direct or indirect contributions of ecosystem functions to human wellbeing (MEA, 2005; TEEB, 2010). FRES, in particular, are ecosystem processes and functions that store water and consequently decrease surface runoff, which benefits human wellbeing by protecting and securing livelihoods (Burkhard and Maes, 2017). FRES-supply comprises the contribution of the ecosystem to reduce the flood hazard and the ecosystem delivers a service when there is a societal demand or need for this flood reduction. Therefore, climate change must be urgently taken into account in the assessment of FRES to prove their future functionality (Maes et al., 2020).
Different studies already address the impact of climate change on the future functionality of FRES using hydrological modeling (Shen et al., 2021; Wübbelmann et al., 2021). In general, FRES assessments focus on fluvial floods in catchments on the regional or European scale (Nedkov and Burkhard, 2012; Stürck et al., 2014; Gaglio et al., 2019). However, cities are particularly affected by pluvial floods because of two reasons. First, they are vulnerable due to high population densities and the large potential for social and economic damage. Second, the high degree of sealing has modified the water cycle and contributed to higher surface runoff. So far, FRES has been less frequently applied at the local or urban scale (Shen et al., 2019; Wübbelmann et al., 2022).
Mismatch analyses of supply and demand can identify and visualize the benefits of FRES to society. The results can also reveal whether the demand for flood reduction can be met or not. In the case of heavy rain events, unmet demand may indicate flood risk to people and infrastructure. However, ES demand is less frequently spatially assessed and mapped (Campagne et al., 2020), causing research and knowledge gaps in mismatch analyses. For instance, Mori et al. (2022) mapped supply, demand, and budget changes between 1990 and 2018 for a river basin using SWAT, and Xiong and Wang (2022) conducted a mismatch analysis for an urban area. However, the future functionality of urban FRES under changing climate conditions for heavy rainfall events remains unclear in most of the existing studies.
To counteract flood risks and to adapt to climate change, different concepts of natural adaptation measures exist (Kabisch et al., 2017). One concept of adaptation measures is Nature-based Solutions (NbS). NbS are measures or actions, which are inspired or supported by nature and use or imitate its complex characteristics and processes (European Commission, 2015). They are “actions to protect, sustainably manage and restore natural or modified ecosystems, which address societal challenges […] effectively and adaptively, while simultaneously providing human well-being and biodiversity benefits” (Cohen-Shacham et al., 2016, p. 12). However, for a successful implementation, urban planners lack information on the performance and benefits of NbS (Zölch et al., 2017). With the concept of ES, this knowledge gap can be closed by considering the supply of ecosystems and the contribution of green infrastructure to flood regulation as benefits and contributions to human safety.
For sustainable development, the NbS must withstand the impact of climate change and should also contribute services under future conditions. However, strong evidence of the performance of NbS for climate adaptation is missing (Kabisch et al., 2016). Zölch et al. (2017) tested different NbS regarding their capacity and functionality under higher precipitation amounts with hydrological models. With increasing rainfall intensity, the runoff regulation potential of the NbS decreased. Other studies used system dynamic models to assess the long-term effectiveness of NbS under changing climate conditions in rural areas (Gómez Martín et al., 2021). Studies on water supply and regulation for the future functionality of NbS under changing climate conditions for a floodplain have been conducted using the InVEST model that analyses seasonal water yield (Gaglio et al., 2019; Natural Capital Project, 2020). However, a comprehensive ES analysis including supply and demand in the urban area is missing.
Most studies on FRES for reducing impacts from climate change and the usefulness of NbS are focused on floodplains and river catchments. The few existing studies on urban FRES are related to the current situation and lack the analysis of future scenarios. Therefore, the objectives of this study are (1) to estimate the future functionality of urban FRES under more intense rainfall on the event-scale, and (2) to estimate the benefits of NbS on urban FRES under current and future climate conditions. For this, we determine the FRES-supply change, the change in actual demand, and finally, the change in the FRES budget. These objectives lead to the following research questions:
• How does more extreme precipitation affect urban FRES-supply and as a consequence the urban FRES-actual demand?
• Can ecosystem-based climate adaptation by NbS enhance the urban FRES-supply and reduce the actual demand and how significant is their benefit related to more intense rainfall events?
• Can the future functionality of urban FRES and mismatches between FRES-supply and demand be identified with the suggested approach?
The study area is located in the southwest of Rostock in northern Germany and has an area of 4.5 km2 (see Figure 1). In the past, Rostock was affected by several heavy rainfall events. In particular, in the summer of 2011, several heavy rainfall events were observed (Miegel, 2011), which created awareness and resulted in research projects. The study area was chosen because of the present critical infrastructure, the diversity of urban land use structures, and the flooding observed in the past in the area. In particular, the Holbeinplatz—an important transport hub—in the east of the study area is located in a depression and is therefore regularly affected by flooding.
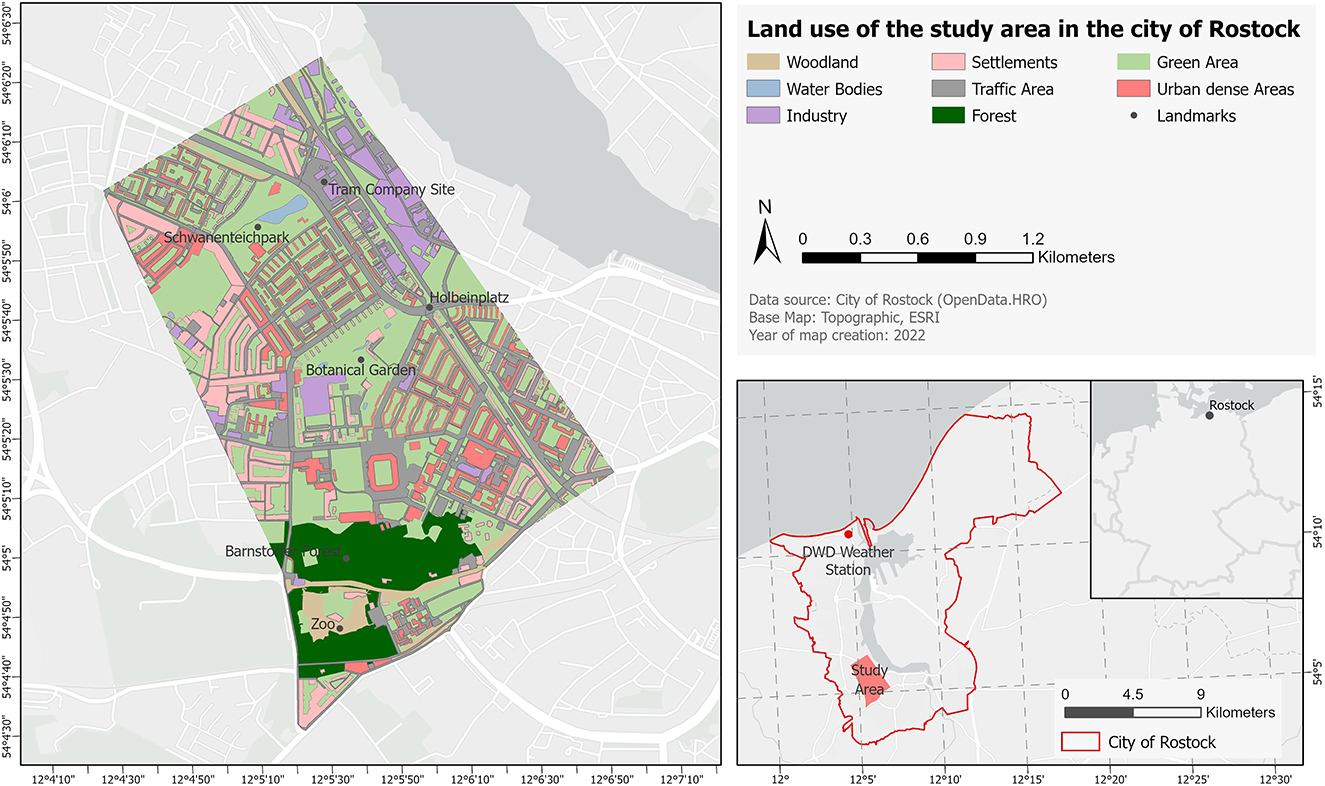
Figure 1. Location and land use of the research area in Rostock.
The dominant land-use types are green areas (parks, forests, and woodland) covering 50 % of the area, 23 % consisting of traffic areas, and 25 % containing sealed areas (settlements, urban dense areas, and industry; Steinbeis-Transferzentrum Geoinformatik, 2017). The predominant soil types are luvisol-pseudogley and regosol and the substrate textures of the soil are wet sandy loam and loamy sand (Hanse- und Universitätsstadt Rostock - Amt für Umwelt- und Klimaschutz, 2019). The climate conditions in Rostock are mild-maritime due to the vicinity of the Baltic Sea. The mean annual temperature is 9.4°C (1981–2010; DWD Climate Data Center, 2022a) and the annual precipitation sum is 646.2 mm with summer precipitation of around 202 mm (DWD Climate Data Center, 2022b) at the DWD station Rostock-Warnemünde (closest weather station in ~ 9.6 km distance).
The hydrological modeling and FRES analysis require several datasets. Supplementary Table 1 shows a detailed overview of the data used.
The spatial geometry of the hydrological model is defined by the spatial data of land use, soil type, elevation, and tree coverage and characteristics. Temperature, relative humidity, solar radiation, wind speed, and precipitation comprise the meteorological input data. For them, observation data were taken from the climate station Rostock-Warnemünde, operated by the national German Weather Service (DWD). The heavy precipitation event used for the present study was observed on 6th August 2011 and lasted over 1 h with a rainfall total of 21.7 mm. Further spatial data about infrastructure, population density, land reference value, and appearance of monuments were used for the FRES-demand analysis (see Supplementary Table 1).
The hydrological model quantifies ES indicators for canopy interception, soil water for the supply, and the surface water depth for the actual demand. We used the hydrological model LEAFlood (Landscape vEgetAtion and Flood model) (Wübbelmann and Förster, 2022), which is based on the modular and open-source Python package “Catchment Modelling Framework” (CMF) (Kraft et al., 2011; Kraft, 2020). LEAFlood adopts and uses CMF functions to create a mesh out of a GIS shapefile. The model enables a detailed presentation of canopy interception, including through fall and canopy evaporation. Infiltration follows the Green-Ampt approach (Rawls et al., 1993) and the Brooks–Corey Retention curve. The lateral surface runoff simulation uses a 2D kinematic wave approximation (Figure 2). The representation of canopy interception and runoff by LEAFlood was verified in detail by Medina Camarena et al. (2022), who compared measured runoff and canopy interception observations with LEAFlood results in calibration and validation analysis. Since hydrological and hydraulic measurements were not available for the present study area, the computed spatial inundation patterns were compared with on-site inspections and other hydraulic model simulations to confirm the plausibility of the model.
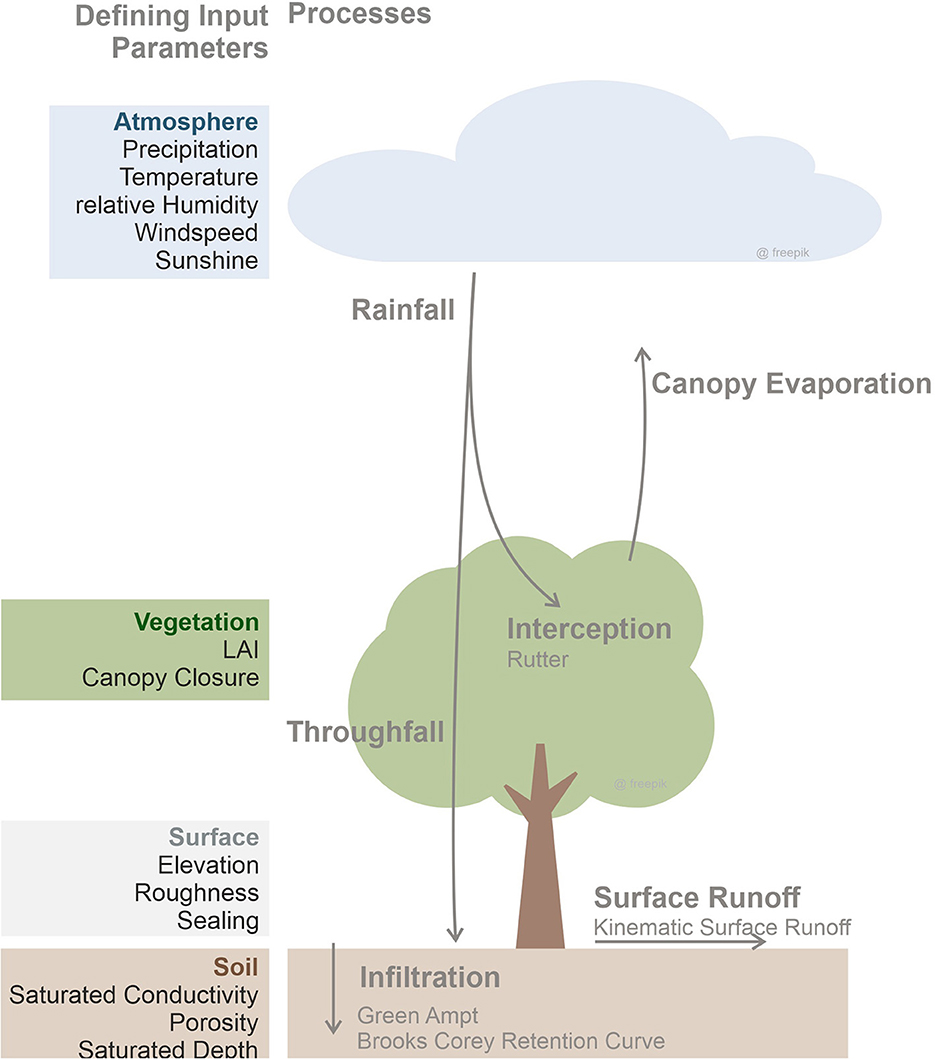
Figure 2. The hydrological processes of LEAFlood (Wübbelmann and Förster, 2022).
The geometry in this analysis is based on a polygon shapefile with cell sizes of approximately 1,000 m2. For the boundary conditions, inflow from surrounding areas was not considered due to the short-term event and the flat study area, while an outflow at defined boundary conditions was detected. The canopy cover was calculated by a quotient of the canopy area and polygon area. Each tree species was assigned a Leaf Area Index (LAI) and an interception capacity (Breuer et al., 2003). Afterward, both mean LAI and interception capacity were calculated for each individual polygon by an intersection of the tree point information. The literature values by Breuer et al. (2003) depict the mean interception capacity including a range of different rainfall events regarding amount and duration, but they do not provide information about the maximum interception during heavy rainfall events as investigated here. Therefore, based on the modeling results in a neighborhood in the city of Freiburg, Germany (Medina Camarena et al., 2022), observation data on this site (Jackisch et al., 2013), and further interception measures from other studies (Asadian and Weiler, 2009; Alves et al., 2018), the interception values of all cells were increased by a factor of 5.
A constant soil layer depth of 0.5 m was assumed for the whole area based on available soil drill datasets. Due to the time lag of soil water flow, we assumed that during short heavy precipitation events, the dominant process is surface runoff, while infiltration processes only occur in the upper soil layer. The saturated conductivity (Ksat) varied over the area and depended on the state of the sealing (see Table 3). Based on sandy loam, a baseline value of 0.3 m/d was assumed and reduced for higher sealing degrees (Sponagel et al., 2005; Wübbelmann et al., 2022). Further soil parameters were regarded as constant in the area. In addition, each land use was assigned a surface roughness coefficient Manning n (see Table 3). Since the objective of this study is to analyze the natural contribution of infiltration and interception to regulate floods caused by heavy rainfall events and the drainage system is assumed to be exhausted for heavy rainfall events of higher return periods, a drainage system was not considered.
The output of the model consists of surface water depth, soil water depth, intercepted water depth, and the outflow at the outlets. The outflow is detected as water that leaves the study area at the set boundary conditions (constant head). These results are generated per polygon and per time step.
The FRES analysis was conducted using ArcGIS Pro 2.8.0 by ESRI and statistical calculation with Python. The general method and indicators are based on Wübbelmann et al. (2022) and were adapted to a scenario analysis using the changes to a reference scenario as indicators on the event scale. Figure 3 shows the methodological framework of the analysis. The different indicators for the supply and demand analysis and their definitions are listed in Supplementary Table 2.
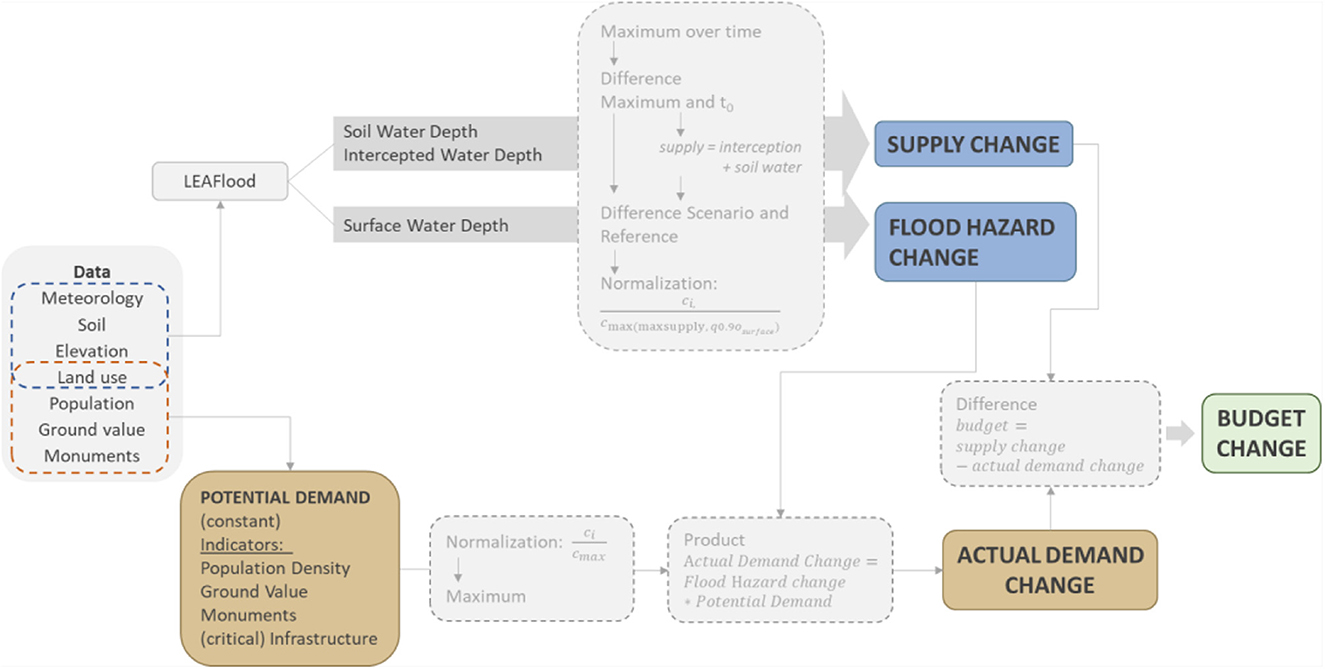
Figure 3. Workflow of the FRES analysis. t0 is the first time step of the modeling, ci represents the water depth in one cell, and cmax or q0.9 is the maximum or 90% quantile water depth for this hydrological parameter over all cells.
The hydrological modeling with LEAFlood delivered the supply indicators of soil water depth and intercepted water depth by the tree canopies in mm. Both storages can be important flood-regulating elements in urban areas and therefore should be to be considered as indicators in urban FRES assessment. With LEAFlood, the interception can be considered on an appropriate resolution of single landscape elements of urban environments (such as parks or streets). For both storages (canopy interception and soil water storage), the difference between maximum water depth over the whole period and initial water depth was used to estimate the FRES-supply on the event scale. Afterward, the difference to the reference scenario was calculated for each scenario. The results were finally normalized to a relative scale from −1 to 1 based on maximum supply change (here 5.9 mm). Thereby, −1 indicates a very high decrease in supply, 0 no change, and 1 very high increase in supply.
The corresponding indicator for the flood hazard change is the surface water depth [mm] of the model output. The difference to the reference scenario was normalized to a relative scale from −1 (decrease of surface water) to 1 (an increase of surface water). To ensure a comparable scale for the supply and flood hazard to conduct the subsequent budget analysis, we chose the maximum of both components for the normalization (maximum supply change: 5.9 mm and 90% quantile of hazard change: 5.7 mm), therefore 5.9 mm. The intersection of the changed flood hazard and the potential demand as a weighting factor gave the actual demand change with the same scale from −1 to 1. For a better estimation of the NbS effects and the impact of future rain events, we set the potential demand for all scenarios on a constant value. The potential demand in our approach consists of five indicators—population density, monuments, land reference value, critical infrastructure, and traffic areas (Biota, 2014; Wübbelmann et al., 2022).
Finally, the difference between the classified supply and actual demand change resulted in the budget change. The resulting scale can therefore take values on bandwidth from −2 to 2.
For the analysis of the current and future functionality of FRES in an urban area, we used a reference scenario and two future scenarios (period 2050). They are based on an observed 1-h rainfall event in 2011 measured at the DWD station in Rostock-Warnemünde with a temporal resolution of 1 min. The total rainfall amount in this hour was 21.74 mm with a maximum intensity of 2.93 mm/min after 29 min (see Table 1). The event can be assigned to a 3-year return period (DWD Climate Data Center, 2020), which corresponds to the design standards in the planning of urban drainage systems in residential areas (DIN-EN, 2017).
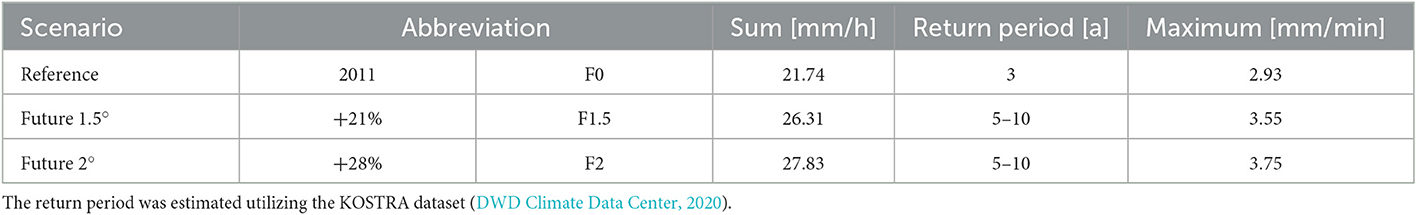
Table 1. Names and statistical description of the rainfall scenarios.
For the definition of the future scenarios, we used the super Clausius–Clapeyron (sCC) relation between atmospheric water vapor content and temperature, to scale (increase) the rainfall intensity of the observed 2011 event with the expected temperature increase due to further global warming. Unlike the CC scaling approach, the sCC relation is more appropriate for sub-daily and convective events (Westra et al., 2014; Förster and Thiele, 2020). This sCC relation assumes an increase in precipitation intensity of up to 14 % per degree of temperature increase for short extreme events, at daily mean temperatures higher than 12°C (Lenderink and van Meijgaard, 2008; Dahm et al., 2019; Förster and Thiele, 2020). We used scenarios of 1.5°C and 2°C warming compared to 2011. Therefore, with the sCC scaling factor of 14%, warming of 1.5°C and 2°C suggests an increase in precipitation intensity of 21 and 28% in 2011, respectively. Table 1 compiles major statistical characteristics for each scenario.
According to the regional climate model projections by the Climate Service Center Germany (2019), the year 2011 was already around +0.8°C warmer than the annual mean temperature of the reference period 1971–2000. The earliest possible year (upper boundary of the projection bandwidth) in which climate projections for different RCP (Representative Concentration Pathways) scenarios reach an increase of 1.5°C or 2°C warming compared to 2011 is listed in the following:
• 1.5°C warming for RCP 8.5 will be reached in 2032
• 1.5°C warming for RCP 4.5 will be reached in 2041
• 2°C warming for RCP 8.5 will be reached in 2046
• 2°C warming for RCP 4.5 will be reached in 2053.
It must be mentioned that the results of the climate projections have a high bandwidth. And the listed values represent the upper boundaries of the ensemble. In a low emission scenario (RCP2.6), these warming scenarios compared to 2011 will not be reached (Climate Service Center Germany, 2019).
In addition to the current land use and land cover conditions, we investigate the potential benefit of two adaptation measures—named NbS in the following—of increasing canopy coverage and a reduction of sealed areas to improve infiltration (see Table 2). These two measures were first applied separately and additionally in combination. These NbS measures represent options for climate adaptation to reduce urban flood risk.

Table 2. Overview and description of the applied Nature-based Solutions.
In the first step, we implemented a higher canopy cover in the study area. For this, we defined a minimum canopy cover of 90% above forest land use polygons, 30% for green areas, and 30% for traffic areas. This leads to an increase in average canopy coverage from 18% to 33% throughout the study area. This percentage can be considered a realistic and feasible option compared to the canopy cover of other cities up to 30% (e.g., Oslo or Singapore; The Guardian, 2019; MIT Senseable City Lab). We set the LAI to 5 and the Interception Capacity to 1.4, reflecting the mean of all main tree species in the study area.
The second adaptation measure entails an unsealing of traffic areas and a soil improvement for green areas. The idea behind the unsealing of traffic areas was an increased proportion of green stripes, such as swales, along the streets, reducing the sealing of these sections. To simplify the application in the model and to avoid small fragments of polygons in the shapefile causing possible numerical instability, we did not create smaller polygons for green space along the street. Instead, we adjusted the saturated conductivity—as the defining sealing parameter in the model—from 0.006 m/day to 0.1 m/day for all respective traffic area polygons. The saturated conductivity of the green areas was increased from 0.3 m/day to 0.4 m/day, respectively (see Table 3).
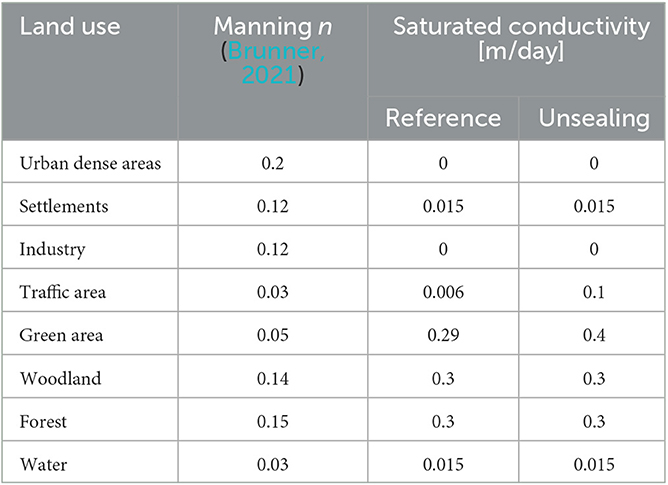
Table 3. Manning roughness coefficient and saturated conductivity (Ksat) for the reference scenario and the adaptation measure “Unsealing” for each land use.
For the combination of both NbS, the canopy cover and saturated conductivity were adjusted as described above.
We analyzed flood regulation in two ways. In one part, we focused on the temporal evolution by aggregating all spatial elements by the median and 90%-quantile, to obtain the mean and maximum water storage excluding outliers. In another part, we focused on the spatial distribution of supply and demand change on the event scale by computing the maximum values of demand and supply over time.
Figure 4 shows the timeline for the supply (interception + soil water; upper plot), the surface water (middle plot), and the total outflow of the study area (lower plot). The solid line displays the median water depth and the dashed line the 90% quantile over all polygons. Orange indicates the reference land use (NbS0), green the tree NbS (NbStree), blue the unsealing NbS (NbSunsealing), and purple the combination of the NbStree and NbSunsealing (NbScombined), while darker colors denote the 1.5 and 2°C warming rainfall scenario with 21% and 28% higher intensities (F1.5 and F2) and lighter colors for the reference scenario of 2011 (F0).
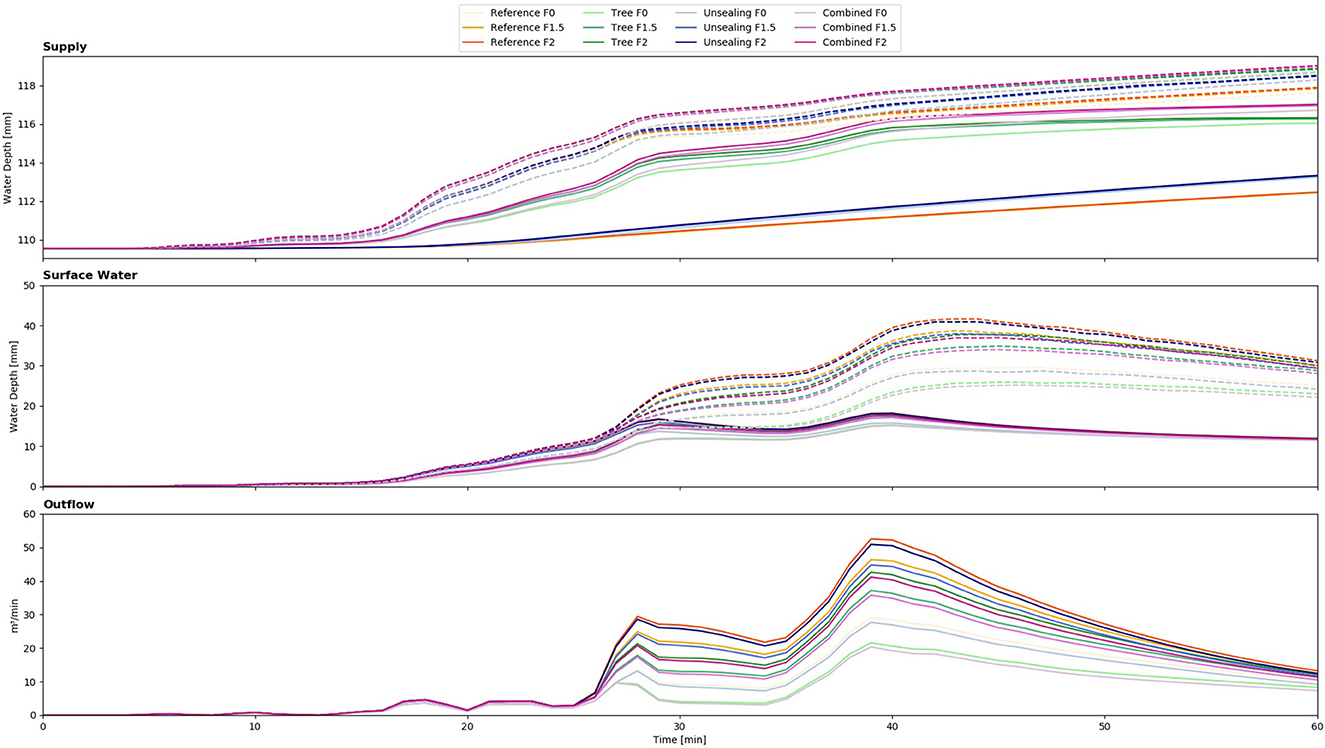
Figure 4. Timelines of water storage and flow. Upper figure (“Supply”): Median (solid line) and 90% quantile (dashed line) FRES-supply (interception + soil water) of all cells in the study area. Middle figure (“Surface Water”): Median (solid line) and 90% quantile (dashed line) of the flood hazard (surface water depth) of all cells in the study area. Bottom figure (“Outflow”): Summarized outflow of all outlets of the study area. Yellow/orange lines indicate the rainfall scenarios for NbS0, green NbSTree, blue NbSunsealing, and purple NbSCombined.
The median supply was not significantly increased for higher rainfall intensities for all NbS measures. However, both NbS have a higher supply than NbS0. While the supply increase by the NbSunsealing is relatively small, it is higher with the NbStree and highest with a combination of both NbS (for median and 90% quantile).
The NbStree leads to a higher decrease of the surface water than the NbSunsealing compared to the NbS0. The decreasing effect is smaller for higher rainfall events (e.g., F2). The 90% quantile has greater differences between the NbS than the median. While the NbSunsealing reduces surface water only slightly, the influence of the trees is visible (for all precipitation scenarios). The highest reduction of surface water can be reached with the combination of both adaptation measures. The increase of surface water depth by higher rainfall intensities is high for the 90% quantile compared to the increase of the median. This indicates a further filling and retention in surface sinks by lateral runoff.
In addition, we investigated the total outflow of the area by summarizing the surface water depth at all outlets for each time step bottom plot in Figure 4. The total outflow is computed through the superposition of flux time series in all outlet cells, which have been defined as boundary conditions. The maximum value of the peak, the change of the peak to the reference scenario of NbS0 and F0, and the reduction by the single NbS compared to the NbS0 for the respective rainfall scenario are listed in Table 4. Higher rainfall amounts increased the amount of outflow and the peak discharge by 17.33 m3/min for the F1.5 scenario and by 23.51 m3/min for the F2 scenario. Whereas, the NbS decrease the peak outflow for the F0 scenario by −7.5 [m3/min] for NbStree, −1.4 [m3/min] for NbSunsealing, and −8.7 [m3/min] for NbScombined. The NbStree had a higher impact by reducing the outflow and the peak discharge than the NbSunsealing compared to the NbS0 (−9.2[m3/min] for F1.5 and −9.9[m3/min] for F2). The outflow of NbStree for scenario F2 is even lower than the amount for the NbS0 and NbSunsealing for the climate scenario F1.5. The maximum outflow peak reduction for the NbSunsealing is 1.6 [m3/min] for the F1.5 scenario. The combination of both NbS (NbScombined) reduces the outflow by about 1.2–1.4 [m3/min] more than the NbStree.
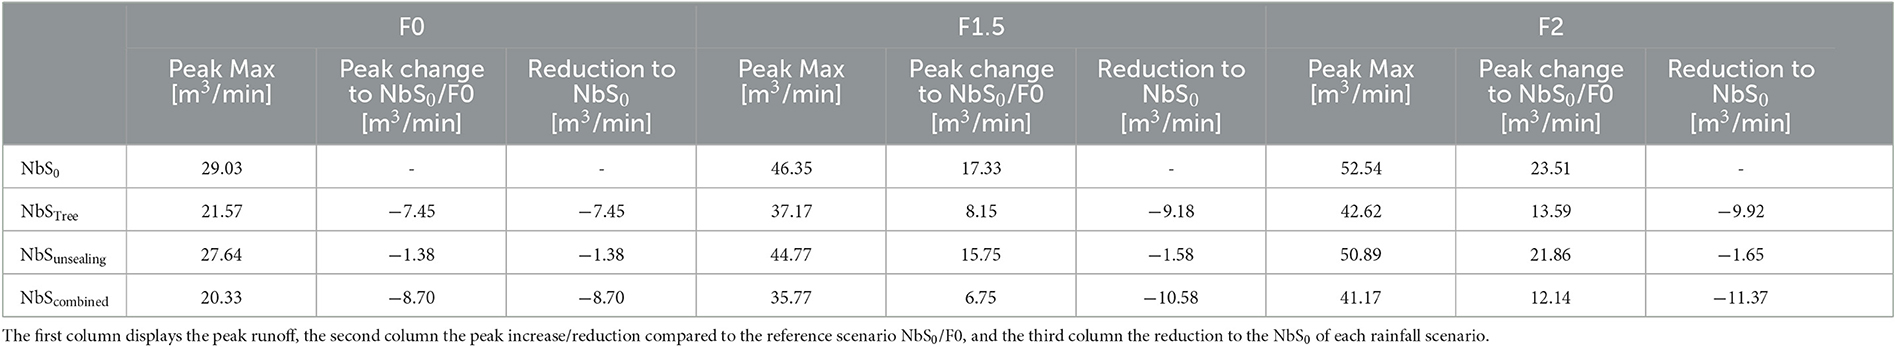
Table 4. Peak Runoff and the changes to the reference scenarios for all combinations of rainfall scenarios and NbS.
The supply change, as the comparison of the difference of the maximum and initial supply for the respective scenario and NbS combination compared to the reference scenario, is mapped in Figure 5. It also shows the mean change over the entire study area for each rainfall scenario and NbS combination. The maximum interception of all cells and time steps and all scenario combinations was 7.5 mm, the soil water storage 3.9 mm, and the total supply 10 mm. Figure 6 shows the change in the individual land use classes.
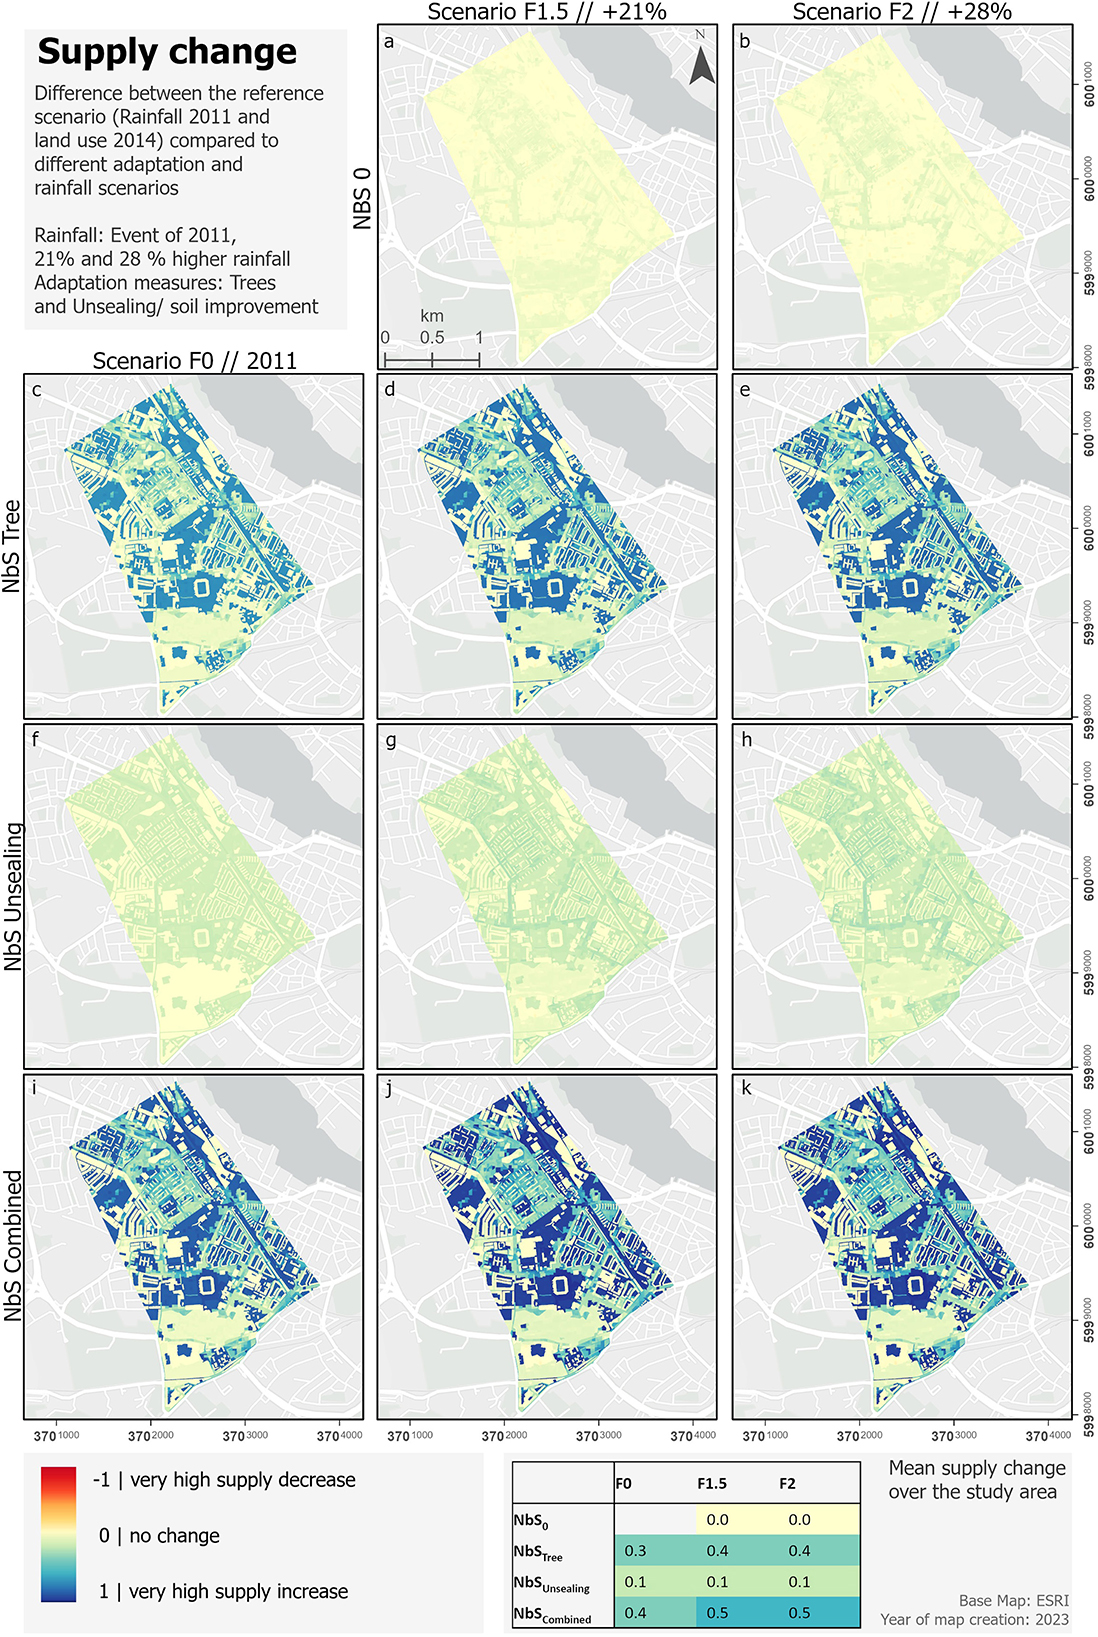
Figure 5. Map of the total FRES-supply change by interception and soil water.
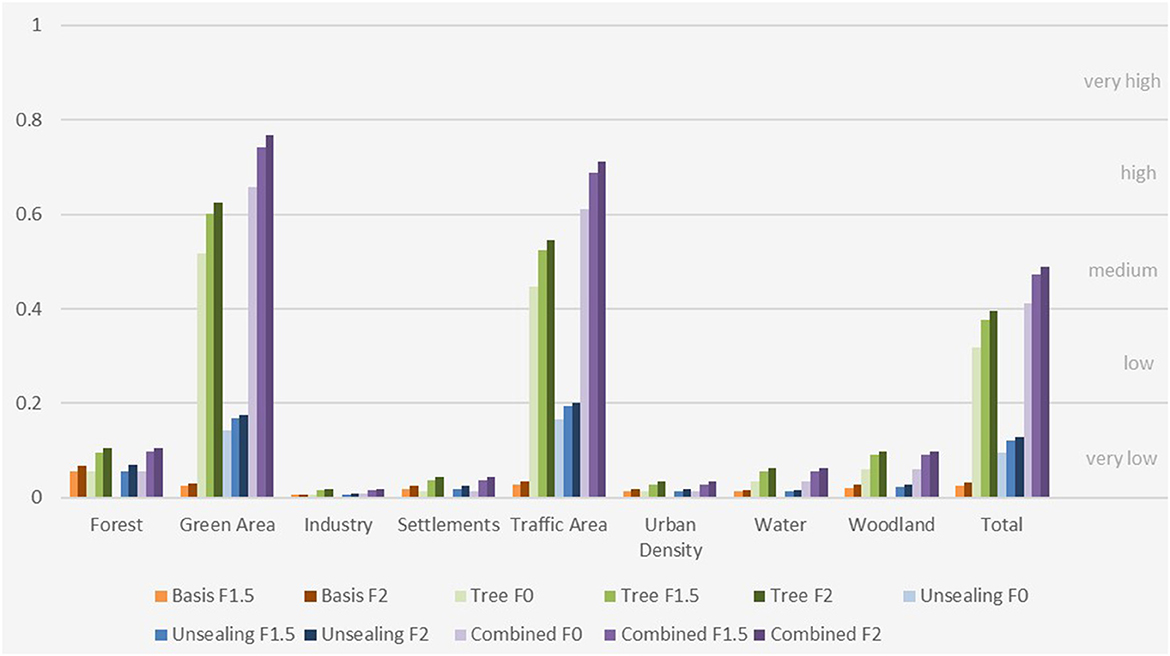
Figure 6. Area weighted FRES-supply change by the NbS and rainfall scenarios over the different land uses.
Without any NbS but with increasing rainfall intensities, the supply did not increase over the entire study area. Only some parts of the study area show a slight increase during heavier rainfall events, with the highest values in forest areas (Figure 5).
With the NbStree, an average low supply increase in the total area was detected. The future rainfall scenarios F1.5 and F2 increased the supply even more (medium). However, the difference between F1.5 and F2 is very small (Figure 5). In particular, traffic areas and green areas, over which the canopy closure has been significantly increased, were affected by the positive change in supply (Figure 6).
Overall, the increase in supply achieved through NbSunsealing was very low for all rainfall events. A positive supply change was mainly shown in green areas and traffic areas where the adaptation measure was implemented (Figure 6). The future rainfall scenarios led to a slight supply increase in these areas, but in total, the supply in the area did not increase for F0.
The combination of both NbS (NbScombined) enhanced the supply even more than the NbStree. For all scenarios, a medium supply increase could be observed compared to the reference scenario of NbS0/F0. As for the NbStree and NbSunsealing, the highest changes were detected in green areas and traffic areas.
The spatial distribution of the actual demand change, as the difference for the respective rainfall scenarios and NbS combinations compared to the reference scenario, as well as the mean change over the study area is shown in Figure 7. Note that in this map, red colors indicate demand increases; contrary to Figure 5, where red indicates supply decreases. The maximum modeled surface water of all cells and time steps and all scenarios was 4682.3 mm with a 90%-quantile of 36.7 mm. Figure 8 displays the actual demand change over individual land use classes.
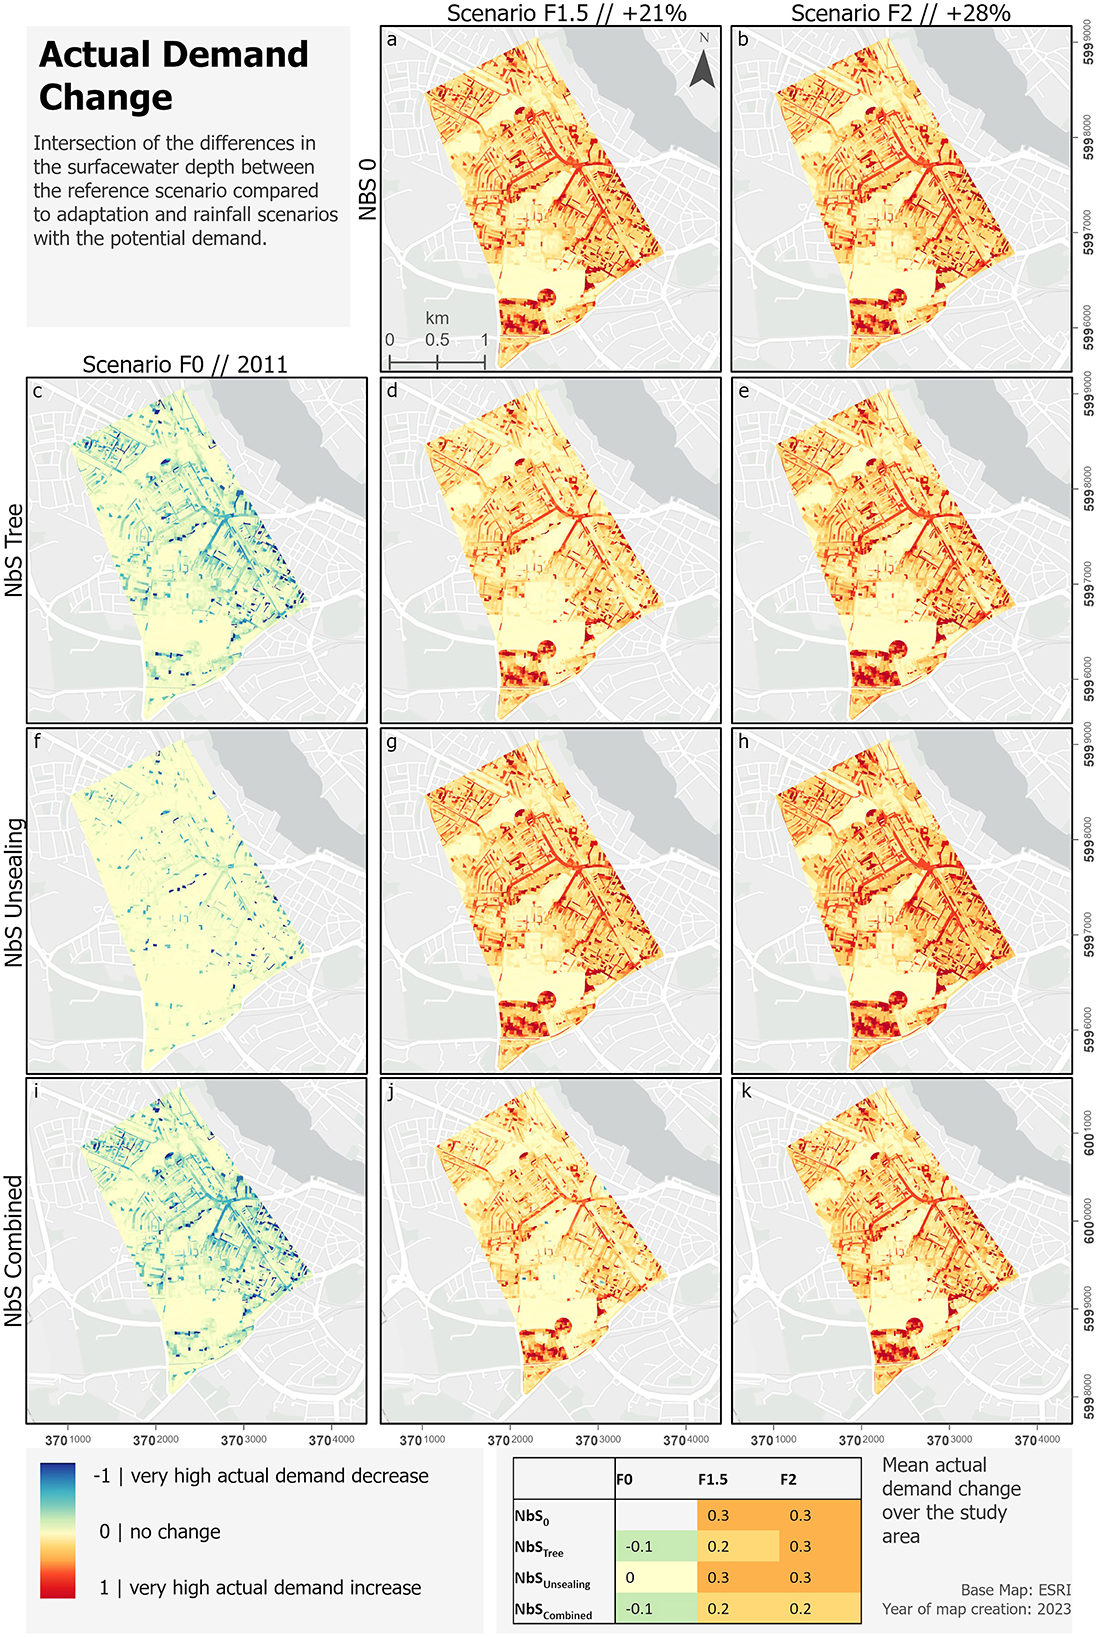
Figure 7. Map of the FRES-actual demand change.
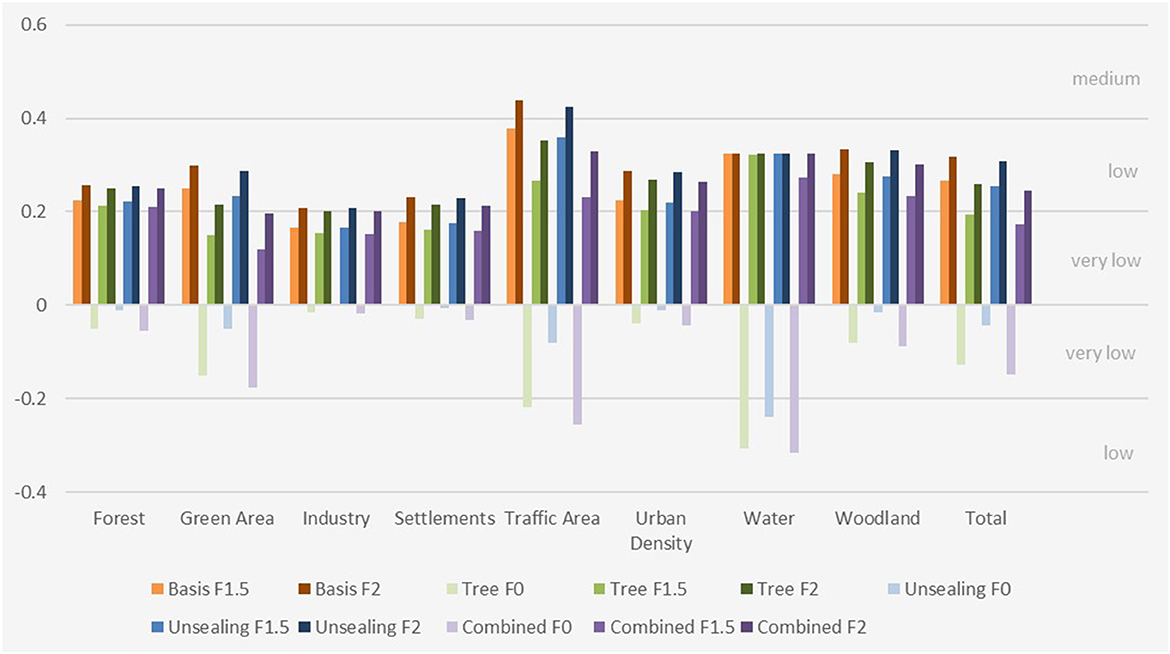
Figure 8. Area weighted FRES-actual demand change by the NbS and rainfall scenarios over the different land uses.
Without NbS (NbS0) and with higher rainfall intensities, the actual demand showed partly a very high increase (Figure 7). The difference between the future rainfall scenarios F1.5 and F2 is very small, both in the spatial distribution and on average over the entire area. The highest increase in actual demand was computed over traffic areas (Figure 8).
The NbStree decreased the actual demand only slightly for F0 in the study area. The decrease is highest in water bodies and traffic areas (low). As the actual demand was very low, it increased for the F1.5 scenario. In contrast to the F0 scenario, where a low decrease was observed in traffic areas, a low increase was shown for the F1.5 and F2 scenarios. However, the change is smaller between F1.5 and F2, than between F0 and F1.5. The relations of spatial patterns are similar to the F1.5 scenario with a slight increase.
The NbSunsealing did not reduce the actual demand for the reference scenario F0. Only water land uses, traffic areas, and green areas had a visible decrease in actual demand (Figure 8). For both future rainfall scenarios (F1.5 and F2), a medium increase in actual demand with the adaptation measure was computed. The highest actual demand change was again shown over traffic areas that were comparable to the NbS0/F2 scenario.
The combination of trees and unsealing led to a very low decrease in actual demand for the reference rainfall scenario, a very low increase for F1.5, and a medium increase for F2. Thereby, the changes are similar to these of the NbStree (Figure 7).
All NbS indicated similar hotspots for the respective rain scenario (see Figure 8). In particular, the streets leading to the Holbeinplatz tended to have a high actual demand for future rainfall scenarios, probably resulting from lower elevations and high sealing around this area.
To determine the budget change, we calculated the difference between the supply change and the actual demand change (Figure 3). The results are mapped in Figure 9. Positive values indicate a higher supply change toward supply surplus (blue). Negative values indicate a higher actual demand change toward unmet demand (red). In Figure 10, the budget change over the individual land uses is displayed.
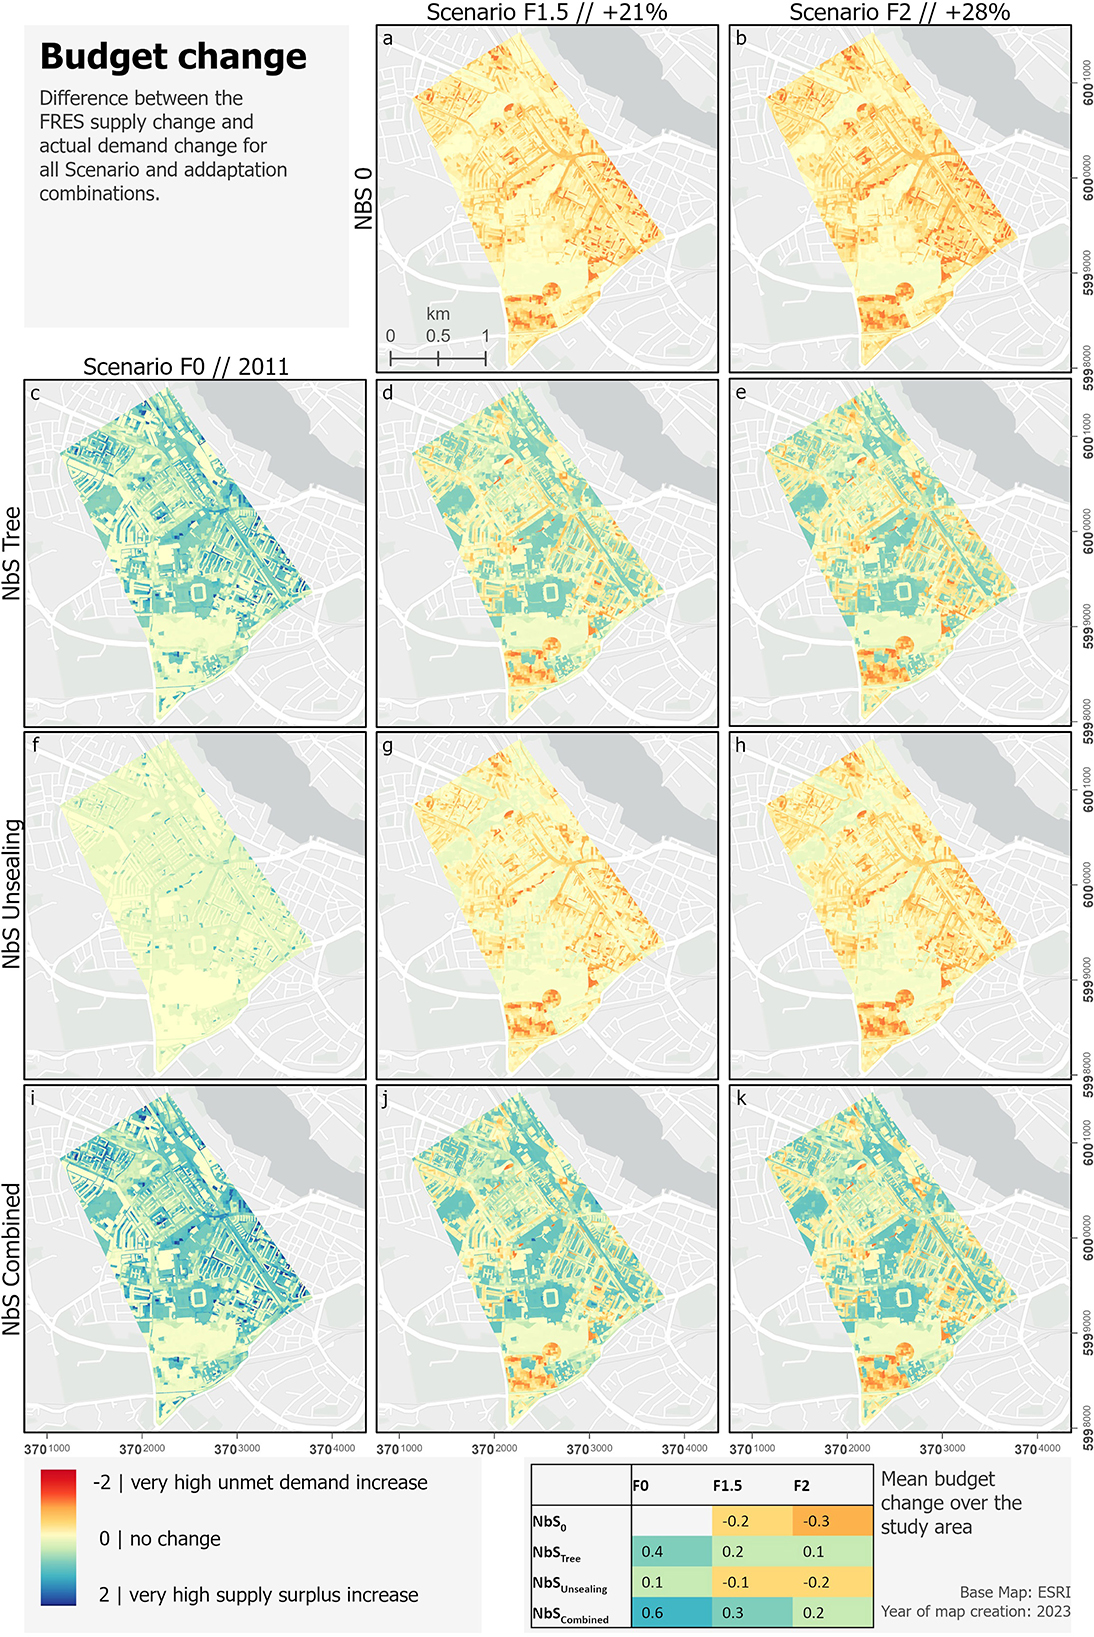
Figure 9. Map of the FRES budget of supply and actual demand change.
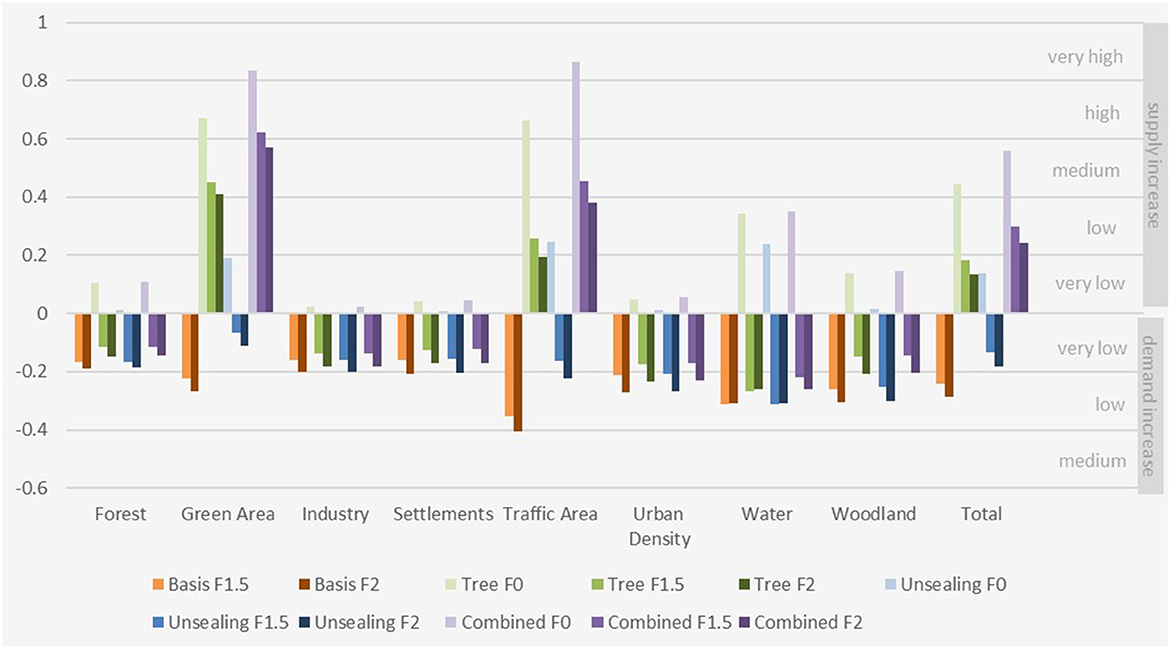
Figure 10. Area weighted FRES budget of supply and actual demand change by the NbS and rainfall scenarios over the different land uses.
The budget analysis showed a low increase in actual demand for NbS0 for both future scenarios. In general, traffic areas are most affected by a medium increase in unmet demand. In the entire area, no supply surplus increase can be observed.
The NbStree measure in contrast led to a medium supply increase in the reference scenario F0. While settlements and industrial areas had no or a very low increase in supply, green areas and traffic areas with higher tree coverage showed a high increase in supply surplus. This increase was lower for the future rainfall events F1.5 and F2 (very low), but it still exceeded the actual demand on average over the entire study area. In particular, green areas and traffic areas, where the NbS was implemented, benefitted from the measure (Figure 10). Some parts had a high or very high supply increase. Whereas settlements, urban dense areas, and industrial areas had a very low increase in unmet demand.
The NbSunsealing measure led to a very low increase of supply in the area average for the F0 scenario. On average, green and traffic areas showed a low supply increase, while built areas were not affected by a demand change (Figure 10). Under the future climate scenarios F1.5 and F2, the demand increase exceeded the supply. Still, the demand increase was lower than for the NbS0. However, the land uses where no adaptation measures were implemented show similar demand increases as those without adaptation measures.
The combination of both NbS highly increased the supply for the reference rainfall scenario F0, which also exceeded the effect of the NbStree. Higher rainfall amounts of the F1.5 scenario decreased the supply increase but it was still higher than the actual demand. Therefore, a medium supply surplus change was observed for F1.5 and a low supply exceeded the actual demand for the F2 scenario was shown. The spatial patterns were comparable to that of the NbStree, whereby the increase in supply exceeding the actual demand was more strong over green and traffic areas for NbScombined.
All rainfall scenarios and NbS combinations showed hotspots in the west of the Botanical garden and the south of the study area at the Zoo. While the supply increase is slightly higher than the actual demand increase for the NbStree and NbScombined at the Holbeinplatz, the actual demand exceeded the supply with the NbS0 and NbSunsealing.
Based on the model results, there is no supply increase under more intense rainfall events for NbS0. This allows the conclusion that retention by soil and canopy interception under the given model conditions has reached a capacity limit for the reference scenario F0 (Figures 4, 5). This capacity is determined by some green areas. However, the large increase in actual demand in traffic areas indicates that adaptation measures are necessary.
Both NbS increased the supply, reduced the runoff, and decreased the actual demand. In future scenarios, they were able to decrease the discharge and flooding impacts compared to the reference conditions (NbS0) of the respective rainfall scenarios (Table 4). However, they do not increase the supply sufficiently to prevent flooding under higher rainfall events of scenarios F1.5 and F2 (Figure 7).
The expansion of tree canopies (NbStree) had a higher positive flood-reducing effect than unsealing. Trees increased the supply by interception and led to a low actual demand decrease. The mismatch analysis shows a higher increase in supply than actual demand for NbStree. It also showed the highest reduction of outflow and surface water depth over the 60 min time period (Figure 4), which resulted in less water being available to flow into depressions of water bodies, thus reducing water levels and actual demand. Due to the increasing supply during higher rainfall amounts such as for the F1.5 scenario, it can be assumed that the total supply capacity was not reached with the NbStree for the reference rainfall scenario. Despite the higher supply, the surface water increased here during higher rainfall events and consequently increased the actual demand. One possible consequence of higher surface water depth could be higher flow velocities and faster runoff. Still, some traffic areas (for instance around the Holbeinplatz) had a very high increased actual demand with a simultaneous increase of supply with higher rainfall events. This might be the result of the high sealing in combination with surrounding areas contributing to inundations of the depression at the Holbeinplatz.
Other studies had also proven the contribution of interception by trees to reduce the peak runoff (Medina Camarena et al., 2022). Even if those results were site-specific, a single tree stored one cup of coffee per second, which may not have had a major impact on the site at first, but contributed significantly to flood regulation for the entire area and reduces the runoff for downstream areas. Also Yarnvudhi et al. (2021) found that 60% of catchment runoff can be avoided by trees per year. Although our case study shows a reduction of 28% only, it must be taken into account that we are looking at heavy rainfall in ungauged urban areas, while Yarnvudhi et al. (2021) focused on long-term balances of a catchment. Interception capacities therefore initially have a buffering effect, especially through an increase in tree cover (Zölch et al., 2017), but even their capacities are limited for extreme events (Smets et al., 2019). In summary, the NbStree can be seen as an effective adaptation measure for current and future extreme events to increase retention supply and reduce flood hazards.
In contrast, the benefits of the NbSunsealing measure were smaller. The supply increase could not reduce the actual demand. It is worth mentioning that unsealing in our study has only been applied to a small area, for which this measure was currently viewed as reasonable. Indeed, a supply increase was only visible in those areas where the measure was applied (green spaces and traffic areas), while the impact on the actual demand was very low (Figures 7, 8). Local effects could still be observed and the timeline analysis (Figure 4) showed a small reduction of runoff and surface water due to the unsealing for all rainfall scenarios compared to NbS0 (Figure 4). As a result of the lower surface water levels, the actual demand was lower at the depressions of water bodies, which are mainly located within green areas where the NbS was applied. Therefore, a positive effect on surrounding deeper areas can be assumed. The application of the measure to a limited number of elements and the aggregation of spatial or temporal elements in the further analysis resulted in a small positive flood regulating impact for the NbSunsealing, and therefore the change signal is mostly determined by the climate changes (Strasser et al., 2019). In addition to all NbS activities, it is important to mention that the used FRES-supply depends on the initial saturation. Thus, unsealing is still a very important flood prevention measure as it raises the potential infiltration capacity. In addition, it delivers further ES such as supporting groundwater recharge, improving biodiversity, and enhancing climate regulation.
The combination of both NbS partially improved the FRES compared to the individual measure NbStree and influenced the supply in particular. For the rainfall scenario F2 (+28%), both, the NBStree and NbScombined, seem to reach their supply capacity because no significant increase was detected (Figures 5, 6) and also the supply timeline showed a similar level for both rainfall scenarios (Figure 4), while the actual demand increased (Figures 7, 8).
Using extreme events to evaluate adaptation measures shows the limited effects of NbS due to exceeded retention capacities. However, testing the future functionality of NbS under extreme events is necessary due to projected frequency and intensity increase of extreme events. Regardless of this fact, NbS still decrease the runoff and have a retention effect, but their relative contribution is smaller as the rainfall intensities increase. This is shown by the same mean FRES-actual demand indication of F2 for NbS0, NbSTree, and NbSunsealing (Figure 7). Single NbS are not able to prevent an actual demand increase, only the combination of NbS have the potential to decrease the actual demand. However, the mismatch analysis (Figure 9) showed a higher supply increase for the NbS, which indicates a surplus of water in the ecosystems. This can support the sewer system and be used for other ecological processes such as cooling by evaporation. The model results show that the main impacts of the NbS are local where elements were implemented, such as on traffic and green areas. FRES improvement for settlements, urban areas, and industry without these elements was not determined. Consequently, it can be said that single localized adaptation measures with few elements are probably not sufficient (Smets et al., 2019). Trees will help to reduce flooding caused by heavy precipitation that may occur under an RCP 8.5 partly, but flooding cannot be avoided by one single ecosystem-based adaptation measure, only. Furthermore, the NbS have synergy effects and co-benefits on other ecosystem services and are not only positive for flood regulation but also for biodiversity, urban climate regulation, pollination, and recreation.
We used the sCC relation to scale future possible extreme events. Although this is a simple qualitative approach, we consider it a valid approximation and indication of the future direction. It is an alternative to climate modeling, which currently does not provide reliable results on local and short-duration precipitation projections, but non-hydrostatic models are under development (Lenderink and van Meijgaard, 2008; Westra et al., 2014; Manola et al., 2018; Dahm et al., 2019). For a sensitivity analysis of ecosystem services, the (super-) Clausius–Clapeyron scaling is an appropriate method and was also used by Lenderink and Attema (2015) for climate scenario analysis. Originally, the sCC is the scaling of precipitation using the dew point temperature following local convective atmospheric processes, which leads to more robust results than the temperature. However, since no detailed information was available, we used the temperature scaling approach under the assumption of a linear temperature - dew point rising of 1°C (Lenderink et al., 2011). Yet, it is unclear whether the scaling approach of sCC is transferable to regions with higher temperatures (above 24°C) (Westra et al., 2014; Lenderink et al., 2017).
We did not consider drier soil conditions in future climate scenarios, to keep the model as simple as possible in this phase. However, projected longer and more intense dry periods in combination with higher temperatures will cause a decrease in soil moisture in some regions in future (Holsten et al., 2009; IPCC, 2021). Parched soils can absorb less water and have a low infiltration rate, which reduces flood regulation by soils, lead to higher surface water levels, and will consequently cause higher actual demand (Liu et al., 2011). With the current set-up of LEAFlood, we cannot capture such an effect.
We have adopted a simplified methodological approach for the unsealing of the NbSunsealing. Entire road sections were unsealed instead of separating smaller areas, which in reality would be the case with green stripes. The applied NbS aim for maximized green infrastructure, neglecting the possible implementation. This could be investigated in detail in the next step. Furthermore, we did not consider soil improvement by the NbStree. Rooting loosens the soil and improves infiltration (Smets et al., 2019). Indeed, only small open areas are created along roads and the soils are very compact. Therefore, taking soil improvement at tree pits into account would probably not have large effects. Moreover, the results of the unsealing measure and the combination of trees and unsealing already showed that the actions only have minor effects.
The used hydrological model LEAFlood quantified three indicators. Modeling is always only a simplification and reflection of reality and therefore input data are always event (e.g., saturated depth) and site-specific (e.g., Manning n, saturated conductivity, or vegetation parameters). In the absence of on-site measurements—which is common for most urban areas—we relied on plausibility checks based on on-site inspections from past events. Additionally, we refer to literature, modeling, and measurements from other areas. The comparative study by Medina Camarena et al. (2022) showed a good match between modeled results with LEAFlood and observation data in terms of interception and surface runoff. Even though the Green-Ampt infiltration and kinematic wave surface flow are simplified physics-based approaches, they are common approaches in estimating flooding extent, and their applicability in LEAFlood has been demonstrated in Medina Camarena et al. (2022). LEAFlood is also capable of using the diffusive wave approach at the expense of higher computational costs and higher requirements of spatial resolution.
The demand might be overestimated because the urban drainage system was not taken into account. However, this does not influence the FRES-supply. Since this study (1) focuses on the contribution of the natural ecosystem to flood regulation and (2) investigates the high rainfall intensities that typically exceed the capacity of urban drainage systems, this limitation is acceptable.
Furthermore, the ES classification on the event scale eliminates some effects and details regarding temporal resolution. The maximum or 90%-quantile over the event duration was considered, and hence features, in particular throughout the event, are aggregated through statistical summarization and classification. The concept is thus static and the temporal course, which is important in flood regulation for reducing and shifting peak discharges, is summarized in simple ES indicators. Therefore, it is also important to examine the model results and absolute values, which is why we have additionally consulted the time series.
The ES concept serves as a communication tool with simplified indicators. It highlights the supply of ecosystems, rather than focusing on flood hazards only (European Parliament, 2007; Oppenheimer et al., 2014). The mismatch analysis of FRES-supply and demand has the advantage of (1) quantifying the contribution of natural ecosystems to flood regulation, and (2) identifying missing FRES-supply in hotspots with high actual demand (Dworczyk and Burkhard, 2021).
Concerning the higher rainfall intensities due to climate change, the mismatch analysis helps to highlight areas where the actual demand increases more due to higher surface water than the provided water retention by natural ecosystems. By taking the FRES-supply into account, a value is attributed to the natural ecosystems, and adaptation measures such as NbS can be tested regarding their sufficiency and long-term effectiveness to reduce flood hazards and consequently the actual demand. Therefore, the FRES framework provides a useful tool for testing the potential functionality of NbS under changing climate conditions. This study did not include feedback from stakeholders and decision-makers. However, involving stakeholders in future research approaches can improve the FRES framework and will be beneficial for the identification of stakeholder needs, the science-praxis dialogue, and the practical application of NbS in urban planning (Grunewald et al., 2021).
In this article, we have shown the benefits and contributions of single NbS measures under increasing rainfall events due to climate change by examining indicators of canopy interception and soil water storage for the supply and surface water depth as a component of the actual demand. Another interesting additional indicator to estimate the effects of the NbS measures and the climate change projections would be the flow velocity. High velocities can cause high damage and are therefore interesting for the estimation of FRES-demand impacts.
To further improve the flood regulating ES, other NbS, like green roofs, or a combination of different adaptation measures should be tested and is probably needed to sustainably deal with future extreme events (Zölch et al., 2017). Green roofs tend to have a large effect on annual stormwater runoff and peak runoffs (Bengtsson, 2005), while the retention for extreme events is small (Stovin et al., 2013). LEAFlood can consider green roofs either in a simple way as land use with appropriate soil settings (Medina Camarena et al., 2022) or can be further developed and connected with the detailed CMF model setup of green roofs by Förster et al. (2021). Additionally, a sensitivity analysis of the NbS could be conducted to improve the understanding of their performance and the impact of changing input on the model performance.
Before bringing these or other adaptation measures into practice, a feasibility study for practical application needs with stakeholders has to be carried out. The NbS and how they are applied here are theoretical concepts aiming for a maximized green infrastructure. For instance, a tree cover of 30 % cannot be realized over all traffic areas. Likewise, it is not necessarily possible to unseal all traffic areas by implementing green strips, nor to increase saturated conductivity by improving soil conditions.
We tested different rainfall scenarios and land use measures, while the potential demand was held constant. However, demographic change, urbanization, and digitalization will change future demands, and there is still a lack of analysis on the ES demand side (Campagne et al., 2020). For instance, Mori et al. (2022) analyzed the temporal dynamics of the FRES budget for a catchment basin by land use/land cover changes from 1990 to 2018. Therefore, another future task would be to test different demand scenarios by adjusting the potential demand indicators and assessing the increasing vulnerability to more intense rainfall events using the ecosystem services concept.
Finally, policy and decision-makers need better guidance tools that apply comprehensive and holistic approaches and highlight the synergies and benefits of NbS or ecosystem-based adaptations to support sustainable urban development (Zölch et al., 2018).
FRES assessment focuses on fluvial floods in rural catchments under current hydrological conditions. We assessed the future functionality of urban FRES under more intense heavy rainfall events in urban areas. Additionally, we estimated the benefits and contribution of NbS to urban FRES under current and possible future rainfall events to improve the evidence on the performance of NbS for climate change adaptation. Therefore, we quantified FRES indicators based on outputs of a coupled 2D hydrological-hydrodynamic model LEAFlood.
Our results show that existing ecosystems have already reached a supply capacity. Higher extreme events led to an increase in actual demand, which exceeded the supply. The applied NbS—in particular trees and combined NbS—enhanced the FRES-supply. They partly increased the FRES-supply and reduced the flood hazard and consequently the actual demand under today's rainfall events. Although they could not prevent an increasing actual demand for more intense rainfall events, the supply increase was still higher than the actual demand increase. Indeed, the actual demand increase was lower compared to scenarios without NbS. This confirms the positive contribution of NbS to future flood regulation, which is worth being acknowledged here. However, as both types of NbS were applied on the same land uses (mainly traffic areas and green areas), we suggest implementing a full set and combination of green infrastructure on different sites, such as settlements.
Our indicator-based approach, comparing each scenario to a reference scenario, appears to be appropriate to estimate the long-term change and development of ES functions. The identification of FRES-supply and demand changes due to climate change and the benefits of NbS is a useful visualization and quantification tool for urban planning to identify mismatches in changes. This is helpful to make decision-makers aware of areas where natural ecosystem services are missing. The outline method could lead to a more holistic view of the design of NbS in sustainable city planning.
Publicly available datasets were analyzed in this study. This data can be found here: the majority of the data is publicly available (see Supplementary Table 1 for further details).
TW: writing. TW, KF, LB, and CD: study design. TW and KF: modeling. KF, LB, CD, and BB: reviewing. SB and BB: supervision. All authors contributed to the article and approved the submitted version.
This work has received support from the Helmholtz Association under the Changing Earth research program.
The authors would like to thank Markus Groth and Simon Muwafu from GERICS and Angie Faust from the Institute of Physical Geography and Landscape Ecology of the University Hannover for the internal review and language proofreading.
The authors declare that the research was conducted in the absence of any commercial or financial relationships that could be construed as a potential conflict of interest.
All claims expressed in this article are solely those of the authors and do not necessarily represent those of their affiliated organizations, or those of the publisher, the editors and the reviewers. Any product that may be evaluated in this article, or claim that may be made by its manufacturer, is not guaranteed or endorsed by the publisher.
The Supplementary Material for this article can be found online at: https://www.frontiersin.org/articles/10.3389/frwa.2023.1081850/full#supplementary-material
Alves, P. L., Formiga, K. T. M., and Traldi, M. A. B. (2018). Rainfall interception capacity of tree species used in urban afforestation. Urban Ecosyst. 21, 697–706. doi: 10.1007/s11252-018-0753-y
Asadian, Y., and Weiler, M. (2009). A new approach in measuring rainfall interception by urban trees in coastal British Columbia. Water Qual. Res. J. 44, 16–25. doi: 10.2166/wqrj.2009.003
Bengtsson, L. (2005). Peak flows from thin sedum-moss roof. Nordic Hydrol. 269–280. doi: 10.2166/nh.2005.0020
Biota (2014). Integriertes Entwässerungs Konzept (INTEK): Fachkonzept zur Anpassung der Entwässerungssysteme an die Urbanisierung und den Klimawandel. Phase 3: Einzugsgebietbezogene Analyse der Hochwasserrisiken.
Breuer, L., Eckhardt, K., and Frede, H.-G. (2003). Plant parameter values for models in temperate climates. Ecol. Modell. 169, 237–293. doi: 10.1016/S0304-3800(03)00274-6
Campagne, C. S., Roche, P., Müller, F., and Burkhard, B. (2020). Ten years of ecosystem services matrix: Review of a (r)evolution. One Ecosyst. 5, 106. doi: 10.3897/oneeco.5.e51103
Cohen-Shacham, E., Walters, G., Janzen, C., and Maginnis, S. (2016). Nature-Based Solutions to Address Global Societal Challenges. IUCN International Union for Conservation of Nature. doi: 10.2305/IUCN.CH.2016.13.en
Dahm, R., Bhardwaj, A., Sperna Weiland, F., Corzo, G., and Bouwer, L. M. (2019). A temperature-scaling approach for projecting changes in short duration rainfall extremes from GCM data. Water 11, 313. doi: 10.3390/w,11020313
DIN-EN (2017). Drain and Sewer Systems Outside Buildings (Entwässerungssysteme außerhalb von Gebäuden - Kanalmanagement, Deutsche Fassung EN 752:2017). Berlin.
DWD Climate Data Center (2020). KOSTRA DWD 2010. Available online at: https://opendata.dwd.de/climate_environment/CDC/grids_germany/return_periods/precipitation/KOSTRA/KOSTRA_DWD_2010R/gis/ (accessed September 16, 2022).
DWD Climate Data Center (2022a). Multi-Annual Station Means of the Air Temperature for the Climate Normal Reference Period 1981 - 2010. Available online at: https://opendata.dwd.de/climate_environment/CDC/observations_germany/climate/multi_annual/mean_81-10/Temperatur_1981-2010.txt (accessed July 07, 2022).
DWD Climate Data Center (2022b). Multi-Annual Station Means of the Precipitation for the Climate Normal Reference Period 1981 - 2010. Available online at: https://opendata.dwd.de/climate_environment/CDC/observations_germany/climate/multi_annual/mean_81-10/ (accessed July 07, 2022).
Dworczyk, C., and Burkhard, B. (2021). Conceptualising the demand for ecosystem services - an adapted spatial-structural approach. One Ecosyst. 6, 101. doi: 10.3897/oneeco.6.e65966
European Commission (2015). Twoards and EU Research and Innovation policy agenda for Nature-Based Solutions & Re-Naturing Cities: Final Report of the Horizon 2020 Expert Group on 'Nature-Based Solutions and Re-Naturing Cities'.
European Parliament (2007). Richtlinie 2007/60/EG des Europäischen Parlaments und des Rates vom 23. Oktober 2007 über die Bewertung und das Management von Hochwasserrisiken.
Förster, K., and Thiele, L.-B. (2020). Variations in sub-daily precipitation at centennial scale. Clim. Atmos. Sci. 3, 1–7. doi: 10.1038/s41612-020-0117-1
Förster, K., Westerholt, D., Kraft, P., and Lösken, G. (2021). Unprecedented retention capabilities of extensive green roofs-new design approaches and an open-source model. Front. Water 3, 109920. doi: 10.3389/frwa.2021.689679
Gaglio, M., Aschonitis, V., Pieretti, L., Santos, L., Gissi, E., Castaldelli, G., et al. (2019). Modelling past, present and future Ecosystem Services supply in a protected floodplain under land use and climate changes. Ecol. Modell. 403, 23–34. doi: 10.1016/j.ecolmodel.2019.04.019
Gómez Martín, E., Máñez Costa, M., Egerer, S., and Schneider, U. A. (2021). Assessing the long-term effectiveness of nature-based solutions under different climate change scenarios. Sci. Tot. Environ. 794, 148515. doi: 10.1016/j.scitotenv.2021.148515
Grunewald, K., Bastian, O., Louda, J., Arcidiacono, A., Brzoska, P., Bue, M., et al. (2021). Lessons learned from implementing the ecosystem services concept in urban planning. Ecosyst. Serv. 49, 101273. doi: 10.1016/j.ecoser.2021.101273
Hanse- und Universitätsstadt Rostock - Amt für Umwelt- und Klimaschutz (2019). Stadtbodenkarte 2005. Available online at: https://www.opendata-hro.de/dataset/stadtbodenkarte_2005 (accessed January 25, 2022).
Holsten, A., Vetter, T., Vohland, K., and Krysanova, V. (2009). Impact of climate change on soil moisture dynamics in Brandenburg with a focus on nature conservation areas. Ecol. Modell. 220, 2076–2087. doi: 10.1016/j.ecolmodel.2009.04.038
IPCC (2021). Summary for Policymakers. In: Climate Change 2021: the Physical Science Basis. Contribution of Working Group I to the Sixth Assessment Report of the Intergovernmental Panel on Climate Change. New York, NY; Cambridge, UK: Cambridge University Press. p. 3–32. doi: 10.1017/9781009157896.001
Jackisch, N., Brendt, T., Weiler, M., and Lange, J. (2013). Evaluierung der Regenwasserbewirtschaftung im Vaubangelände: unter besonderer Berücksichtigung von Gründächern und Vegetation (Freiburg).
Jacob, D., Petersen, J., Eggert, B., Alias, A., Christensen, O. B., Bouwer, L. M., et al. (2014). EURO-CORDEX: new high-resolution climate change projections for European impact research. Region. Environ. Change 14, 563–578. doi: 10.1007/s10113-013-0499-2
Kabisch, N., Frantzeskaki, N., Pauleit, S., Naumann, S., Davis, M., Artmann, M., et al. (2016). Nature-based solutions to climate change mitigation and adaptation in urban areas: perspectives on indicators, knowledge gaps, barriers, and opportunities for action. Ecol. Soc. 21, 1–15.
Kabisch, N., Korn, H., Stadler, J., and Bonn, A. (2017). Nature-Based Solutions to Climate Change Adaptation in Urban Areas. Cham: Springer International Publishing. doi: 10.1007/978-3-319-56091-5
Kraft, P. (2020). cmf Documentation: What is cmf? Available online at: https://philippkraft.github.io/cmf/ (accessed January 24, 2022).
Kraft, P., Vaché, K. B., Frede, H.-G., and Breuer, L. (2011). A hydrological programming language extension for integrated catchment models. Environ. Modell. Softw. 26, 828–830. doi: 10.1016/j.envsoft.2010.12.009
Lenderink, G., and Attema, J. (2015). A simple scaling approach to produce climate scenarios of local precipitation extremes for the Netherlands. Environ. Res. Lett. 10, 85001. doi: 10.1088/1748-9326/10/8/085001
Lenderink, G., Barbero, R., Loriaux, J. M., and Fowler, H. J. (2017). Super-Clausius-Clapeyron scaling of extreme hourly convective precipitation and its relation to large-scale atmospheric conditions. J. Clim. 30, 6037–6052. doi: 10.1175/JCLI-D-16-0808.1
Lenderink, G., Mok, H. Y., Lee, T. C., and van Oldenborgh, G. J. (2011). Scaling and trends of hourly precipitation extremes in two different climate zones - Hong Kong and the Netherlands. Hydrol. Earth Syst. Sci. 15, 3033–3041. doi: 10.5194/hess-15-3033-2011
Lenderink, G., and van Meijgaard, E. (2008). Increase in hourly precipitation extremes beyond expectations from temperature changes. Nat. Geosci. 1, 511–514. doi: 10.1038/ngeo262
Liu, H., Lei, T. W., Zhao, J., Yuan, C. P., Fan, Y. T., and Qu, L. Q. (2011). Effects of rainfall intensity and antecedent soil water content on soil infiltrability under rainfall conditions using the run off-on-out method. J. Hydrol. 396, 24–32. doi: 10.1016/j.jhydrol.2010.10.028
Maes, J., Teller, A., Erhard, M., Condé, S., Vallecillo, S., Barreo, J. I., et al. (2020). Mapping and assessment of ES and Their SERVICES: An EU Ecosystem Assessment. JRC Science for Polcy Report.
Manola, I., van den Hurk, B., de Moel, H., and Aerts, J. C. J. H. (2018). Future extreme precipitation intensities based on a historic event. Hydrol. Earth Syst. Sci. 22, 3777–3788. doi: 10.5194/hess-22-3777-2018
Medina Camarena, K. S., Wübbelmann, T., and Förster, K. (2022). What Is the contribution of urban trees to mitigate pluvial flooding? Hydrology 9, 108. doi: 10.3390/hydrology9060108
MIT Senseable City Lab. Exploring the Green Canopy in Cities Around the World. Available online at: http://senseable.mit.edu/treepedia/greenindex/boston/slkZdbRrx4eYUTjuYTUyIg (accessed October 25 2022)..
Mori, S., Pacetti, T., Brandimarte, L., Santolini, R., and Caporali, E. (2022). A methodology for assessing spatio-temporal dynamics of flood regulating services. Ecol. Indic. 129, 107963. doi: 10.1016/j.ecolind.2021.107963
Natural Capital Project (2020). InVEST. Available online at: https://naturalcapitalproject.stanford.edu/software/invest (accessed September 23, 2022).
Nedkov, S., and Burkhard, B. (2012). Flood regulating ecosystem services-Mapping supply and demand, in the Etropole municipality, Bulgaria. Ecol. Indic. 21, 67–79. doi: 10.1016/j.ecolind.2011.06.022
Oppenheimer, M., Campos, M., Warren, R., Birkmann, J., Luber, G., O'Neill, B., et al. (2014). Emergent Risks and Key Vulnerabilities. In: Climate Change 2014: Impacts, Adaptation, and Vulnerability. Part A: Global and Sectoral Aspects. Contribution of Working Group II to the Fifth Assessment Report of the Intergovernmental Panel on Cliamte Change. Cambridge, UK; New York, NY.
Rajczak, J., and Schär, C. (2017). Projections of future precipitation extremes over europe: a multimodel assessment of climate simulations. J. Geophys. Res. Atmos. 122, 10773–10800. doi: 10.1002/2017JD027176
Rawls, W. J., Ahuja, L. R., Brakensiek, D. L., and Shirmohammadi, A. (1993). “Infiltration and soil water movement,” in Handbook of Hydrology, ed D. R. Maidment (New York, NY: McGraHill), 5.1–5.51.
Shen, J., Du, S., Huang, Q., Yin, J., Zhang, M., Wen, J., et al. (2019). Mapping the city-scale supply and demand of ecosystem flood regulation services-a case study in Shanghai. Ecol. Indic. 106, 105544. doi: 10.1016/j.ecolind.2019.105544
Shen, J., Du, S., Ma, Q., Huang, Q., Wen, J., Yin, Z., et al. (2021). A new multiple return-period framework of flood regulation service-applied in Yangtze River basin. Ecol. Indic. 125, 107441. doi: 10.1016/j.ecolind.2021.107441
Smets, V., Wirion, C., Bauwens, W., Hermy, M., Somers, B., and Verbeiren, B. (2019). The importance of city trees for reducing net rainfall: comparing measurements and simulations. Hydrol. Earth Syst. Sci. 23, 3865–3884. doi: 10.5194/hess-23-3865-2019
Sponagel, H., Grottenthaler, W., Hartmann, K.-J., Hartmich, R., Janetzko, P., Joisten, H., et al. (2005). Bodenkundliche Kartieranleitung. Hannover.
Steinbeis-Transferzentrum Geoinformatik (2017). Realnutzungskartierung 2014. Available online at: https://www.opendata-hro.de/dataset/realnutzungskartierung_2007 (accessed January 24, 2022).
Stovin, V., Poë, S., and Berretta, C. (2013). A modelling study of long term green roof retention performance. J. Environ. Manage. 131, 206–215. doi: 10.1016/j.jenvman.2013.09.026
Strasser, U., Förster, K., Formayer, H., Hofmeister, F., Marke, T., Meißl, G., et al. (2019). Storylines of combined future land use and climate scenarios and their hydrological impacts in an Alpine catchment (Brixental/Austria). Sci. Tot. Environ. 657, 746–763. doi: 10.1016/j.scitotenv.2018.12.077
Stürck, J., Poortinga, A., and Verburg, P. H. (2014). Mapping ecosystem services: the supply and demand of flood regulation services in Europe. Ecol. Indic. 38, 198–211. doi: 10.1016/j.ecolind.2013.11.010
TEEB (2010). Die Ökonomie von Ökosystemen und Biodiversität: Die ökonomische Bedeutung der Natur in Entscheidungsprozesse integrieren. Ansatz, Schlussfolgerung und Empfehlungen von TEEB- eine Synthese. Münster.
The Guardian (2019). Green Streets: Which City Has The Most Trees? Available online at: https://www.theguardian.com/cities/2019/nov/05/green-streets-which-city-has-the-most-trees (accessed October 25, 2022).
Westra, S., Fowler, H. J., Evans, J. P., Alexander, L. V., Berg, P., Johnson, F., et al. (2014). Future changes to the intensity and frequency of short-duration extreme rainfall. Rev. Geophys. 52, 522–555. doi: 10.1002/2014RG000464
Wübbelmann, T., Bender, S., and Burkhard, B. (2021). Modelling flood regulation ecosystem services dynamics based on climate and land use information. Landscape. 88, 1–16. doi: 10.3097/LO.202188
Wübbelmann, T., Bouwer, L., Förster, K., Bender, S., and Burkhard, B. (2022). Urban ecosystems and heavy rainfall - a flood regulating ecosystem service modelling approach for extreme events on the local scale. One Ecosyst. 7, 1–29. doi: 10.3897/oneeco.7.e87458
Wübbelmann, T., and Förster, K. (2022). LEAFlood - Landscape and vEgetAtion-dependent Flood model. Available online at: https://zenodo.org/record/6594181#.Yy2aa4TP2Uk (accessed September 23, 2022).
Xiong, Z., and Wang, Y. (2022). Cross-scaling approach for water-flow-regulating ecosystem services: a trial in Bochum, Germany. Land 11, 740. doi: 10.3390/land11050740
Yarnvudhi, A., Leksungnoen, N., Tor-Ngern, P., Premashthira, A., Thinkampheang, S., and Hermhuk, S. (2021). Evaluation of regulating and provisioning services provided by a park designed to be resilient to climate change in Bangkok, Thailand. Sustainability 13, 13624. doi: 10.3390/su132413624
Zölch, T., Henze, L., Keilholz, P., and Pauleit, S. (2017). Regulating urban surface runoff through nature-based solutions - an assessment at the micro-scale. Environ. Res. 157, 135–144. doi: 10.1016/j.envres.2017.05.023
Keywords: hydrological modeling, climate adaptation, ecosystem services supply and demand, mismatch analysis, scenarios, cities, extreme rainfall
Citation: Wübbelmann T, Förster K, Bouwer LM, Dworczyk C, Bender S and Burkhard B (2023) Urban flood regulating ecosystem services under climate change: how can Nature-based Solutions contribute? Front. Water 5:1081850. doi: 10.3389/frwa.2023.1081850
Received: 27 October 2022; Accepted: 22 May 2023;
Published: 15 June 2023.
Edited by:
Evan G. R. Davies, University of Alberta, CanadaReviewed by:
M. Sadegh Riasi, University of Cincinnati, United StatesCopyright © 2023 Wübbelmann, Förster, Bouwer, Dworczyk, Bender and Burkhard. This is an open-access article distributed under the terms of the Creative Commons Attribution License (CC BY). The use, distribution or reproduction in other forums is permitted, provided the original author(s) and the copyright owner(s) are credited and that the original publication in this journal is cited, in accordance with accepted academic practice. No use, distribution or reproduction is permitted which does not comply with these terms.
*Correspondence: Thea Wübbelmann, dGhlYS53dWViYmVsbWFubkBoZXJlb24uZGU=
Disclaimer: All claims expressed in this article are solely those of the authors and do not necessarily represent those of their affiliated organizations, or those of the publisher, the editors and the reviewers. Any product that may be evaluated in this article or claim that may be made by its manufacturer is not guaranteed or endorsed by the publisher.
Research integrity at Frontiers
Learn more about the work of our research integrity team to safeguard the quality of each article we publish.