 Violaine Piton1*
 Frédéric Soulignac1†
 Ulrich Lemmin1Benjamin Graf1Htet Kyi Wynn1
 Koen Blanckaert2David Andrew Barry1
- 1Ecological Engineering Laboratory (ECOL), Faculty of Architecture, Civil and Environmental Engineering (ENAC), Environmental Engineering Institute (IIE), Ecole Polytechnique Fédérale de Lausanne (EPFL), Lausanne, Switzerland
- 2Research Unit Hydraulic Engineering, Faculty of Civil Engineering, Institute of Hydraulic Engineering and Water Resources Management, Technische Universität Wien (TUW), Vienna, Austria
River inflows have a major influence on lake water quality due to their input of sediments, nutrients and contaminants. After leaving the river channel, river waters form a plume and interact with ambient lake waters. Strong hydrodynamic changes take place in the nearfield. To determine the nearfield hydro-sedimentary dynamics of the negatively-buoyant Rhône River plume in thermally stratified Lake Geneva, field campaigns were carried out at high and intermediate river discharge. High-resolution full-depth Acoustic Doppler Current Profiler (ADCP) transects were taken at 400, 800, 1,200, and 1,500 m from the river mouth, combined with profiles of temperature, turbidity and particle size distribution. These measurements provided, for the first time in a lake, detailed velocity fields across the full-plume cross-section in each transect. Furthermore, the unique combination of measurement techniques allowed the quantification of entrainment, Suspended Particulate Matter (SPM) concentrations and fluxes. They revealed that the negatively buoyant river inflow intruded into the metalimnion as a laterally unconfined interflow and continued flowing straight out in the streamwise direction, since currents in the lake were weak. At the same time, it mainly spread laterally due to entrainment of ambient water. The size of the interflow core and its velocity progressively decreased with distance from the mouth, as did SPM concentrations and volumes of particles (by a factor of 2–3 within 1,500 m), due to sediment settling and entrainment. The interflow momentum flux remained constant along the pathway, but interflow cross sections and discharge increased 2–3 times (within 1,500 m). The entrainment coefficient was >2 at 400 m and further increased non-linearly along the pathway. These values are much higher than those reported for laterally confined laboratory studies. The particle size distribution in the interflow was dominated by fine particles (<32 μm), which were transported up to 1,500 m from the mouth and most likely beyond, whereas larger particles (>62 μm) almost completely settled out before reaching that distance. The above processes occurred independent of river discharge; their intensity, however, changed with discharge.
Introduction
In addition to replenishing lakes, river inflow plays a major role in the ecology of lakes by carrying dissolved organic compounds and Suspended Particulate Matter (SPM) from the watershed to the lake. Pollutants such as dissolved metals and pathogens can be transported into lakes by fixation on riverine SPM (Allan et al., 1983; Eyre and McConchie, 1993; Hadler et al., 2014), which in turn can affect the distribution of light and nutrients for algal communities (Giovanoli, 1990; Kremer et al., 2015). Understanding the dynamics of river inflows into lakes and the fate of SPM is thus key to maintaining good lake water quality and a healthy lake ecosystem. In particular, the initial river plume evolution in the nearfield is important for predicting the subsequent plume spreading in the lake, and yet, detailed field observations in this zone are scarce.
River inflow into lakes is mainly controlled by momentum input and by the density difference between the inflow and the receiving lake (Serruya, 1974). Two types of inflow behavior can be expected: (i) The river inflow will float at the surface as an overflow, if its density is lower than that of the lake (Jirka, 2007), or (ii) it will sink and flow downslope along the lakebed as an underflow, if its density is higher than that of the lake (Alavian et al., 1992). When the underflow reaches the depth where inflow and lake densities are equal, it will detach from the lakebed and intrude into the ambient water as an interflow (Stevens et al., 1995; Ahlfeld et al., 2003). This conceptual model for dense riverine inflows is supported by various modeling (Hebbert et al., 1979; Akiyama and Stefan, 1984; Parker et al., 1986) and observational studies (Giovanoli and Lambert, 1985; Fleenor, 2001; Hogg et al., 2013). At the top and bottom of the interflow, modeling shows that pronounced gradients of velocity and density form, and the resulting turbulence will mix and entrain ambient lake waters (Martin et al., 1998).
In lakes and reservoirs, the present understanding of interflow current and/or SPM dynamics is based on a limited number of field measurements. Using mooring data, Scheu et al. (2015) reported that the velocity, thickness and depth of the Toce River intrusion in Lago Maggiore (Italy) varied because of changes in the inflow. Best et al. (2005) measured longitudinal-vertical transect of velocities with an Acoustic Doppler Current Profiler (ADCP) in Lake Lillooet (Canada). They found that the inflow is partitioned into interflows along density stratification. Cossu et al. (2015) used moorings to study the seasonal variability of turbidity currents in Lake Ohau (New Zealand) and reported that inflows intruded into the thermocline during moderate floods. After a mine tailing impoundment spill into Lake Quesnel (Canada), Petticrew et al. (2015) observed the presence of both an underflow carrying larger particles and an interflow with smaller particles that remained suspended at thermocline depth.
Most of the time, the Rhône River intrusion into Lake Geneva develops as an interflow (Forel, 1885; Dominik et al., 1983; Giovanoli and Lambert, 1985; Hadler et al., 2014; Soulignac et al., 2021). Using spaced-out current meter profiles and turbidity measurements, Giovanoli (1990) suggested that horizontal spreading and entrainment of ambient lake waters were the two main mechanisms responsible for interflow dissipation, and that density stratification and horizontal density differences, as well as lake currents and the Coriolis force, affect interflow pathways. Ishiguro and Balvay (2003) took detailed CTD (Conductivity, Temperature, Depth) and turbidity profiles and confirmed that Rhône River interflows develop at thermocline depth, and can remain trapped in the thermocline for significant distances. Soulignac et al. (2021) showed that the Rhône River plume can be deviated by counterclockwise rotating coastal upwelling events. Based on three-dimensional (3D) numerical modeling, Cimatoribus et al. (2019) demonstrated that the far field of the Rhône River plume is controlled by large-scale gyres. However, very little is known about interflow SPM concentration and composition in the nearfield. From bottle samples taken at a limited number of locations, Giovanoli (1990) found that the composition of SPM evolves with distance from the river mouth due to the different settling velocities of the components.
Although previous lake studies provide a basic characterization of interflows in lakes and their driving mechanisms, they do not allow a comprehensive understanding of interflows, because they are based on a limited number of point measurements. Detailed measurements of the velocity distribution in the whole cross-section of the interflow plume have never been made, even though these are essential: (i) for determining the shape of the interflow velocity profile distribution along the plume trajectory into the lake, and (ii) in particular, for quantifying important parameters such as the rate of spreading, the entrainment, and the fate of SPM in the nearfield.
Therefore, in a novel approach, we combined high-resolution current measurements along transects with profiles of temperature, turbidity and particle size distribution. As a result, this study, carried out in the negatively-buoyant, laterally-unconfined Rhône River plume in stratified Lake Geneva, allowed the quantification of interflow nearfield hydrodynamics and SPM changes. The following questions are addressed:
• Can the current velocity field in the interflow be constructed from ADCP transects? If so, what are the characteristics of this flow field during summer stratification? Is the interflow organized as a coherent core flow? Is lateral spreading important along the interflow pathway?
• Can the SPM introduced by the river inflow be quantified by calibrating the acoustic backscattering intensity in the interflow? If so, what is the SPM composition and how does it change along the pathway of the interflow?
• Can water, momentum and sediment fluxes and the entrainment rate be determined?
• Can the development of the interflow nearfield and the above parameters along the pathway of the plume be quantified?
• How is the development of the interflow field affected by river discharge which represents the momentum input?
Figures, tables, and text with the prefix S, which provide details and clarifications on certain topics discussed in the main text, are found in the Supplementary Material Section.
Materials and Methods
Study Site
Lake Geneva (local name: Lac Léman), located between Switzerland and France, is Western Europe's largest lake (Figure 1A). This perialpine, warm, deep and oligomictic lake has a surface area of 582 km2, a volume of 89 km3 and a maximum depth of 309 m. It is strongly thermally stratified from spring to early fall, with surface temperatures reaching up to 25°C during summer. A thermocline (metalimnion) is located at about 15-m depth in summer and deepens during fall and winter. Occasionally, complete mixing takes place during very cold winters (CIPEL, 2019).
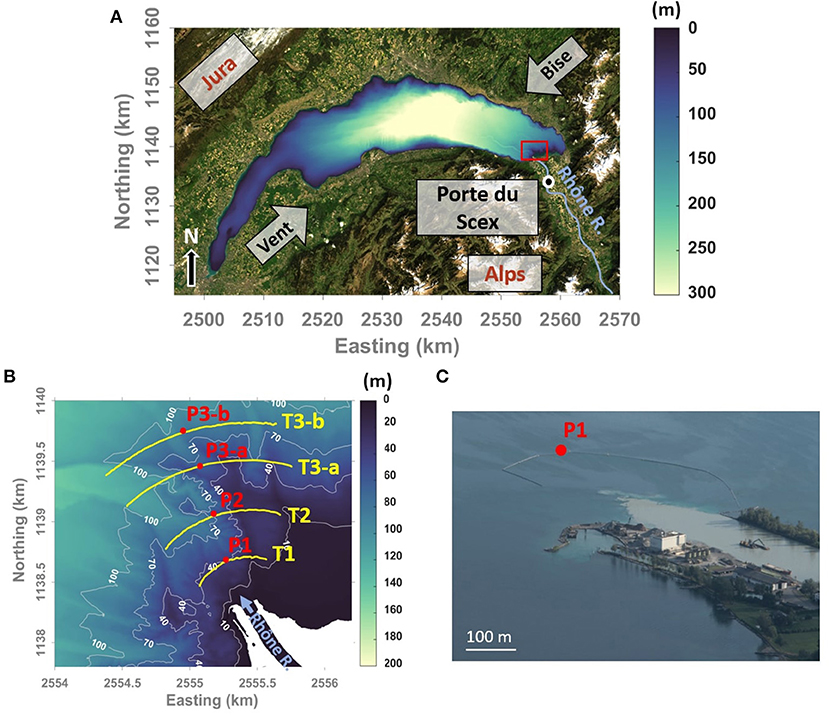
Figure 1. (A) Bathymetric map of Lake Geneva also showing the mountain chains, Jura and Alps, that channel the strong dominant winds called Vent and Bise over most of the lake surface. The FOEN hydrological survey station at Porte de Scex on the Rhône River is marked by a white circle. The small red box approximately delimits the study site located in front of the Rhône River mouth. (B) Zoom of the study site where the Rhône River enters the lake. The yellow lines show the ADCP transects (T1, T2, T3-a, and T3-b). Red dots indicate the stations (P1, P2, P3-a, and P3-b) where the CTD and LISST profiles were taken. The Swiss coordinate system (CH1903+) is used (Swiss Federal Office of Topography, http://www.swisstopo.admin.ch, last accessed 12 June 2021). (C) Image of the Rhône River plume entering Lake Geneva. Due to the sediment load, the plume is turbid and appears light colored in the image; it plunges shortly after entering the lake. Note the triangular plunge region that indicates lateral plume slumping. Station P1 is marked.
Rhône River
The Rhône River is a glacier-fed river that is very low in organic matter, but high in SPM. It enters Lake Geneva at its eastern end (Figure 1B) in a 120-m wide channel (average depth 5 m). With a Kelvin number ranging from 0.02 to 0.05, the Rhône River is considered a small river and therefore the Coriolis force should not affect its nearfield plume (Soulignac et al., 2021). The Rhône River is the principal source of water and sediments for the lake, accounting for ~ 68% of the total water discharge and particulate matter input (Burkard, 1984; Zahner and Vernet, 1984).
At Porte du Scex (5 km upstream of the river mouth, Figure 1A), the Swiss Federal Office for the Environment (FOEN) records discharge, water temperature and turbidity. FOEN also collects Suspended Sediment Concentrations (SSC) twice a week. A calibration between the SSC and the turbidity data over a 3-y period (2017–2019; linear regression r = 0.90; not shown) was carried out to convert the continuous turbidity data into continuous SSC.
The annual mean Rhône River discharge for 1970-2020 was 184 m3 s−1 with a mean SSC of 233 mg l−1. The high flow season starts in May after snowmelt and lasts until the beginning of high altitude freezing in October, with a mean water discharge and SSC above the annual mean (245 m3 s−1 and 410 mg l−1, respectively).
Field Instrumentation and Derived Parameters
To investigate the influence of river inflow parameters on the interflow dynamics, four field campaigns along three semicircular transects (Figure 1B) were conducted in 2018 and 2019 in front of the Rhône River mouth at high and at intermediate river discharge during the stratified period when interflows are most likely to develop. The results of two campaigns will be discussed in this paper; note that the remaining campaigns provided similar results (not shown). Measurements were made along three sections of circular trajectories centered on the river mouth: T1, T2, and T3-b on 11 July 2018 and T1, T2, and T3-a on 18 September 2018 (Figure 1B). The corresponding radii of the trajectories were 400 m for T1, 800 m for T2, 1,200 m for T3-a, and 1,500 m for T3-b (Figure 1B). Velocity profiles were measured with a towed, downward looking (at 0.5 m below the surface) Acoustic Doppler Current Profiler (ADCP); 300 kHz Teledyne Marine Workhorse Sentinel in Mode 12 and bottom tracking mode. Current intensities and directions were measured along full-depth vertical profiles with depth cells of 1 m, using a profile sampling frequency of 1 Hz, resulting in a profile spacing of 0.7–1.4 m along each transect. ADCP velocities with a low echo amplitude signal (<70 counts) were removed. A moving average over 25 s (corresponding to ~25 m) was applied for both components (East-West and North-South) together with a moving average in the vertical direction over 3-m thick layers. Velocity data within the 3-m layer below the surface and within the 3-m layer above the lakebed were discarded due to acoustic reflection.
Vertical profiles of Conductivity, Temperature and Depth (CTD) were measured in the middle of each transect at stations P1, P2, P3-a, and P3-b (Figure 1B, Supplementary Table 1) using a multiparameter probe (Sea & Sun Marine Tech CTD 75 M). On 11 July 2018, the CTD was equipped with an optical turbidity sensor (Sea Point Inc.) In parallel to CTD measurements, depth profiles of particle size distribution and concentration were measured using an in situ laser scattering (670 nm) and transmissometry instrument (LISST-100X, type C, Sequoia Scientific Inc.).
Wind Data
The wind conditions during the campaign were determined from gridded (1.1 × 1.1 km) surface wind data produced by the Consortium for Small-scale Modeling (COSMO) and made available by the Swiss Meteorological Services (MeteoSwiss). Hourly data were averaged over the area presented in Figure 1B.
Hydrological Parameters
Salinity and density were derived from CTD data following the general UNESCO polynomial relationship (UNESCO, 1983). The Brunt-Väisälä frequency N (s−1), which is an indicator of water column stratification, was computed from the density profiles as:
where g is the magnitude of gravitational acceleration (m2 s−1), ρ the potential water density (kg m−3) and z the depth (m).
Abessi et al. (2012) proposed a classification scheme for negatively-buoyant surface discharge based on three length scales:
with discharge volume flux Q0 (Q0 = U0A0), momentum flux M0 (M0 = Q0U0), and buoyancy flux J0 (J0 = Q0) (Fischer, 1979), where = (Δρ0/ρa)g is the initial reduced gravity term, Ua is the ambient velocity, U0 is the discharge velocity, and A0 is discharge cross-sectional area of the river mouth.
According to Abessi et al. (2012), LQ is the discharge length scale. It compares the volume flux with momentum flux and indicates the region where the river channel geometry strongly affects the flow characteristics. The jet-to-plume length scale LM, measures the relative importance of the initial momentum and buoyancy fluxes. For negatively-buoyant discharges, it determines the distance of the plunge point from the river mouth. Lm is the jet-to-cross-flow length scale. This length scale indicates the location where the jet-like flow becomes strongly deflected because of the ambient flow.
Chu and Jirka (1986) proposed the ratio
as a source factor where a small LQ/LM value indicates a strong jet-like flow, whereas a large LQ/LM value suggests that the flow is dominated by buoyancy effects close to the point of discharge. They also introduced a cross-flow–shallowness interaction factor
In a classification diagram, Abessi et al. (2012) showed that C1 = 1 separates jet flow from plunging plumes.
The plume-to-cross-flow length scale L is used to characterize the relative importance of the river inflow to the ambient cross-flow velocity, defined as Doneker and Jirka (2007) and Abessi et al. (2012):
Suspended Particulate Matter Parameters
Particle properties were derived from LISST-100X profile measurements. The instrument measures the particle size distribution in 32 log-spaced size bins. The measured LISST laser diffraction spectrum was first converted into particulate volume concentration (μl l−1) using the factory volume calibration constant. Following the recommendation of Mikkelsen et al. (2005), the largest class (no. 32, 350 μm) was removed. The sum of the volume concentrations between classes no. 1 (2.05 μm) and no. 31 (297 μm) provided the SPM Volume Concentration (SPMVC). The particulate volume concentration was normalized by the width of each of the logarithmically-spaced classes and gave the Particle Size Distribution (PSD; μl l−1 μm−1). Then, the diameter corresponding to 50% of the cumulative volume concentration (D50, μm) was calculated.
Acoustic Backscattering Intensity (BI) recorded by the ADCP is caused by the backscattering from sediment particles in the water column. Since ADCP measurements provide full depth BI profiles along the ADCP transects, it is of interest to calibrate BI in terms of SPM in order to quantify SPM concentrations (SPMAC) from the ADCP measurements. This was done in three steps: (i) SPM concentrations (SPMOPT) were obtained from the turbidity sensor of the CTD instrument; for details, (see Supplementary Text 1), (ii) The received level of the acoustic return signal along each beam of the ADCP was converted into the backscattering index BI; (see Supplementary Text 2), and (iii) Profiles of sediment discharge QSED were thereafter determined by the best-fit regression relationship between SPMOPT and BI; (Supplementary Text 3).
Water Discharge, Momentum, Entrainment, and Sediment Discharge
Giovanoli (1990) suggested that the interflow propagates in the lake as a jet, in which case the interflow discharge (Qint, m3 s−1) and the interflow momentum flux (Mint, m4 s−2) can be expressed, respectively, as Thomas et al. (1990):
where u (m s−1) is the normal component of the current, F (rad) is the angle defined by the angular position of the boat on each ensemble on each transect, R is the radius of the curved segment and z is the depth (m) for each vertical bin within the interflow.
The entrainment rate (γ), or mixing ratio, is given by Lee and Yu (1997), Lamb et al. (2010), and Hogg et al. (2013):
where Qr is the Rhône River discharge at Porte du Scex (Figure 1A, Supplementary Figure 1). The interflow suspended sediment discharge (QSED, g m−2 s−1) was computed as the product of Qint and the calibrated acoustic SPM concentration, SPMAC, for each horizontal ensemble and each vertical ADCP bin as:
Results
Environmental Conditions
Two campaigns carried out on 11 July and on 18 September 2018 will be discussed below in detail. Additional campaigns on 17 July 2019 and 24 September 2019 gave similar results (not shown). The wind was moderate during both campaigns (~2 m s−1). It blew southwards on 11 July, and northwestward on 18 September (Supplementary Figure 1). Winds had been low to moderate on the days before the campaigns; thus, no significant lake currents were generated by wind. On 11 July, when the Rhône River discharge was affected by snow melt, the river discharge was 347 m3 s−1, which is above the seasonal mean (245 m3 s−1) and was nearly constant throughout the day, and SSC was approximately constant (~250 mg l−1). On 18 September, when the Rhône River discharge was determined by rain-induced surface run-off, both discharge and SSC were constant, with average values lower than the seasonal mean (211 m3 s−1 and 91 mg l−1, respectively) (Supplementary Figure 1). The discharge on 18 September was 40% lower than that on 11 July, whereas the SSC was 64% lower in September than in July.
Profiles of temperature, conductivity and N2 (the Brunt-Väisälä frequency) at stations P1, P2, P3-a, and P3-b showed that stratification was well developed during both campaigns (Figure 2). On 11 July, the metalimnion was located between ~7 and ~30 m depth, with temperatures decreasing from ~22°C at the surface to ~7°C below 30 m (Figures 2A–C). N2 reached a maximum between 7 and 15-m depth with values ~2.5 to 3.2 × 10⁻³ s−2, suggesting strong stratification. These conditions are typical for the spring/early summer period. At the top of the metalimnion, a rapid decrease in conductivity was observed (Figures 2A–C). Conductivity in the Rhône River is lower than in the lake. Therefore, low conductivity values close to the maximum of N2 (Figure 2) suggest that the Rhône River plume flows as an interflow in the thermocline.
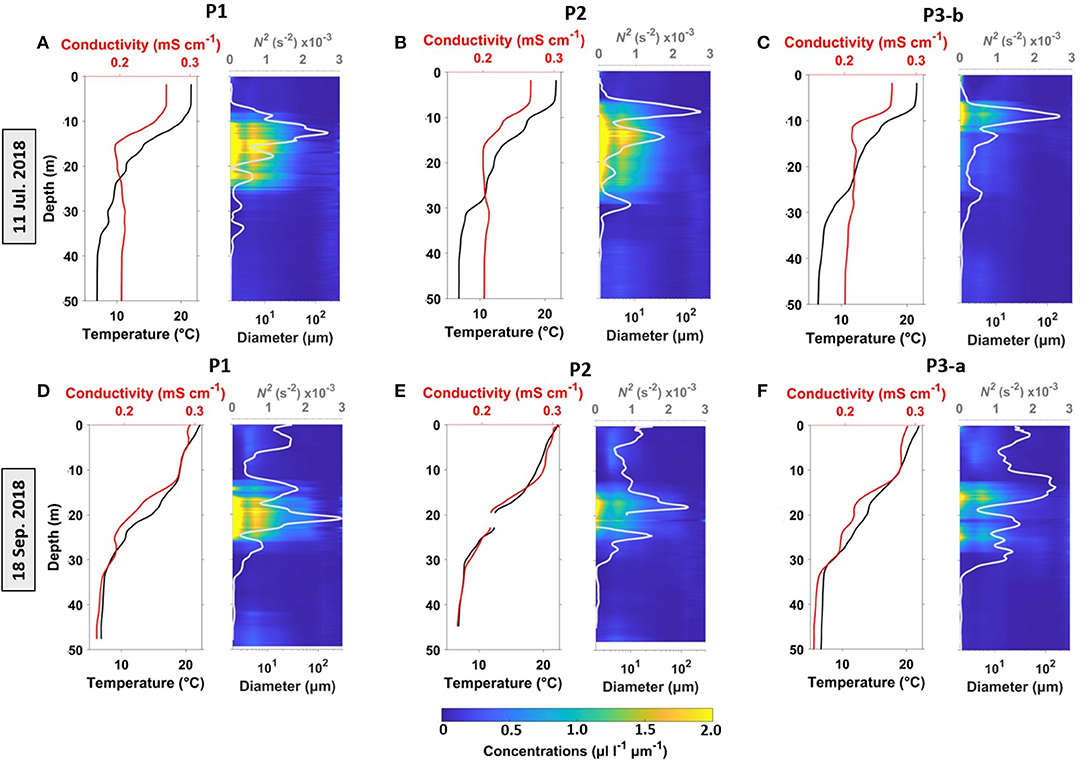
Figure 2. Temperature profiles (black lines), electrical conductivity at 25°C (red lines) and N2 profiles (white lines) plotted over concentration of particles per size class (color maps; from LISST) at stations P1, P2, P3-a, and P3-b. Top panels (A–C) 11 July 2018; bottom panels (D–F) 18 September 2018. Note the different ordinate axis values (depths) for P2 and P3. For station locations, (see Figure 1B). The colorbar gives the (volume) particle concentration per size class (μl l−1 μm−1).
On 18 September, at the beginning of the cooling season, the temperature decreased from 22.5°C at the surface to ~7°C below 30 m (Figures 2D–F). At P1 and P2, the temperature profiles were weakly stratified from the surface to ~15-m depth with a stronger stratification between 15 and 25 m depth (Figures 2D,E). At P3-a, the stratification was almost linear from the surface down to 30 m (Figure 2F). Conductivity profiles were homogeneous from the surface down to ~15 m, and decreased progressively below ~30 m depth (Figures 2D–F). For the corresponding density profiles, (see Supplementary Figure 3).
Hydrodynamics
Vectors of ADCP currents measured along the transects indicate that on 11 July 2018, strongest along-axis currents (Figures 3B,D) always occur at a depth below the largest N2 values and the lowest conductivity values in the metalimnion (Figure 2), whereas the position is less well-defined on 18 September due to the more complex N2 profiles. Across all transects, the interflow was nearly horizontal and located between ~7 and 30-m depth on 11 July (Figures 4A,E,I), and between ~15 and 30-m depth on 18 September (Figures 5A,E,I), thus confirming that the Rhône River plume had developed as an interflow spreading within the thermocline (Figure 2). In this layer, the currents in the core zone of the river plume flow straight out from the river channel (Figures 3A,C). At station P1, the vertical profiles of currents (Figures 3B,D) initially show a sharp, jet-like, symmetrical tapering of the velocity above and below the maximum, which is centered in the thermocline. Therefore, at P1, the interflow is vertically confined in a layer <20-m thick. In the horizontal plane at the depth of the maximum velocity, the normal velocities at T1 are again organized in a jet-like, nearly symmetrical pattern with velocities tapering on both sides of the maximum (Supplementary Figure 2), covering a ~400 m-wide layer, i.e., there is a 20:1 ratio between the lateral and vertical spreading. This velocity pattern becomes less evident at transects located further away from the mouth.
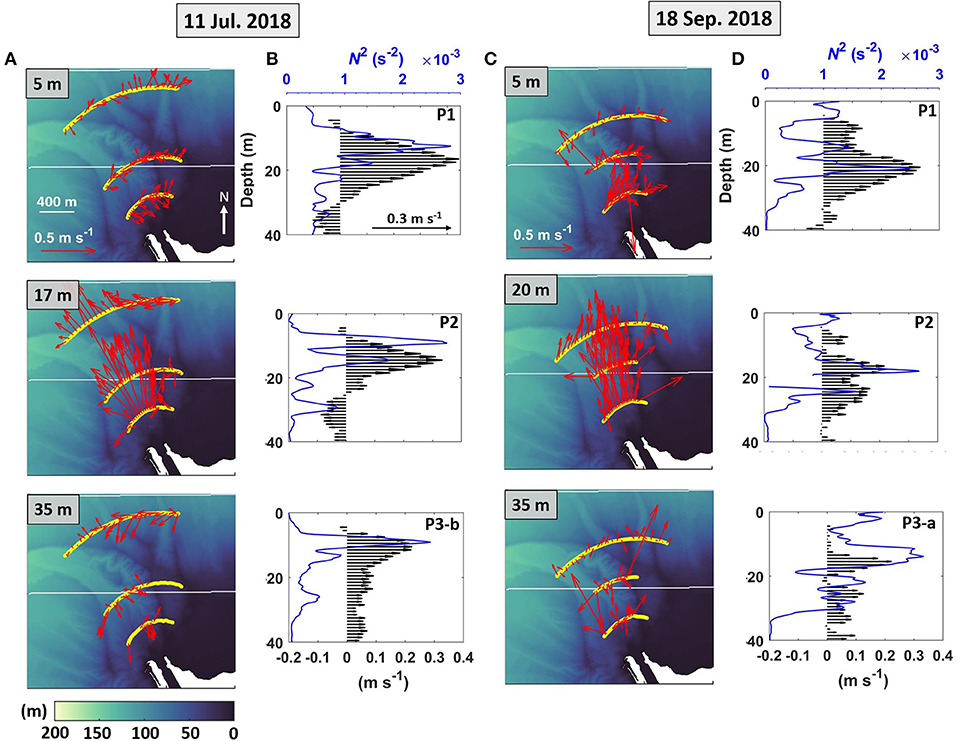
Figure 3. Current measurements for the two campaigns carried out on 11 July and 18 September 2018 in Lake Geneva. Columns (A,C) Current vectors (red arrows) along the ADCP transect (T1, T2, T3-a and T3-b, yellow lines) at different depths as given in the panels. Columns (B,D) Vertical profiles of normal velocity at stations P1, P2, and P3 in the center of each curved trajectory. N2 profiles (white lines) from Figure 2 are shown again in these panels. The colorbar gives the water depth. Reference arrows are drawn in (A,C). See Figure 1B for locations.
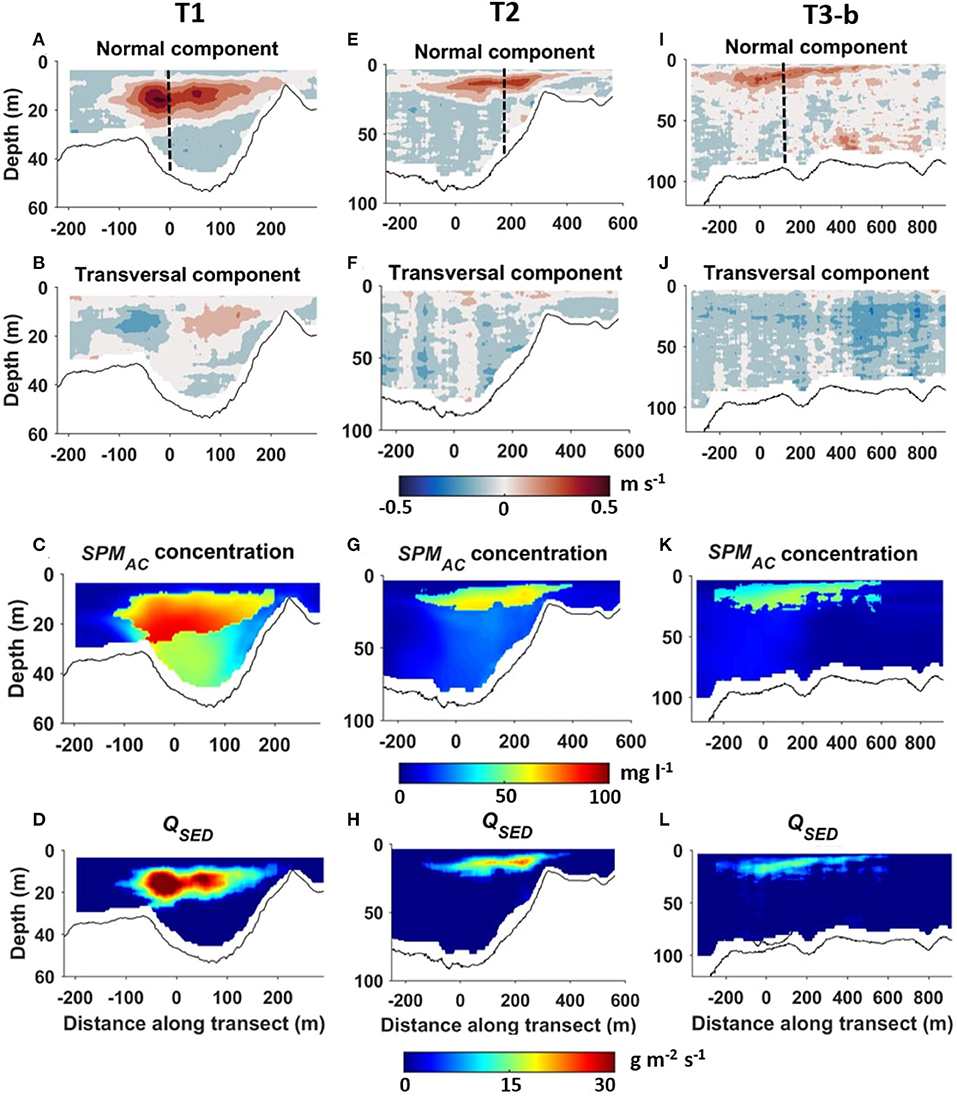
Figure 4. (A,E,I) Normal (u) and (B,F,J) transversal (v) velocity components, (C,G,K) SPMAC concentrations and (D,H,L) suspended sediment discharge QSED for transects T1, T2 and T3-b on 11 July 2018. Refer to Figure 1B for transect locations. The dashed lines correspond to the positions of stations P1, P2 and P3-a. Colorbars give parameter ranges.
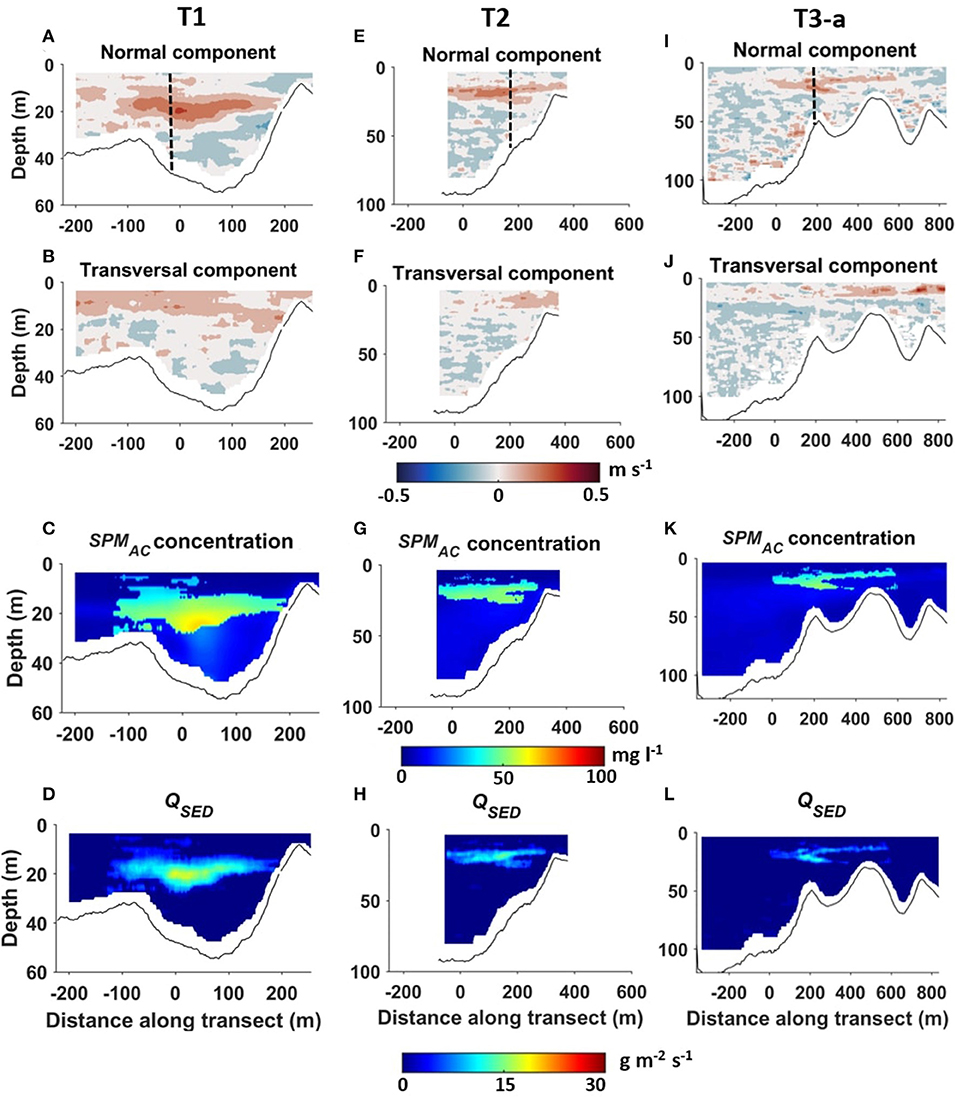
Figure 5. (A,E,I) Normal and (B,F,J) transversal velocity components, (C,G,K) SPMAC concentrations, and (D,H,L) suspended sediment discharge QSED, for transects T1, T2 and T3-b on 18 September 2018. Refer to Figure 1B for transect locations. The dashed lines correspond to the positions of stations P1, P2 and P3-b. Colorbars give parameter ranges.
Contour plots of the normal velocities (u) across the whole T1 transect (Figures 4A, 5A) show a core zone with strong positive velocities (up to 0.5 m s−1) in the interflow surrounded by slow, and occasionally negative normal currents (~-0.1 m s−1) in the ambient water during both campaigns. This indicates that the jet-like tapering of the velocities seen in the vertical (Figures 3B,D) and horizontal (Supplementary Figure 2) profiles at P1/T1, is characteristic for the whole interflow cross-section and that the high-velocity core zone extends over a large part of the interflow cross-section. With distance from the mouth, core velocities decreased (Figures 4A,E,I, 5A,E,I), the core zone became progressively thinner, and spread horizontally. On 18 September, when the Rhône River discharge was lower, the core zone pattern was less well-developed and weakened more rapidly with distance from the mouth.
With distance from the mouth, the width of the interflow laterally increased progressively from ~400 m at T1 to ~800 m at T3-a or ~900 m at T3-b, while the vertical extent of the interflow decreased. Note that the Rhône River channel is about 120-m wide. Thus, lateral spreading of the interflow clearly dominated over vertical spreading. The maximum normal velocities decreased with distance from the mouth, i.e., from 0.5 m s−1 at T1 to 0.3 m s−1 at T3-b on 11 July, and from 0.3 m s−1 at T1 to 0.2 m s−1 at T3-a on 18 September. At the depths of the interflows, the transversal currents flowed to the right in the right part of the transect, and to the left in the left part of the transect on 11 July at T1 (Figure 4B), illustrating lateral spreading of the plume. On the same day at T2 and T3-b, the transversal currents within the interflow slowly flowed predominantly toward the right side, while the transversal currents mainly flowed toward the left side in the rest of the water column (Figures 4E,I). A similar pattern was also seen on 18 September (Figures 5A,E,I). Overall, the vertical component of the observed currents showed no coherent flow patterns and mainly had small negative (downward) values (at the limit of the instrument resolution; not shown).
Based on the observed core zone in the center of the interflow (Figures 4, 5) and the jet-like tapering of the normal velocities in each transect (Figure 3, Supplementary Figure 2), the interflow cross-section was divided into three zones: (i) the interflow core, (ii) the transition zone between the interflow and the ambient waters, which corresponds to the shear layer region in jet flow, and (iii) the surrounding ambient water. The width and thickness of these three zones were defined according to the contour patterns of the normal component in Figures 4, 5. In each transect, the bins corresponding to normal component velocities ≥0.2 m s−1 were defined as the core of the interflow zone (Figure 3). Bins corresponding to normal component velocities ranging from 0.1 to 0.2 m s−1 and having outward decreasing gradients were defined as the transition zone between the interflow and the ambient waters. The remaining water column was considered as ambient waters.
Box plots of the normal and the transversal current components within the three different zones are presented in Figure 6. In the core zone, the box plots of the normal component u showed high median values and low variability for both campaigns (Figure 6). The median value of u in the core slightly decreased from T1 to T3-b (from 0.35 to 0.27 m s−1) on 11 July with its extreme values ranging from 0.21 to 0.55 m s−1, whereas the median remained almost unchanged from T1 to T3-a (~0.25 m s−1) on 18 September. The transversal component v within the core zone had low median values and low variability.
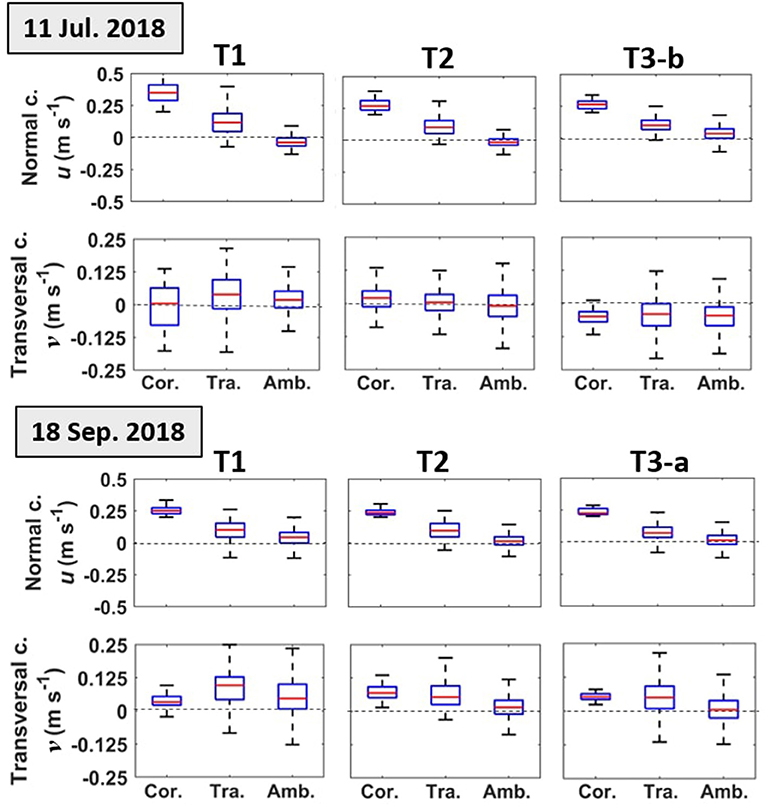
Figure 6. Box plots of the normal (u) and transversal (v) current components in transects T1, T2, and T3-b for 11 July 2018 (top panels) and in transects T1, T2, and T3-a for 18 September 2018 (bottom panels) for the three zones: core zone of the interflow (Cor.), transition zone between the interflow and the ambient waters (Tra.), and ambient water zone (Amb.). The red line in each box indicates the median, and the bottom and top edges of the box, the 25th and 75th percentiles. The whiskers extend to the most extreme data points. For location of transects, (see Figure 1B).
In the transition zone between the core of the interflow and the ambient waters, u had intermediate values, with median intensities oscillating between 0.10 and 0.15 m s−1, and a higher variability than in the core zone for both campaigns (Figure 6). The median values of the v component in the transition zone were low (Figure 6). However, it had wider boxes than the normal velocities, and had a wide variability range, as depicted by the whiskers. This suggests that mixing and entrainment are higher in the transition zone than in the core zone and thus can explain the tapering of the normal velocity seen above (Figure 3, Supplementary Figure 2). In the ambient waters, median values of the u and v components were very low with some variability.
When the areas of the interflow covered by different classes of the normal velocities are calculated, the area of the highest velocity class, characteristic for the core zone, rapidly decreases beyond the 400-m transect (Figure 7A). At the same time, the area covered by the lowest velocity class (0.1–0.2 m s−1, typical for the transition zone) increases more rapidly with distance from the mouth. This increase can be related to increased mixing and entrainment occurring along the pathway. For the higher discharge on 11 July, this development is much more pronounced. The mean velocity of the longitudinal component integrated over the whole interflow area (Figure 7B) is considerably lower than the maximum velocity in the center of the core zone (Figures 3–5, Supplementary Figure 2), and it decreases almost linearly with distance from the river mouth (Figure 7B). The rate of change of the mean velocity with distance from the mouth is similar in both cases. The low mean velocity reflects the significant contribution of lower velocities in the transient zone (Figures 6, 7A), thus reflecting the strong effect of mixing and entrainment.
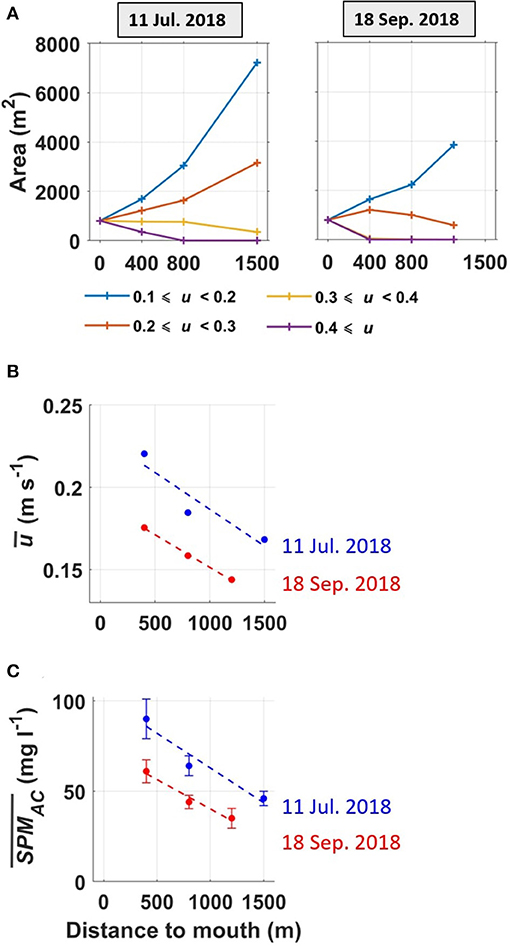
Figure 7. (A) Areas in the interflow covered by different classes of normal current velocities, (B) mean interflow normal velocity, and (C) mean SPM as function of distance from the Rhône River mouth, averaged over the full interflow area for the two field campaigns. The legend in (A) defines the velocity classes.
Suspended Particulate Matter Concentrations
In the calibration procedure outlined in Section Suspended Particulate Matter Parameters, good agreement, i.e., low Root Mean Square Error (RMSE) and high regression coefficients r, was found; results are given in Supplementary Text 3. Therefore, SPMAC obtained from the calibration was used to derive SPM concentrations from the acoustical signal to determine detailed high-resolution SPM estimates all along the transects and over the whole water column. This is a significant improvement over sporadic single point measurements that were used in the past for SPM estimations. ADCP-derived SPM concentrations (Supplementary Text 2) and sediment fluxes QSED were much higher within the interflows than in the surrounding water (Figures 4, 5). As expected, the SPM concentrations within the interflows at T1 were always significantly smaller (~2–3 times) than the corresponding daily averaged SSC at Porte du Scex (Supplementary Figure 1). Therefore, it can be assumed that considerable amounts of sediment had already settled out of the Rhône River plume in the plunge and underflow zones before reaching T1 as an interflow.
On 11 July, maximum SPM concentrations within the interflows were observed in the lower part of the interflow (Figures 2, 4, 5) and decreased with distance from the mouth. SPM concentrations and QSED were overall lower on 18 September. Mean SPM concentrations over the interflow area decreased almost linearly with distance from the river mouth (Figure 7C). The rate of change of SPM concentrations was similar for both field campaigns, even though there was a significant difference in the sediment charge carried by the Rhône River (Supplementary Figure 1).
The surrounding water had low QSED (<0.1 g m−2 s−1) and low concentrations (~0–10 mg l−1), except directly below the interflow where concentrations reached up to 40 mg l−1 at T1 on 11 July and 25 mg l−1 at T1 on 18 September (Figures 4C, 5C, respectively), suggesting that sediment was settling out from the interflow.
Sediment Load Properties
Profiles of normalized concentration of particles per size class measured with the LISST-100 instrument were analyzed to characterize the SPM properties in the interflow and the surrounding waters. During both campaigns, the profiles of normalized concentration of particles per size class measured with the LISST-100 contained high concentrations for particle diameters 2–20 μm at the metalimnion depth (Figure 2). At 20-m depth, the concentrations were highest for particles 6 to 10 μm for both campaigns, particularly at 400 m from the mouth. This peak decreased with distance from the mouth, while high concentrations (> 2 μl l−1 μm−1) for 2–3-μm particles were still evident in all transects. This suggests that the interflow waters mainly carried fine particles, with a limited contribution of large particles. At the same time, concentrations of ~0.2–0.5 μl l−1 μm−1 were measured for particle diameters > 100 μm from ~20 m down to the bottom of the water column at P1 and P2 (Figure 2). The corresponding Particle Size Distribution (PSD) spectra at 20 and 40-m depth further describe the particle distribution between the interflow and the surrounding waters (Figures 8A,D). Below the interflow at 40-m depth, the PSD at stations P1 and P2 showed a decrease in the contribution of particles <3 μm and an increase in the contribution of particles > 100 μm compared to the PSD at 20 m (Figures 8A,D). At P3-a and P3-b, the contributions of large particles to the total SPMVC at 20 and 40-m depth were comparable and very low, suggesting that large particles had almost completely settled out from the water column at that distance from the mouth (Figures 8A,D).
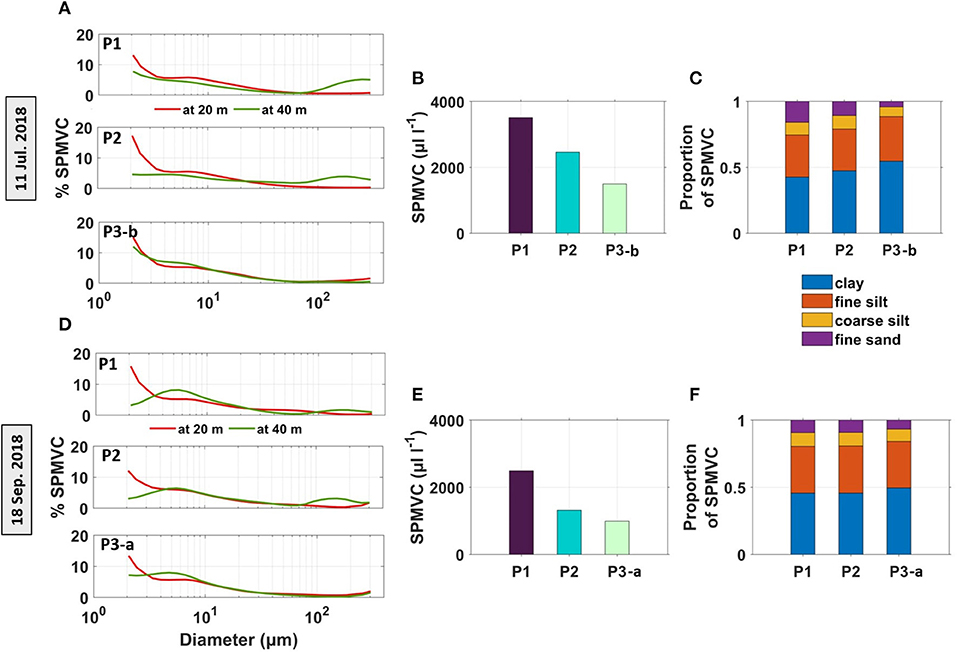
Figure 8. Depth-averaged Particle Size Distribution (PSD) (% of total particle volume (SPMVC) for size classes in μm) measured at (A) stations P1, P2, P3-b on 11 July 2018 and at (D) P1, P2, P3-a on 18 September 2018. The red and green lines represent the PSD at 20 and 40 m (averaged over 1-m depth). (B,E) Total SPMVC computed at P1, P2, P3-a, P3-b, and (C,F) proportions of clay, fine silt, coarse silt and fine sand in terms of proportion of total SPMVC averaged over the water column, at P1, P2 and P3-a, P3-b during the two campaigns. For station locations, (see Figure 1B).
The relative contribution of each size class to the total SPMVC with distance from the mouth for both campaigns (Figures 8B,C,E,F) was investigated next. Based on the Udden-Wentworth grain-size scale (Udden, 1914; Wentworth, 1922), particles <4 μm are considered to be clay, 4-31 μm as fine silt, 32–62 μm as coarse silt and particles >62 μm as fine sand. With increasing distance from the mouth, SPMVC progressively decreased from ~3,500 μl l−1 at station P1 to ~1,500 μl l−1 at station P3 on 11 July, and from ~2,400 to ~900 μl l−1 on 18 September (Figures 8B,E, respectively). In addition, on 11 July, fine sand decreased from 0.12 of the total volume at P1 to 0.03 at P3-b, while the clay contribution increased from 0.40 at P1 to 0.55 at P3-b (Figure 8C). This shift in particle concentration proportions again suggests that heavier particles progressively settle out along the pathway of the interflow.
The profiles of particle concentration per size class and the corresponding PSD spectra showed that the metalimnion interflows mainly carried fine particles (<20 μm) (Figures 2, 8). This was supported by the correlation between N2, the median apparent diameter of particles (D50), and the normal u velocity component of the current combined for the two campaigns (Figure 9). The black box in Figure 9 corresponds to the interflow, where stratification values were high (N2 > 0.5 s−2), D50 values were small (<8 μm), and u values were high (>0.20 m s−1). The largest D50 values (>20 μm) were observed for weak stratification (N2 <0.2 s−2) and weak current intensities (from −0.05 to 0.06 m s−1, red box in Figure 9). This characterizes the weakly stratified water mass below the interflow, where particles settled.
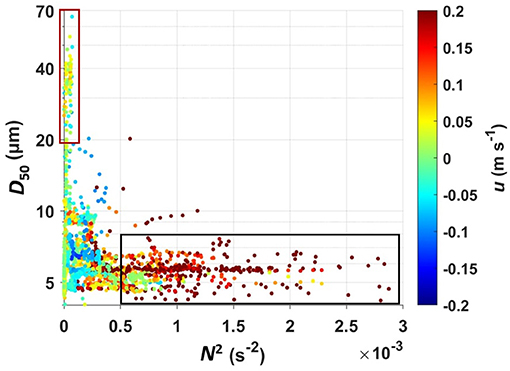
Figure 9. Relationship between N2, D50, and the normal component u of the current (colorbar, m s−1) at stations P1, P2, P3-a, and P3-b. Black box: interflow conditions. Red box: water mass below the interflow.
Fluxes and Mixing
Using the parameters measured for the Rhône River, the length scales and parameters presented in the Hydrological parameters section (Section Hydrological Parameters) were calculated and are summarized in Supplementary Table 2. The results are plotted in the classification diagram of (Abessi et al., 2012; Supplementary Figure 4), where it can be seen that the Rhône River falls into the class of plunging plumes and within the range of data points that Abessi et al. (2012) determined.
Using Equations (8–11), the interflow area (Areaint), water discharge (Qint), momentum flux (Mint), entrainment (γ) and suspended sediment discharge (QSED) were computed for transects T1, T2, T3-a, and T3-b (Figure 10). Results were compared to the hydrological data of the Rhône River at Porte du Scex (Supplementary Figure 1). Since the Rhône River follows a straight channel from the Port Scex to the lake, we assume that the data at Porte du Scex correspond to those of the river mouth.
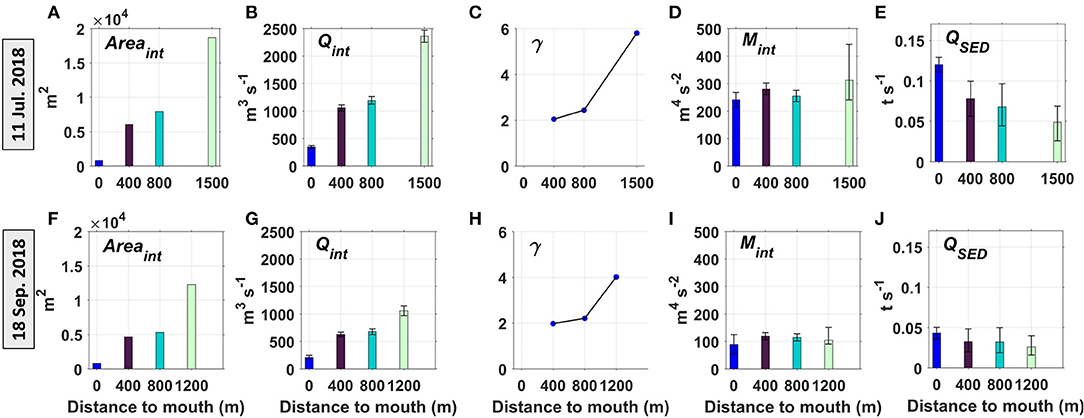
Figure 10. (A,F) Interflow area Areaint (m2), (B,G) water discharge Qint (m3 s−1), (C,H) entrainment γ, (D,I) momentum flux Mint (m4 s−2), and (E,J) suspended sediment discharge QSED (t s−1) of the interflow computed at 400 m (corresponding to T1 transects), at 800 m (T2 transects), at 1,200 m (T3-a transect), at 1,500 m (T3-b transect) from the mouth, and for the whole river section at Porte du Scex (at 0 m). The error bars on (B,D,G,I) represent the standard deviations. The error bars on (E,J) are explained in the Supplementary Material. Top panels: for 11 July 2018; Bottom panels: for 18 September 2018.
Areaint and Qint increased with the distance from the mouth (Figures 10A,B,F,G). Based on the daily river discharge (347 and 211 m3 s−1 on 11 July and 18 September, respectively, Supplementary Figure 1), Qint values were approximately twice as high during high discharge than during intermediate discharge. With distance from the mouth, γ entrainment values slightly increased from 400 to 800 m, and then they significantly increased from 800 to 1,500 m (Figures 10C,H). The interflow efficiency in entraining ambient water thus increased along the interflow pathway, explaining the observed increases in Qint with distance from the mouth (Figures 10B,G). Momentum flux (Mint) values remained almost unchanged from the river mouth, in agreement with the conservation of energy of a jet flow (Figures 10D,I).
Contrary to Qint, QSED progressively decreased with distance from the mouth (Figures 10E,J), reflecting the nearly linear decrease in mean SPM along the pathway (Figure 8C). Overall, QSED values were affected by the difference in flow regimes, with values ~2–3 times larger during the high-discharge flow regime (11 July) campaign than during the low-flow regime (18 September) campaign (Figures 10E,J). The rate of change in QSED along the pathway is also much smaller with the lower discharge on 18 September.
Discussion
Previous spatially-sparse point measurements taken in the Rhône River plume during the summer period reported interflows between 10 and 30 m depth in the nearfield with thicknesses of 7–20 m, and found that interflow velocities decreased with increasing distance from the river mouth, i.e., 0.4 m s−1 at 350 m and 0.15 m s−1 at 1,000 m (Giovanoli and Lambert, 1985). For comparable discharge rates, these values agree with the results from the ADCP transect measurements carried out in the present study, thus confirming the validity of this new approach. Furthermore, the transect measurements allowed for the first time in a lake, to characterize and quantify in detail the flow field, the SPM distribution and the associated fluxes across the full-interflow cross-section and below it. Due to low and variable ambient flows (Figures 3–6) during the measurement campaigns, the interflows flowed straight out from the river channel in a N-NW direction (Figure 3). The Rhône River discharge and SSC were approximately constant during the measurement period (Supplementary Figure 1). Therefore, the development of the nearfield described here was observed under nearly steady state conditions.
Interflow Characterization
The scales presented in Section Hydrological Parameters that determine the behavior of a river plume were calculated for both field campaigns (summarized in Supplementary Table 2). Values of C1 = 1.3 (equation 5) and C2 = 1.8 × 10⁻² (equation 6) were obtained for 11 July and C1 = 2.05 and C2 = 1.51 × 10⁻² for 18 September. Integrating these values into the classification diagram suggested by Abessi et al. (2012), the negatively-buoyant Rhône River inflow into the lake can be classified as a plunging plume (Supplementary Figure 4), in agreement with the observations (Figures 3–5). It plunges at a distance that is close to the predicted distance. C1 values close to one indicate that the Rhône River plume is a plunging plume that can still maintain jet-like features. This was consistent with the measured velocity profiles, in particular those obtained at the T1 cross-section. Stronger jet-like profiles were found for 11 July (C1 = 1.3) compared to those for 18 September (C1 = 2.5) (Figure 3). Small C2 values imply that the plume flows out straight and is not shore-attached. Again, this was observed in the measurements (Figure 3). Plume-to-cross-flow length scale L values (equation 7) of 6.5 × 10⁴ and 3.4 × 10⁴ m further indicate that the interflow in the nearfield region is not constrained by ambient flow (L 1; Doneker and Jirka, 2007; Abessi et al., 2012). This agrees with the observed straight outflow of the plume and thus confirms that in the present study, the development of the interflow was not affected by processes such as the passage of a coastal upwelling (Soulignac et al., 2021). Our analysis demonstrated that the classification scheme proposed by Doneker and Jirka (2007) and Abessi et al. (2012) is well-suited to characterize the Rhône River interflow plume in Lake Geneva.
Interflow Hydrodynamics
At a distance 400 m from the mouth, the normal velocities showed a well-developed core zone of high velocities that were only slightly below those measured in the Rhône River channel (Figures 4, 5). This core zone reduced in size at 800 m with smaller peak velocities, and was less developed beyond. Furthermore, the range of the observed transect interflow velocities decreased from as high as 0.5 m s−1 at 400 m to 0.2 m s−1 at 1,500 m from the mouth, and the mean normal velocity in the interflow decreased almost linearly with distance (Figure 7). Similar interflow velocity patterns were also seen in the other campaigns of this study (not shown) and compare well with those reported, but not analyzed in detail in a previous Rhône River interflow study when the interflow flowed straight out (Soulignac et al., 2021). This suggests that the observed velocity pattern development can be considered as universal for the Rhône River interflow plume when lake currents are too weak to affect the plume velocity field development.
At 400 m from the mouth, the vertical profile of the normal velocities and the transversal profile in the center of the core displayed symmetrical Gaussian-like profiles (Figure 3; Supplementary Figure 2). Considering that a river entering the lake can be approximated by a plane surface jet, the normal velocity distribution in the interflow at 400 m appears to resemble laboratory observations of plane jets with a Gaussian normal velocity distribution in the transversal plane (Van der Hegge Zijnen, 1958). The median values of the normal velocities in the core zone also continuously decreased with distance, as did the surface areas of the zones of high velocities, while those of low velocities strongly increased (Figure 6). Similar decreases were observed in plane jet laboratory studies. Suresh et al. (2008) showed that with decreasing outlet velocities of a plane jet, the core zone disappears more rapidly, and large-scale coherent structures become increasingly important in breaking down a jet-like profile. This can explain the difference in the velocity pattern development of the high discharge case on 11 July and the intermediate discharge case on 18 September (Figures 3–6).
The range of variability of the transversal velocity component (as indicated by the whiskers in Figure 6) in the transition zone is higher than that of the normal component, thus suggesting strong, lateral-mixing predominantly at the fringes of the interflow. At the same time, the vertical extent of the interflow plume decreased with distance from the mouth (Figures 4, 5), thereby focusing the interflow into the layer of strongest stratification. Due to entrainment of surrounding lake water, interflows can almost triple their area and double their water discharge within ~1 km from the river mouth (Figure 10), while they mainly spread in the transversal direction in a progressively thinner sheet (Figures 4, 5). This underlines the strong effect of stratification on interflow development. The above results show consistencies with plane jet concepts (Van der Hegge Zijnen, 1958; Suresh et al., 2008), which can therefore help interpret measurements in the interflow of the Rhône River in Lake Geneva.
The momentum fluxes (Figure 10) along the interflow pathways are approximately constant, which suggests that the resisting force due to the friction between the interflow and the ambient water is rather weak. This implies that the interflow could continue flowing over a long distance within the metalimnion. Ishiguro and Balvay (2003) traced the Rhône River interflow by turbidity in the metalimnion up to 30 km from the mouth.
Entrainment
The γ entrainment values of ~2 observed at transect T1 at 400 m from the mouth (Figure 10) suggest that entrainment is probably important in the plunging and underflow areas before reaching T1. In unconfined flow, the river inflow can develop laterally after leaving the inflow channel and as a result, the plunging of a negatively-buoyant inflow can be three-dimensional (3D) (e.g., Khan et al., 2005; Hogg et al., 2013). Figure 1C is a representative example of unconfined Rhône River plunging. The triangular shape of the plunge region indicates that the negatively-buoyant river plume slumps progressively before plunging, which can increase the width of the underflow compared to the river channel and thus can already cause lateral entrainment at this stage. This can explain why the interflow width at T1 at 400 m from the river mouth is larger than the river channel and why the discharge is higher than the river discharge (Figure 10). We obtained a Froude number of Fr = 1.7 for 11 July and Fr = 1.1 for 18 September. Hogg (2014) indicated that for Fr slightly larger than unity, slumping can be expected to be important in the plunging region after leaving the river channel.
Our γ values are considerably larger than those reported from laboratory studies in the plunging zone with two-dimensional (2D) laterally confined configurations over weak bottom slopes (constant width and slope, then a flat bottom): e.g., 0.17 (Lee and Yu, 1997), 0.02–0.3 (Fleenor, 2001), 0.2 (Lamb et al., 2010). Much higher entrainment was found in 3D flow laboratory studies that were separated from the sidewall (Johnson et al., 1989); converting their dilution into γ values results in γ up to 2). The present results, obtained from high resolution transect velocity measurements show that: (i) the interflow spreading is laterally unconfined, (ii) unconfined conditions along the river inflow pathway lead to high entrainment values, and (iii) hydrodynamic processes are highly 3D, mainly due to lateral spreading (Figures 4–6). Lateral spreading is much larger than the increase in the vertical extent of the interflow along the pathway, because it does not have to overcome gravity or vertical density gradients. Since the interflow has settled at a depth where ambient water density is comparable to the inflow density, horizontal mixing is much more efficient than vertical mixing. The curves of the entrainment rate for the two discharge cases (Figures 10C,H) are nearly identical; thus, the river discharge rate in the observed range is not a dominant control parameter for the entrainment process.
There is a noticeable change in the entrainment regime along the interflow pathways: γ values increased slightly 400 to 800 m from the mouth, while they doubled from 800 to 1,200 m and almost tripled from 800 to 1,500 m. This demonstrates the interflow's ability to entrain ambient water increases as it flows along the pathway (Figure 10). While the interflow excess velocity with respect to the lake water decreased in the streamwise direction (Figures 3–5) and thus could lead to decreased mixing, the interflow's active shear surfaces increased at the same time due to lateral spreading (Figures 4, 5), indicating that mixing increases. It therefore appears that as the interflow widens, the interflow volume contributing to entrainment also increases (Figure 10). From laboratory measurements (Suresh et al., 2008), it is obvious that large-scale structures become important further away from the mouth and can produce efficient mixing. This suggests that the interflow develops from a zone of flow establishment (400 to 800 m) to a zone of established flow beyond that distance. The change in the interflow currents between profiles at 400 and 800 m and those at 1,200/1,500 m further supports this (Figures 3–6). Such a change in the entrainment rate has not previously been reported in the literature.
Sediment Dynamics
The ADCP-derived SPM concentrations show that the Rhône interflows have significantly higher SPM levels compared to the ambient lake waters, and that part of their sediment load settles out along the interflow pathway. Decreases in the observed interflow SPM concentration and thus in suspended sediment discharge QSED along the interflow pathways were due to two simultaneously occurring processes: the increase of entrainment and the decrease of the total volume of suspended particles (SPMVC). The increase of entrainment with ambient waters results in an increase of interflow discharge Qint (Figures 10B,J) and a decrease in normal velocities (Figure 7B) along the pathway. This leads to particle settling, i.e., fewer particles are in suspension (Figure 7C) and to a decrease of QSED (Figures 10E,J); therefore, the decrease of QSEDis not due to dilution. The decrease in the total volume of particles calculated independently from LISST measurements (SPMVC; Figures 8B,E) also implies that particles have settled out of the interflow. The observed decrease in fine sand proportions in the interflow from stations P1 to P3-a and P3-b (Figures 8C,F) is larger than the loss of smaller particles and indicates that larger, coarser particles settled out faster along the interflow pathways.
The Stokes settling velocities for particles of 10 μm, which represent the pool of the smallest particles (clays and silts) is 0.07 mm s−1, and is 7 mm s−1 for particles of ~ 100 μm, the largest particles (sand). With a mean interflow normal velocity of 0.2 m s−1 (Figure 7), the interflow waters travel a distance of ~1,100 m between stations T1 and T3-b in 5,500 s (~1.5 h). In 1.5 h, the largest particles (100 μm) will have descended 38.5 m; this suggests that most of the largest particles can indeed settle out of the interflow before reaching T3, supporting our observations (Figures 2, 4, 5). The smallest particles (10 μm) would have theoretically descended 38.5 cm below the interflow in ~1.5 h; they can thus remain in suspension and travel long distances as observed by Ishiguro and Balvay (2003). These estimates may be conservative, because the Stokes concept: (i) assumes that the particles are spherical, which may not always be the case in glacier-fed waters that have only traveled along a short river stretch, and (ii) does not take into consideration the influence of the background currents (horizontal, vertical, turbulence) which may affect settling velocities; one can expect strong shear in the layer between the bottom of the interflow plume and the ambient waters. Actual settling velocities are likely to be larger than the Stokes settling velocity (Parsons et al., 2001). Therefore, faster settling may occur in the nearfield of the interflow, and processes such as sediment-driven convection-forming vertical finger plumes (Parsons et al., 2001; Davarpanah and Wells, 2016; Lu et al., 2022) can further accelerate the settling.
Following Lu et al. (2022) who proposed determining sediment-laden interflow characteristics based on different temperature and sediment-derived densities of the river and the lake, the sediment-laden negatively-buoyant Rhône River plume is an interflow. By the same concept, i.e., considering the density difference between water and sediment, but not the particle size distribution, a mean settling velocity of ~6 mm s−1 is obtained for 11 July and ~5.5 mm s−1 for 18 September. These are smaller than the Stokes settling velocity for the observed larger sized particles. They indicate that their settling velocity could be by an order of magnitude larger than the Stokes settling velocity. It appears that this concept cannot correctly predict settling when the particle size distribution is closer to a bimodal distribution as in our case (for details, see Supplementary Text 4).
Origin and Fate of Particles
From measurements taken at the Rhône River mouth in August 1982 and 1983 (discharge ranging from ~190 to 270 m3 s−1), Burrus et al. (1989) reported that the total volume of SPM was composed of ~75% of fine particles (clays and fine silts representing ~17 and ~58% of the total SPM, respectively), ~13% of particles 32–63 μm (coarse silts) and ~12% of particles > 63 μm (fine sand). In the present study, particle size distributions at station P1 located 400 m from the mouth (Figures 8C,F) were comparable to the observations of Burrus et al. (1989), thus indicating that the sediment composition of interflow is, at least initially, similar to that of the Rhône River.
An analysis of lake bottom sediment collected below the interflow at about 1.5 km from the Rhône River mouth showed that particles <2 μm contribute 11%, and particles 2–20 μm contribute 65% to the total particle distribution by weight, which is close to the distribution found in the interflow. These fine fractions are often assumed to be transported by interflows as passive substances with relatively small settling velocities (Winterwerp, 2001; Warner et al., 2008; Hetland and Hsu, 2013), in agreement with Ishiguro and Balvay (2003) who tracked turbidity in the far field of the Rhône River interflow. Sediment-laden interflow waters can reach the northern shore of Lake Geneva within a few days, and from there can be entrained into basin-scale gyres dominating the large-scale flow field (Cimatoribus et al., 2019).
The decrease of SPMVC along the interflow pathway due to particle settling suggests that zones of sediment accumulation on the lakebed develop in the area between stations P1 to P3. This agrees with findings by Loizeau et al. (2012) and Silva et al. (2019), who observed that the sedimentation rate in the Rhône delta area is inversely proportional to distance from the river mouth, with deposition rates near the mouth ranging from ~0.05 m y−1 to as high as 0.4 m y−1.
Since settled particles could potentially be charged with nutrients and pollutants, the lakebed area below the interflow could develop into an ecological hotspot. Furthermore, shore-hugging Kelvin waves (Lemmin et al., 2005) and counterclockwise-progressing wind-induced coastal upwelling events (Soulignac et al., 2021) are known to pass regularly through the Rhône delta area. They produce higher near-bottom velocities during their passage for a limited time, and consequently these bursts can resuspend some of this sediment and then transport it counterclockwise over even longer distances away from the delta.
Rhône River Discharge
From the present observations, Rhône River discharge characteristics are responsible for the differences in current velocity, size and SPM concentration observed in the two campaigns. Rhône River water discharge and associated SSC were higher on 11 July than on 18 September (Supplementary Figure 1), leading to higher normal velocities and SPM concentrations within the interflow, and to larger interflow areas (Figures 3–6, 10). However, the interflow dynamics and SPM composition remained qualitatively unchanged from one river regime to the other. A similar interflow evolution took place along the pathway during both campaigns in terms of the water and sediment discharge, momentum flux, entrainment and particle size (Figure 10). The differences in SPM concentration between the interflows at transect T1 and at Porte du Scex (concentrations were 2–3 times smaller at T1) suggest that intense mixing and entrainment in the plunge zone occur before reaching T1 (400 m from the mouth), as reflected by the high γ values at T1 (Figure 8). This is therefore the dominant process that increases the river plume buoyancy and explains how the river inflow develops into an interflow.
Interflow Intrusion Depth
The interflow intrusion depths increased from 7 to 20 m on 11 July to 15 to 25 m on 18 September, following the deepening of the metalimnion (Figures 2–5). These observed intrusion depths can be compared to the nominal intrusion depths defined by Cortés et al. (2014), i.e., depths where the density of the inflowing water equals that of the ambient water. River densities were computed using SSC (Supplementary Figure 1) and temperature measurements at Porte du Scex (not shown). On 11 July, the river density was 999.927 kg m−3, which corresponds to a nominal intrusion depth of 25 m in the lake (Supplementary Figure 3). On 18 September, the river density was 999.806 kg m−3, corresponding to a nominal inflow intrusion depth of 22 m (Supplementary Figure 3). The discrepancies between the real and the nominal intrusion depths indicate that entrainment of ambient waters between the river mouth and station P1 occurs, as confirmed by the γ entrainment values of ~2 observed at P1 (Figure 10). This process was not taken into consideration in the nominal intrusion depth calculation and thus results in an interflow intrusion depth that is above the expected intrusion depth.
Wells and Nadarajah (2009) suggested that the interflow intrusion depth Z can be determined as Z = aB1/3N−1 and proposed a = 4, where B is the buoyancy flux per unit width and N is the Brunt-Väisälä frequency (equation 1). We find a match for the calculated Z with our observed intrusion depth if a = 2.6 for 11 July and a = 3.1 for 18 September. The difference in a indicates that the underlying assumptions by Wells and Nadarajah (2009), i.e., that the intrusion depth is mainly controlled by entrainment in the vertical plane and that stratification is linear, are not well-suited for our case where lateral entrainment due to unconfined lateral spreading in the thermocline is important.
Knowing the actual intrusion depth of the Rhône River interflow would help to determine the availability of its nutrients for the lake's biological communities. For example, if the intrusion occurs above the compensation depth (i.e., where the rate of photosynthesis equals the rate of respiration), a deep chlorophyll maximum can develop, whereas if the intrusion occurs below the compensation depth, nutrients can settle in the hypolimnion or can be consumed by bacteria (Jellison and Melack, 1993).
Summary and Conclusions
The results of this study, carried out in Lake Geneva, were obtained using high resolution ADCP transect measurements that were then combined with profiles of temperature, conductivity, turbidity and particle size distribution measured 400 to 1,500 m from the Rhône River mouth. As opposed to traditional point measurements, this unique multi instrument package approach allowed, for the first time in a lake, a comprehensive nearfield characterization of an interflow plume, providing new insight into current patterns, SPM composition and sediment transport. Furthermore, it was also possible to quantify entrainment, interflow mass fluxes and momentum fluxes under different flow regime which previously were only hypothesized and/or estimated. The analysis has shown that:
• The negatively-buoyant Rhône River plumes flow as interflows within the metalimnion straight out in the streamwise direction. However, due to entrainment and settling out of particles before reaching the transect at 400 m from the mouth, they flow a few meters above their nominal intrusion depths.
• Interflows develop wide coherent core zones of high normal velocity with small transversal and vertical velocities. Core zones decrease in size with distance from the mouth. In the transition zones, i.e., between the core of the interflows and the ambient waters, streamwise mean normal velocities decrease outward; normal and transversal current velocities are of intermediate intensities, but have high variability, indicating strong mixing and entrainment in this zone.
• Along their pathways, the interflows laterally extend, but remain vertically constrained in the metalimnion and decrease in thickness. Due to the increase in entrainment with distance from the mouth, the total interflow areas and water discharges were 2 to 3 times larger at 1,200 and 1,500 m from the mouth than at 400 m. However, momentum fluxes remained nearly constant along the interflow pathways.
• Interflow nearfield development is a very dynamic 3D process. The lateral unconfined spreading that was newly documented here is a key process. As a result, significantly larger entrainment coefficient values are obtained compared to those that have been reported in laboratory studies based on 2D laterally confined configurations. This shows that interflow spreading in natural waters cannot be adequately addressed by laboratory 2D open-channel studies.
• Interflows are highly concentrated in SPM, in particular in the core zone, and mean SPM concentrations decrease linearly along the interflow pathways.
• The interflow SPM is mostly composed of fine particles (2–20 μm, i.e., clays and fine silts) and with relatively small proportions of coarse silt (32–62 μm) and fine sand (> 62 μm). The total volume of SPM within the interflow decreases by more than 50% from 400 to 1,500 m from the mouth.
• Settling of large particles, which almost completely disappeared from the water column at 1,500 m from the mouth, is mainly responsible for interflow SPM decreases. In addition, settling of clays and fine silts was observed beneath the interflow. These sediment losses, combined with increasing entrainment efficiency with the distance from the mouth, are likely to be the dominant mechanisms responsible for the decreases in SPM concentrations along the interflow pathways and for the corresponding observed decreases in sediment fluxes.
• Differences in river discharge regime only quantitatively affect the intensities of the interflow dynamics and suspended sediment fluxes, with values being 2–3 times larger during high discharge than during intermediate discharge. SPM dynamics are overall similar in the two cases.
• During the campaigns, the source factor, the cross-flow-shallowness factor and the plume-to-cross-flow length scale indicated that the weak ambient flow field had no obvious effect on the plunging plume and on the interflow development.
Rivers bring nutrients and contaminants into the lake, either dissolved or attached to sediment particles, which can affect water quality and thus the equilibrium of the lake ecosystem. By quantifying unconfined interflow spreading and sediment settling, this investigation has made a significant contribution toward the development of effective lake management concepts that ensure the good ecological functioning of lake systems. Such knowledge, which is presently lacking for this and other lakes, can help determine the fate of Nutrients and contaminants that rivers bring into the lake. Since the underlying concepts of our analysis are universal, the results are of general relevance for negatively-buoyant inflow from small rivers into lakes and oceans under comparable conditions of plunging plumes and low ambient currents.
Data Availability Statement
The raw data supporting the conclusions of this article will be made available by the authors, without undue reservation.
Author Contributions
DAB, FS, and UL contributed to the conception and design of the study. FS and UL designed the field campaign. BG, FS, and HW performed the measurements. VP organized the database, performed the data analysis and wrote the first draft of the manuscript. VP and UL wrote sections of the manuscript. All authors contributed to the manuscript revision, read, and approved the submitted version.
Funding
This work was supported by the Swiss National Science Foundation (SNSF) Grant Nos. 159422 and 178866. Open access funding provided by École Polytechnique Fédérale de Lausanne.
Conflict of Interest
The authors declare that the research was conducted in the absence of any commercial or financial relationships that could be construed as a potential conflict of interest.
Publisher's Note
All claims expressed in this article are solely those of the authors and do not necessarily represent those of their affiliated organizations, or those of the publisher, the editors and the reviewers. Any product that may be evaluated in this article, or claim that may be made by its manufacturer, is not guaranteed or endorsed by the publisher.
Acknowledgments
The authors would like to thank CIPEL for providing temperature profile data and SAGRAVE (http://www.sagrave.ch/) for their assistance with logistics, as well as the reviewers for their constructive comments and suggestions.
Supplementary Material
The Supplementary Material for this article can be found online at: https://www.frontiersin.org/articles/10.3389/frwa.2022.943242/full#supplementary-material
References
Abessi, O., Saeedi, M., Davidson, M., and Hajizadeh Zaker, N. (2012). Flow classification of negatively buoyant surface discharge in an ambient current. J. Coast. Res. 28, 148–155. doi: 10.2112/JCOASTRES-D-10-00131.1
Ahlfeld, D., Joaqui, A., Tobiason, J., and Mas, D. (2003). Case study: impact of reservoir stratification on interflow travel time. J. Hydraul. Eng. 129, 966–975. doi: 10.1061/(ASCE)0733-9429(2003)129:12(966)
Akiyama, J., and Stefan, H. G. (1984). Plunging flow into a reservoir: theory. J. Hydraul. Eng. 110, 484–499. doi: 10.1061/(ASCE)0733-9429(1984)110:4(484)
Alavian, V., Jirka, G. H., Denton, R. A., Johnson, M. C., and Stefan, H. G. (1992). Density currents entering lakes and reservoirs. J. Hydraul. Eng. 118, 1464–1489. doi: 10.1061/(ASCE)0733-9429(1992)118:11(1464)
Allan, R. J., Mudroch, A., and Sudar, A. (1983). An introduction to the Niagara River/Lake Ontario pollution problem. J. Great Lakes Res. 9, 111–117. doi: 10.1016/S0380-1330(83)71881-2
Best, J. L., Kostaschuk, R. A., Peakall, J., Villard, P. V., and Franklin, M. (2005). Whole flow field dynamics and velocity pulsing within natural sediment-laden underflows. Geology 33, 765–768. doi: 10.1130/G21516.1
Burkard, P. (1984). “Hydrologie – bilan hydrologique,” in Commission Internationale pour la Protection des Eaux du Léman (CIPEL) (Lausanne: Le Léman Synthèse 1957–1982), 43–48.
Burrus, D., Thomas, R. L., Dominik, J., and Vernet, J.-P. (1989). Recovery and concentration of suspended solids in the upper Rhône River by continuous flow centrifugation. Hydrol. Proc. 3, 65–67. doi: 10.1002/hyp.3360030107
Chu, V. H., and Jirka, G. H. (1986). Chapter 25: Surface Buoyant Jets, Encyclopedia of Fluid Mechanics. Houston, TX: Gulf Publishing Company.
Cimatoribus, A. A., Lemmin, U., and Barry, D. A. (2019). Tracking lagrangian transport in Lake Geneva: A 3D numerical modeling investigation. Limnol. Oceanogr. 64, 1252–1269. doi: 10.1002/lno.11111
CIPEL. (2019). Rapports sur les Études et Recherches Entreprises dans le Bassin Lémanique, Campagne 2018. Nyon: Commission Internationale Pour la Protection des Eaux du Léman (CIPEL). Retrieved from https://www.cipel.org/wp-content/uploads/2019/10/RapportScientifique_camp_2018-1.pdf (accessed January 4, 2021).
Cortés, A., Fleenor, W. E., Wells, M. G., de Vicente, I., and Rueda, F. J. (2014). Pathways of river water to the surface layers of stratified reservoirs. Limnol. Oceanogr. 59, 233–250. doi: 10.4319/lo.2014.59.1.0233
Cossu, R., Forrest, A. L., Roop, H. A., Dunbar, G. B., Vandergoes, M. J., Levy, R. H., et al. (2015). Seasonal variability in turbidity currents in Lake Ohau, New Zealand, and their influence on sedimentation. Mar. Freshw. Res. 67, 1725–1739. doi: 10.1071/MF15043
Davarpanah, J., and Wells, M. G. (2016). Enhanced sedimentation beneath particle-laden flows in lakes and the ocean due to double-diffusive convection. Geophys. Res. Lett. 43, 10–883. doi: 10.1002/2016GL069547
Dominik, J., Burrus, D., and Vernet, J.-P. (1983). A preliminary investigation of the Rhône River plume in eastern Lake Geneva. J. Sediment. Petrol. 53, 159–163. doi: 10.1306/212F817A-2B24-11D7-8648000102C1865D
Doneker, R. L., and Jirka, G. H. (2007). CORMIX User Manual: A Hydraulic Mixing Zone Model and Decision Support System for Pollutant Discharge into Surface Waters. Washington, DC: U.S. Environmental Protection Agency Office of Science and Technology EPA-823-K-07-001.
Eyre, B., and McConchie, D. (1993). Implications of sedimentological studies for environmental pollution assessment and management: Examples from fluvial systems in North Queensland and Western Australia. Sediment. Geol. 85, 235–252. doi: 10.1016/0037-0738(93)90086-K
Fischer, B., List, J. E., Imberger, J., and Brooks, H.N. (1979). Mixing in Inland and Coastal Waters. New York: Academic Press p. 212.
Fleenor, W. E. (2001). Effects and Control of Plunging Inflows on Reservoir Hydrodynamics and Downstream Releases. (PhD thesis), University of California, Davis, CA (USA).
Forel, F.-A. (1885). Les ravins sous-lacustres des fleuves glaciaires. Compt. Rendus l'Acad. Sci. Paris 101, 725–728.
Giovanoli, F. (1990). “Horizontal transport and sedimentation by interflows and turbidity currents in Lake Geneva,” in Large Lakes: Ecological Structure and Function, eds M. M. Tilzer and C. Serruya (Berlin: Springer), 175–195. doi: 10.1007/978-3-642-84077-7_9
Giovanoli, F., and Lambert, A. (1985). Die Einschichtung der rhône im genfersee: ergebnisse von Strömungsmessungen im August 1983. Schweiz. Z. Hydrol. 47, 159–178. doi: 10.1007/BF02551939
Hadler, J., Pralong, C., Bonvin, F., Lambiel, F., and Vennemann, T. W. (2014). Application of δ18O, δ13CDIC, and major ions to evaluate micropollutant sources in the Bay of Vidy, Lake Geneva. Isotopes Environ. Health Stud. 52, 94–111. doi: 10.1080/10256016.2014.971786
Hebbert, B., Imberger, J., Loh, I., and Patterson, J. (1979). Collie River underflow into the Wellington Reservoir. J. Hydraul. Div. 105, 533–545. doi: 10.1061/JYCEAJ.0005206
Hetland, R., and Hsu, T. (2013). “Freshwater and sediment dispersal in large river plumes,” in Biogeochemical Dynamics at Major River-Coastal Interfaces: Linkages with Glo. Change, eds T. Bianchi, M. Allison, and W. Cai (Cambridge: Cambridge University Press), 55–85. doi: 10.1017/CBO9781139136853.006
Hogg, C. A. R. (2014). The Flow of Rivers into Lakes: Experiments and Models. (Doctoral dissertation), Cambridge, UK: University of Cambridge.
Hogg, C. A. R., Marti, C. L., Huppert, H. E., and Imberger, J. (2013). Mixing of an interflow into the ambient water of Lake Iseo. Limnol. Oceanogr. 58, 579–592. doi: 10.4319/lo.2013.58.2.0579
Ishiguro, N., and Balvay, G. (2003). L'écoulement des eaux du Rhône dans le lac Léman. Arch. Sci. 56, 117–126. doi: 10.5169/seals-740434
Jellison, R., and Melack, J. M. (1993). Algal photosynthetic activity and its response to meromixis in hypersaline Mono Lake, California. Limnol. Oceanogr. 38, 818–837. doi: 10.4319/lo.1993.38.4.0818
Jirka, G. H. (2007). Buoyant surface discharges into water bodies. II: Jet integral model. J. Hydraul. Eng. 133, 1021–1036. doi: 10.1061/(ASCE)0733-9429(2007)133:9(1021)
Johnson, T. R., Ellis, C. R., and Stefan, H. G. (1989). Negatively buoyant flow in a diverging channel. IV: Entrainment and dilution. J. Hydraul. Eng. 115, 437–456. doi: 10.1061/(ASCE)0733-9429(1989)115:4(437)
Khan, S. M., Imran, J., Bradford, S., and Syvitski, J. (2005). Numerical modeling of hyperpycnal plume. Mar. Geol. 222–223, 193–211. doi: 10.1016/j.margeo.2005.06.025
Kremer, K., Corella, J. P., Hilbe, M., Marillier, F., Dupuy, D., Zenhäusern, G., et al. (2015). Changes in distal sedimentation regime of the Rhône delta system controlled by subaquatic channels (Lake Geneva, Switzerland/France). Mar. Geol. 370, 125–135. doi: 10.1016/j.margeo.2015.10.013
Lamb, M. P., McElroy, B., Kopriva, B., Shaw, J., and Mohring, D. (2010). Linking river-flood dynamics to hyperpycnal-plume deposits: experiments, theory, and geological implications. Geol. Soc. Amer. Bull. 122, 1389–1400. doi: 10.1130/B30125.1
Lee, H. Y., and Yu, W. S. (1997). Experimental study of reservoir turbidity current. J. Hydraul. Eng. 123, 520–528. doi: 10.1061/(ASCE)0733-9429(1997)123:6(520)
Lemmin, U., Mortimer, C. H., and Bauerle, E. (2005). Internal seiche dynamics in Lake Geneva. Limnol. Oceanogr. 50, 207–216. doi: 10.4319/lo.2005.50.1.0207
Loizeau, J.-L., Girardclos, S., and Dominik, J. (2012). Taux d'accumulation de sédiments récents et bilan de matière particulaire dans le Léman (Suisse-France). Arch. Sci. 65, 81–92. Available online at: https://archive-ouverte.unige.ch/unige:27609 (accessed January 15, 2021).
Lu, G., Wells, M., van Strygen, I., and Hecky, R. E. (2022). Intrusions of sediment laden rivers into density stratified water columns could be an unrecognized source of mixing in many lakes and coastal oceans. Sedimentology. doi: 10.1111/sed.12990
Martin, J., McCutcheon, S., and Schottman, R. W. (1998). Hydrodynamics and Transport for Water Quality Modeling. Boca Raton, FL: CRC Press.
Mikkelsen, O. A., Hill, P. S., Milligan, T. G., and Chant, R. J. (2005). In situ particle size distributions and volume concentrations from a LISST-100 laser particle sizer and a digital floc camera. Cont. Shelf Res. 25, 1959–1978. doi: 10.1016/j.csr.2005.07.001
Parker, G., Fukushima, Y., and Pantin, H. M. (1986). Self-accelerating turbidity currents. J. Fluid Mech. 171, 145–181. doi: 10.1017/S0022112086001404
Parsons, J. D., Bush, J. W., and Syvitski, J. P. (2001). Hyperpycnal plume formation from riverine outflows with small sediment concentrations. Sedimentology 48, 465–478. doi: 10.1046/j.1365-3091.2001.00384.x
Petticrew, E. L., Albers, S. J., Baldwin, S. A., Carmack, E. C., Déry, S. J., Gantner, N., et al. (2015). The impact of catastrophic mine tailings impoundment spill into one of North America's largest fjord lakes: Quesnel Lake, British Columbia, Canada. Geophys. Res. Lett. 42, 3347–3355. doi: 10.1002/2015GL063345
Scheu, K. R., Fong, D. A., Monismith, S. G., and Fringer, O. B. (2015). Sediment transport dynamics near a river inflow in a large alpine lake. Limnol. Oceanogr. 60, 1195–1211. doi: 10.1002/lno.10089
Serruya, S. (1974). The mixing patterns of the Jordan River in Lake Kinneret. Limnol. Oceanogr. 19, 175–181. doi: 10.4319/lo.1974.19.2.0175
Silva, T. A., Girardclos, S., Stutenbecker, L., Bakker, M., Costa, A., Schlunegger, F., et al. (2019). The sediment budget and dynamics of a delta-canyon-lobe system over the anthropocene timescale: the Rhone River delta, Lake Geneva (Switzerland/France). Sedimentology 66, 838–858. doi: 10.1111/sed.12519
Soulignac, F., Lemmin, U., Hamze Ziabari, S. M., Wynn, H. K., Graf, B., and Barry, D. A. (2021). Rapid changes in river plume dynamics caused by advected wind-driven coastal upwelling as observed in Lake Geneva. Limnol. Oceanogr. 66, 3116–3133. doi: 10.1002/lno.11864
Stevens, C. L., Hamblin, P. F., Lawrence, G. A., and Boyce, F. M. (1995). River-induced transport in Kootenay Lake. J. Environ. Eng. 121, 830–837. doi: 10.1061/(ASCE)0733-9372(1995)121:11(830)
Suresh, P. R., Srinivasan, K., Sundararajan, T., and Das, S. K. (2008). Reynolds number dependence of plane jet development in the transitional regime. Phys. Fluids 20, 044105. doi: 10.1063/1.2904994
Thomas, J. D., Liu, C. M., Flachskampf, F. A., O'Shea, J. P., Davidoff, R., and Weyman, A. E. (1990). Quantification of jet flow by momentum analysis. An in vitro color Doppler flow study. Circulation 81, 247–259. doi: 10.1161/01.CIR.81.1.247
Udden, J. A. (1914). Mechanical composition of clastic sediments. Geol. Soc. Amer. Bull. 25, 655–744. doi: 10.1130/GSAB-25-655
UNESCO (1983). Algorithms for Computation of Fundamental Properties of Seawater. UNESCO Technical Papers in Marine Sciences. Available online at: https://repository.oceanbestpractices.org/bitstream/handle/11329/109/059832eb.pdf?sequence=1&isAllowed=y (accessed December 15, 2020)
Van der Hegge Zijnen, B. G. (1958). Measurements of the velocity distribution in a plane turbulent jet of air. Appl. Sci. Res. A. 7, 256–276. doi: 10.1007/BF03185052
Warner, J. C., Sherwood, C. R., Signell, R. P., Harris, C. K., and Arango, H. G. (2008). Development of a three-dimensional, regional, coupled wave, current, and sediment-transport model. Comput. Geosci. 34, 1284–1306. doi: 10.1016/j.cageo.2008.02.012
Wells, M., and Nadarajah, P. (2009). The intrusion of density currents into stratified water bodies. Verh. Internat.Verein. Limnol. 30, 731–733. doi: 10.1080/03680770.2009.11902226
Wentworth, C. K. (1922). A scale of grade and class terms for clastic sediments. J. Geol. 30, 377–392. doi: 10.1086/622910
Winterwerp, J. C. (2001). Stratification effects by cohesive and non-cohesive sediment. J. Geophys. Res. Oceans 106, 22559–22574. doi: 10.1029/2000JC000435
Keywords: interflow, river plume, nearfield, interflow velocity, entrainment, Suspended Particulate Matter, sediment transport, unconfined lateral spreading
Citation: Piton V, Soulignac F, Lemmin U, Graf B, Wynn HK, Blanckaert K and Barry DA (2022) Tracing Unconfined Nearfield Spreading of a River Plume Interflow in a Large Lake (Lake Geneva): Hydrodynamics, Suspended Particulate Matter, and Associated Fluxes. Front. Water 4:943242. doi: 10.3389/frwa.2022.943242
Received: 13 May 2022; Accepted: 23 June 2022;
Published: 13 July 2022.
Edited by:
George P. Karatzas, Technical University of Crete, GreeceReviewed by:
Hattori Yasuo, Central Research Institute of Electric Power Industry (CRIEPI), JapanMathew Wells, University of Toronto, Canada
Copyright © 2022 Piton, Soulignac, Lemmin, Graf, Wynn, Blanckaert and Barry. This is an open-access article distributed under the terms of the Creative Commons Attribution License (CC BY). The use, distribution or reproduction in other forums is permitted, provided the original author(s) and the copyright owner(s) are credited and that the original publication in this journal is cited, in accordance with accepted academic practice. No use, distribution or reproduction is permitted which does not comply with these terms.
*Correspondence: Violaine Piton, dmlvbGFpbmUucGl0b25AZXBmbC5jaA==
†Present address: Frédéric Soulignac, Commission Internationale pour la Protection des Eaux du Léman (CIPEL), Nyon, Switzerland