 Hannah P. Menke
 Ying Gao2
 Matthew G. Andrew
- 1Institute of GeoEnergy Engineering, Heriot-Watt University, Edinburgh, United Kingdom
- 2Shell Global Solutions, The Hague, Netherlands
- 3Math2Market GeoDict, Kaiserlautern, Germany
- 4Zeiss Microscopy, Pleasanton, CA, United States
Carbonate rocks have multiscale pore systems that are weakly understood. In this study, we use combined experimental, modeling, and pore space generation methods to tackle the impact of microporosity on the flow properties of Estaillades limestone. First, a nano-core from a microporous grain of Estaillades limestone was scanned using nanotomography (nano-XRM). The information from the nano-XRM scan was then used as input into an object-based pore network generator, on which permeability fields were simulated for a range of porosities, creating a synthetic Kozeny–Carman porosity–permeability relationship targeted for the specific microporous system present in Estaillades. We found a good match between the experimental and simulated Mercury Intrusion Capillary Pressure (MICP) range in the imaged geometry and a good match between the imaged and object-generated permeabilities and MICP. A micro-core of Estaillades was then scanned using X-ray microtomography (μCT), the differential pressure was measured during single-phase flow, and the rock was flooded with doped brine. The contrast between the images was used to assign a porosity to each voxel of connected microporosity. The flow through the pore space was solved using the Stokes–Brinkman (S–B) and Stokes-only solvers, and the differences between the measured permeability and computed permeabilities were evaluated. An agreement was seen between the computed permeability of the Stokes and S–B simulation with the measured permeability. However, the velocity fields with the S–B simulation captured stagnant regions of the pore space that were not present in the Stokes simulations. Additionally, we investigated the implications of including microporosity in the estimation of relative permeability. Nitrogen was experimentally co-injected through the core with doped brine at a 50% fractional flow and imaged to capture the two-phase effective permeability and was compared with the simulated numerical permeability. The Stokes simulation was not able to predict relative permeability with this method due to the major flow paths in the macroporosity being impeded by the injected non-wetting phase. The S–B simulations, however, allowed flow in the microporous regions around these blocked flow paths and were able to achieve a relative permeability prediction that was a reasonable match to the experimental measurement.
Introduction
Experiments combining X-ray microtomography (μCT) with in situ flow are now accepted methods for studying pore-scale processes in real rocks (Blunt et al., 2013; Noiriel, 2015). Pore-scale imaging experiments coupled with simulation are important tools used in industry prediction of geological and petrophysical properties, including porosity and connectivity (Blunt, 2017), mineralogical heterogeneity (Lai et al., 2015), and relative permeability (Armstrong et al., 2016; McClure et al., 2018).
Typically, these simulations are done on the segmented image and are only concerned with the macropore space where the fluid solid boundary is fully resolved and able to be segmented into pore and grain on a voxel-by-voxel basis (Mostaghimi et al., 2013). When the rock grains are solid and the pore throats are large as compared to the image resolution, typically at least three voxels across each throat (~15 microns), a reasonably accurate segmentation is needed to get a realistic estimation of flow through the rock (Al-Ansi et al., 2013; Alyafei et al., 2015). However, not all grains are non-porous, and intra-granular microporosity significantly contributes to the total carbonate microporosity (Choquette and Pray, 1970). Most carbonate rocks have microporous grains (Archie, 1952)—hereafter defined as a grain with interior porosity that is not fully resolvable at the resolution of the imaging apparatus.
The Stokes–Brinkman (S–B) flow simulation technique combines Darcy's law for effective media flow with pore-scale Stokes flow and has been proposed as a solution to this problem, bridging the gap between the fully resolved pore-scale and the partially resolved nanoscale (Beavers and Joseph, 1967; Neale and Nader, 1974), particularly when macro and microporosity are effectively separated in spatial length scale. In many variations of S–B simulations, Darcy's law is solved in the porous rock matrix based on an estimated permeability that is derived from a linear porosity relationship using the relative greyscale between solid grains and pore space (Khalili et al., 2012; Apourvari and Arns, 2016).
Assigning porosity values to partially resolved voxels is well documented (Taud et al., 2005) and has been used in conjunction with Mercury Intrusion Capillary Pressure (MICP) measurements in many core-scale simulations on X-ray tomography images that do not have sufficient resolution to see the structure and connectivity of the pore space needed to make a Navier-Stokes calculation possible. In this case, reconstructed greyscale values are used as an analog for porosity, and the permeability is assigned to each porosity value based on the Kozeny–Carman estimation. This method of assigning a relationship between porosity and permeability, however, is based on the assumption that the porous medium is effectively represented by an even packing of equally sized elliptical beads (Carman, 1937, 1939). Furthermore, this method does not include any influence associated with micropore space connectivity (Soulaine and Tchelepi, 2016). A section of microporosity may have high porosity without necessarily being connected to the macroporosity in any significant way.
To quantify the connected porosity of the pore space, Lin et al. (2016) flooded the rock with highly doped brine at varying concentrations. They found that the highest doped brine gave the best contrast and was able to quantify the distribution of connected and unconnected porosity, as well as the porosity distribution of the connected porosity by thresholding the difference between the dry scan and the doped scan. Any differences between the two images must be associated with a change in saturation of the microporosity, with the magnitude of the change being associated with the fractional change. This is similar to the method used by Ott et al. (2014) to quantify pore-scale behavior during salt precipitation.
The Kozeny–Carman equation related the permeability K to the porosity φ by:
where c is the Kozeny constant and S is the specific surface area based on the solid volume. This relationship can be used to relate local pore structure to macroscopic flow behavior; however, the Kozeny–Carman method is fundamentally flawed when representing more complex pore structures as it assumes a homogeneous pore structure of evenly packed, uniformly sized spherical grains. Furthermore, the Kozeny–Carman method does not incorporate any geological processes that would change the shape and connectivity of the pore space (i.e., compaction and diagenesis). To properly define this relationship at the pore-scale, it is necessary to image the structure of the microporosity and numerically calculate the porosity and permeability relationship from a segmented image which well resolves the pore structure at the nanoscale.
Nanoscale techniques, including FIB-SEM (focused ion beam scanning electron microscopy), helium ion microscopy, and nano X-ray microscopy (nano-XRM), have emerged as technologies capable of resolving this porosity at the resolution of several nanometres for FIB-SEM and nano-XRM (Wargo et al., 2013) down to tens of angstroms for the helium ion (Scipioni et al., 2008; Hlawacek et al., 2014). However, upon imaging at this resolution, it is only possible to see small volumes of rock in the order around 10 × 10 × 10 μm for charged beam instruments and around 65 × 65 × 65 μm for nano-XRM. Thus, it is necessary to either image many different parts of the micropore structure or to find a way of extrapolating these structures synthetically.
Earlier efforts on digital rock analysis extensively used synthetic pore-space generation, defined as digitally creating rock geometries, to examine simple systems at the pore-scale, either digitally as numerical models or by printing them as micromodels for microfluidics (Koplik, 1982; Lenormand et al., 1988; Blunt, 2001). However, as imaging technologies have improved, it has largely supplanted synthetic pore network generation for examining simple geometries. Nevertheless, synthetic techniques do present specific advantages, especially when examining mechanisms behind various processes while controlling the amount of heterogeneity (Bear, 1972; Singh et al., 2017). These synthetic pore spaces can either be constructed physically, usually by glass beads or etchings in glass (e.g., Tohidi et al., 2001; Phenrat et al., 2009; Zuo et al., 2013), or numerically using a pore space generator, using stochastic or object-based techniques, subject to various constraints (e.g., Okabe and Blunt, 2005).
Recently, Andrew (2020) has used a combination of numerical pore space generation and multiscale imaging to investigate the porosity–permeability relationships of shale and sandstones. He found that the (geological) diagenetic processes inherent in the creation of the porosity should dictate how to approach the generation to accurately predict the evolution of permeability. Shales have a porosity defined by authigenic growth within a deformable matrix, making the pore structure significantly more spherical than intergranular pore structures, common in sandstones and carbonates. As such, authigenic organic hosted pore networks can be modeled (to a high level of statistical similarity when compared with imaged pore networks) using a network of (overlapping) spherical pores, while sandstones can be modeled similarly accurately by modeling individual grains as convex polyhedra, with the pore network given by the space between the grains.
The goal of this study is to present a method that combines fluid flow experiments with multiscale imaging of macro- and microporosity and synthetic pore space generation to increase the accuracy of numerical multiphase pore-scale simulations on microporous rocks using S–B simulations.
First, we imaged the microporosity of Estaillades limestone using nano-XRM. We then analyzed this image and generated a synthetic pore geometry, creating a porosity-permeability map specific to this rock type. A core plug of Estaillades Limestone was then imaged using micro-CT, segmented, and using a Stokes–Brinkman using the generated porosity-permeability relationship. The permeability and flow fields of the S–B simulation were then compared to a Stokes-only flow simulation with the same pore space.
We then ran a steady-state flow experiment on the same core in situ using co-injection of N2 and brine. The core was then imaged, and relative permeability was simulated with the GeoDict software (Linden et al., 2014) using an MICP-like simulated injection method. Permeability through the wetting phase (WP) was then simulated using both Stokes and S–B methods, and the relative permeability measured in situ was then compared to these simulation results.
The objective of this paper is to use correlative microscopy with benchmark experiments and modeling to tackle the challenge of incorporating multiscale structural features into flow models of carbonate rocks.
Materials and Methods
Sample Characterization
Estaillades is a limestone quarried at Oppede, France. It was deposited 22 million years ago and composed mostly of calcite (>97%) with a minor quartz component. Estaillades is a medium- to coarse-grained bioclastic grainstone with microporous bioclast grains. The helium porosity is 0.295 and it has a bulk-scale absolute permeability of 1.490 × 10⁻¹² m2 (measured at Weatherford Laboratories, East Grinstead, UK).
Estaillades is a well-connected heterogeneous carbonate. The MICP curve and pore-throat distribution show a clear bimodal population of pore throats (Figure 1). However, only the larger population of throats is accessible to μ-CT imaging, and only contributes around half of the total porosity, with the remainder residing in the microporous bioclasts. In this study, we define macroporosity as those regions divisible into pore and grain during segmentation of the micro-CT images, with all other partial porosity regions being defined as microporosity.
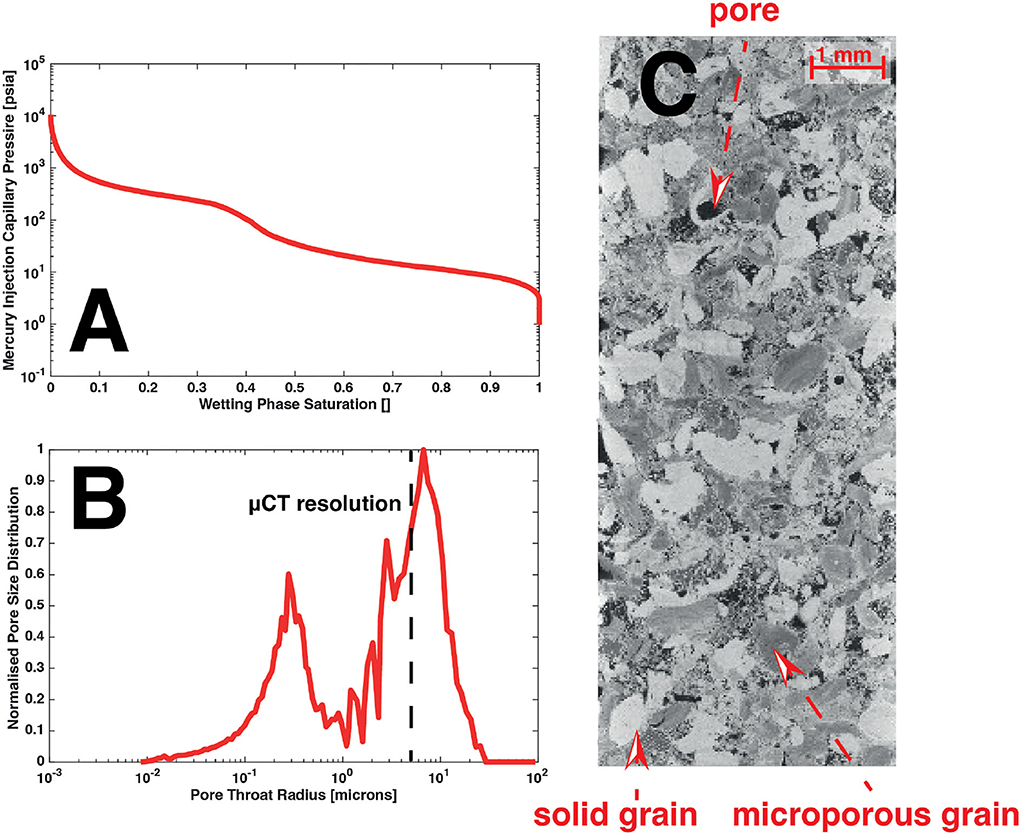
Figure 1. Estaillades limestone MICP curves (A,B) with the μCT resolution shown as a dashed black line. A μCT image (C) with labeled pores, solid, and microporous grains.
Nanoscale Imaging
In this section, we describe the nanoscale imaging techniques, image analysis, synthetic image generation, and numerical modeling used to create a custom porosity–permeability curve for Estaillades' microporosity.
The ZEISS Xradia Ultra 810 nano-XRM was used to image microporous structure down to a voxel size of 32 nm and an effective resolution of 50 nm (Figure 2). The extremely high resolution of this system requires relatively stringent sample size restrictions, with samples having a diameter no larger than 100 μm. Sample preparation of such a small sample is extremely challenging, even in non-heterogeneous samples, and the heterogeneous nature of many geological systems compounds this challenge significantly. To prepare such samples, a complex multi-stage sample preparation protocol was performed using an Oxford gimballed laser micro-machining mill model A-532-DW (www.oxfordlasers.com) (Roth et al., 2016).
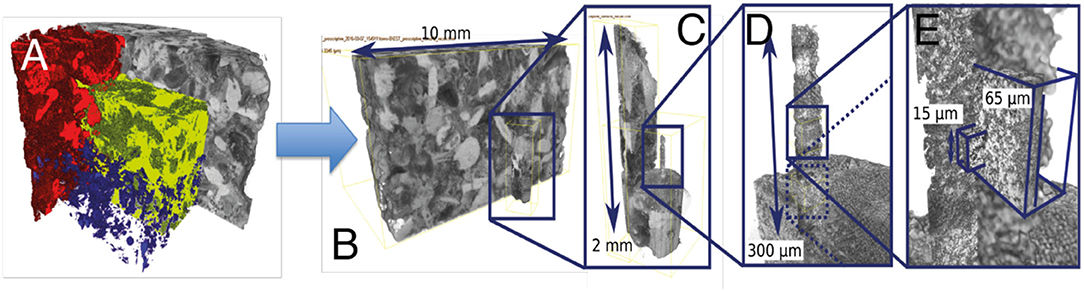
Figure 2. A core of Estaillades is scanned in the μCT (A) and the pores (red), solid grains (blue), and microporous grains (yellow) are identified. A subsection is identified (B) and milled (C). A section of the milled section (D) is then scanned in the nano-XRM (E).
First, a 10 mm diameter mechanically drilled sample of (air-saturated) Estaillades was scanned at a low (10 μm) resolution using a ZEISS XRM-510 μCT (Figure 2A). Fiducial marks made of aluminum tape were placed on the surface of the sample to enable alignment between the laser micro-machining stage and the sample. The low-resolution image was then segmented into microporosity, macroporosity, and solid mineral grains using the ZEISS Zen Intellesis machine learning-based segmentation (Figure 2A). As Estaillades is very simple mineralogically (>97% calcite), the greyscale of each voxel within the microporosity is only associated with the internal porosity of that voxel, ranging from the value observed within the macroporosity (corresponding to a 100% porosity within the voxel) to that observed within the solid grain (corresponding to a 0% porosity). Therefore, the greyscale distribution within the microporous phase corresponds to its internal porosity distribution (Figure 3). A 30 × 30 × 30 μm region of microporosity (corresponding to 3 × 3 × 3 voxels within the macroscopic image) was then identified, which corresponded to the modal porosity within the porosity distribution of the microporosity (porosity of 40%). The offset of this region relative to the sample fiducial marks was then measured, and the region of interest (ROI) aligned underneath the laser axis. A coarse pillar of dimensions 800 μm in diameter and 2 mm in length was extracted from the sample using the laser micro-machining in a top-down fashion (Figure 2B). This sample was then transferred to the end of a dowel pin using an automated sample transfer procedure. This coarse pillar was then imaged within the μCT with a voxel size of 800 nm along its length (Figure 2C). This image was then registered with the macroscopic (10 μm voxel size) image of a 10 mm diameter pillar using a normalized mutual information metric.
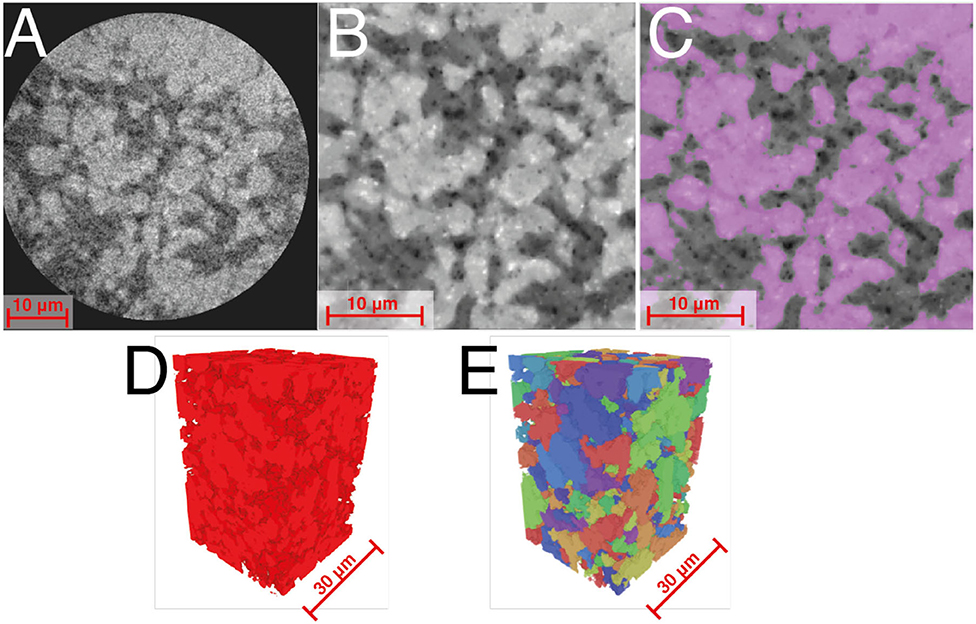
Figure 3. (A) The raw nano-XRM image, (B) cropped and filtered image, (C) grains identified by machine learning, (D) segmented 3D image, and (E) separated grains.
The coarse pillar was then transferred to a rotational stage within the laser system with a rotational axis perpendicular to the laser axis. The sample was then slowly reduced to produce a fine pillar 65 μm in diameter, operating the laser in a lathe-like fashion. This pillar was then imaged along its length within the ZEISS Ultra NanoCT at low resolution (128 nm voxel size) (Figure 2D). This dataset was then registered with the lower resolution dataset of the coarse (800 μm diameter) pillar (and thereby the macroscopic image of the 10 mm diameter core). This multi-scale representation of the microporosity was then inspected to identify the location within the nano-XRM corresponding to the location within the fine pillar of the region of modal (40%) porosity, initially identified from the macroscopic image. This region was then scanned at the final, highest resolution (32 nm voxel size) non-invasively within the fine pillar (Figure 2E). The internal structure of the imaged microporosity consists of subhedral crystals of micrite, consistent with SEM and transmitted light microscopy analysis of this sample (Andrew, 2014).
The resulting reconstructed image was first denoised using an edge-preserving non-local means filter, then segmented using the ZEISS Zen Intellesis machine learning-based segmentation. Such a segmentation technique has been shown in quantitative benchmarks to be significantly more robust when dealing with such noisy and challenging images (Andrew and Hornberger, 2018; Berg et al., 2018). The resulting porosity observed within the image (41%) matched well with the inferred porosity of the 30 μm × 30 × 30 μm region initially identified from the macroscopic 10 μm voxel size image of the 10 mm diameter core. Stokes flow was simulated within this pore geometry using the LIR FlowDict Solver (Linden et al., 2015) (Math2Market GeoDict), giving a nano-porous permeability of 2.63 × 10⁻¹⁵ m2.
MICP was also simulated on this structure using the SatuDict modules of GeoDict (Math2Market), showing a good match in peak position between the microporous peak in the experimental MICP and the simulated MICP through the microporous structure (Figure 4).
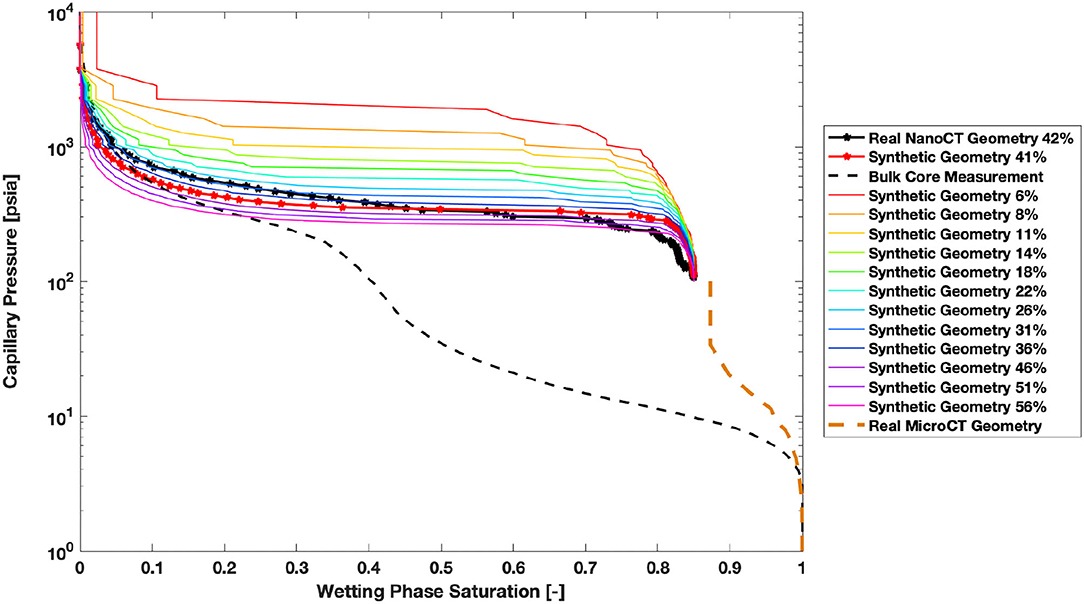
Figure 4. The real nano-XRM (solid black), real micro-CT (solid brown), synthetic (red and rainbow), and bulk core measured (black dashed) MICP curves. Values are normalized to total porosity.
To extend this result to cover the porosity range observed within the microporosity, a suite of similar pore networks was constructed using object-based techniques (Andrew, 2020). The connected micritic matrix was separated into a network of discrete, separated micrite grains using a watershed algorithm (Figure 3E). The volume and equivalent radius distribution of these grains were then measured, showing a unimodal distribution with a peak equivalent grain radius of around 500 nm (Figure 5).
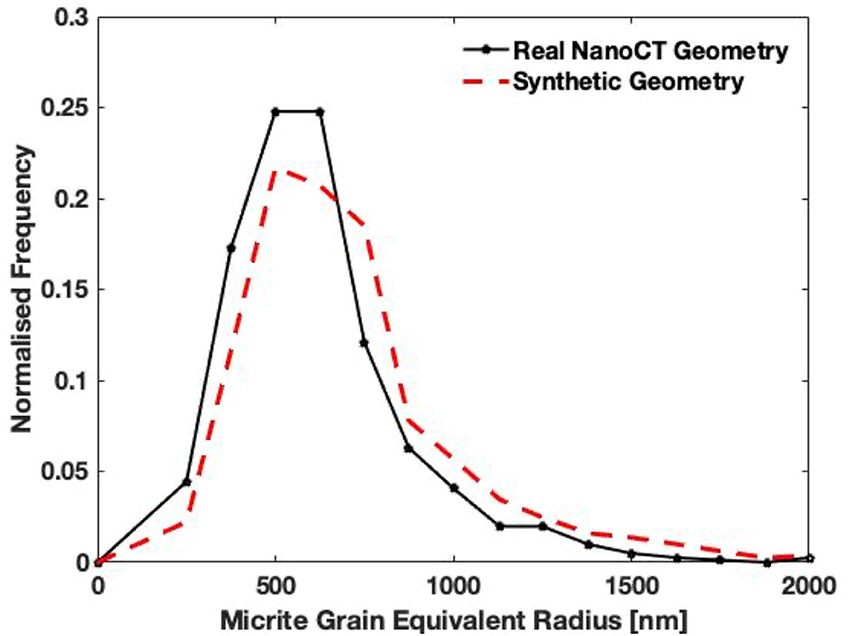
Figure 5. Micrite grain equivalent radii frequency histograms for the real geometry imaged by nano-XRM (black) and the 41% porosity synthetic image (red).
A histogram of the volumes of the separated grains and the porosity and permeability of the nano-XRM image is then used to generate synthetic grains in a pore space (Figure 6A). All geometry creation was performed in the GeoDict software using the GrainGeo module (details of each GeoDict module used in this study can be found in the Numerical methods section). These grains are then dilated successively to create twelve synthetic pore spaces with porosities ranging from 6 to 56 %.
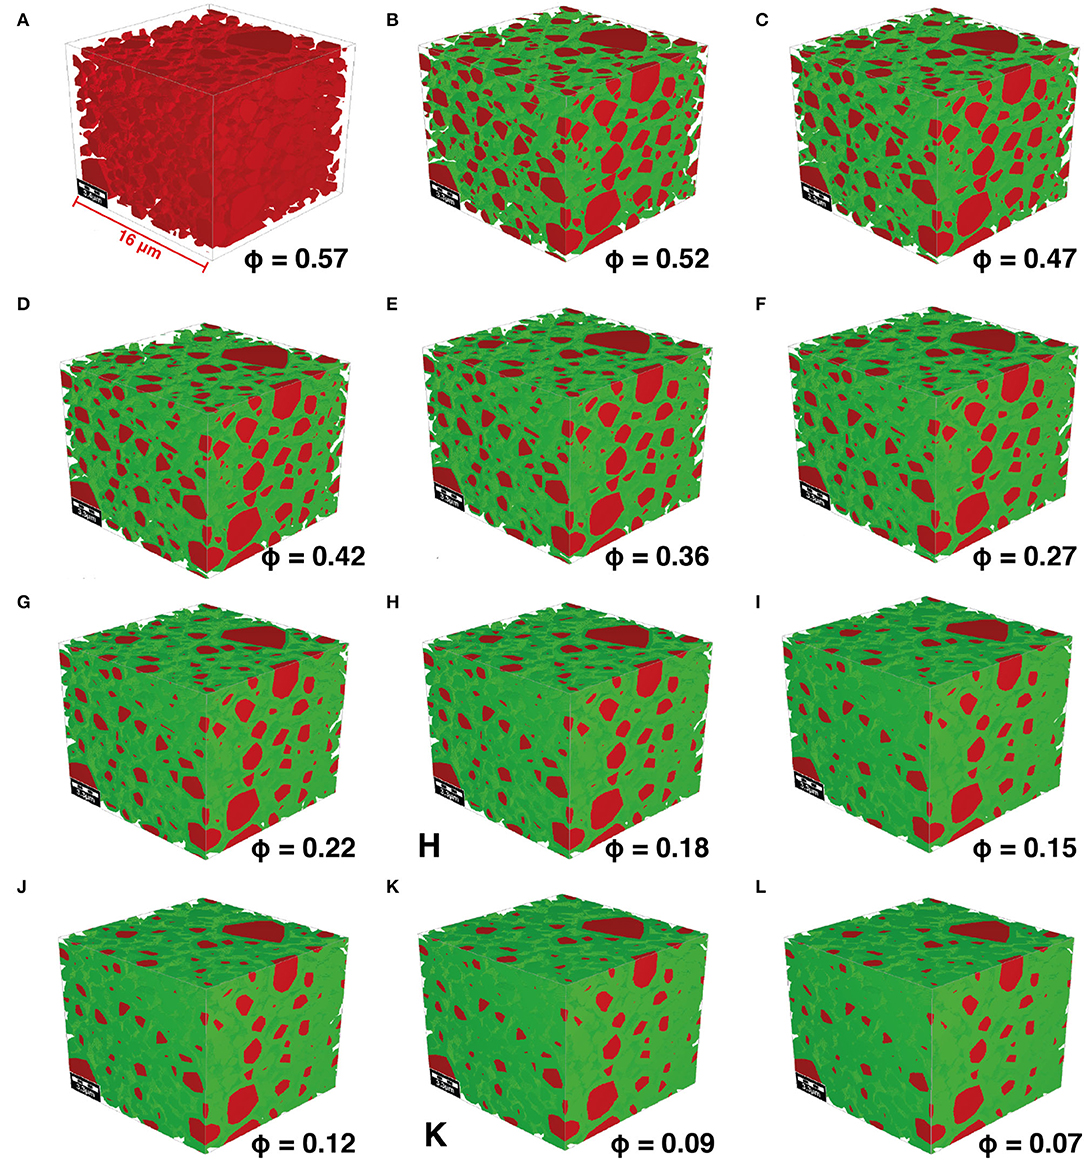
Figure 6. (A) The synthetic pore space generated from the volumetric grain size distribution from the nano-XRM image. (B–L) Dilated grains (green) with preserved grains (red).
A suite of pore geometries was then created by modeling the micritic grains as convex polyhedra, bounded by spheres with a radius distribution given by the radius distribution of the micritic grains. The polyhedra were placed randomly within a 3D volume of size 16 × 16 × 16 μm3 without allowing granular overlap until no more polyhedra could fit within the pore geometry. This structure was then progressively dilated by 1 voxel at a time in 12 total steps, with simulations of both MICP and Stokes-flow permeability performed on each successive pore network until no connected pore network remained (Figures 6B–L), creating a porosity–permeability relationship for the intragranular micritic microporosity in this sample (Figure 7). While the change in porosity between each successive image is low, the permeability change was high due to the closing of pore throats. We found that the porosity–permeability relationship corresponded to a power law fit with an exponent of 3.37, which is reasonable when compared to previously published Kozeny-Carmen estimations for porous rocks (Pape et al., 2000). These geometries were then also simulated with SatuDict and plotted in Figure 4 with a good match to the MICP data. These results highlight the validity of the synthetic geometry creation method in creating accurate porosity structures over a range of porosity values.
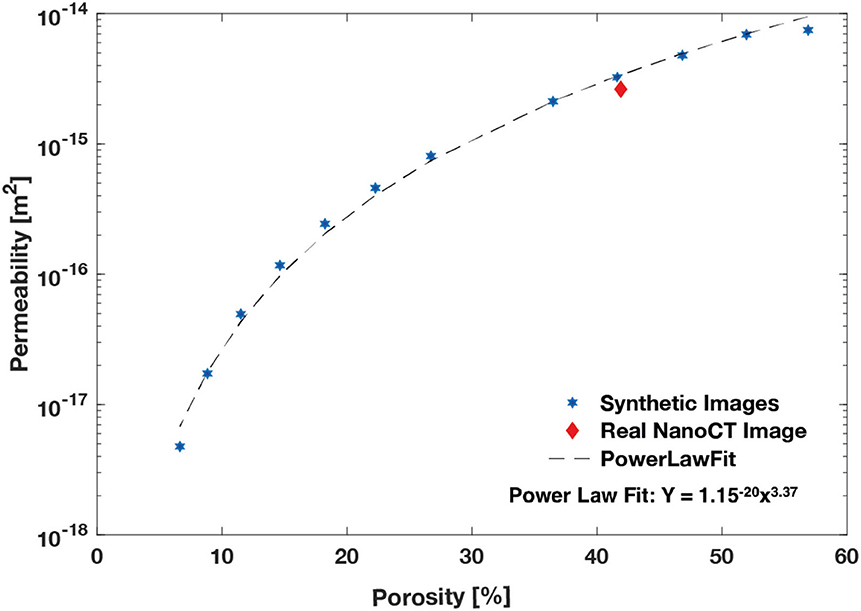
Figure 7. The synthetic porosity–permeability relationship (blue stars), with the power law fit of Y = 10−20 × 3.72 (black dashes) and the real image porosity and permeability value (red diamond).
In addition to nano-XRM imaging, we also imaged several microporous grains using a Zeiss Sigma 300 SEM at a pixel resolution of 20 nm to examine the structural heterogeneity inside a microporous grain (Figure 8). We found that the micritic structures were reasonably regular and consistent with our generated synthetic grain packings. However, it is interesting to note the high-density layers of compacted calcite on the outside of the grains, perhaps from diagenetic dissolution and reprecipitation, which is likely to be lower in permeability than the interior of the grains and could result in an overestimation of the permeability of the microporosity if they are not considered. However, the deionised (DI) doping method presented in the next section largely addresses this error.
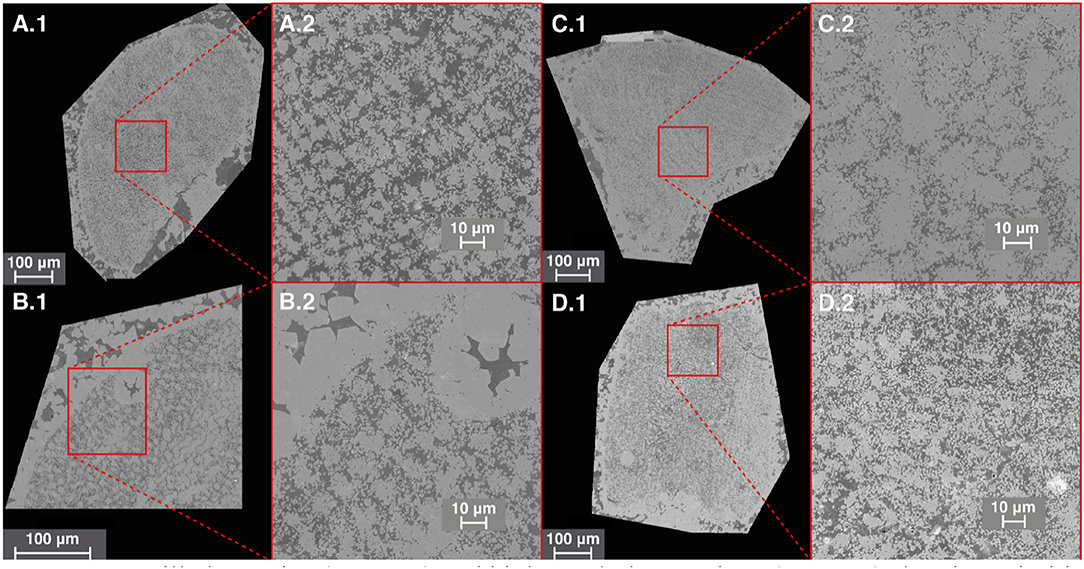
Figure 8. Estaillades grains (A.1–D.1) and high-resolution sections (A.2–D.2) showing micritic calcite with some dense calcite around the grain boundaries.
Pore-Scale Experiments and Imaging
A new 5 mm diameter, 24 mm long core of Estaillades was then drilled from the same 1 m3 block of limestone and was used for the nanoscale study. The core was loaded into a carbon fiber core holder (airborne composites) and then imaged dry (Figure 10). The core was confined using DI water at 10 bar, and two high-pressure syringe (Teledyne Isco) pumps were used to drive highly doped brine of 30 wt.% KI through the core with a constant back pressure of 2 bar (Figure 9) for 1,000 pore volumes and reimaged with the brine inside. The core was washed with DI water for 1,000 pore volumes, and three differential pressure measurements were made using a Keller PD-33X differential pressure transducer with a total range of 300 kPa and an error of 0.01% across the whole range during the flow of 0.5, 0.75, and 1.25 mL min−1 with a 2-bar back pressure (Figure 12). The flow rate was varied to provide a more accurate error measurement.
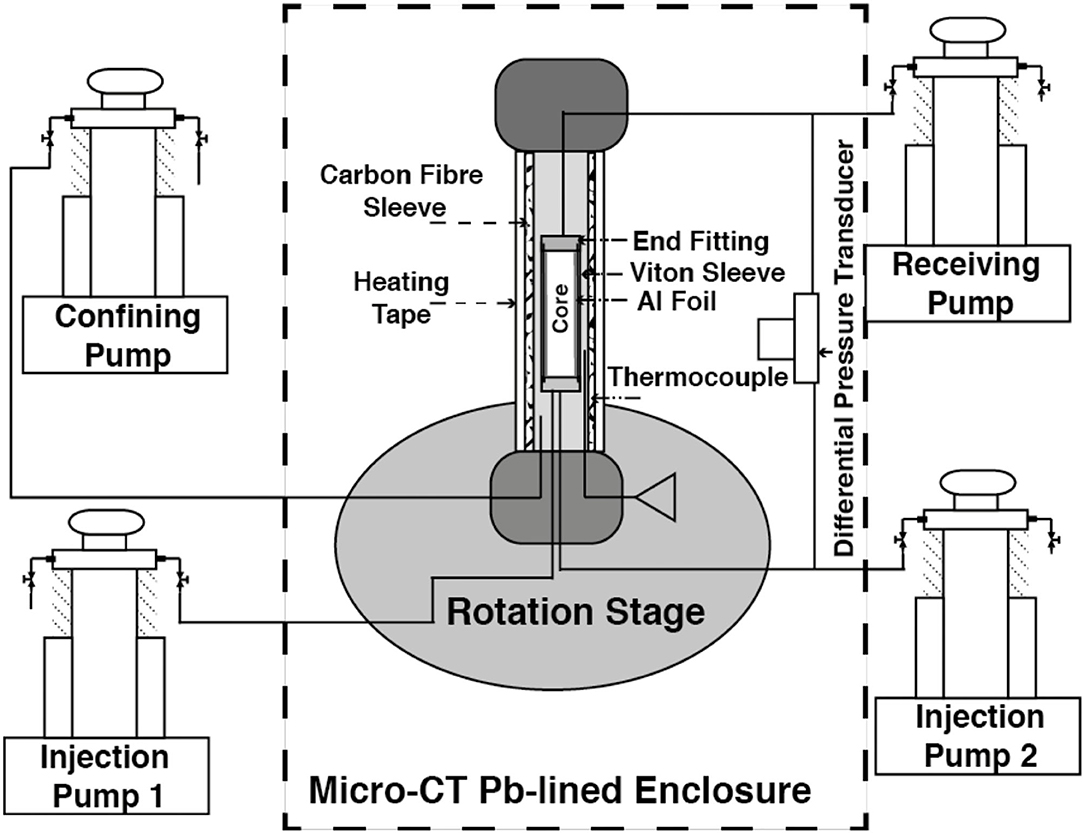
Figure 9. The experimental apparatus consists of the injection, receiving, and confining pumps outside the micro-CT, with a core holder and differential transducer on the rotation stage inside the micro-CT lead-lined enclosure. The core holder is made of carbon fiber and is equipped with thermocouples and heating wrap. The core is wrapped in aluminum foil to minimize gas exsolution and beam hardening artifacts. It is then placed inside a Viton sleeve which is attached to the end fittings supporting the two injection pumps and receiving pump.
The core was then confined at 120 bar, the internal pore pressure raised to 100 bar, and the temperature raised to 50°C. Nitrogen gas (N2) was co-injected through the core with 30 wt.% KI brine and allowed to reach a steady state. The differential pressure was measured, and images of the core were taken in situ. Precise details of this experimental apparatus and method of measuring relative permeability can be found in Gao et al. (2017).
Pore-Scale Image Processing
The Weka3D machine learning segmentation algorithm in Fiji was used to segment the macro pore space (Figure 10A) for both the Stokes and S–B simulations (Figure 10B).
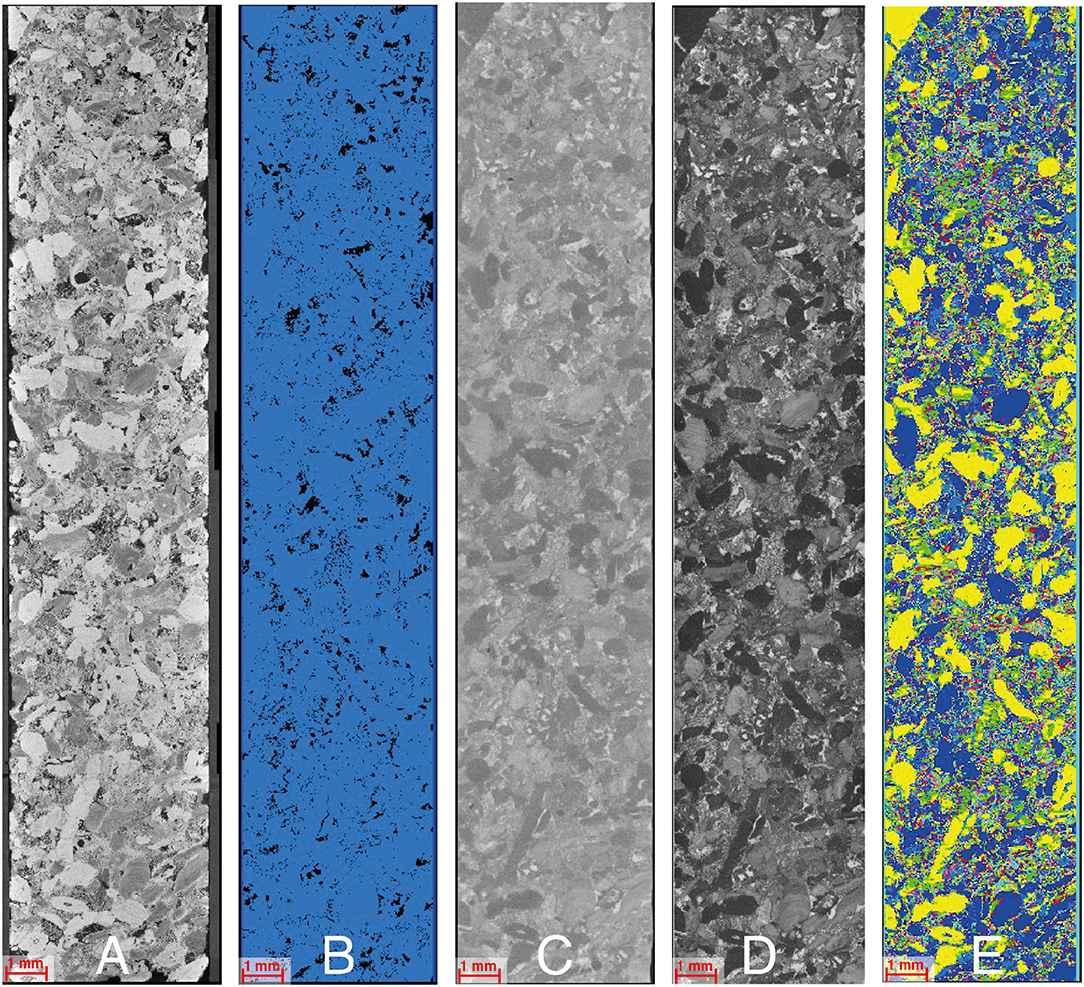
Figure 10. The image processing workflow. The dry scan (A) is segmented using machine learning (B). The doped scan (C) is subtracted from the dry scan to get the difference image (D). The difference image greyscale is then thresholded to 12 different porosity values and grains, and then the pore space of segmented dry scan (B) is masked to create the 14-phase segmentation of solid grains (yellow), 12 types of microporous grains (randomly colored), and pores (light blue) (E).
It is important to note that while segmentation using machine learning can be more accurate, it takes longer to train the algorithm and is more computationally expensive compared to watershed (Arganda-Carreras et al., 2017), and thus computational capacity should be considered prior to the selection of segmentation methods. The images of the rock filled with doped brine were then used to identify the solid grains and unconnected microporosity. The pore space, unconnected microporosity, and solid grains were then masked, and the remaining greyscale values were used to label the connected microporous grains based on porosity using Avizo 9.3 (www.fei.com) (Figure 10D). These porosities were then assigned a permeability based in FlowDict based on the permeability calculated on the synthetic pore spaces (Table 1). A similar workflow was followed for the images of imaged in situ fluid distributions, with the images registered to the dry scan, and then the nitrogen was segmented inside the pore space using a watershed algorithm on the difference image. The non-wetting phase (NWP) saturation can then be calculated based on the number of pore space voxels filled with gas. Figure 11 shows the nitrogen in the pore space visualized as small, medium, and large clusters.
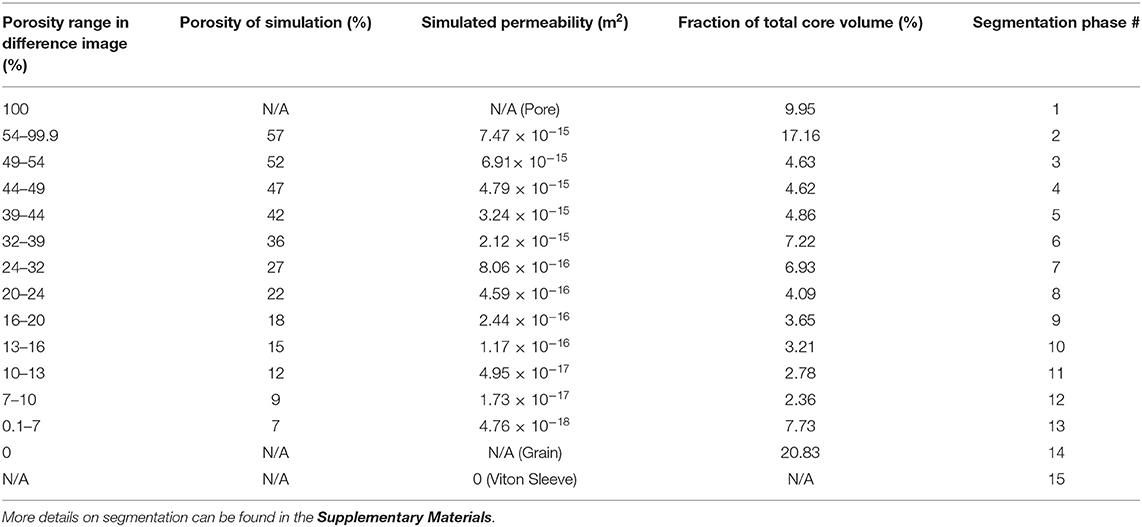
Table 1. Porosity and permeability values for microporosity calculated from numerical simulations on synthetic images.
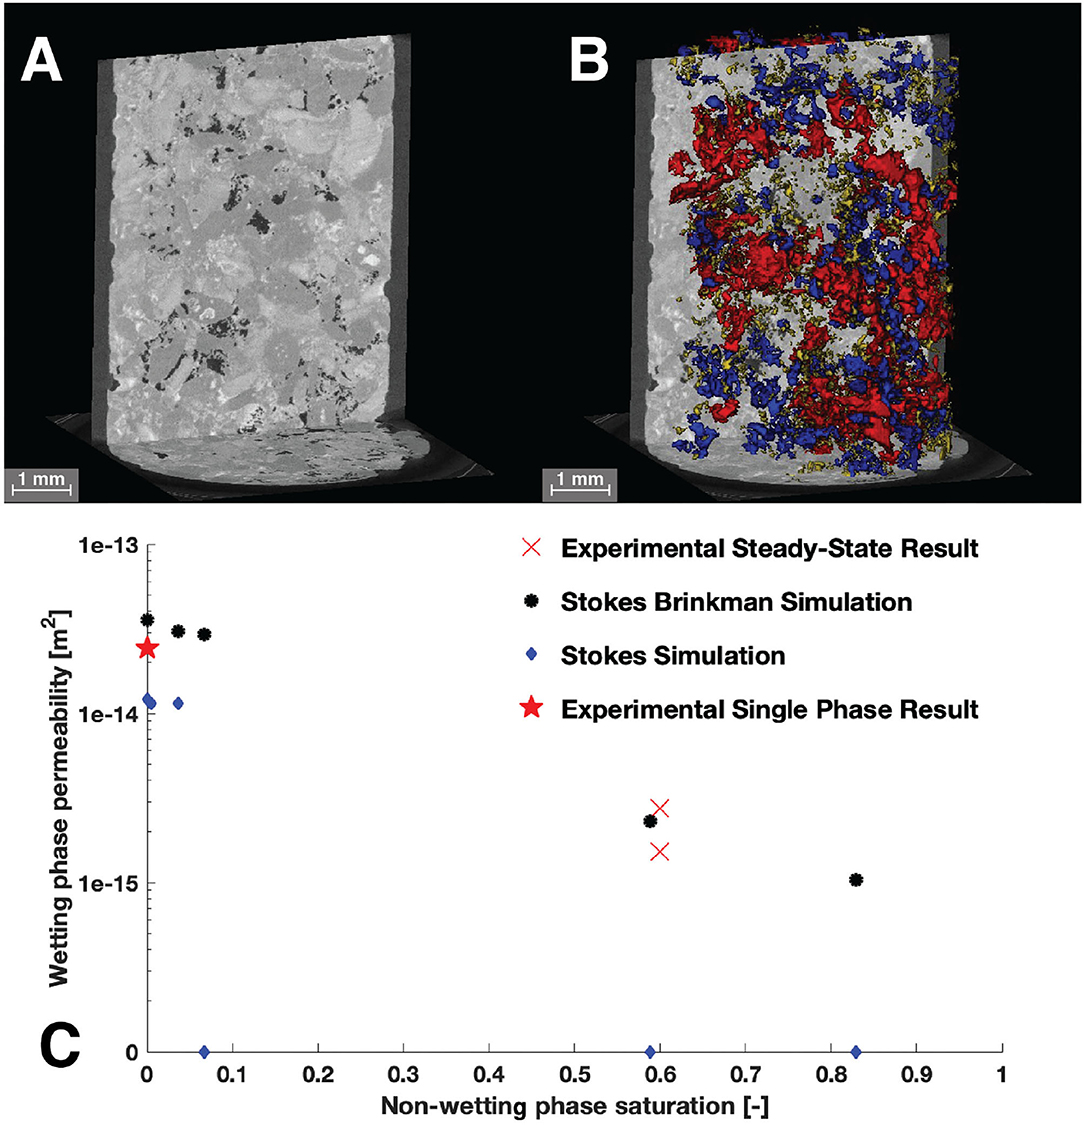
Figure 11. The wet scan (A) taken during co-injection of N2 (black) in the pore space of Estaillades. A 3D rendering of N2 (B) sieved by size with small (yellow), medium (blue), and large (red) disconnected clusters. The WP permeability is plotted as a function of NWP saturation (C) with the Stokes simulation in blue, the S–B in black, the experimental results from the single phase shown as a red star, and the result from steady-state co-injection as a red cross.
Numerical Methods
All simulations in this paper were completed using modules contained in the Math2Market GeoDict. This includes synthetic pore space generation (GrainGeo), S–B flow with an LIR adaptive grid (FlowDict), and synthetic MICP injection (SatuDict).
The GrainGeo module in GeoDict (Linden and Weigmann, 2018) can be used to create digital 3D models of ceramics, sintered materials, grain packings, or digital rocks. The starting point for modeling is user-defined parameters, such as known grain size distribution, pore size distribution, and grain shapes. By changing the parameters of the underlying model, new material structures are designed and their material properties can be studied.
The LIR solver (Linden et al., 2015) in the FlowDict module is a very fast and memory-efficient iterative finite volume method. The solver computes the permeability, as well as velocity and pressure fields, on large 3D images. The LIR solver can be used for the numerical solution of the Stokes, S–B, Navier-Stokes, and Navier-Stokes–Brinkman equations. Here, we use the S–B equation:
where K−1 is the inverse of the permeability tensor, μK−1 is the flow resistivity, p is the pressure, is the fluid flow velocity, and is the force density.
Our 3D images are represented as regular voxel grids, where the number of grid cells grows cubically. The LIR solver uses an adaptive grid, instead of a regular grid, to significantly reduce the number of grid cells. The basis of the adaptive grid is a data structure called LIR-tree (Hilpert and Miller, 2001) that is used for the spatial partitioning of 3D images. The pore space is coarsened in areas with small velocity and pressure variations, while keeping the original resolution near the solid surfaces and in regions where velocity or pressure vary rapidly. Pressure and velocity are discretized on staggered grids and are arranged in such a way that each cell can satisfy the Navier-Stokes–Brinkman equation independently from its neighbor cells.
The pore morphology method (Ahrenholz et al., 2008) is used in SatuDict, and it predicts the distribution of a WP and an NWP inside a porous medium. The method distributes two fluids by using morphological operations rather than solving partial differential equations. Here, we assume a strong water-wet system. For drainage, it can be envisioned that spheres are pushed into the structure and placed in the pore space, where the pore size is greater than a certain radius. The radius is decreased in an iterative process, which corresponds to an increase in capillary pressure. The superposition of all spheres represents the NWP. The pore morphology method achieves this placement of spheres by dilation and erosion processes of the solid phase with the pore space. Additional connectivity checks (Menke et al., 2015) with respect to NWP and WP reservoirs can be used to increase the validity of the distributions, and they allow the introduction of residual phases. The output of the algorithm is a finite sequence of quasi-stationary states. For the relative permeability of the WP, for instance, we solve a single-phase flow inside the WP and treat the interface between WP and NWP as an immobile no-slip interface.
Results and Discussion
Differential pressure measurements were used with Darcy's Law:
where k is permeability (m2), Q is the flow rate (m3 s−1), μ is a viscosity of 1.08 × 10⁻³ (Pa.s−1), L is the length of the core (m), A is the cross-sectional area of the core (m2), and ΔP (Pa) is the differential pressure between the inlet and the outlet of the core. The calculated permeability from the differential pressure measurements was 2.43 × 10⁻¹⁴ m2 (Figure 12A). Each of the large-scale simulations was run for 162 h on 24 3.0 GHz cores. The Stokes simulation used around 80 GB of RAM while the S–B used around 256 GB of RAM. Unfortunately, due to memory constraints, the least permeable phases (1–5) were set to zero permeability in the S–B simulation. The estimated permeability of the Stokes simulation was 1.21 × 10⁻¹⁴ m2, while the S–B simulation was 3.57 × 10⁻¹⁴ m2. These values indicate that the Stokes simulation underestimated permeability by 50%, while the S–B simulation over estimated permeability by 46%.
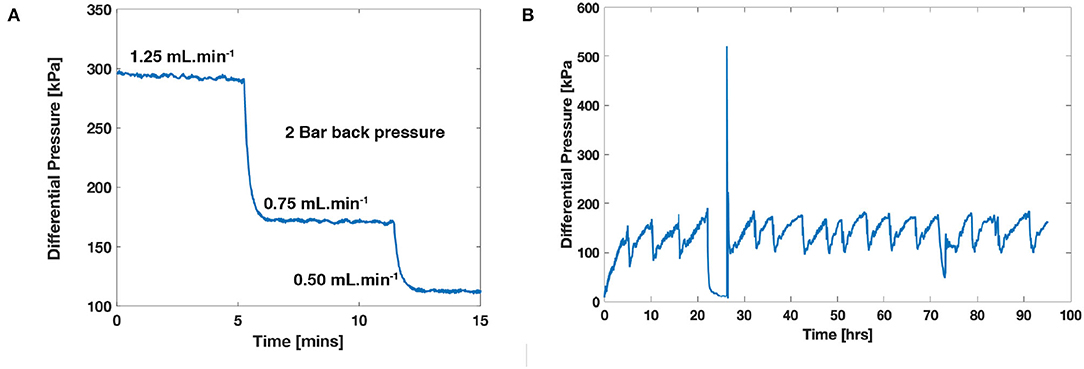
Figure 12. (A) Differential pressure (kPa) measurements across the core at brine flow rates of 1.25, 0.75, and 0.5 mL min−1 with a back pressure of 2 bar. (B) Differential pressure measured during co-injection of N2 and KI brine.
There are three likely sources of error in the Stokes simulations—segmentation error, correlated heterogeneity (Apourvari and Arns, 2016), and unaccounted for the contribution of microporosity in permeability. It is possible that the Weka segmentation needs more training as it is still not able to capture all the small pore throats that contribute to flow. However, we posit that it is more likely the lack of microporous regions that closes off flow in places that would otherwise have hydraulic connection as we see in the high-density calcite crystal layer on the SEM images of exterior of the grains in Figure 8.
In contrast, the S–B simulation overpredicts permeability. We posit this could be due to an overprediction of connectivity in the microporous regions, which is also consistent with Figure 8. While our method of doped brine flooding should minimize misidentification of completely unconnected areas of micro porosity, if there is a minor hydraulic connection the doped brine would still flood the area very slowly and by the time 100 pore volumes have been flooded through the core the micro-porosity would be completely flooded. A possible solution to this problem would be to perform time-resolved imaging during doped-brine flooding, where the slow flooding of the microporosity could be quantified to have some idea of the local connectivity of each microporous voxel.
The velocity fields and probability density functions (PDFs) of velocity are shown in Figure 13. A visual inspection of the velocity fields does not reveal very much difference. However, when we compare the PDFs of velocity in Figure 13C, we see a distinct difference in the peak velocities and tail. In the Stokes simulation, the velocity PDF is a smooth gaussian distribution with a peak centered around 1. However, in the S–B simulation, we see a smaller secondary peak around 1 with the main peak around 10−2 with a long tail. This indicates that in the Stokes simulation, we only capture advective flow, while in the S–B simulation, there is a large amount of slow flow through the micropore space. This result has many applications but is particularly important during contaminant transport for predicting the concentration of contaminants with time. If the slower transport is not incorporated into the model, then the peak and the tail will not be accurately predicted.
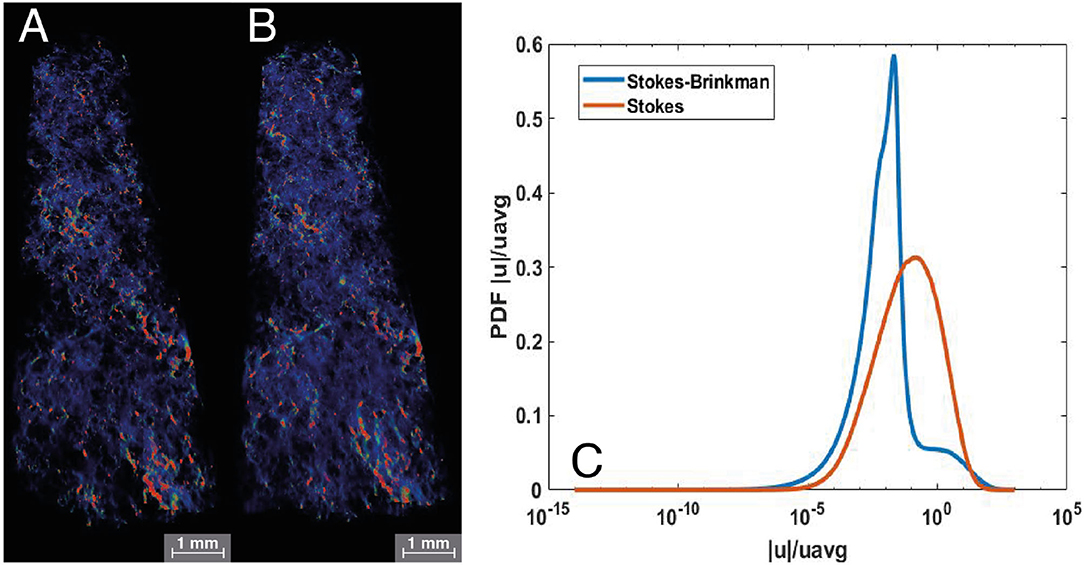
Figure 13. Velocity fields rendered with high velocities in red and low velocities in blue for Stokes (A) and S–B simulations (B). The PDFs of velocity (C) are shown for Stokes (red) and S–B (blue) simulations.
The segmentation technique employed for the macro pore space may also significantly control the simulated velocity PDF (Figure 13C). As discussed in the Methods section and Supporting Information, when a typical watershed segmentation was attempted on this image, the macropore space was unconnected throughout the length of the samples. In previous studies, the watershed has been used to segment the pore space, and the predicted permeability values were far below the ones predicted in this paper. Menke et al., 2015, 2016, 2017 report values ranging from 1.53 × 10⁻¹⁴ to 1.57 × 10⁻¹³ m2. It is likely that pore space remained connected in these cases because while the samples were imaged at approximately the same resolution, they were significantly shorter (and thus overall contained less heterogeneity). However, the watershed segmentation still did not properly segment the small throats, and thus the permeability was predicted to be much lower than would be expected from the experimentally measured permeability of 2.43 × 10⁻¹⁴ m2. For complex pore structures, watershed segmentation will be less accurate than the more sophisticated textural and featural segmentation approaches and should be used with caution.
During co-injection, we measured differential pressure for 95 h. We observed a cyclic perturbation where pressure builds from ~90 to ~180kPa over the course of ~5 h and then suddenly drops back down. These pressures correspond to WP permeabilities fluctuating between 1.52 × 10⁻¹⁵ and 2.74 × 10⁻¹⁵ m2. We imaged the core during flow and observed the NWP saturation to be 0.6 in the macropore space. It is important to note that each 3D scan took around 5 h, and any changes in saturation during this period would be time-averaged. To try and understand why the pressure was building and releasing, we modeled the streamlines through the core using FlowDict (Figure 14). We found that all the flow of NWP is directed through a single small pore throat, about two-thirds of the way through the core. We postulate that this small flow impedance was causing capillary pressure to build and then be released as the local capillary pressure built enough to flow through this small pore throat, a theory supported by the approximately periodic nature of the pressure fluctuations (Reynolds et al., 2017; Spurin et al., 2019). More experiments targeting the investigation of this theory would be an interesting target for future research, however, they are out of the scope of this paper.
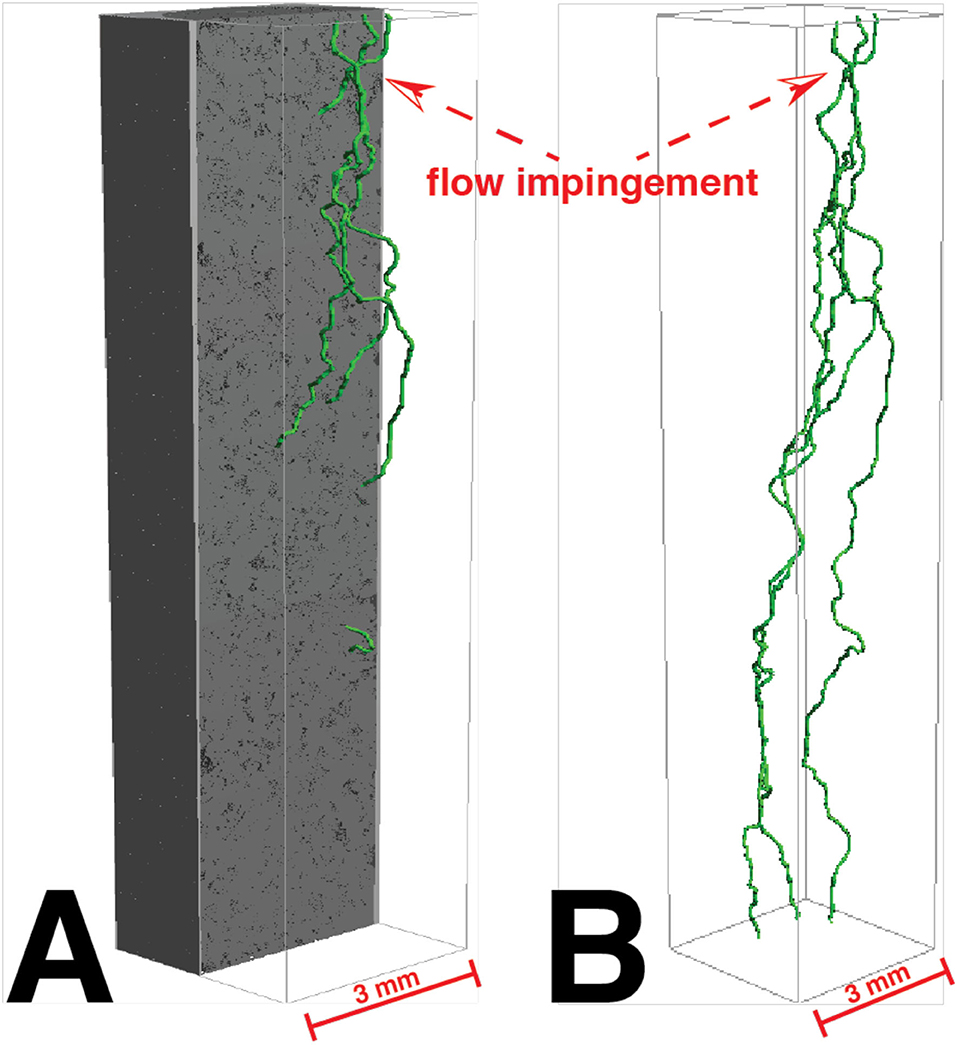
Figure 14. The three widest percolation paths through the core shown in green with the rock shown in gray (A) and the rock transparent (B).
Relative permeability was then simulated by simulating fluid distributions using SatuDict, injecting the NWP into the core from both sides using a maximal inscribed spheres technique on the connected pore network, slowly increasing the saturation from 0 to 1. Microporosity was assumed to be fully saturated. Permeability was calculated by simulating flow through the WP as a single-phase permeability using both the Stokes and S–B methods. We found that initially, the permeability estimation ranged between 1.21 × 10⁻¹⁴ and 1.14 × 10⁻¹⁴ m2 for NWP saturation of 0–0.036, but after this saturation, the NWP completely blocks all connected pathways, and the permeability is predicted as zero. In the S–B simulations, however, we observe that the initial permeabilities are higher than the Stokes flow with values ranging from 3.57 × 10⁻¹⁴ to 2.92 × 10⁻¹⁴ m2 for NWP saturation of 0–0.067. Furthermore, there is a connected flow path for all saturations, and we find that the predicted permeability of 2.30 × 10⁻¹⁵ m2 at a saturation of 0.59 is in reasonable agreement with the experimental measurements.
Conclusion
We have developed a method of using multiscale imaging and experiments to characterize relative permeability in a microporous carbonate, even at high NWP saturations. Intra-granular microporosity in this system was characterized using targeted nano X-ray microscopy, which was then used to generate a suite of synthetic pore geometries hydrodynamically similar to the imaged network. This was used to generate a customized Kozeny–Carman porosity–permeability relationship, which was used to populate a macroscopic porosity map generated from the (macro-scale) X-ray microscopy.
By coupling multi-phase flow simulation with a multi-scale description of flow, we were accurately able to predict relative permeability at a fractional flow of 0.5, where a single-scale simulation failed to capture an effective flow pathway—the WP disconnected in the macropore space, only remaining connected through the microporosity. Such a multiscale approach is particularly powerful when attempting to assess systems with high levels of multiscale structural heterogeneity, such as complex carbonate and shale reservoirs. It also shows that, while these systems can be extremely challenging to characterize, they are tractable by coupling state-of-the-art imaging technologies with stochastic network generation, guided by a geological understanding of the medium in question.
Future work may include the extension of these analyses across the full experimental relative permeability curve, fast tomography imaging to observe dynamic changes in saturation, further (quantitative) assessment, and comparison of micritic structures across several rock types.
Data Availability Statement
The datasets presented in this study can be found in online repositories. The names of the repository/repositories and accession number(s) can be found below: https://www2.bgs.ac.uk/nationalgeosciencedatacentre/citedData/catalogue/0543fe60-8e38-49ba-a8ec-a727e8babd25.html.
Author Contributions
HM conceived the study, did the experiments, and wrote the manuscript. YG did the experiments and reviewed the manuscript. SL did the numerical modeling and reviewed the manuscript. MA did the experiments and upscaling and reviewed the manuscript. All authors contributed to the article and approved the submitted version.
Funding
This research was funded by the Qatar Carbonates and Carbon Storage Research Centre (QCCSRC) and Energi Simulation.
Conflict of Interest
YG was employed by Shell. SL was employed by Math2Market.
MA was employed by Zeiss. The remaining author declares that the research was conducted in the absence of any commercial or financial relationships that could be construed as a potential conflict of interest.
Publisher's Note
All claims expressed in this article are solely those of the authors and do not necessarily represent those of their affiliated organizations, or those of the publisher, the editors and the reviewers. Any product that may be evaluated in this article, or claim that may be made by its manufacturer, is not guaranteed or endorsed by the publisher.
Acknowledgments
We gratefully acknowledge funding from the Qatar Carbonates and Carbon Storage Research Centre (QCCSRC), provided jointly by the Qatar Petroleum, Shell, and the Qatar Science and Technology Park. We thank Prof. Martin Blunt for his support in this research.
Supplementary Material
The Supplementary Material for this article can be found online at: https://www.frontiersin.org/articles/10.3389/frwa.2022.935035/full#supplementary-material
References
Ahrenholz, B., Tölke, J., Lehmann, P., Peters, A., Kaestner, A., Krafczyk, M., et al. (2008). Prediction of capillary hysteresis in a porous material using lattice-Boltzmann methods and comparison to experimental data and a morphological pore network model. Adv. Water Resour. 31, 1151–1173. doi: 10.1016/j.advwatres.2008.03.009
Al-Ansi, N., Gharbi, O., Raeini, A. Q., Yang, J., Iglauer, S., Blunt, M. J., et al. (2013). “March. Influence of micro-computed tomography image resolution on the predictions of petrophysical properties,” in IPTC 2013: International Petroleum Technology Conference (European Association of Geoscientists and Engineers), p. cp−350.
Alyafei, N., Raeini, A. Q., Paluszny, A., and Blunt, M. J. (2015). A sensitivity study of the effect of image resolution on predicted petrophysical properties. Transp. Porous Media 110, 157–169. doi: 10.1007/s11242-015-0563-0
Andrew, M. (2014). Reservoir condition pore scale imaging of multiphase flow using x-ray. Microtomography. JoVE. 25:e52440 doi: 10.3791/52440
Andrew, M., and Hornberger, B. (2018). Benchmarking of machine learning and conventional image segmentation techniques on 3D x-ray microscopy data. Micr. Microanal. 24, 118–119. doi: 10.1017/S1431927618012977
Andrew, M. (2020). Comparing organic-hosted and intergranular pore networks: topography and topology in grains, gaps and bubbles. Geol. Soc. Lond. Spec. Publ. 484, 241–253. doi: 10.1144/SP484.4
Apourvari, S. N., and Arns, C. H. (2016). Image-based relative permeability upscaling from the pore scale. Adv. Water Resour. 95, 161–175. doi: 10.1016/j.advwatres.2015.11.005
Archie, G. E. (1952). Classification of carbonate reservoir rocks and petrophysical considerations. Am. Assoc. Pet. Geol. Bull. 36, 278–298. doi: 10.1306/3D9343F7-16B1-11D7-8645000102C1865D
Arganda-Carreras, I., Kaynig, V., Rueden, C., Eliceiri, K. W., Schindelin, J., Cardona, A., et al. (2017). Trainable weka segmentation: a machine learning tool for microscopy pixel classification. Bioinformatics 33, 2424–2426. doi: 10.1093/bioinformatics/btx180
Armstrong, R. T., McClure, J. E., Berrill, M. A., Rücker, M., Schlüter, S., Berg, S., et al. (2016). Beyond Darcy's law: the role of phase topology and ganglion dynamics for two-fluid flow. Phys. Rev. E 94, 043113. doi: 10.1103/PhysRevE.94.043113
Bear, J. (1972). Dynamics of Fluids in Porous Media, vol 2 (https://www.google.com/search?q=North+Chelmsford&stick=H4sIAAAAAAAAAOPgE-LSz9U3MC4wzi5KVuIEsU0rM5JztbSyk63084vSE_MyqxJLMvPzUDhWGamJKYWliUUlqUXFi1gF_PKLSjIUnDNSc3KL0_KLUnawMu5iZ-JgAAD2DptXYAAAAA&sa=X&ved=2ahUKEwiQtYWCqtf4AhXKmYQIHVNoBHAQmxMoAHoECE8QAg Chelmsford, MA: Courier Corporation).
Beavers, G. S., and Joseph, D. D. (1967). Boundary conditions at a naturally permeable wall. J. Fluid Mech. 30, 197–207. doi: 10.1017/S0022112067001375
Berg, S., Saxena, N., Shaik, M., and Pradhan, C. (2018). Generation of ground truth images to validate micro-CT image-processing pipelines. Leading Edge 37, 412–420. doi: 10.1190/tle37060412.1
Blunt, M. J. (2001). Flow in porous media—pore-network models and multiphase flow. Curr. Opin. Colloid Interface Sci. 6, 197–207. doi: 10.1016/S1359-0294(01)00084-X
Blunt, M. J. (2017). Multiphase Flow in Permeable Media: A Pore-scale Perspective. Cambridge: Cambridge University Press. doi: 10.1017/9781316145098
Blunt, M. J., Bijeljic, B., Dong, H., Gharbi, O., Iglauer, S., Mostaghimi, P., et al. (2013). Pore-scale imaging and modelling. Adv. Water Resour. 51, 197–216. doi: 10.1016/j.advwatres.2012.03.003
Carman, P. C. (1939). Permeability of saturated sands, soils and clays. J. Agric. Sci. 29, 262–273. doi: 10.1017/S0021859600051789
Choquette, P. W., and Pray, L. C. (1970). Geologic nomenclature and classification of porosity in sedimentary carbonates. Am. Assoc. Pet. Geol. Bull, 54, 207–250. doi: 10.1306/5D25C98B-16C1-11D7-8645000102C1865D
Gao, Y., Lin, Q., Bijeljic, B., and Blunt, M. J. (2017). X-ray microtomography of intermittency in multiphase flow at steady state using a differential imaging method. Water Resour. Res., 53, 10274–10292. doi: 10.1002/2017WR021736
Hilpert, M., and Miller, C. T. (2001). Pore-morphology-based simulation of drainage in totally wetting porous media. Adv. Water Resour. 24, 243–255. doi: 10.1016/S0309-1708(00)00056-7
Hlawacek, G., Veligura, V., van Gastel, R., and Poelsema, P. (2014). Helium ion microscopy. J. Vacuum Sci. Technol. B Nanotechnol. Microelectron. Mater. Process. Measure. Phenomena 32, 020801. doi: 10.1116/1.4863676
Khalili, A. D., Yanici, S., Cinar, Y., and Arns, C. H. (2012). “Formation factor for heterogeneous carbonate rocks using multi-scale Xray-CT images,” in SPE Kuwait International Petroleum Conference and Exhibition (OnePetro).
Koplik, J. (1982). Creeping flow in two-dimensional networks. J. Fluid Mech. 119, 219–247. doi: 10.1017/S0022112082001323
Lai, P., Moulton, K., and Krevor, S. (2015). Pore-scale heterogeneity in the mineraldistribution and reactive surface area of porous rocks. Chem. Geol. 411, 260–273. doi: 10.1016/j.chemgeo.2015.07.010
Lenormand, R., Touboul, E., and Zarcone, C. (1988). Numerical models and experiments on immiscible displacements in porous media. J. Fluid Mech. 189, 165–187. doi: 10.1017/S0022112088000953
Lin, Q., Al-Khulaifi, Y., Blunt, M. J., and Bijeljic, B. (2016). Quantification of subresolution porosity in carbonate rocks by applying high-salinity contrast brine using x-ray microtomography differential imaging. Adv. Water Resour. 96, 306–322. doi: 10.1016/j.advwatres.2016.08.002
Linden, S., Cvjetkovic, T., Glatt, E., and Wiegmann, A. (2014). “An integrated approach to compute physical properties of core samples,” in International Symposium of the Society of Core Analysts (Avignon, France). p. 8–11.
Linden, S., Wiegmann, A., and Hagen, H. (2015). The LIR space partitioning system applied to the Stokes equations. Graph. Models 82, 58–66. doi: 10.1016/j.gmod.2015.06.003
Linden, S. C. L., and Weigmann, A. (2018). Specialized Methods for Direct Numerical Simulations in Porous Media. Kaiserslautern, Germany
McClure, J. E., Armstrong, R. T., Berrill, M. A., Schlüter, S., Berg, S., Gray, W. G., et al. (2018). Geometric state function for two-fluid flow in porous media. Phys. Rev. Fluids 3, 084306. doi: 10.1103/PhysRevFluids.3.084306
Menke, H. P., Andrew, M. G., Blunt, M. J., and Bijeljic, B. (2016). Reservoir condition imaging of reactive transport in heterogeneous carbonates using fast synchrotron tomography—effect of initial pore structure and flow conditions. Chem. Geol. 428, 15–26. doi: 10.1016/j.chemgeo.2016.02.030
Menke, H. P., Bijeljic, B., Andrew, M. G., and Blunt, M. J. (2015). Dynamic threedimensional pore-scale imaging of reaction in a carbonate at reservoir conditions. Environ. Sci. Technol. 49, 4407–4414. doi: 10.1021/es505789f
Menke, H. P., Bijeljic, B., and Blunt, M. J. (2017). Dynamic reservoir-condition microtomography of reactive transport in complex carbonates: effect of initial pore structure and initial brine pH. Geochim. Cosmochim. Acta 204, 267–285. doi: 10.1016/j.gca.2017.01.053
Mostaghimi, P., Blunt, M. J., and Bijeljic, B. (2013). Computations of absolute permeability on micro-CT images. Math. Geosci. 45, 103–125. doi: 10.1007/s11004-012-9431-4
Neale, G., and Nader, W. (1974). Practical significance of Brinkman's extension of Darcy's law: coupled parallel flows within a channel and a bounding porous medium. Can. J. Chem. Eng. 52, 475–478. doi: 10.1002/cjce.5450520407
Noiriel, C. (2015). Resolving time-dependent evolution of pore-scale structure, permeability and reactivity using x-ray microtomography. Rev. Mineral. Geochem. 80, 247–285. doi: 10.2138/rmg.2015.80.08
Okabe, H., and Blunt, M. J. (2005). Pore space reconstruction using multiple-point statistics. J. Petrol. Sci. Eng. 46, 121–137. doi: 10.1016/j.petrol.2004.08.002
Ott, H., Andrew, M., Snippe, J., and Blunt, M. J. (2014). Microscale solute transport and precipitation in complex rock during drying. Geophys. Res. Lett. 41, 8369–8376. doi: 10.1002/2014GL062266
Pape, H., Clauser, C., and Iffland, J. (2000). “Variation of permeability with porosity in sandstone diagenesis interpreted with a fractal pore space model,” in Fractals and Dynamic Systems in Geoscience (Birkhäuser, Basel), 603–619.
Phenrat, T., Kim, H. J., Fagerlund, F., Illangasekare, T., Tilton, R. D., Lowry, G. V., et al. (2009). Particle size distribution, concentration, and magnetic attraction affect transport of polymer-modified Fe0 nanoparticles in sand columns. Environ. Sci. Technol. 43, 5079–5085. doi: 10.1021/es900171v
Reynolds, C. A., Menke, H., Andrew, M., Blunt, M. J., and Krevor, S. (2017). Dynamic fluid connectivity during steady-state multiphase flow in a sandstone. Proc. Nat. Acad. Sci. 114, 8187–8192. doi: 10.1073/pnas.1702834114
Roth, S., Hong, Y., Bale, H., Zhao, T., Bhattiprolu, S., Andrew, M., et al. (2016). Fully controlled sampling workflow for multi-scale x-ray imaging of complex reservoir rock samples to be used for digital rock physics. Search Discov. 41840.
Scipioni, L., Stern, L. A., Notte, J., Sijbrandij, S., and Griffin, B. (2008). Helium ion microscope. Adv. Mater. Process. 166, 27.
Singh, K., Scholl, H., Brinkmann, M., Michiel, M. D., Scheel, M., Herminghaus, S., et al. (2017). The role of local instabilities in fluid invasion into permeable media. Sci. Rep., 7, 1–11. doi: 10.1038/s41598-017-00191-y
Soulaine, C., and Tchelepi, H. A. (2016). Micro-continuum approach for pore-scale simulation of subsurface processes. Transp. Porous Media 113, 431–456. doi: 10.1007/s11242-016-0701-3
Spurin, C., Bultreys, T., Bijeljic, B., Blunt, M. J., and Krevor, S. (2019). Mechanisms controlling fluid breakup and reconnection during two-phase flow in porous media. Phys. Rev. E 100, 043115. doi: 10.1103/PhysRevE.100.043115
Taud, H., Martinez-Angeles, R., Parrot, J. F., and Hernandez-Escobedo, L. (2005). Porosity estimation method by x-ray computed tomography. J. Petrol. Sci. Eng. 47, 209–217. doi: 10.1016/j.petrol.2005.03.009
Tohidi, B., Anderson, R., Clennell, M. B., Burgass, R. W., and Biderkab, A. B. (2001). Visual observation of gas-hydrate formation and dissociation in synthetic porous media by means of glass micromodels. Geology 29, 867–870. doi: 10.1130/0091-7613(2001)029<0867:VOOGHF>2.0.CO;2
Wargo, E. A., Kotaka, T., Tabuchi, Y., and Kumbur, E. C. (2013). Comparison of focused ion beam versus nano-scale x-ray computed tomography for resolving 3-D microstructures of porous fuel cell materials. J. Power Sour. 241, 608–618. doi: 10.1016/j.jpowsour.2013.04.153
Keywords: permeability, multi-scale imaging, Darcy-Stokes–Brinkman equations, Kozeny–Carman, micro-CT, nano-CT
Citation: Menke HP, Gao Y, Linden S and Andrew MG (2022) Using Nano-XRM and High-Contrast Imaging to Inform Micro-Porosity Permeability During Stokes–Brinkman Single and Two-Phase Flow Simulations on Micro-CT Images. Front. Water 4:935035. doi: 10.3389/frwa.2022.935035
Received: 04 May 2022; Accepted: 15 June 2022;
Published: 20 July 2022.
Edited by:
Katherine A. James, University of Colorado Anschutz Medical Campus, United StatesReviewed by:
Lauren E. Beckingham, Auburn University, United StatesVarvara Sygouni, University of Patras, Greece
Copyright © 2022 Menke, Gao, Linden and Andrew. This is an open-access article distributed under the terms of the Creative Commons Attribution License (CC BY). The use, distribution or reproduction in other forums is permitted, provided the original author(s) and the copyright owner(s) are credited and that the original publication in this journal is cited, in accordance with accepted academic practice. No use, distribution or reproduction is permitted which does not comply with these terms.
*Correspondence: Hannah P. Menke, aC5tZW5rZUBody5hYy51aw==