 Kevin C. Nevorski
 Amy M. Marcarelli
- Department of Biological Sciences, Michigan Technological University, Houghton, MI, United States
Rates of nitrogen (N) cycling processes like denitrification and dinitrogen (N2) fixation, which together are the primary contributors to N2 flux rates from surface waters, may change at different time scales from seasons to weeks to days. Yet, we know little about the magnitude, mechanisms or drivers of these temporal changes, especially at shorter daily and weekly timescales. Quantifying variation in rates and drivers across temporal scales is essential to understand how nutrient cycling processes operate in aquatic ecosystems and predict how they may respond to shifting seasonal dynamics caused by global change (i.e., earlier snowmelt and extreme weather events). This study quantified denitrification and N2 fixation rates seasonally and daily in a northern temperate river, and explored how environmental conditions such as discharge, light, and N and phosphorus (P) concentrations were related to that variation at different time scales. We measured denitrification and N2 fixation rates on biweekly and daily intervals at a single 20-m long sampling reach in the Pilgrim River in Michigan's Upper Peninsula from May 2017 through May 2019. We found high rates of daily change (difference in rate from one day to the next) for both processes in all seasons (maximum daily change 5,690 μg N/m2/h for denitrification and 38 μg N/m2/h for N2 fixation). No detectable differences in rates among seasons were detected using Multiple Response Permutation Procedure (MRPP). Day-to-day variation did not change before and after elevated discharge events, including a 1,000-year flood that occurred in June 2018. Partial least squares (PLS) regression identified total dissolved N, dissolved organic N, and ammonium as important predictors of denitrification and N2 fixation, but explained only 15–28% of the variation in all measured rates. The unexpectedly high daily variation and lack of seasonal difference in rates found in this study demonstrate the need to use caution when studying these processes and/or extrapolating rates across time scales, as discrete and infrequent measurements may be misleading.
Introduction
Denitrification and N2 fixation are N transformation processes which can both control and be controlled by environmental factors (Vitousek et al., 2002; Seitzinger et al., 2006). Together with anammox, N2 fixation and denitrification are the primary biological processes that control N2 flux from ecosystems (Fox et al., 2014; Nifong et al., 2020). Denitrification is a form of anaerobic respiration in which microbes break down organic carbon (C) for energy and use nitrate (NO) in the place of oxygen (O2) as an electron acceptor, so supply of organic C and NO are important limitations on denitrification rates (Wall et al., 2005). Along with the required reactant availability, environmental factors including oxygen concentration and temperature can alter denitrification rates. Biological N2 fixation is the microbially-mediated conversion of N2 gas into ammonium (NH); it is an energetically expensive process so high availability of NH and/or other forms of dissolved inorganic N (DIN) may cause microbes to reduce the process rate to conserve energy (Burris and Roberts, 1993; Bandyopadhyay et al., 2013). Light may be especially important for controlling N2 fixation rates in shallow aquatic ecosystems like streams, where it is often carried out by cyanobacteria who obtain their energy via photosynthesis (Burris and Roberts, 1993; Scott and Marcarelli, 2012). Light intensity along with these other factors vary through time, and therefore they may lead to temporal variation in rates of both of these N transformation processes in aquatic ecosystems. Yet, the mechanisms by which environmental factors affect rates of denitrification and N2 fixation may differ depending on the time scale.
In streams and rivers in temperate climate zones, seasonal changes in denitrification and N2 fixation rates in response to changes in environmental conditions may be gradual over the course of days to weeks, caused by the abundance and/or activity of microbes increasing or decreasing, or the identity of the microbes within the community changing. Environmental characteristics that show strong seasonal changes in temperate streams and rivers include nutrient availability, temperature, and light availability (Coble et al., 2019). Low biotic uptake rates in winter can lead to increased inorganic N concentrations in temperate forested streams (Stottlemyer and Toczydlowski, 1999a,b) which could provide reactants for denitrification and reduce rates of N2 fixation. Temperate forests have large inputs of allochthonous organic matter during the fall and high dissolved organic C (DOC) flux during snowmelt (Stottlemyer and Toczydlowski, 1999a), either of which could provide a C source for denitrifying bacteria. Discharge varies seasonally corresponding to rainy seasons or snowmelt, which leads to predictable patterns of disturbance that can move, scour and mobilize riverbed substrates, disturbing microbial communities, and the microenvironments of these communities, which control nutrient cycling processes (O'Connor et al., 2012). Seasonal changes in discharge can also alter nutrient concentrations both by altering patterns of nutrient delivery and via dilution (Meyer and Likens, 1979; Horner et al., 1990; Stottlemyer and Toczydlowski, 1999a). Denitrification and N2 fixing microbial communities can both be sensitive to seasonal temperature changes, with N2-fixing microbes often preferring warmer temperatures (Scott and Marcarelli, 2012), and denitrification activity decreasing during periods with colder temperatures such as in the winter (Christensen et al., 1990; Kim et al., 2006). Light also varies seasonally, especially in forested streams where canopy cover will shade streams differently depending on the season and vegetation type (Roberts and Mulholland, 2007; Bowes et al., 2012). Increased light availability in spring and fall due to low canopy cover can lead to higher rates of in-stream nutrient uptake due to increases in primary productivity (Roberts and Mulholland, 2007).
Environmental factors in temperate streams can also shift much more rapidly over hours to days, which could instead affect rates through enzymatic regulation (Grimm, 1987; Marcarelli and Wurtsbaugh, 2006; Marcarelli et al., 2008). N cycling rates can both increase and decrease over the course of hours with factors such as temperature or substrate availability affecting enzyme activity (Grimm, 1987; Marcarelli and Wurtsbaugh, 2006). Temperature variation can occur on an hourly scale, and the enzymes and microbes facilitating N cycling processes may have reduced activity at cold temperatures (Yvon-Durocher et al., 2010; Boulêtreau et al., 2012). Also, changes in light can alter N2 fixation rates by cyanobacteria in some ecosystems on a diel cycle because it is tightly coupled with photosynthesis (Howarth et al., 1988; Grimm and Petrone, 1997). Nutrient concentrations can rapidly change due to storm runoff, which could also alter N process rates. Because N2 fixation is so energy intensive, enzymes can be rapidly deregulated to save energy following an influx of DIN (Howarth et al., 1988; Grimm and Fisher, 1989; Grimm and Petrone, 1997). But, the distinction between community or enzymatic shifts can be complicated because some environmental factors such as temperature and light vary at multiple time scales. For example, hydrological disturbances such as flooding caused by storms are overlain on seasonal patterns created by snowmelt and rainfall, and may therefore alter biogeochemical process rates through a mix of shorter-term enzymatic changes and longer-term community shifts (Grimm and Fisher, 1989). Storm-driven surface runoff can carry nutrients (Meyer and Likens, 1979; Horner et al., 1990; Stottlemyer and Toczydlowski, 1999a), change water temperature, and create short-term increases in water velocity and benthic disturbance (O'Connor et al., 2012), all of which may act independently and in concert to create variation in process rates.
Understanding relationships between N cycling rates and different environmental drivers that vary across time scales may provide insight into how climate change will affect these processes in the future. Climate change can lead to temperature, stream flow, and growing season changes (Barnett et al., 2005; Backlund et al., 2008; Christiansen et al., 2011), all environmental characteristics which may be influential to denitrification and N2 fixation rates. Storms are becoming separated by longer periods of drought, but overall higher rainfall can occur driven by more intense storm events (Mathbout et al., 2018). It is also not well-understood how resistant and resilient rates of N transformations are to hydrologic disturbances, which is important in the face of ongoing climate change. Resistance and recovery (or resilience) are concepts used throughout ecological studies, including studies on the impact of hydrological disturbances, anthropogenic disturbances, and climate change (Holling, 1973; Bahadur et al., 2013; Pope et al., 2014; Reisinger et al., 2017). Resistance describes how much the structure and processes of an ecosystem change in response to disturbances of different magnitudes, while recovery describes how quickly the ecosystem returns to the same structure and/or function after a disturbance event (Hershkovitz and Gasith, 2013; Reisinger et al., 2017). Initial declines in process rates following a hydrologic disturbance may be rapid; however, recovery may be slower if the microbial community was altered or reduced in biomass rather than enzymatic downregulation. Understanding how large hydrological disturbances affect denitrification and N2 fixation can provide insight into how they will be affected by changing climactic conditions.
The complexity of seasonal vs. shorter-term environmental changes coupled with different mechanisms of microbial responses that lead to changes in rates makes it difficult to decipher how and why N cycle processes vary. The objectives of this study were to characterize how denitrification and N2 fixation rates vary over seasonal, weekly, and daily time scales in a temperate forested river in Michigan's Upper Peninsula. This study was designed to address the following questions: (1) How do denitrification and N2 fixation rates vary seasonally? We hypothesized that rates would differ among seasons due to changes in the environmental conditions that directly and indirectly control process rates. (2) How do denitrification and N2 fixation rates vary daily and in their response to hydrological disturbances? We hypothesized low day to day variation in process rates; however, after large hydrological events (i.e., flooding caused by storms or snowmelt), rates would decline due to disturbance and changes in environmental conditions with prolonged recovery periods as the microbial communities recover after disturbance. (3) Which environmental factors are related to variations in denitrification and N2 fixation rates? We hypothesized seasonal drivers including light and temperature would also be drivers of these rates as we expected large differences in rates between seasons. We addressed these questions by quantifying these processes in relation to changes in environmental conditions at daily and seasonal time intervals over 2 years.
Materials and Methods
Study Site and Sampling Design
Sampling occurred in a single 20 m-long reach on the main branch of the Pilgrim River (47.10138° north, 88.51750° west; Figure 1). The Pilgrim River and its 4 tributaries stretch 34.9 km, draining a 52 km2 watershed located in Houghton County in the Upper Peninsula of Michigan. The Pilgrim River watershed is 58% forested, 25% open space, 12% wetland, 4% developed, and 1% lakes/ponds and has a base discharge between 0.5 and 0.8 m3/s (DEQ, 2012). At the study reach, the river is ~8 m wide with a maximum depth of ~2 m. Ice ~0.5 m thick covers the river from December to April, with high discharge from snow melt occurring in late April or early May (Figure 2). The river substrate in the study reach consisted of ~2/3 sand cover and 1/3 patches of large cobbles.
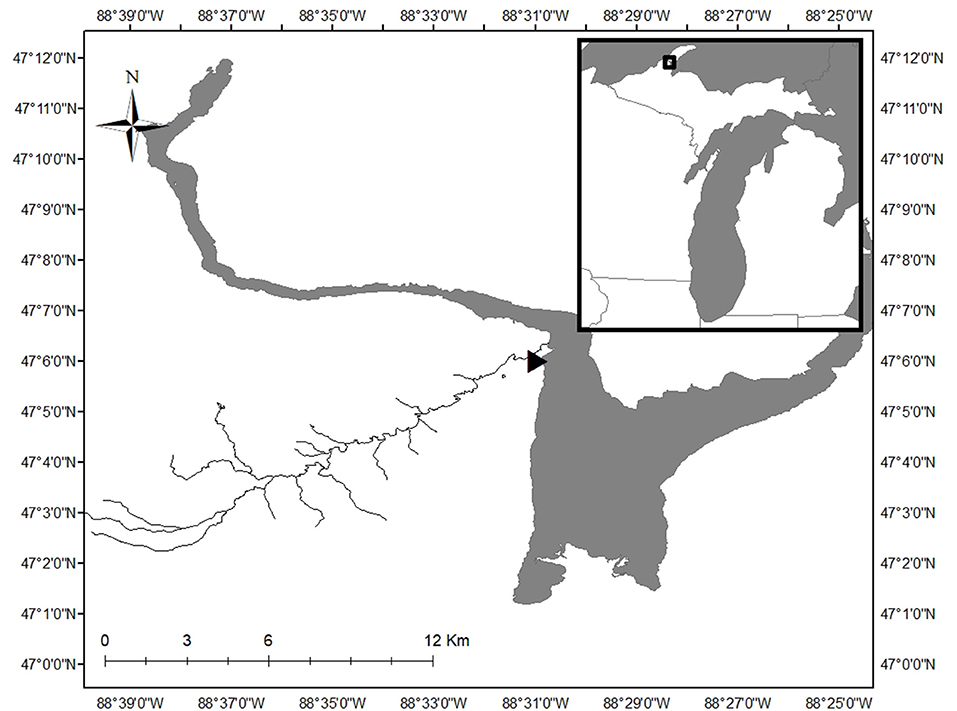
Figure 1. The 20-m long study reach (location indicated by triangle) was located on the Pilgrim River on the Upper Peninsula of Michigan, USA. The inset shows the location of the study area within the state of Michigan. Map of Pilgrim River derived from Hydrography Lines_(v17a) shapefile from State of Michigan GIS Open data (https://gis-michigan.opendata.arcgis.com/).
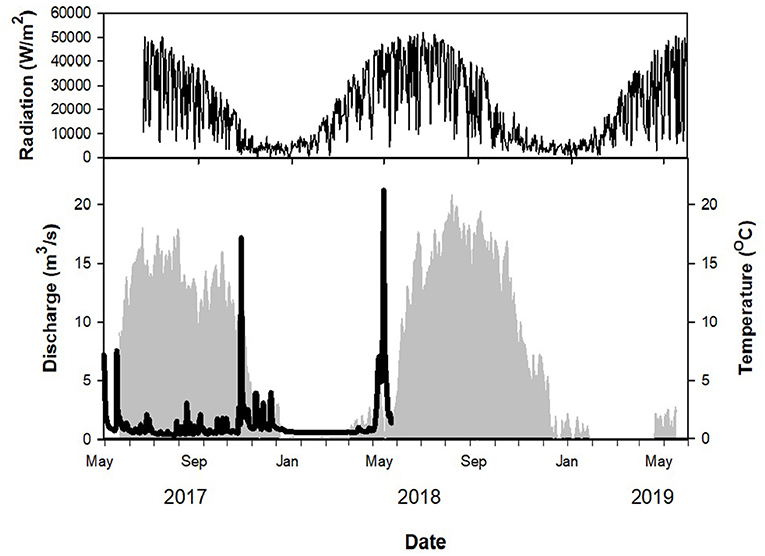
Figure 2. Continuous discharge (thick black line, bottom pane), water temperature (light gray shading, bottom pane) and photosynthetically active radiation (PAR; thin black line, top pane) over course of sampling period. Discharge measurements do not span entire sampling period because the USGS-installed gauge was washed away during a 1,000-year flood on 18–19 June 2018.
Sampling occurred every 2–6 weeks year-round between May 2017 and May 2019 except for N2 fixation, which was not sampled from November 2017 to April 2018. Additionally, once per season sampling occurred every day over a 1 to 2-week period. This nested design allowed us to measure both seasonal and daily variation in rates, as well as calculate recovery when disturbances occurred. During certain time periods, some sampling dates were skipped (Table 1) due to unsafe conditions such as extreme cold, storms, and high discharge. For this study, seasonality was determined using a combination of canopy cover, temperature, and discharge rather than calendar date, as the Upper Peninsula of Michigan experiences an extended winter period with substantial snowpack and short, rapidly changing spring and fall seasons (Coble et al., 2019; Meingast et al., 2020). Spring was determined to start when the river surface was no longer covered by ice and discharge was high due to snow melt, around late April or early May. Spring continued until water temperature stopped consistently rising and there was a full riparian tree canopy, usually early June. Summer continued while water temperature remained constant, and leaves were green. Fall started when water temperature began to decrease and leaves began to change color, usually early September. Winter started when the river was fully covered by ice, usually in late December. This classification scheme was applied based on each year of observational data, such that the season start or end dates could vary among the years of our study based on conditions in that year.
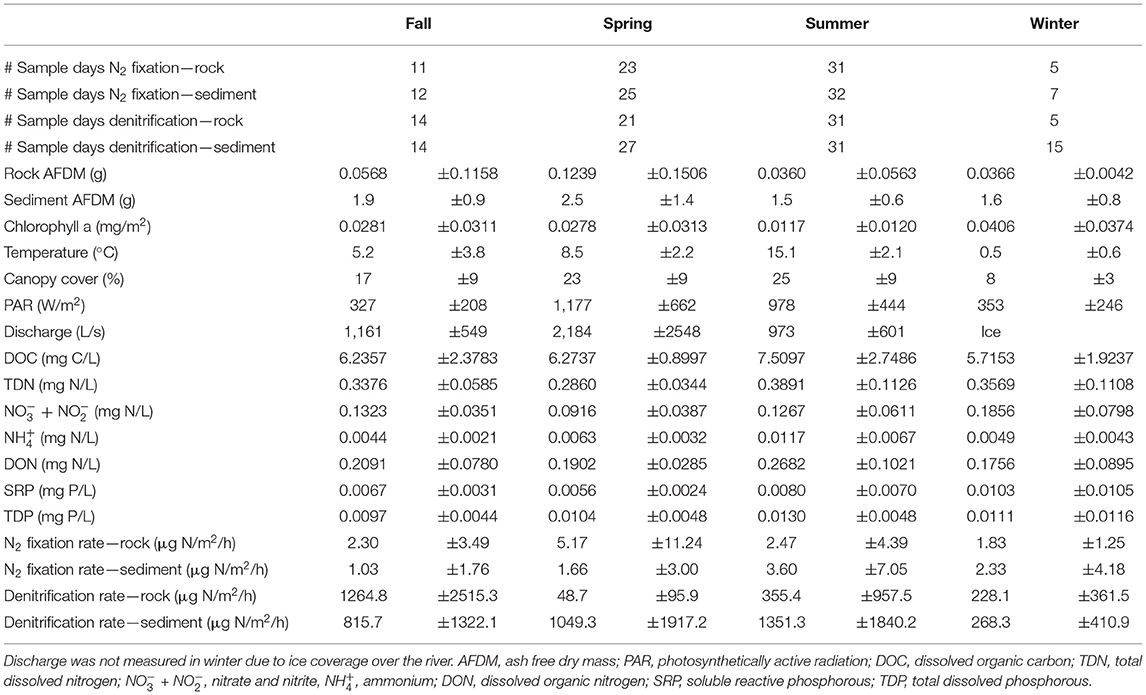
Table 1. Sampling frequency and study site characteristics (mean ± standard deviation) for all variables measured during each season throughout the sampling period.
Sampling Methods
Denitrification and N2 fixation rates were measured in sediment and on rock substrates using acetylene block and acetylene reduction assay techniques as described by Dodds et al. (2017) and Eberhard et al. (2018). Sediment and rock were measured because these were the predominant substrates found in the river. To measure denitrification and N2 fixation on each date, 200 mL sediment cores or enough rocks to cover ~0.0045 m2 surface area were collected from < 1 m deep water and placed in chambers (pint glass mason jars with lids drilled to fit 13 × 20 mm septa, but 2-L polycarbonate food storage containers were used for rock incubations prior to September 2017). Chambers were filled with stream water to remove all air and sealed. Blank chambers for sediment were filled with stream water while blanks for rocks contained rocks from outside the stream and stream water. This allowed us to account for chamber effects such as gas leakage or processes occurring in the water column. Blank chambers also confirmed that there was minimal denitrification or nitrogen fixation activity in the water column of this river, which justifies the focus on benthic substrate as the main locations for these processes.
Acetylene reduction assays were used to quantify rates of N2 fixation by introducing acetylene gas to a chamber. Nitrogenase, the enzyme that fixes N2, will also convert acetylene to ethylene if it is present. We measured the change in ethylene concentration to estimate the amount of N that could have been fixed (Capone, 1993). Water temperature was measured and a 20% headspace (v/v) of acetylene gas was introduced to each filled and sealed chamber. A 9 mL gas sample was removed from each chamber before incubating in the stream for 1–3 h, after which a final 9 mL gas sample was collected to terminate the assay. Upon termination, water temperature, water volume, substrate volume, and substrate surface area for each chamber was measured. The gas samples were analyzed for ethylene concentration using an SRI 8610C Gas Chromatograph with Hayesep T column with hydrogen carrier gas, a flame ionization detector, and column oven set at 40°C ramping to 110°C after 2.5 min. A 100 ppm ethylene standard was used to convert peak height to concentration of ethylene in the gas sample. The amount of ethylene in the headspace (initial and final) was determined using water volume, the solubility constant for ethylene, and equations from Dodds et al. (2017). We estimated the amount of N fixed by assuming 3 mol of acetylene converted to ethylene is equal to 1 mol of N2 being fixed (Capone, 1993; Kim et al., 2006).
Acetylene block assays were used to quantify rates of denitrification. Acetylene prevents the complete transformation of NO to atmospheric N, causing N2O to accumulate, which can be measured to estimate denitrification rate (Smith and Tiedje, 1979). C, N, and chloramphenicol (to prevent bottle effects) were added to each chamber to a final concentration of 34 mg/L sucrose and sodium nitrate and 114 mg/L chloramphenicol. Acetylene was introduced into the chambers and initial and final samples were collected the same as described above for N2 fixation assays. The gas samples were analyzed for N2O using the SRI 8610C Gas Chromatograph with Hayesep D column and helium or ultra-high purity N2 (for samples analyzed after February 2019) carrier gas, electron capture detector, and column oven set to 80°C ramping to 180°C after 5 min. A 1,000 ppm N2O standard was used to convert peak height to N2O concentration following Dodds et al. (2017).
All rates were scaled to surface area. For sediment, the surface area of the corer was used. Rock area was estimated by tracing each rock onto paper, then cutting those tracings out and weighing them, and comparing those weights to a standard curve created by weighing squares of paper with known areas (Bergey and Getty, 2006).
Water volume in each chamber was measured, and all rocks were scrubbed in that water to remove algae. Subsamples of the scrub water were filtered through pre-ashed GF/F filters (0.7 μm) and frozen. To measure chlorophyll a concentration, filters were later extracted in 95% ethanol for 8–24 h. Using a spectrophotometer, absorbances were measured at 664, 665, and 750 nm. The samples were acidified with 0.1 N HCl and absorbance was measured again (Nusch, 1980; APHA, 2005). Filters with remaining extract and sediment from the chambers were dried in a 60°C oven for 48 h, then combusted at 500°C for 4 h to measure ash free dry mass (AFDM). AFDM and chlorophyll concentrations were scaled up from subsample to total water volume, then normalized by dividing by rock surface area.
Water chemistry was analyzed for each sampling date according to APHA (2005). Water was filtered through 0.45 μm membrane filters and stored on ice until return to the lab where the samples were frozen. Analysis included soluble reactive P (SRP), total dissolved P (TDP), NO + nitrite (NO + NO), NH, total dissolved N (TDN) and DOC. NO + NO and SRP were analyzed using a SEAL AQ2 discrete water analyzer. NO + NO used AQ2 method EPA-127-A Rev. 9, and SRP used AQ2 method EPA-155-A Rev. 0. Filtered water samples were acidified to pH < 2 and sent to Michigan Tech's Laboratory for Environmental Analysis of Forests (LEAF) core facility which used a Shimadzu TOC-VCSN with a total N module TNM-1 (Shimadzu Scientific Instruments, Columbia, Maryland) for DOC and TDN analysis. Dissolved Organic N (DON) was calculated by subtracting NO + NO and NH concentrations from TDN concentrations. TDP concentration was analyzed using the molybdenum—antimony method following an ammonium persulfate digestion (APHA, 2005).
Discharge was determined using a USGS installed gauge (USGS 04043016 Pilgrim River at Paradise Road Near Dodgeville, MI: May 2017–June 2018) and by measuring directly using a Marsh McBirney Flo-mate (May 2017–May 2019). The Flo-mate was attached to a wading rod to measure velocity (m s−1) at 0.6 * stream depth (m) at 10 equidistant points on a transect of the stream perpendicular to shore. The area of each segment was determined by multiplying segment width by segment depth. Discharge in each segment was determined by multiplying velocity by segment area, then added together across all segments to get total discharge (m3/s). Canopy cover was measured using a spherical densitometer (Lemmon, 1956). Photosynthetically active radiation (PAR) was retrieved from the Upper Great Lakes Observing System station located at Michigan Tech's Great Lakes Research Center (station name GLRCMET; http://uglos.mtu.edu/), which is ≈3 km from the study site. A MiniDO2T logger from PME was deployed to continuously measure O2 and temperature at the site, and open water metabolism, which includes gross primary production (GPP) and ecosystem metabolism (ER), was modeled using the StreamMetabolizer software package (Appling et al., 2018; github.com/USGS-R/streamMetabolizer).
Calculations and Statistical Analyses
Differences in rates between seasons were assessed using Multi Response Permutation Procedure (MRPP) with the Vegan package in R (Oksanen et al., 2019). This non-parametric approach allowed us to determine if points grouped to our specified categories based on a set of variables provided (Warton et al., 2012). Based on a Euclidean distance measure, MRPP determined if the distance of points among groups was different from the distance of points within groups, which is reported as the parameter A (significance determined as p < 0.05). First, to ensure the selected seasonal ranges were distinct we used a MRPP to determine if there was grouping in sampling dates by season based on environmental variables. Because MRPP requires no gaps in datasets, the environmental variables were selected based on how important they are in representing seasonality and how complete the dataset was, and included PAR, water temperature, DOC, TDN, NO + NO, SRP, and TDP. Principle components analysis (PCA) was used to describe the environmental variables that were driving the separation between groups by observing the loadings in the first component. PCA was run using the stats package in R (R Core Team, 2020). Following the seasonal categorization, we then performed 4 additional MRPP for denitrification rates on rocks, denitrification rates in sediment, N2 fixation rates on rocks, and N2 fixation rates in sediment to see if they also grouped by season.
To address question 2 about how denitrification and N2 fixation rates vary daily and in their response to hydrological disturbances, we calculated daily change and used MRPP to assess whether it was different among seasons. Daily change was calculated as:
Where abs is the absolute value, Xi is the rate at day i and Xi+1 is the rate one day later. MRPP was performed for daily change in denitrification rates on rock, denitrification rates in sediment, N2 fixation rates on rock and N2 fixation rates in sediment to determine if daily change differed between spring, summer, and fall. Due to less frequent sampling dates in winter (Table 1), daily change was not calculated for this season.
Resistance, or the measure of how much a process rate changes in response to a disturbance, and recovery, or the measure of how quickly rates return to what they were pre-disturbance, were calculated for all processes using sampling data collected daily before and after two large hydrological events that occurred during the sampling period. In the context of this study, we predicted that N2 fixation and denitrification processes would be resistant if the rates did not change before and after a hydrological disturbance. Resistance was calculated as:
Where R is resistance, Xbefore is the rate before a disturbance, and Xafter is the rate after a disturbance. Values closer to 1 indicate high resistance, while those closer to 0 indicate low resistance (Hershkovitz and Gasith, 2013). Recovery or resilience is how quickly the rates post-disturbance return to pre-disturbance levels if they decreased because of the disturbance. Recovery for each rate was calculated as the linear slope of the relationship between rate and day in the time period directly following the disturbance (Reisinger et al., 2017).
Environmental factors related to N2 fixation and denitrification rates on rock and in sediment were explored using partial least squares (PLS) regression with the pls package in R (Mevik et al., 2020). All environmental variables were standardized to mean = 0 and standard deviation = 1. The PLS used those environmental variables to create components which described the most variation in relation to rate. We selected the components which described the most variation in rate and looked at which environmental variables had the largest loadings for those components to determine which environmental variables were most related to rate. We chose this method because we had a large amount of co-linear independent variables, and PLS is robust to these collinearities (Carrascal et al., 2009).
Results
Throughout the year, both rates and environmental variables ranged greatly (Table 1, Figures 3, 4). Denitrification in sediment averaged 984.65 ± 1032.46 μg N/m2/h (mean ± standard deviation; Figure 3) for the entire sampling period, while N2 fixation on rocks averaged 3.29 ± 7.23 μg N/m2/h. Discharge measured during sampling averaged 1.18 ± 1.04 m3/s, although this did not encompass high discharge events as manual measurements were taken only during sampling events, which could not happen safely during high flow. The highest discharge recorded by the USGS gauge upstream of the study reach occurred on 19 Jun 2018, during a 1,000-year flood event with an estimated maximum discharge of 208 m3/s (T. Weaver, USGS, personal communication; Figure 2). Additionally, discharge could not be measured during winter or early spring as the river was ice-covered, although denitrification rates and other environmental variables were measured in all seasons.
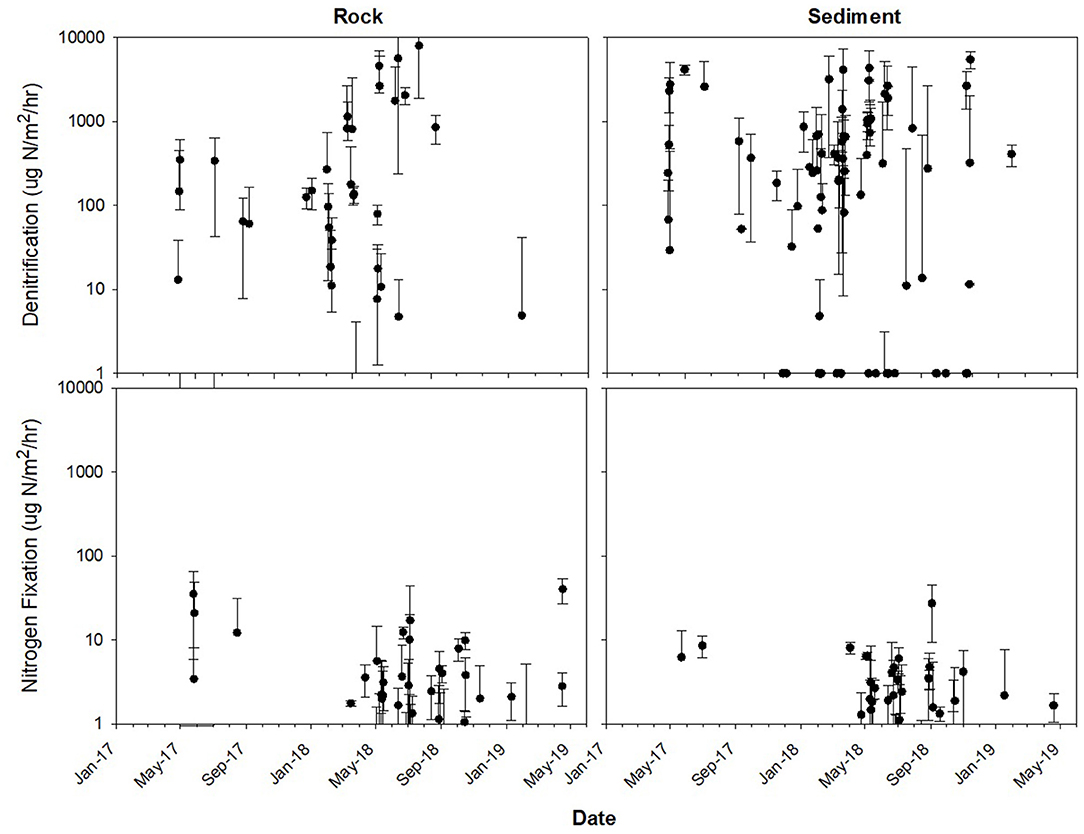
Figure 3. Rates ± standard deviation for denitrification (top) and N2 fixation (bottom) on rocks (left) and in sediment (right). Sampling occurred every 2–6 weeks year-round between May 2017 and May 2019. Additionally, once per season sampling occurred every day over a 1–2-week period.
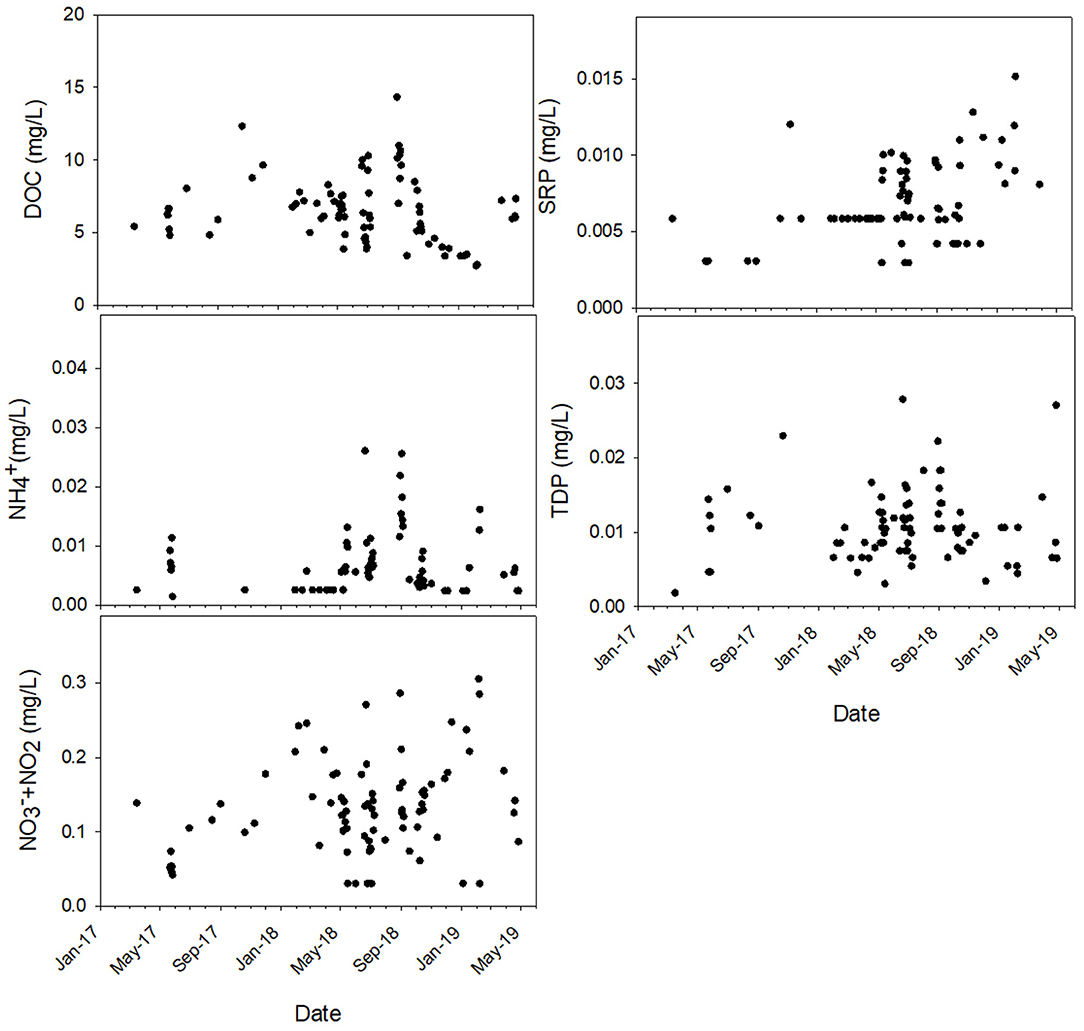
Figure 4. Nutrient concentrations during each sampling throughout the sampling period. Y-axis range for each plot matches the range of the data to demonstrate variation across the study period.
Seasonal Patterns in N2 Fixation and Denitrification Rates
MRPP showed significant separation in environmental conditions between seasons (A = 0.3024, p = 0.001, spring n = 16, summer n = 19, fall n = 12, winter n = 2) based on PAR, water temperature, DOC, TDN, NO + NO, SRP, TDP (Figure 5). The 1st principal component explained 35% of the variation (Supplementary Table S1) and was primarily driven by PAR (0.27), DOC (−0.26), TDN (−0.55), NO + NO (−0.33), SRP (−0.44), and TDP (−0.51). Principal component 2 explained an additional 27% of the variation and was driven by temperature (−0.62). However, MRPP showed no seasonal separation for any of the rates: N2 fixation on rock (A = −0.004098, p = 0.54, spring n = 24, summer n = 30, fall n = 11, winter n = 4); N2 fixation in sediment (A = −0.002548, p = 0.46, spring n = 26, summer n = 31, fall n = 12, winter n = 7), denitrification on rock (A = 0.03522, p = 0.063, spring n = 21, summer n = 31, fall n = 14, winter n = 5), or denitrification in sediment (A = 0.0225, p = 0.099, spring n = 27, summer n = 31, fall n = 14, winter n = 15).
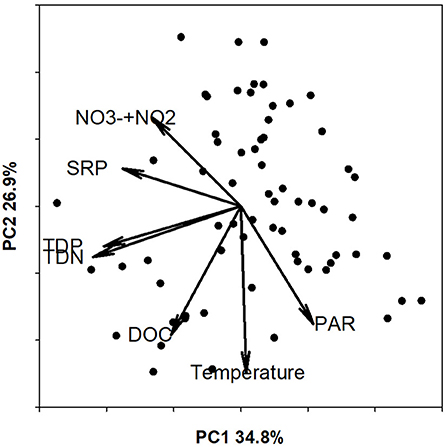
Figure 5. Biplot of environmental characteristics with principal component 1 (PC1) on the x-axis and principle component 2 (PC2) on the y-axis. Points represent each sampling date and the vectors reflect the loading of each environmental variable on the PCA axes. Loadings for each PCA component are reported in Supplementary Table S1.
Daily Variation in N2 Fixation and Denitrification Rates and Their Response to Hydrological Disturbances
Day-to-day differences in denitrification and N2 fixation could be both large or small for both rocks and sediment in spring, summer, and fall. For the entire study period the highest daily change (difference in rates between one day and the next) in denitrification rates on rock was 5,690 μg N/m2/h, denitrification in sediment was 5,202 μg N/m2/h, N2 fixation on rocks was 38 μg N/m2/h, and N2 fixation in sediment was 27 μg N/m2/h. The lowest daily changes were 0 μg N/m2/h for both rates on both substrates (Figure 6). Daily change in denitrification on rocks was significantly different between the three seasons (A = 0.1369, p = 0.004, spring n = 18, summer n = 23, fall n = 5), but not for denitrification in sediment (A = 0.003394, p = 0.41, spring n = 21, summer n = 19, fall n = 5), N2 fixation on rocks (A = 0.01658, p = 0.23, spring n = 19, summer n = 20, fall n = 4), or N2 fixation in sediment (A = 0.01067, p = 0.274, spring n = 20, summer n = n = 19, fall n = 4).
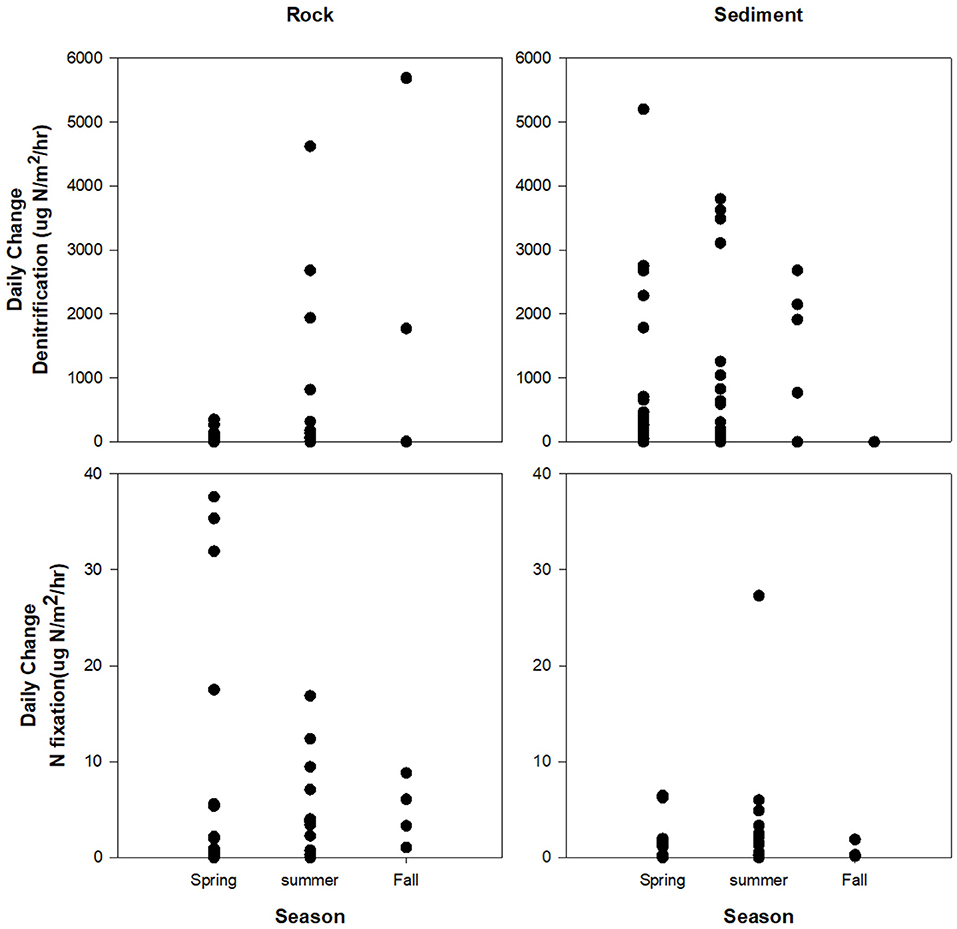
Figure 6. Daily change in denitrification and N2 fixation in different seasons. Daily change was significantly different between seasons for denitrification on rocks but not for the other rate/substrate combinations.
Two storm events occurred during daily sampling events, on 18 June 2018 and 28 August 2018, for which we could calculate resistance and recovery. For the 18 June 2018 storm, rates were measured on 13 June 2018 before the storm, and on 19 June 2018 after the storm, continuing daily for 3 weeks (Figure 7). However, during that time additional, less severe rain events occurred. In the 3 weeks following the storm, daily change for denitrification in sediment (336.5 ± 352.2 μg N/m2/h mean ± SE) and N2 fixation on rocks (1.5 ± 1.9 μg N/m2/h mean ± SE) were frequently high, with rates appearing similar to before the storm (Figure 7). For denitrification in sediment, resistance was calculated to be 0, with a rate of 415 μg N/m2/h measured before the storm and 0 μg N/m2/h measured after the storm. The before-storm rate was one order of magnitude lower than the highest denitrification rate measured over the 3-week recovery period (3,525 μg N/m2/h; average = 697 μg N/m2/h). Recovery was 185 N/m2/h/day, with rates increasing from 0 to 970 μg N/m2/h in 3 days. For N2 fixation on rocks and in sediment as well as denitrification on rocks, resistance and recovery were not applicable because rates increased after the storm event. Similarly, no decline in any of the rates on either substrate was observed after the 28 August 2018 storm (results not shown).
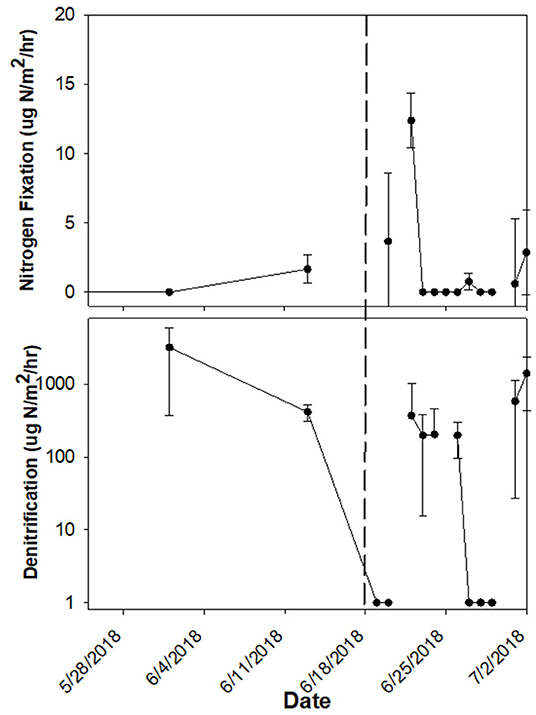
Figure 7. N2 fixation rate on rock and denitrification rate in sediment before and after the 1,000-year flood on 18 June 2018 (indicated by vertical dashed line).
Environmental Factors Related to Variation in Denitrification and N2 Fixation Rates
Inorganic N availability and DOC appeared to be the important driver for denitrification rates, and to a lesser degree for N2 fixation rates. Partial least squares regression showed that 27.52% of the variation in rates of denitrification in sediment was explained by Component 1, (n = 88, Supplementary Table S2). Component 1 was driven by DOC, TDN, and DON with loadings > 0.4. Component 2 explained an additional 8.74% with ecosystem respiration and chlorophyll concentration having loadings > 0.4. For denitrification on rocks, 22.64% of the variation in rates was explained with the first component (n = 71, Supplementary Table S3) which was driven by DOC, TDN, and DON with loadings > 0.4. Component 2 explained an additional 29.56% and was driven by ER and DOC. For N2 fixation on rocks, 25.87% of the variation in rates was explained with the first component (n = 71, Supplementary Table S4) which was driven by TDN, DON, DOC, and ER with loadings > 0.4. Component 2 explained an additional 10.36% and was driven by TDN and NH with loadings > 0.4. For N2 fixation in sediment, 15.09% of the variation in rates was explained with the first component (n = 90, Supplementary Table S5) which was driven by DOC, TDN, and NH with loadings > 0.4. Component 2 explained an additional 20.54% and was driven by PAR.
Discussion
We found that N cycling processes in the Pilgrim River were temporally dynamic and resilient to hydrologic disturbances. Unexpectedly, rates were not significantly different among seasons; rather, within-season variation and daily changes in rates were as large as variation among seasons. Day-to-day variation was high throughout the year, with no discernible difference between seasons and in response to hydrologic events. Because rates were so dynamic, traditional methods for calculating resistance and recovery were not effective and/or potentially didn't apply because there was no consistent rate pre-hydrologic event to compare to post-event. The primary environmental drivers of this variation appeared to be dissolved inorganic and organic N concentrations and DOC, although they explained relatively small amounts of the overall variation in process rates.
Seasonal Patterns in N2 Fixation and Denitrification Rates
Contrary to the findings of other studies, rates and variation in N2 fixation and denitrification did not differ seasonally, although environmental conditions were significantly different between seasons. Other studies which have examined seasonal changes found denitrification rates were related to seasonal shifts in NO concentration, dissolved O2, and organic C (Christensen et al., 1990; Cabrita and Brotas, 2000; Clément et al., 2002; Inwood et al., 2005). This relationship was found in many ecosystems including estuaries and riparian wetlands; however, seasonal studies are often performed in streams with higher N concentrations than our study river. The low NOconcentrations which were consistent among seasons in the Pilgrim River sets it apart from these other studies and may explain the lack seasonal variation in denitrification rates.
Studies of N2 fixation in streams have detected seasonal rate shifts associated with light, temperature, and N flux. Perhaps the most complete understanding of N cycling in a single stream exists for Sycamore Creek in the Sonoran Desert, where seasonal variation in N2 fixation was detected and correlated with light and temperature (Grimm and Petrone, 1997). Sycamore Creek is a desert stream that experiences seasonal drought and year-round warmer temperatures than the Pilgrim River. The Pilgrim River also experiences seasonal light and temperature fluctuations; however, it is located in a temperate forested ecoregion, in general does not support the growth of large cyanobacterial mats, has much lower rates of N2 fixation, and has different temperature ranges and nutrient ratios than Sycamore Creek. Streams in the subalpine, coniferous forested Sawtooth Mountains of central Idaho exhibited N2 fixation rates more comparable (10–610 μg N/m2/h) to those measured in the Pilgrim River (0–50 μg N/m2/h), and in those streams seasonal changes in N2 fixation rates were related to seasonal changes in N flux (Marcarelli and Wurtsbaugh, 2009). Comparatively, the Pilgrim River had higher overall N concentrations than the Sawtooth Mountain streams, with no apparent seasonal variation. Additionally, for both denitrification and N2 fixation, the sampling frequency in most seasonal studies is lower in than in our study of the Pilgrim River, so that those studies might not encompass the full variability within a season. This, along with the overall low rates of N2 fixation and different environmental conditions in the Pilgrim River, could explain why no seasonal variation in N2 fixation or denitrification was observed in this study.
Daily Variation in N2 Fixation and Denitrification Rates and in Their Response to Hydrological Disturbances
Resistance and recovery of lotic systems are difficult to characterize due to frequent hydrological shifts (Friberg, 2014; Jaiswal and Pandey, 2021). Large shifts in process rates occurred day to day; however, unlike we predicted, these shifts did not result from high discharge events. After the 18 June 2018 storm event, which was estimated to be a > 1,000-year flood (T. Weaver, USGS, personal communication) denitrification in sediment did decrease, but returned to pre-flood rates in 3 days, indicating a fast recovery. However, the pre-flood rate was also very low relative to other rates measured over the course of this study, and the denitrification rates stayed low for almost 2 weeks after the event. Therefore, simply based on recovery calculations, the flood appeared to have minimal impact on this process at this location in this river. N2 fixation showed similar trends to denitrification in which variation pre and post-flood were similar and recovery was difficult to decipher. Interestingly, immediately after the flood N2 fixation rates increased, although we are unable to tell if that was due to the disturbance or due to normal daily variation.
As this study was only performed in a single location, we are unable to draw conclusions about the responses of these processes to disturbances in the river as a whole, nor how they may vary among different locations on the river. Assessing resistance and recovery becomes more complicated when looking at landscapes because one part of a landscape may be resistant to a disturbance while another part may not be. Yet, this broader spatial understanding is necessary for proper management, and methods are being developed to characterize the recovery of an entire landscape (Cushman and McGarigal, 2019). For purposes of this study, we do know from other studies on the Pilgrim River that biogeochemical processes vary both within and among stream reaches. Schipper (2021) measured gross primary production, ecosystem respiration and decomposition at 4 reaches along the Pilgrim River, finding the rates differed significantly among the different sites due to changes in water temperature and canopy cover. Eberhard (2022) measured denitrification and N2 fixation rates in different substrate patches within a 657 m2 reach that included the location used in the current study and found that rates of N2 fixation varied relatively little, but rates of denitrification varied 4 orders of magnitude among patches on a single day. These additional studies on the same stream show that the variation of rates for biogeochemical cycles are highly variable both temporally and spatially.
Environmental Factors Are Related to Variations in Denitrification and N2 Fixation Rates
N concentrations and DOC were the most important explanatory factors of rate variation using PLS regression, although the variability explained by a single component was low (15–28%). As denitrification requires both organic C and N as reactants (Wall et al., 2005), our findings of DOC, DIN, and DON are logical to be implicated in the variability of denitrification and fits with findings of other studies. Sediment AFDM was not an important variable implicated by PLS, which was surprising as denitrification requires C. However, we did not measure DOM, N or P concentrations in the sediment or in sediment pore water, which may have been more important indicators than the water column nutrient concentrations that we did measure. For N2 fixation, both DON and TDN were implicated in variation of rates. It was interesting that N:P was not selected as a predictor of N2 fixation, as substantial prior research suggests that N:P could be a more important predictor of N2 fixation that N concentration alone (Smith, 1990; Paerl et al., 2016). However, the 1st component of the PLS had many variables with high loadings including TDP, suggesting that variability in N2 fixation rate may coincide with many different environmental variables. Yet, it is important to note that this 1st component only explained 23% of the overall variation.
These results have important consequences for considering how N cycling processes in northern temperate rivers may respond to climate change. Two likely environmental shifts that are expected with climate change in this region are shifts in the timing and duration of seasons, especially spring and fall (Creed et al., 2015; Contosta et al., 2016), and increasing frequency and magnitude of summer storms (Hayden and Hayden, 2003; Marcarelli et al., 2019). Both of these were inconsequential for variation in denitrification and N2 fixation rates in this river. However, climate change could affect these two processes by alterations to the environmental factors that were related to variation in process rates through time through direct and indirect pathways. For example, changing growing seasons could alter rates of primary production (Barnett et al., 2005; Backlund et al., 2008; Christiansen et al., 2011), which can in turn alter N availability (Roberts and Mulholland, 2007), which our analyses identified as an important explanatory variable for denitrification and N2 fixation rate. DOC concentrations, which was also related to denitrification and N2 fixation in our analyses, are increasing in northern temperate streams globally due to decreases in sulfur deposition, increased temperatures, and increased precipitation (Roulet and Moore, 2006; de Wit et al., 2016); however, long-term changes in DOC concentrations in streams in the Upper Peninsula of Michigan, where this study was located, are less clear (Marcarelli et al., 2019; Meingast et al., 2020). Yet, each of these environmental drivers explained a relatively small proportion of the variation in process rates, which poses a challenge for predicting the responses of N cycling processes that could result from these changes.
Our results suggest that caution is needed when studying biogeochemical processes in rivers because the processes may vary to a greater extent than previously recognized. Assumptions of predictable seasonal variation are not always true, and estimating rates based on sampling a single day may provide gross misestimates based on the magnitude and frequency of variation in both N2 fixation and denitrification rates observed in this study. Additionally, the environmental conditions commonly assumed to control denitrification and N2 fixation rates such as nutrient concentration, although relevant, may not be sufficient for evaluating the occurrence or changes in processes within a single stream. It is likely these relationships are much more complicated, involving many predictor variables interacting in ways we do not yet understand.
Data Availability Statement
The datasets presented in this study can be found in online repositories. The names of the repository/repositories and accession number(s) can be found below: The datasets generated for this study can be found in the Environmental Data Initiative data repository (https://doi.org/10.6073/pasta/62a51b36519e73e4ca42d0bb52fce3e3).
Author Contributions
KN and AM contributed to the study conception and design and revisions and prepared the final manuscript. KN led data collection and analysis and wrote the first draft of the manuscript. Both authors contributed to the article and approved the submitted version.
Funding
This work was funded by a National Science Foundation CAREER Award (DEB 14-51919) to AM. Additional research funding for KN were National Aeronautics and Space Administration (NASA) through Michigan Space Grant Consortium (MSGC) under Award Number 80NSSC20M0124, a Society for Freshwater Science Endowment Award, the Great Lakes Research Center and the Ecosystem Science Center at Michigan Tech. The Department of Biological Sciences and the Graduate School at Michigan Tech provided funding support for KN.
Conflict of Interest
The authors declare that the research was conducted in the absence of any commercial or financial relationships that could be construed as a potential conflict of interest.
Publisher's Note
All claims expressed in this article are solely those of the authors and do not necessarily represent those of their affiliated organizations, or those of the publisher, the editors and the reviewers. Any product that may be evaluated in this article, or claim that may be made by its manufacturer, is not guaranteed or endorsed by the publisher.
Acknowledgments
Thank you to E. Eberhard, M. Kelly, R. Schipper, M. Brehob, H. Roose, A. Norton, M. Braden, and O. Deans for field and laboratory assistance. C. Huckins, E. Kane, and J. Olin provided valuable suggestions for revision on an earlier draft of this manuscript.
Supplementary Material
The Supplementary Material for this article can be found online at: https://www.frontiersin.org/articles/10.3389/frwa.2022.894554/full#supplementary-material
References
APHA (2005). Standard Methods for the Examination of Water and Wastewater. Washington, DC: American Public Health Association (APHA).
Appling, A. P., Hall, R. O., Yackulic, C. B., and Arroita, M. (2018). Overcoming equifinality: Leveraging long time series for stream metabolism estimation. J. Geophys. Res.: Biogeosci. 123, 624–645. doi: 10.1002/2017JG004140
Backlund, P., Schimel, D., Janetos, A., Hatfield, J., Ryan, M. G., Archer, S. R., et al. (2008). Introduction. The effects of climate change on agriculture, land resources, water resources, and biodiversity in the United States, in United States Climate Change Science Program Synthesis and Assessment Product, Vol. 4, 11–20.
Bahadur, A. V., Ibrahim, M., and Tanner, T. (2013). Characterising resilience: unpacking the concept for tackling climate change and development. Clim. Dev. 5, 55–65. doi: 10.1080/17565529.2012.762334
Bandyopadhyay, A., Elvitigala, T., Liberton, M., and Pakrasi, H. B. (2013). Variations in the rhythms of respiration and nitrogen fixation in members of the unicellular diazotrophic cyanobacterial genus Cyanothece. Plant Physiol. 161, 1334–1346. doi: 10.1104/pp.112.208231
Barnett, T. P., Adam, J. C., and Lettenmaier, D. P. (2005). Potential impacts of a warming climate on water availability in snow-dominated regions. Nature 438, 303–309. doi: 10.1038/nature04141
Bergey, E. A., and Getty, G. M. (2006). A review of methods for measuring the surface area of stream substrates. Hydrobiologia 556, 7–16. doi: 10.1007/s10750-005-1042-3
Boulêtreau, S., Salvo, E., Lyautey, E., Mastrorillo, S., and Garabetian, F. (2012). Temperature dependence of denitrification in phototrophic river biofilms. Sci. Total Environ. 416, 323–328. doi: 10.1016/j.scitotenv.2011.11.066
Bowes, M. J., Ings, N. L., McCall, S. J., Warwick, A., Barrett, C., Wickham, H. D., et al. (2012). Nutrient and light limitation of periphyton in the River Thames: implications for catchment management. Sci. Total Environ. 434, 201–212. doi: 10.1016/j.scitotenv.2011.09.082
Burris, R. H., and Roberts, G. P. (1993). Biological nitrogen fixation. Annu. Rev. Nutr. 13, 317–335. doi: 10.1146/annurev.nu.13.070193.001533
Cabrita, M. T., and Brotas, V. (2000). Seasonal variation in denitrification and dissolved nitrogen fluxes in intertidal sediments of the Tagus estuary, Portugal. Mar. Ecol. Progr. Ser. 202, 51–65. doi: 10.3354/meps202051
Capone, D. G. (1993). Determination of nitrogenase activity in aquatic samples using the acetylene reduction procedure, in Handbooks of Methods in Aquatic Microbial Ecology, 621–631. doi: 10.1201/9780203752746-74
Carrascal, L. M., Galvan, I., and Gordo, O. (2009). Partial least squares regression as an alternative to current regression methods used in ecology. Oikos 118:681–690. doi: 10.1111/j.1600-0706.2008.16881.x
Christensen, P. B., Nielsen, L. P., Sørensen, J., and Revsbech, N. P. (1990). Denitrification in nitrate-rich streams: Diurnal and seasonal variation related to benthic oxygen metabolism. Limnol. Oceanogr. 35, 640–651. doi: 10.4319/lo.1990.35.3.0640
Christiansen, D. E., Markstrom, S. L., and Hay, L. E. (2011). Impacts of climate change on the growing season in the United States. Earth Interact. 15, 1–17. doi: 10.1175/2011EI376.1
Clément, J. C., Pinay, G., and Marmonier, P. (2002). Seasonal dynamics of denitrification along topohydrosequences in three different riparian wetlands. J. Environ. Qual. 31, 1025–1037. doi: 10.2134/jeq2002.1025
Coble, A. A., Marcarelli, A. M., and Kane, E. S. (2019). Year-round measurements reveal seasonal drivers of nutrient uptake in a snowmelt-driven headwater stream. Freshw. Sci. 38, 156–169. doi: 10.1086/701733
Contosta, A. R., Adolph, A., Burchsted, D., Burakowski, E., Green, M., Guerra, D., et al. (2016). A longer vernal window: the role of winter coldness and snowpack in driving spring transitions and lags. Glob. Change Biol. 23, 1610–1625. doi: 10.1111/gcb.13517
Creed, I. F., Hwang, T., Lutz, B., and Way, D. (2015). Climate warming causes intensification of the hydrological cycle, resulting in changes to the vernal and autumnal windows in a northern temperate forest. Hydrol. Process. 29, 3519–3534. doi: 10.1002/hyp.10450
Cushman, S. A., and McGarigal, K. (2019). Metrics and models for quantifying ecological resilience at landscape scales. Front. Ecol. Evol. 7:440. doi: 10.3389/fevo.2019.00440
de Wit, H. A., Valinia, S., Weyhenmeyer, G. A., Futter, M. N., Kortelainen, P., Austnes, K., et al. (2016). Current browning of surface waters will be further promoted by wetter climate. Environ. Sci. Technol. Lett. 3, 430–435 doi: 10.1021/acs.estlett.6b00396
DEQ (2012). Pilgrim River Watershed Management Plan. Lansing, MI: Michigan Department of Environmental Quality.
Dodds, W. K., Burgin, A. J., Marcarelli, A. M., and Strauss, E. A. (2017). Nitrogen transformations, in Methods in Stream Ecology (Academic Press), 173–196. doi: 10.1016/B978-0-12-813047-6.00010-3
Eberhard, E. K. (2022). Spatial Heterogeneity of Nitrogen Cycling Within and Across Freshwater Ecosystems (Open Access Dissertation), Michigan Technological University.
Eberhard, E. K., Marcarelli, A. M., and Baxter, C. V. (2018). Co-occurrence of in-stream nitrogen fixation and denitrification across a nitrogen gradient in a western U.S. watershed. Biogeochemistry 139, 179–195. doi: 10.1007/s10533-018-0461-y
Fox, R. J., Fisher, T. R., Gustafson, A. B., Jordan, T. E., Kana, T. M., and Lang, M. W. (2014). Searching for the missing nitrogen: biogenic nitrogen gasses in groundwater and streams. J. Agric. Sci. 152, S96–S106. doi: 10.1017/S0021859614000070
Friberg, N. (2014). Impacts and indicators of change in lotic ecosystems. Wiley Interdiscip. Rev.: Water 1, 513–531. doi: 10.1002/wat2.1040
Grimm, N., and Petrone, K. (1997). Nitrogen fixation in a desert stream ecosystem. Biogeochemistry 37, 33–61. doi: 10.1023/A:1005798410819
Grimm, N. B. (1987). Nitrogen dynamics during succession in a desert stream. Ecology 68, 1157–1170. doi: 10.2307/1939200
Grimm, N. B., and Fisher, S. G. (1989). Stability of periphyton and macroinvertebrates to disturbance by flash floods in a desert stream. J. North Am. Benthol. Soc. 8, 293–307. doi: 10.2307/1467493
Hayden, B. P., and Hayden, N. R. (2003). Decadal and century-long changes in storminess at long-term ecological research sites, in Climate Variability and Ecosystem Response at Long-Term Ecological Research Sites (Oxford University Press), 262–285. doi: 10.1093/oso/9780195150599.003.0026
Hershkovitz, Y, and Gasith, A. (2013). Resistance, resilience, and community dynamics in mediterranean-climate streams. Hydrobiologia 719, 59–75. doi: 10.1007/s10750-012-1387-3
Holling, C. S. (1973). Resilience and stability of ecological systems. Ann. Rev. Ecol. Syst. 4, 1–23. doi: 10.1146/annurev.es.04.110173.000245
Horner, R. R., Welch, E. B., Seele, M. R., and Jacoby, J. M. (1990). Response of periphyton to changes in current velocity, suspended sediment, and phosphorus concentration. Freshw. Biol. 24, 215–232. doi: 10.1111/j.1365-2427.1990.tb00704.x
Howarth, R. W., Marino, R., and Cole, J. J. (1988). Nitrogen fixation in freshwater, estuarine, and marine ecosystems. 2. Biogeochemical control. Limnol. Oceanogr. 33(4, Part 2), 688–701. doi: 10.4319/lo.1988.33.4part2.0688
Inwood, S. E., Tank, J. L., and Bernot, M. J. (2005). Patterns of denitrification associated with land use in 9 midwestern headwater streams. J. North Am. Benthol. Soc. 24, 227–245. doi: 10.1899/04-032.1
Jaiswal, D., and Pandey, J. (2021). River ecosystem resilience risk index: A tool to quantitatively characterize resilience and critical transitions in human-impacted large rivers. Environ. Pollut. 268, 115771. doi: 10.1016/j.envpol.2020.115771
Kim, D. J., Lee, D. I., and Keller, J. (2006). Effect of temperature and free ammonia on nitrification and nitrite accumulation in landfill leachate and analysis of its nitrifying bacterial community by FISH. Bioresour. Technol. 97, 459–468. doi: 10.1016/j.biortech.2005.03.032
Lemmon, P. E. (1956). A spherical densiometer for estimating forest overstory density. For. Sci. 2, 314–320.
Marcarelli, A. M., Baker, M. A., and Wurtsbaugh, W. A. (2008). Is in-stream N2 fixation an important N source for benthic communities and stream ecosystems? J. North Am. Benthol. Soc. 27, 186–211. doi: 10.1899/07-027.1
Marcarelli, A. M., Coble, A. A., Meingast, K. M., Kane, E. S., Brooks, C. N., Buffam, I., et al. (2019). Of small streams and Great Lakes: integrating tributaries to understand the ecology and biogeochemistry of Lake Superior. J. Am. Water Resour. Assoc. 55, 442–458. doi: 10.1111/1752-1688.12695
Marcarelli, A. M., and Wurtsbaugh, W. A. (2006). Temperature and nutrient supply interact to control nitrogen fixation in oligotrophic streams: an experimental examination. Limnol. Oceanogr. 51, 2278–2289. doi: 10.4319/lo.2006.51.5.2278
Marcarelli, A. M., and Wurtsbaugh, W. A. (2009). Nitrogen fixation varies spatially and seasonally in linked stream-lake ecosystems. Biogeochemistry 94, 95–110. doi: 10.1007/s10533-009-9311-2
Mathbout, S., Lopez-Bustins, J. A., Roy,é, D., Martin-Vide, J., Bech, J., and Rodrigo, F. S. (2018). Observed changes in daily precipitation extremes at annual timescale over the eastern Mediterranean during 1961–2012. Pure Appl. Geophys. 175, 3875–3890. doi: 10.1007/s00024-017-1695-7
Meingast, K. M., Kane, E. S., Coble, A. A., Marcarelli, A. M., and Toczydlowski, D. (2020). Climate, snowmelt dynamics and atmospheric deposition interact to control dissolved organic carbon export from a northern forest stream over 26 years. Environ. Res. Lett. 15, 104034. doi: 10.1088/1748-9326/ab9c4e
Mevik, B., Wehrens, R., and Liland, K. H. (2020). pls: Partial Least Squares and Principal Component Regression. R package version 2.7-3. Available online at: https://CRAN.R-project.org/package=pls (accessed March 05, 2022).
Meyer, J. L., and Likens, G. E. (1979). Transport and transformation of phosphorus in a forest stream ecosystem. Ecography 60, 1255–1269. doi: 10.2307/1936971
Nifong, R. L., Taylor, J. M., Adams, G., Moore, M. T., and Farris, J. L. (2020). Recognizing both denitrification and nitrogen consumption improves performance of stream diel N2 flux models. Limnol. Oceanogr.: Methods 18, 169–182. doi: 10.1002/lom3.10361
Nusch, E. A. (1980). Comparison of different methods for chlorophyll and phaeopigment determination. Arch. Hydrobiol. Beih 14, 14–36. doi: 10.1016/0077-7579(86)90057-8
O'Connor, B. L., Harvey, J. W., and McPhillips, L. E. (2012). Thresholds of flow-induced bed disturbances and their effects on stream metabolism in an agricultural river. Water Resour. Res. 48:W08504. doi: 10.1029/2011WR011488
Oksanen, J., Blanchet, F. G., Friendly, M., Kindt, R., Legendre, P., McGlinn, D., et al. (2019). vegan: Community Ecology Package. R package version 2.5-6. Available online at: https://CRAN.R-project.org/package=vegan (accessed March 05, 2022).
Paerl, H. W., Scott, J. T., McCarthy, M. J., Newell, S. E., Gardner, W. S., Havens, K. E., et al. (2016). It takes two to tango: when and where dual nutrient (N and P) reductions are needed to protect lakes and downstream ecosystems. Environ. Sci. Technol. 50, 10805–10813. doi: 10.1021/acs.est.6b02575
Pope, K. L., Allen, C. R., and Angeler, D. G. (2014). Fishing for resilience. Trans. Am. Fish. Soc. 143, 467–478. doi: 10.1080/00028487.2014.880735
R Core Team (2020). R: A Language and Environment for Statistical Computing. Vienna: R Foundation for Statistical Computing. Available online at: https://www.R-project.org/ (accessed March 05, 2022).
Reisinger, A. J., Rosi, E. J., Bechtold, H. A., Doody, T. R., Kaushal, S. S., and Groffman, P. M. (2017). Recovery and resilience of urban stream metabolism following Superstorm Sandy and other floods. Ecosphere 8, e01776. doi: 10.1002/ecs2.1776
Roberts, B. J., and Mulholland, P. J. (2007). In-stream biotic control on nutrient biogeochemistry in a forested stream, West Fork of Walker Branch. J. Geophys. Res.: Biogeosci. 112, 1–11. doi: 10.1029/2007JG000422
Roulet, N., and Moore, T. R. (2006). Environmental chemistry: browning the waters. Nature 444, 283. doi: 10.1038/444283a
Schipper, R. (2021). Controls on Autotrophic Respiration, Heterotrophic Respiration, and Decomposition in Northern Forested Rivers (Open Access Master's Thesis), Michigan Technological University.
Scott, J. T., and Marcarelli, A. M. (2012). Cyanobacteria in freshwater benthic environments, in Ecology of the Cyanobacteria II: Their Diversity in Time and Space, 271–289. doi: 10.1007/978-94-007-3855-3_9
Seitzinger, S., Harrison, J., Bohlke, J., Bouwman, A., Lowrance, R., Peterson, B., et al. (2006). Denitrification across landscapes and waterscapes: a synthesis. Ecol. Appl. 16, 2064–2090. doi: 10.1890/1051-0761(2006)016[2064:DALAWA]2.0.CO;2
Smith, M. S., and Tiedje, J. M. (1979). Phases of denitrification following oxygen depletion in soil. Soil Biol. Biochem. 11, 261–267. doi: 10.1016/0038-0717(79)90071-3
Smith, V. H. (1990). Nitrogen, phosphorus, and nitrogen fixation in lacustrine and estuarine ecosystems. Limnol. Oceanogr. 35, 1852–1859. doi: 10.4319/lo.1990.35.8.1852
Stottlemyer, R., and Toczydlowski, D. (1999a). Seasonal change in precipitation, snowpack, snowmelt, soil water and stream water chemistry, northern Michigan. Hydrogeol. J. 2231, 2215–2231. doi: 10.1002/(SICI)1099-1085(199910)13:14/15<2215::AID-HYP882>3.0.CO;2-V
Stottlemyer, R., and Toczydlowski, D. (1999b). Seasonal relationships between precipitation, forest floor, and stream water nitrogen, Isle Royale, Michigan. Soil Sci. Soc. Am. J. 63, 389–398. doi: 10.2136/sssaj1999.03615995006300020018x
Vitousek, P. M., Cassman, K., Cleveland, C., Crews, T., Field, C. B., Grimm, N. B., et al. (2002). Towards an ecological understanding of biological nitrogen fixation. Biogeochemistry 57–58, 1–45. doi: 10.1007/978-94-017-3405-9_1
Wall, L. G., Tank, J. L., Royer, T. V., and Bernot, M. J. (2005). Spatial and temporal variability in sediment denitrification within an agriculturally influenced reservoir. Biogeochemistry 76, 85–111. doi: 10.1007/s10533-005-2199-6
Warton, D. I., Wright, T. W., and Wang, Y. (2012). Distance-based multivariate analyses confound location and dispersion effects. Methods Ecol. Evol. 3, 89–101. doi: 10.1111/j.2041-210X.2011.00127.x
Keywords: nitrogen fixation, denitrification, river, nitrogen cycle, temporal variability
Citation: Nevorski KC and Marcarelli AM (2022) High Daily and Year-Round Variability in Denitrification and Nitrogen Fixation in a Northern Temperate River. Front. Water 4:894554. doi: 10.3389/frwa.2022.894554
Received: 11 March 2022; Accepted: 26 May 2022;
Published: 20 June 2022.
Edited by:
Thad Scott, Baylor University Medical Center, United StatesCopyright © 2022 Nevorski and Marcarelli. This is an open-access article distributed under the terms of the Creative Commons Attribution License (CC BY). The use, distribution or reproduction in other forums is permitted, provided the original author(s) and the copyright owner(s) are credited and that the original publication in this journal is cited, in accordance with accepted academic practice. No use, distribution or reproduction is permitted which does not comply with these terms.
*Correspondence: Amy M. Marcarelli, YW1tYXJjYXJAbXR1LmVkdQ==