 Jeremy R. Porter1,2*
 Evelyn G. Shu1
 Mike F. Amodeo1Neil Freeman1Mark Bauer1Ibrahim Almufti3Meg Ackerson3Jinal Mehta3
- 1First Street Foundation, Brooklyn, NY, United States
- 2Quantitative Methods in the Social Sciences, City University of New York, New York, NY, United States
- 3Arup, Advanced Technology and Research, San Francisco, CA, United States
Environmental changes are predicted to exacerbate changes in flood events, resulting in consequences for exposed systems. While the availability and quality of flood risk analyses are generally increasing, very little attention has been paid to flood impacts related to the commercial market. This is notable given that the commercial market is often made up of the most valuable physical structures in communities, employs much of the local labor force, and generally plays a key role in the sustainability of economies. This study provides the first national spatial model of flood risk for commercial and multi-unit residential buildings at a property level resolution within the United States. This is achieved through the use of high-resolution inputs (hazard and property data), flood hazard information for the four major flood types, multi-return period hazard information, component-based depth-damage functions, GDP and economic multipliers information, and future facing projections. This study estimates that over the next 30 years, the absolute count of commercial and multi-unit buildings with risk will increase 8%, structural damage costs will increase 25.4%, downtime days will increase 29.1%, and economic impacts will increase 26.5%. Additionally, these impacts are concentrated in certain spatial locations. A high resolution model capturing flood risk as related to these commercial buildings is important for a comprehensive understanding of overall flood risk within the United States.
Classification Codes: JEL C30, E00, G17, M20, R10, R30
Introduction
Acronyms included in this analysis
• FEMA: Federal Emergency Management Agency
• NOAA: National Oceanic and Atmospheric Administration
• NCEI: National Center for Environmental Information
• IPCC: International Panel on Climate Change
• USACE: United States Army Corps of Engineering
• AAL: Average Annual Loss
• GIS: Geographic Information System
• HAZUS: Hazards United States
• EM-DAT: International Disasters Database
• EEA: Energy and Environmental Affairs
• FSF-FM: First Street Foundation—Flood Model
• REDi: Resilience-based Earthquake Design Initiative
• BEA: Bureau of Economic Activity
• CBSA: Core Based Statistical Area
• BEA RIMS II: Regional Input-Output Modeling System
Flooding is one of the largest national disasters in terms of reach and cost in the United States [NOAA National Centers for Environmental Information (NCEI), 2021]. Recent research in the area has highlighted the emergence of significant trends in the relationship between climate and the economy which are expected to be further amplified in the near future [Nunn et al., 2019]. In the United States, damages to the economy will grow as temperatures change at a continuously increasing rate. Additionally, the effects of the changing climate will not be felt evenly across the US. In fact, locations in the country that are already exposed to climate hazards and locations projected to see an onset of exposure in the near future are where the risk will likely be most pronounced across a number of risk indicators. Most central to that risk is the vulnerability of the individual residential properties, shared community infrastructure, and components of the local labor market including impacts to commercial and office structures. These physical commercial and office structures are an important component of market health, as they facilitate the trade of goods and services, therefore serving as an essential part of economic and community prosperity. While there is limited information available on commercial damages due to flooding exposure, FEMA (2015) reported the average commercial NFIP claim to be about $89,000. As flooding severity and frequency changes along with a changing climate, increasing commercial flood risk understanding is especially important. To date, several large corporate headquarters, faced with climate risk, have engaged in a series of high profile re-locations, including the Spirit Air Operations Center from Florida to Nashville (Lyons, 2020), Hewlett Packard in Houston (Pulsinelli, 2017), and Roper Hospital in Charleston (Sausser and Johnson, 2021). Understanding, and quantifying, the ways in which that exposure relates to commercial real-estate vulnerability is essential to our ability to understand where the effects of climate are already being felt and where they will be most pronounced in the coming future.
Understanding the flood risk to commercial markets is crucial to providing communities and policy makers the information needed to guide investment, mitigation, and adaptation. Commercial markets can utilize this type of comprehensive risk information to guide their prioritization of investment in areas where there is lower exposure and where the local economy also has lower impacts (such as due to the indirect impacts of a more restricted market). Additionally, commercial markets will be able to prioritize their involvement with mitigation efforts on a local scale or that is building-specific to decrease their vulnerability through structural damage and the resulting downtime impacts as well as to not be located in an area where the local economy is overly restricted from large amounts of indirect economic impacts. Lastly, these vulnerability indicators are versatile enough to inform other risk assessments that commercial markets may undergo, and can be useful for understanding and prioritizing adaptation strategies so that building-specific vulnerabilities are reduced. This includes planning for the facilitation of remote work if downtime is necessary so that direct economic outputs are reduced only at minimum levels, planning for the streamlining of construction work to speed up repair time to shorten the amount of downtime necessary, and understanding the amount of potential financial obligations involved with their estimated flood risk so that additional money may be set aside and the business is not overly handicapped by surprise costs.
Outside of commercial markets, it will also be useful for governments to understand the risk as it relates to their local tax base, and to plan accordingly. Large impacts for local economies may result in lower tax revenues, slower economic growth (such as from decreased investment in the area, populations moving out, etc.), and generally unhappy citizens. Outside of these investment concerns, the results provided here can be used as inputs for areas which hope to develop more comprehensive risk models, especially as related to economic impacts (e.g., governments may lack the resources to model flood hazard, exposure, and structural damage at a high-resolution themselves).
Finally, there is a strong need for individuals to understand the risk in their area given its potential impact on income opportunities, market accessibility, and general satisfaction. Flood risk in commercial markets not only impacts commercial industries, but, due to the role commercial buildings play in general market health and economic growth opportunities, these impacts also affect individuals living in the area. Homeowners and renters may not be directly impacted by flooding causing structural damage to their homes, but flood risk in the surrounding area may still be highly relevant. As such, the primary objectives of this analysis are two-fold: (1) this research aims to develop a first principles of engineering approach to estimating flood damage for all commercial properties in the US through the development of general building archetypes and (2) this research aims to aggregate those damages nationally to produce a first of its kind estimate of economic risk to the commercial sector from flooding.
Literature Review
The International Panel on Climate Change (IPCC) defines the components of flood risk as hazard, exposure, and vulnerability (Reisinger et al., 2020). All three components must be captured for appropriately claiming risk. Flood hazard refers directly to the flooding events, capturing location, probability, frequency, and other directly related characteristics. Exposure builds off of this hazard component and refers to the existence of concerned resources, such as populations and/or economic resources, where there is hazard. The final component necessary for the characterization of risk is vulnerability, which refers to the likelihood that exposed resources will suffer adverse effects (Luers et al., 2003; Cardona et al., 2012).
Research modeling commercial flood risk often is restricted by data availability issues. For example, property information may not differentiate between building and use types (Mohleji and Pielke, 2014) such as when sourced from satellite imagery. Other research has been limited to only residential losses (typically for single family residential properties) or critical infrastructures as this data may be provided by government databases. While there are therefore few studies which evaluate flood risk as related to commercial properties, the assessments that are available are often place-based partially due to the poor availability of property data for commercial structures. Relatedly, risk assessments are also often place-based due to the complexity of the relationships and variables which influence vulnerability. That is, when these assessments span over larger geographical areas, variables related to vulnerability should be selected with consideration of the appropriateness for the system of interest. The U.S. Army Corps of Engineers (USACE) estimates flood risk for all structure types during mitigation project feasibility studies [U.S. Army Corps of Engineers (USACE), 2012], but are limited to areas of project locations. Another study by Shultz (2017) evaluated commercial flood risk in Sarpy County (Omaha, NE) and Fargo/Moorhead (ND/MN), relying on FEMA floodplain maps for hazard information. Hossain and Meng (2020) develop a high-resolution spatial model of individual business building exposure and risk in Birmingham, AL. Outside of the United States, similar barriers are often faced (e.g., see Löschner et al., 2017; Romali and Yusop, 2021).
One such vulnerability metric used for evaluating infrastructure impacts includes the use of depth-damage functions for producing estimates of average annual loss (AAL). AAL or similar loss estimates are often calculated through simple linear depth-damage functions, where higher flood depths directly translate to higher damage estimates. These types of depth-damage functions are increasingly recognized to be problematic as they do not provide an accurate understanding of structural fragility and susceptibility to damage. Wing et al. (2020) compare historic flood claims within the United States obtained through the National Flood Insurance Program (NFIP) database with commonly applied depth-damage functions and find low agreement. One of the most readily observable limitations is that these depth-damage models generally estimate the same proportion of economic losses (taking the repair costs as a percentage of the total replacement value) for buildings of different heights and stories, even though the first floor is the only one likely to be impacted (Wing et al., 2020).
Depth-damage functions by definition utilize depth as the independent variable. Different depth-damage functions may exist for various building types and may not be completely linear in nature, accounting instead for damage clustering at low depths and at high depths. Multivariate models are typically more useful (i.e., Thieken et al., 2008; Merz et al., 2013; Schröter et al., 2014), but the complexity of the development of multivariate models (and the associated issues of limited data availability) has posed a barrier for standard application in flood risk assessments (Wing et al., 2020). Depth-damage functions will have greatly reduced uncertainty when developed separately for different building types and if they account for damage not occurring as a simple linear function of depth. A common source of these non-linear depth-damage functions which account for differences in building characteristics and some differences in flood characteristics (such as through the containment of proxies for flood velocity) is the FEMA Multi-hazard Loss Estimation Program (HAZUS). HAZUS is a publicly available and widely used GIS-based tool which presents a framework for application of depth-damage functions derived from NFIP claims to estimate property damage (Scawthorn et al., 2006). Many previous assessments of flood risk which make use of HAZUS damage information are limited in their ability to provide property-level estimates due to limited flood hazard and property characteristics data. HAZUS provides damage data based on the building inventory composition by Census blocks, which relies on the assumption that flood depths are equally probable across the entire area (Armal et al., 2020). Some studies have utilized assessor data in conjunction with HAZUS data to conduct parcel-level analysis (Kousky et al., 2013). However, as these damage-functions are statistically derived, small sample sizes make the application of these damage curves inappropriate for commercial and large multi-unit residential buildings as the majority of NFIP claims generally do not include large commercial structures (Shultz, 2017).
Much of existing literature identifies that the costs of disasters is often undervalued as they only account for structural impacts (Carrera et al., 2015). Economic impacts of natural hazards are not well-understood, especially due to their indirect and macro-economic effects (Carrera et al., 2015; Allaire, 2018). Many estimates from government agencies [e.g., the European Environmental Agency; see European Environmental Agency (EEA), 2012] and global disaster databases (such as the EM-DAT dataset from the Centre for Research on the Epidemiology of Disasters) undervalue the cost of disasters as they do not account for these types of impacts (Carrera et al., 2015). Several methods exist for attempting to assess indirect economic impacts of natural hazards (Cochrane, 2004; Rose, 2004; Messner, 2007; Okuyama, 2007; Green et al., 2011; Przyluski and Hallegatte, 2011), but are often disaster focused (Santos et al., 2014; Carrera et al., 2015). Various methodologies have different advantages and disadvantages (Carrera et al., 2015 lists several methodologies and provides examples of studies which have used each), but input-output (I-O) methodologies are recognized as broadly applicable and reliable for capturing a broad range of impacts. Santos et al. (2014) uses an I-O methodology but their analysis relies on fabricated hazard information (assuming characteristics of imaginary disaster scenarios). Additionally, they estimate inoperability consequences through the application of exponential decay models for entire sectors rather than individually for each property.
Methods
Hazard and Exposure
The flood model used to estimate the hazard in this analysis is the First Street Foundation-Flood Model (FSF-FM; see Bates et al., 2021) which represents a high resolution inundation model at a 3m horizontal resolution. The hazard information provided by the FSF-FM includes the integration of a national database of more than 20,000 unique flood adaptation measures, multiple flood types (tidal, pluvial, fluvial, and surge), and multiple flood return periods (2-, 5-, 20-, 100-, 250-, and 500-year), currently and in the future.
Exposure is calculated at high-resolution for the entire country through coupling spatial parcel-level property information to the high-resolution hazard information provided by the FSF-FM. The high-resolution property information is obtained through a third party provider (https://www.lightboxre.com/). The property data represent the full suite of assessment based characteristics and value-added standardized property level indicators necessary for the development of damage functions and assignment of building archetypes.
Expected annualized depth for each year are calculated for current climate conditions and into the future as the sum of the probabilities that relate to each flood likelihood (as represented by the multiple return periods in the FSF-FM) multiplied by associated flood depths, using the equation presented here:
In the above equation, D and P show the depth and probability, respectively, and i is the numerator for different return period scenarios. This exposure and expected depth data calculation follows the same methodology as previous research (Armal et al., 2020; Porter et al., 2021).
Vulnerability
Importantly, this report has developed and applied a new methodology for estimating vulnerability (which is specific to large buildings, such as retail, office, and multi-unit residential buildings) in order to provide a more comprehensive understanding of risk. Estimates related to vulnerability include structural damages (repair costs), downtime (days closed and unable to work for repair), direct economic damages (from retail and office buildings being closed), and indirect economic damages (macro-economic level impacts). These vulnerability metrics all build off of archetype specific damage functions which directly translate into structural damage costs and downtime. Damage information is then used to estimate economic damages through coupling data on GDP contribution and economic cost multipliers from the Bureau of Economic Analysis' Regional Input-Output Multiplier, which are explicitly designed to capture the impact of industry location on local wages, sales, supply chain needs, and other economic activity that may not be tied directly to the building or industry itself (Bess and Ambargis, 2011).
In order to couple vulnerability with hazard exposure, Arup, a leading engineering firm, developed vulnerability curves in conjunction with the First Street Foundation for various building archetypes. The overall process makes use of building characteristics associated with the number of stories, presence of basement, square footage, assessed value, construction, year built, and location to develop 30 different archetypes. The development of these archetypes allows for the generalization of flood damages based on expected costs, susceptibility to damage, and the normative locations of building components in each of the archetypes developed for this analysis.
At the building level, fragility curves define the probability that individual building components would sustain a certain severity of damage (from minor or repairable damage to full replacement) for a given flood depth. To develop the component-based fragility curves, Arup used first principles of engineering, observations from field reconnaissance in the aftermath of past flood events (e.g., Hurricane Harvey), other guidelines (e.g., NEMA Ingress Protection standards), or adapted from the literature. Figure 1 (made with Indesign and Python package matplotlib) shows an example family of fragility curves for interior partitions, where DS1 refers to partial failure of the partitions (which requires replacement of at least the bottom 4 ft of drywall panel) and DS2 represents complete failure of the partitions (which requires full replacement from floor to ceiling).
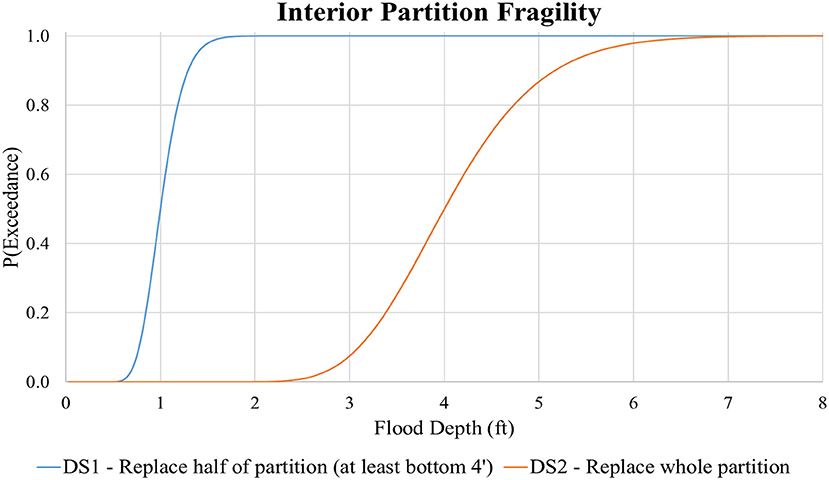
Figure 1. Fragility curves for interior building partitions.
Arup developed this component-based approach for flood risk analysis based on a methodology that was originally used to quantify seismic risk, adopted from FEMA P-58 (Applied Technology Council, 2013) and enhanced to more realistically capture building downtime with Arup's Resilience-based Earthquake Design Initiative (REDi) methodology (Arup, 2013). In the past several years, Arup has adapted this seismic component-level approach to climate-related hazards. Recently, academic researchers have also been adapting this type of approach for flood risk modeling (Nofal and Van de Lindt, 2020).
Each building model, populated with components arranged according to its size and archetype, was subjected to incremental flood depths from one foot up to 15 feet. For each flood depth, 1,000 Monte Carlo simulations were run, sampling the fragilities of each component so that component-level damage results were produced for each of the 1,000 realizations. This modeling approach captures the inherent variability in flood impacts and quantifies the bands of uncertainty statistically so that they may be sampled as a range of probable damage estimates within reason. In the report we focus on the 50th percentile of this damage distribution but also have extracted the 10th and 90th percentiles as representation of the low and high confidence envelope around those estimates (see Figure 2 as an example, made with Indesign and Python package matplotlib). Where possible, these results were compared to literature as a benchmarking exercise [U.S. Army Corps of Engineers (USACE), 2009; FEMA, 2020; Nofal and Van de Lindt, 2020].
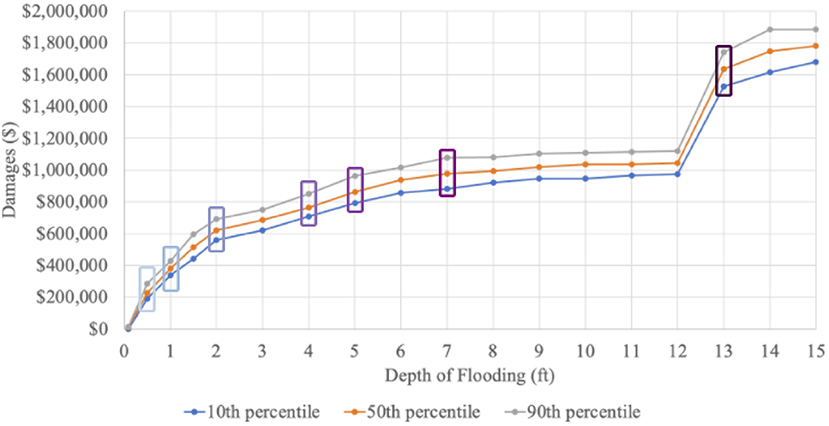
Figure 2. Low-rise office building (non-timber) building archetype vulnerability curve for the 10th, 50th, and 90th percentile losses.
Structural Damage Impacts
By coupling the hazard and exposure information of each building with the building archetype, the number of units for each component which needed to be repaired or replaced (according to its damage state) were obtained for each simulation for each building. This information defining the damage state was used in a consequence function for calculating the “structural damage cost” from repairs required (based on data procured by Arup's internal cost estimators). In order to get baseline estimates, the costs to repair and replace equipment were estimated for Washington, D.C. in 2020 USD. Based on the level of damage, the total building structural damage cost was calculated for each realization as a sum across all damaged components for each flood depth. The estimates produced through the Washington D.C. baseline application were then adjusted to be appropriate for each of the other geographical locations through the use of price parity multipliers from the Bureau of Economic Analysis (BEA) by Metro area (CBSA), or state, for counties outside of metro areas.
Downtime Impacts
Downtime estimates are directly related to structural damage and influenced by post-disaster market conditions. These are calculated through the additional inclusion of the aggregated repair time per damaged component in the building and impeding factors that delay the initiation of building repairs such as from local market conditions associated with the availability of construction/repair labor following the modeled flood event. The downtime calculation followed the REDi methodology, which was originally published in REDi for Seismic (Arup, 2013) and adapted for flood by Arup. Overall, the process for the calculation of downtime estimates follows a similar process as that for structural damage estimates. For downtime estimates, rather than information on the cost of replacement for each component to estimate monetary loss, information regarding the repair times for damaged components and impeding factors that delay the initiation of building repairs are utilized instead to calculate time. Impeding delays include time for floodwater recession, building restoration, contractor and engineer mobilization, and equipment long lead times. Once the impending delays are resolved, the downtime model allocates crews of workers to make repairs to damaged components based on specific trades (e.g., electrical). A construction of realistic repair sequences that mimic actual contractor logistics is aggregated to quantify the overall building downtime. As a result, downtime impact estimates also rely on the calculation of property-specific structural damage costs and is estimated utilizing information regarding the 3 percentile-based values (10th, 50th, and 90th percentiles) of downtime per flood depth for each of the building archetypes coupled with the property's hazard and exposure information.
Economic Impacts
Finally, economic impacts (direct and indirect) from commercial non-office and office buildings are estimated as indicators in the reduction of outputs and other associated economic activity due to downtime, and are calculated through the inclusion of information on land-use, geographic location, square footage, GDP contribution by sector, and RIMS II multipliers capturing indirect market-level impacts (Bess and Ambargis, 2011). Economic impacts refer to the economic losses incurred due to commercial buildings being closed from flooding. This includes direct economic losses from economic activity not occurring that would normally occur in the impacted building due to the estimated downtime (detailed above). Additionally, indirect impacts (also referred to as flow or downstream effects) are partially captured here through the application of state and sector specific economic multipliers provided by the BEA RIMS II. These indirect impacts refer to the foregone economic activity in the region due to the direct economic impacts. For example, an office building which normally purchases large amounts of office supplies but which now has interrupted operations due to flooding results in indirect impacts due to this foregone market activity where it is not engaging in the purchase of those supplies during downtime. More broadly, indirect impacts result when a flooded building cannot operate as a supplier for outputs, or cannot operate as a buyer during downtime. Economic damages are not estimated for multi-unit residential buildings as their role in markets are less clearly defined than those of commercial buildings.
The model here for estimating these economic impacts utilizes three sets of input data: (1) state and county-level GDP information identifying contributions by different economic sectors, (2) mappings between economic sectors and land uses, and (3) economic multipliers by state and sector. These data sets are sourced from the BEA, First Street Foundation (FSF), and the BEA RIMS II, respectively. In order to link the existing parcel data to BEA-RIMS industry sectors, BEA data is mapped to a land use category consistent with the land use types included in the archetype development. The sector GDP data is summarized by land use to give “land use GDP”, or the economic contribution of a given land use category by state and county.
Next, the property database is used to generate total building square footage for buildings with retail and office land uses. The “land use GDP” is divided by the total square footage per land use to compute the expected land use GDP-per-sqft for each land use category by state and county. For each retail and office property with flooding, the estimated downtime, the building square footage is multiplied by the expected land use GDP-per-sqft. This is the property's direct economic damage. A deflator is used which assumes only 40% of activity decreases, as people may be able to work from home. It is also important to note that since the GDP information is provided on a state or county resolution and GDP for the land use categories involve the aggregation of multiple sectors, direct economic damages will not be an accurate portrayal of individual properties but should be considered only on a larger geographical scale, or labor market level.
Indirect damages are calculated by multiplying the direct damages by a land use multiplier, which is computed through utilizing the RIMS sector multipliers. These indirect damages account for economic activity like lost output, lost value, lost household earnings, and lost jobs (Bess and Ambargis, 2011). As the sectors used in the RIMS multipliers are much more specific than the land use categories utilized in the property data here (office and retail), a “land use multiplier” is computed for each of the two categories by taking a weighted average of each sector included within each land use category, based on the ratio of each included sector's contribution to GDP. This is done individually for each state.
Limitations
There are a series of limitations associated with this analysis. First, the FSF-FM is an estimate of current and future flood risk based on the Representative Concentration Pathways (RCP) 4.5 curve, which is a moderate expectation of current and future climate risk. The modeled water depths were produced as 50th percentile estimates along the 4.5 RCP curve and don't account for flood model uncertainties. Using those estimates, a first principles of engineering approach was taken to estimate flood damage and downtime for each commercial building. While this approach does take into account the expertise of cost estimators, it does not build its loss curves based on observed losses from payouts in the same way that HAZUS does. It is important to note that this is a necessary tradeoff due to the lack of available data regarding observed losses in the commercial space and this gives us the added ability to introduce downtime for repairs. Finally, the larger economic losses at the metropolitan area level are aggregate functions built on the BEA's industrial input-output multipliers. These are necessarily crude as we don't actually have detailed information regarding the local communities, workforce, supply chains, etc. In all, these areal damage estimates should be thought of as relative indicators of overall impact associated with the estimated risk that comes from the modeled depths used as the hazard input in this analysis.
Results
Metro Impacts
The distribution of the total number of buildings with risk and total structural damage costs by metropolitan area varies across the United States (Figure 3, made with Python package Geopandas). There are predominant patterns of high risk when considering structural damage costs in large cities where these types of office, retail, and multi-unit residential buildings are more likely to be concentrated. The top five metropolitan areas with the highest aggregated total structural damage costs across office buildings, retail buildings, and multi-unit residential buildings are the Miami, FL (with an estimated $1.07 billion in structural damages); New York, NY ($0.58 billion); Pittsburgh, PA ($0.45 billion); Boston, MA ($0.33 billion); and Houston, TX ($0.29 billion) metropolitan areas (Table 1).
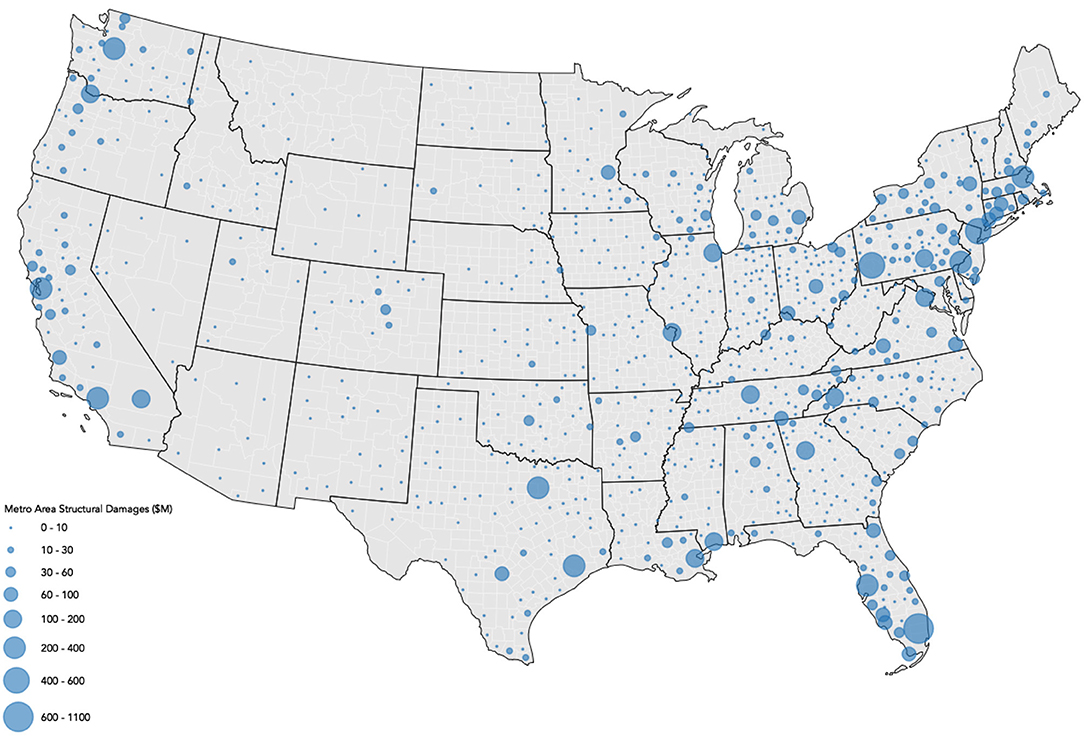
Figure 3. Metro structural damage costs.
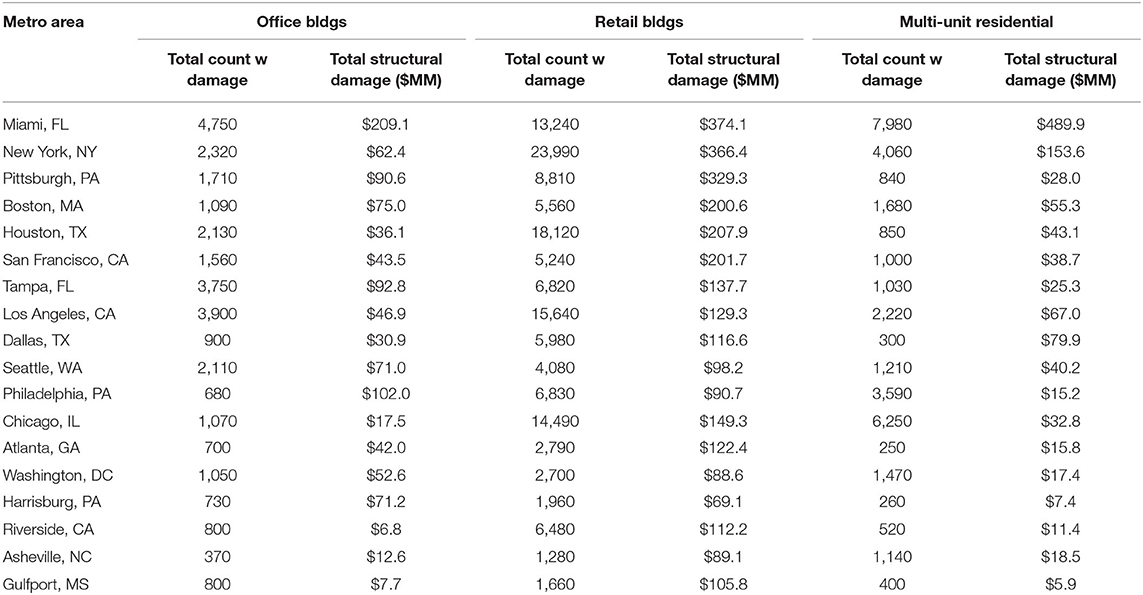
Table 1. Top 20 metropolitan areas ranked by current structural damages for commercial building types.
While there are similar patterns of large metropolitan areas showing up frequently within the top 20 rankings (Table 2) for highest amounts of aggregated total economic damages (direct and indirect economic damages across office and retail buildings), there are some differences in the ordering of the rankings. Differences in the ranking by total economic damage costs as compared to the ranking of total structural damages exist not only due to the exclusion of risk for multi-unit residential buildings, but also due to differences in the level of market activity by area. That is, some areas may be made up of more commercial building types that have high revenue per square foot and are integral components of supply chains, so downstream (indirect) impacts are large when operation is disrupted. The top five areas with the highest aggregate economic damages include Miami, FL (with a total estimated $4.96 billion in economic direct and indirect damages); New York, NY ($4.55 billion); Boston, MA ($2.47 billion); Pittsburgh, PA ($2.00 billion); and Philadelphia, PA ($1.61 billion) metropolitan areas.
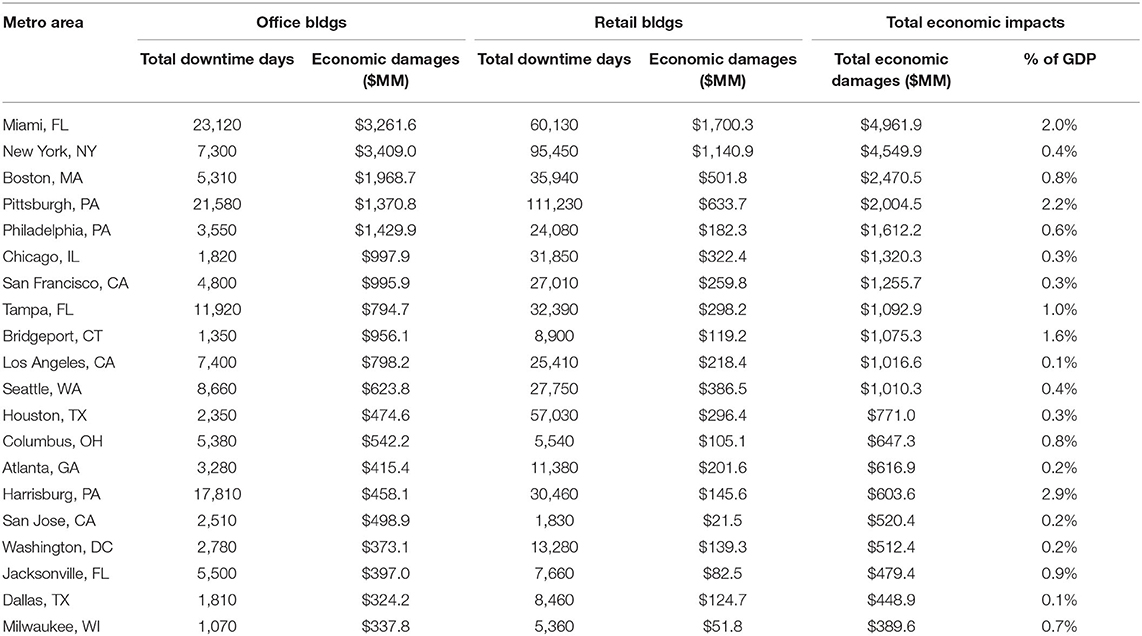
Table 2. Top 20 metropolitan areas ranked by current economic damages for office and retail buildings.
While rankings in Table 2 are by total economic damages (direct and indirect), total downtime days also vary by metropolitan area and by categorization of land use type (aggregated sectors of office and retail buildings). Not only is this due to the aggregation of economic damages for both categories for the ranking of total economic damages, but also because GDP contribution for each varies by area as well as the multipliers for each area. The final column of “% of GDP” refers to the total economic damages within the GDP associated with those land uses.
When looking at changes in damages over the next 30 years (to 2052) for areas which have the largest increases in structural damages, persistent patterns are displayed across the Gulf and east coast of the contiguous United States. When looking at the aggregate change of structural damage across all categories of office, retail, and multi-unit residential buildings, metropolitan areas within Texas, Louisiana, Florida, and North Carolina are predominantly displayed in the top 20 list. The top 5 areas for highest aggregate structural damage cost change are the Bay City, TX (with a 600.6% increase); Beaumont, TX (552.4% increase); Houma, LA (510.4%); Morgan City, LA (494.3%); and Lake Charles, LA (403.9%) metropolitan areas (see Figure 4).
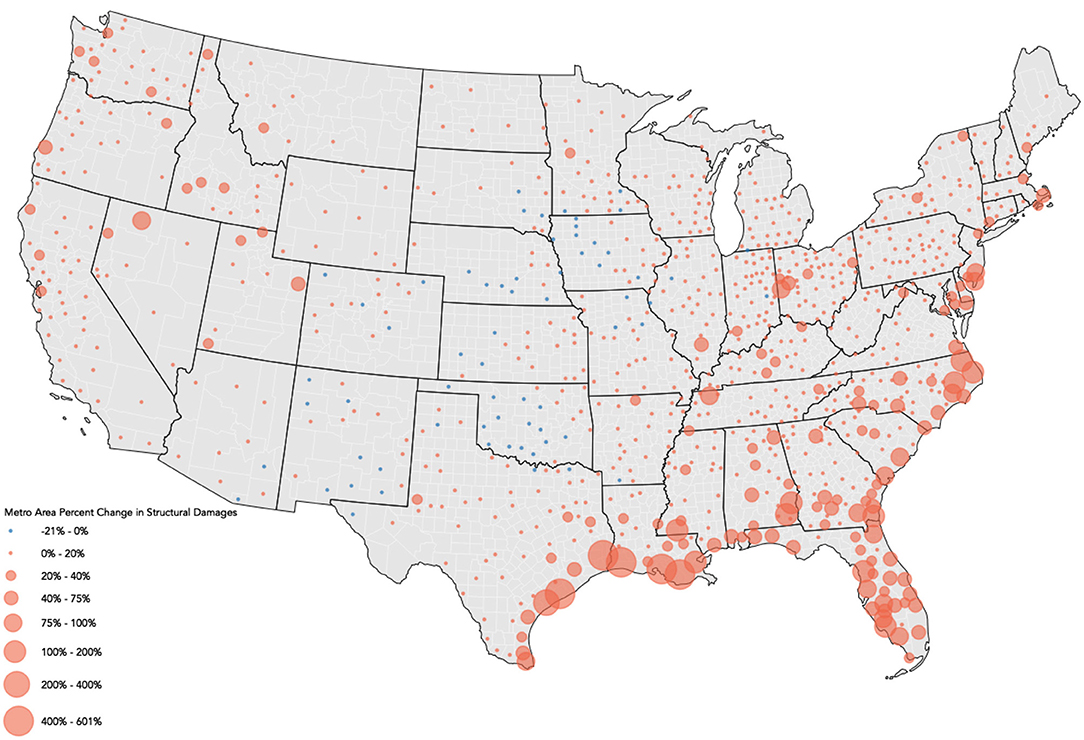
Figure 4. Change in metropolitan structural damages in the next 30 years.
An interesting point to note here is that across the four impact metrics captured within Table 3 (each represented by a column), while the ranking order refers to the largest percent changes in structural damage costs, different metropolitan areas will have different percent changes for the other metrics, which will also be useful for understanding relative risk over time. For example, the top 5 metropolitan areas on this list (by structural damage cost change) have varying levels of change when looking at their counts of structures with damage, where the top 5 list ranges from an 5.8 to 39.3% increase in the count of these structures. Meanwhile, Port Lavaca, TX, which is ranked as sixth on this list, has a 128.1% increase in the count of structures with damage over the next 30 years. This variability also exists for percent change in downtime days and economic damages, where the top 3 list ranges from a 450.4 to 804.6% increase in downtime days, and Morgan City, LA, which is ranked fourth, has an estimated 625.4% increase over the next 30 years. The top 3 list ranges from a 588.3 to 908.5% increase in economic damages, and Morgan City, LA has a 766.1% increase over the next 30 years.
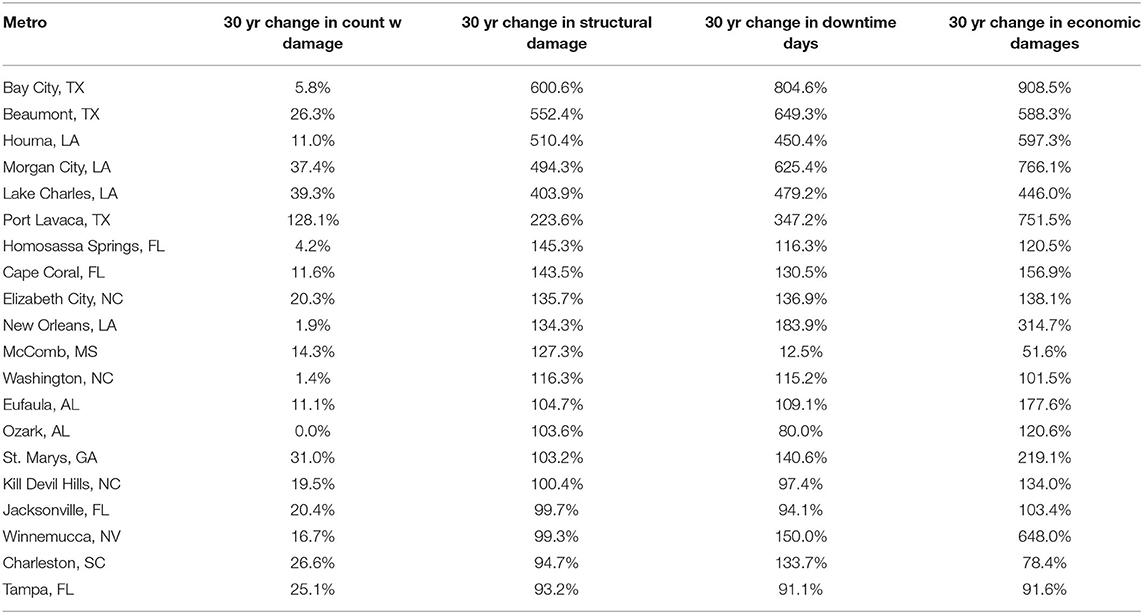
Table 3. Top 20 metropolitan areas ranked by change in structural damage in the next 30 years.
State Impacts
Similar to the variation by metropolitan area, the distribution of the total number of buildings with risk and total structural damage costs by state varies across the United States (Figure 5). The top five states with the highest aggregated total structural damage costs across office buildings, retail buildings, and multi-unit residential buildings are Florida (with an estimated $1.95 billion in structural damages); Pennsylvania ($1.22 billion); California ($1.19 billion); New York ($0.95 billion); and Texas ($0.82 billion) (Table 4). These 5 states also represent the top five states in regards to total population, meaning the risk to the commercial sector is primarily concentrated in densely populated areas.
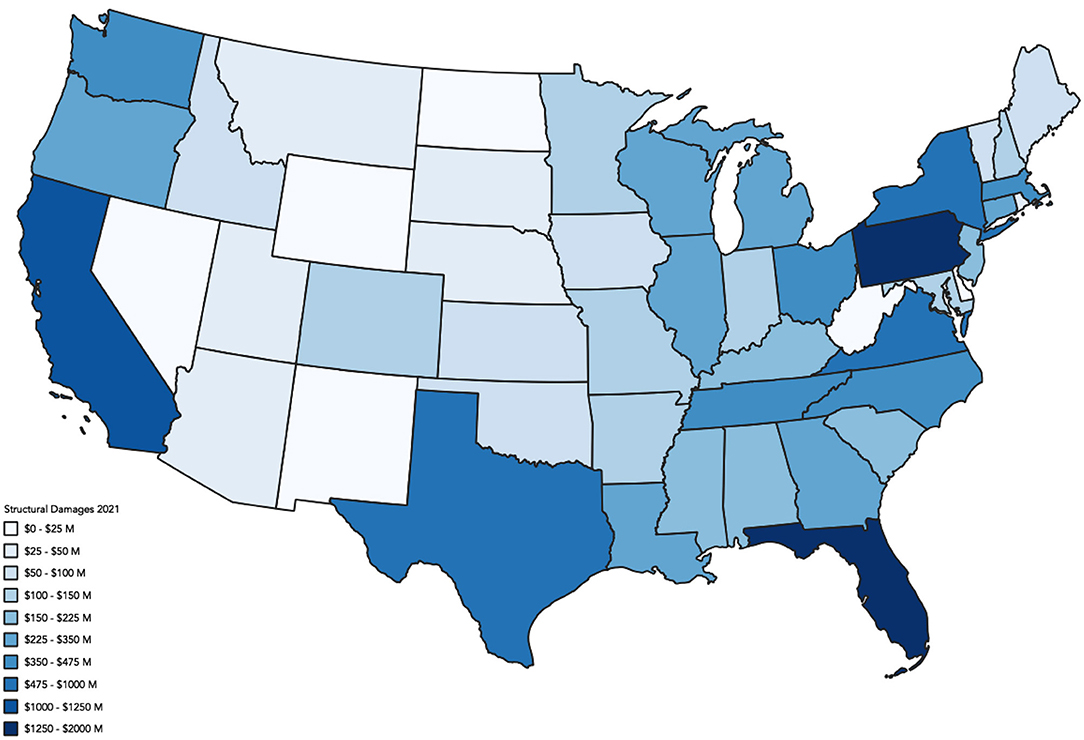
Figure 5. State structural damages.
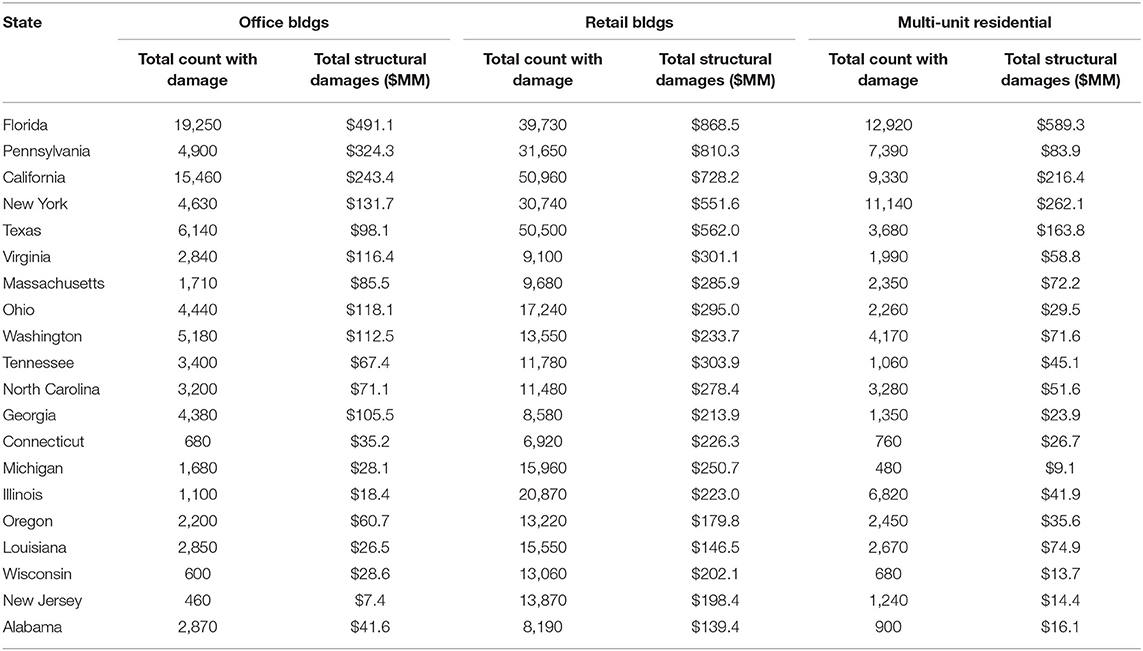
Table 4. Top 20 states ranked by current structural damages for commercial building types.
Table 5 shows the highest amounts of aggregated total economic damages (direct and indirect economic damages across office and retail buildings). In the table, most of the top 5 are consistent with the previous rankings, where Florida ($7 billion), New York ($5.4 billion), Pennsylvania ($5.2 billion) and California ($4.9 billion), and represent the top 4, but Massachusetts ($2.6 billion) replaces Texas ($2.2 billion). Similar to the patterns we find in the tables above, this indicates that the concentration of economic activity, as it relates to the commercial buildings at risk, is most concentrated in these states. This economic activity is most directly linked to the estimated days of building inoperability due to the modeled vulnerability of the commercial structures. Florida, e.g., is estimated to see over 265k days of loss accessibility to buildings at risk in the state. Of note, New York (165k days), Pennsylvania (345k days), California (151k days), Texas (139k days), and Ohio (129k days) are all expected to see the highest number of building interoperability days.
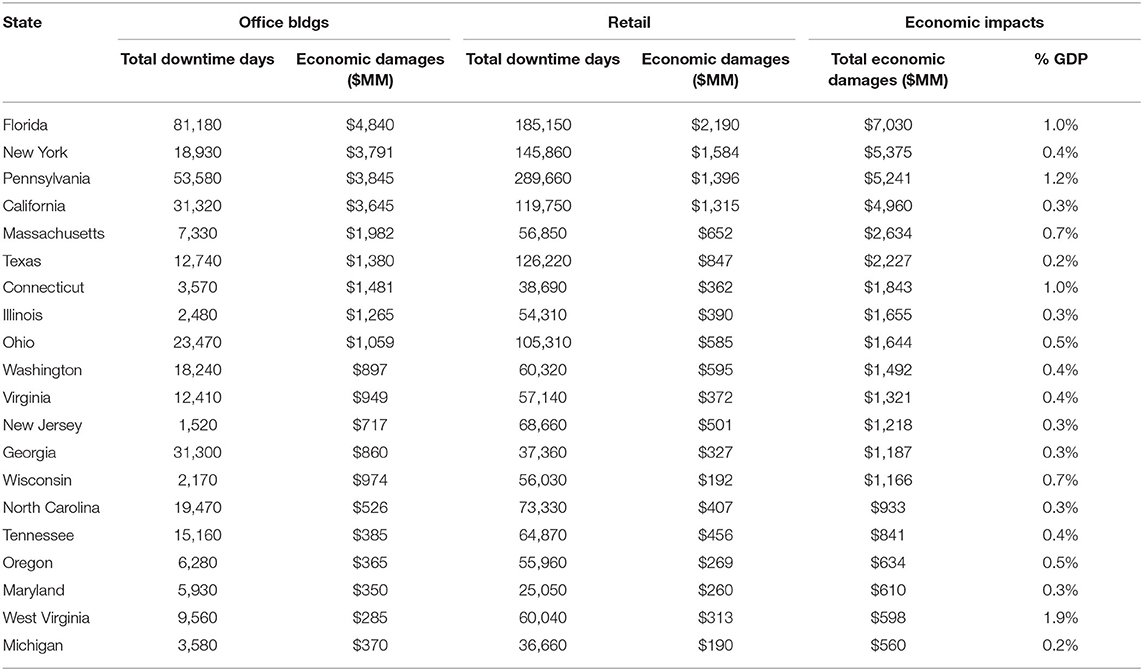
Table 5. Top 20 states ranked by current economic damages for office and retail buildings.
When looking at changes in damages over the next 30 years (to 2052) for areas which have the largest increases in structural damages, persistent patterns are displayed across the Gulf and east coast of the contiguous United States. When looking at the aggregate change of structural damage across all categories of office, retail, and multi-unit residential buildings, the states of Louisiana (130% increase), Florida (66% increase), Delaware (50% increase), South Carolina (46% increase), and Texas (40% increase) make up the top 5 (see Figure 6 and Table 6 about here).

Figure 6. Change in state structural damages in the next 30 years.
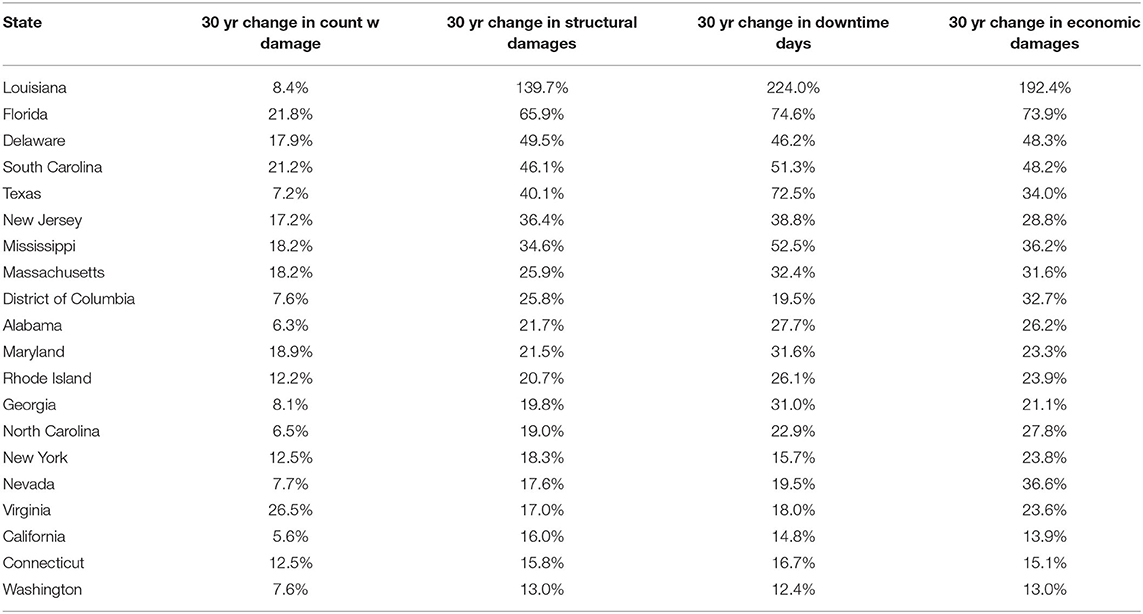
Table 6. Top 20 states ranked by change in structural damage in the next 30 years.
When only looking at the change in count of properties expected to experience damage, there is a different ordering with Virginia expecting to see the highest increase in the number of buildings estimated to be damaged (27%), followed by Florida (22%), South Carolina (21%), Maryland (19%), Massachusetts (18%) and Mississippi (18%). In regards to the largest increases in downtime days, Louisiana (224% increase), Florida (75% increase), Texas (73% increase), Mississippi (53% increase), and South Carolina (51% increase) are estimated to see the biggest increases in lost operability time of retail and office buildings. Finally, the largest increases in overall impacts to the larger economy are estimated to be felt in Louisiana (192% increase), Florida (74% increase), Delaware (48 increase), South Carolina (48% increase), and Texas (34% increase). Ultimately, all of these indicators continue to highlight the point that the largest risk today and into the future exists in currently vulnerable areas that are going to see their economic risk increase as the changing environment continues to increase the risk of flooding in these states.
Discussion
By coupling the high precision FSF-FM with the first principles of engineering approach employed in the development of the risk model, this analysis represents the first spatial risk analysis (with multiple risk metrics) of commercial properties at a national scale, developed at the precision of the building level. The results of the analysis indicate that there are currently 729,999 retail, office, and multi-unit residential properties at risk of annualized flood damage in the contiguous United States, and the absolute count of buildings at risk will grow by about 8% by the year 2052 as a result of climate change. The structural damage associated with this risk is currently over $13.5 billion annually and expected to grow to $16.9 billion over the same time period (~25.4% increase), with the combined lost days of building operation for all retail and office buildings growing from 3.1 to 4.0 million lost days of operation over that time period for existing structures (~29.1% increase). On top of the structural damage to the building structures, the economic impacts on local economies is estimated to grow from $26.8 billion in direct lost output and $23.0 billion in indirect impacts due to downtime days ($49.9 billion total) to $34.0 billion and $29.1 billion ($63.1 billion total), respectively (~26.5% increase over the time period).
Hazard information in existing research looking to model the flood exposure or risk of properties within the United States often relies on outdated inputs, low-resolution data, or overly simplistic modeling techniques. Within the United States, flood hazard information often relies on FEMA flood zone maps, which face many of these challenges. Worldwide, high-resolution and comprehensive flood hazard information are still difficult to obtain and integrate into flood risk assessments. Additionally, inadequate information specifying property use types (isolation of commercial buildings spatially) and other building characteristics for estimating vulnerability from damage functions also poses a challenge, especially when spanning wide geographical areas as it requires these data to be collected in a reliable and standardized manner. Flood risk models also often do not use specified damage functions appropriate for large buildings such as commercial buildings. As a result, damage functions are often tied to specified locations, are linear in nature, or are applicable most reliably for single family residential properties. Estimates of costs from flooding events often do not take into account economic impacts when an engineering approach to estimating loss is undergone, such as for structural damage functions. Finally, abilities of flood risk projections into the future are computationally difficult and require more data than is often available. With these opportunities in mind, the contributions of this model include:
• High Resolution Input Data: The development of a national scale, high-resolution commercial flood risk model is achieved through the input of high-resolution hazard and property data for the contiguous United States. Flood hazard data is sourced from the First Street Foundation Flood Model (FSF-FM; Bates et al., 2021). Property specific spatial parcel data is sourced from county-level property assessor records collected and standardized by Lightbox (a 3rd party data provider). These high-resolution data sources allow for high-precision risk assessments at a national level that many other sources of hazard and property data do not allow for.
• Multi-Source Flood Hazard Information: The high-resolution and nationally consistent flood hazard estimates include the integration of multiple sources of flooding. Many previous risk score developments rely on single-source hazard information (i.e., surge, riverine, rainfall, or tidal, or a limited combination of these sources resulting in lower model fidelity). The FSF-FM hazard information incorporates flooding from tidal, surge, fluvial, and pluvial sources for a more comprehensive characterization of flood hazard for the entire country. It also facilitates the quantification of average annual losses, an important indicator of risk.
• Multi-Return Period Hazard Information: A probabilistic approach for the magnitude of expected flooding and probabilities of the occurrences of those magnitudes is utilized in the hazard information, avoiding the limitations of other hazard sources where only a single hazard probabilistic layer is utilized. This allows for a better and more consistent view of flood hazard which varies across location and is based on the flood profile of each unique area.
• Component-Based Depth-Damage Functions: Depth-damage functions relate flood depth to structural damage and downtime days (length of time building is inoperable) for thirty building archetypes representing office, retail, and multi-unit residential spaces of various heights (low, mid, and high rise categories), construction material (timber versus non-timber), and basement configurations. Each archetype model was populated with typical building components, including structural members, equipment, plumbing, electrical lines, partitions, and finishes according to building properties such as area, height, and usage. This approach is unique as many previous research efforts have been limited by simple linear depth-damage functions based or are available primarily for single family residential properties.
• Integration of GDP and Economic Multipliers Information: GDP data by sector at the state and county level and economic multipliers by sector at the state level are utilized to create broad level estimates on the direct and indirect economic impacts caused by the downtime estimates for each retail and office property. These costs are typically undervalued in other approaches that consider only structural damage costs rather than economic impacts.
• Future Facing Risk: The FSF-FM additionally allows for the estimation of relative risk now and 30 years in the future. The same flood hazard modeling approach is utilized for the development of future flood hazard layers which is then applied to the existing property and vulnerability inputs to isolate the effects of a changing environment on existing vulnerability by holding development, population shifts, and adaptation efforts constant. This reduces uncertainty by focusing only on changes in existing risk rather than including information with additional uncertainty, allowing for more reliable identification of areas and infrastructure which may experience higher risk due to flood hazard today and in the future.
This study faces several limitations illustrating opportunities for improvement when high-resolution and consistent data are available. One of these limitations stems from the use of depth-damage functions to estimate building damage rather than multivariate models which make use of variables such as velocity, duration of inundation, or water contamination. These types of variables for the construction of multivariate models were not available at high-resolution and with future predictions within the flood hazard model utilized in this study. Additionally, damage functions for commercial buildings are difficult to validate against data such as from commercial insurance policies as they are not normally publicly available and its use in research is limited by privacy restrictions (UMD and TAMUG, 2018).
Related to economic impact estimations, there are several important opportunities for model improvement. Firstly, since the GDP information is provided on a state or county resolution and GDP for the land use categories involve the aggregation of multiple sectors, direct economic damages will not be an accurate portrayal of individual properties but should be considered only on a larger geographical scale, or labor market level. Urban areas and rural areas will have important differences in their economic impacts, so the integration of higher resolution economic data would also prove useful for a more comprehensive view of risk. Additionally, economic impacts are calculated based on downtime day estimates, which does not account for possibilities related to a business completely/permanently closing. Therefore, estimates will be biased upwards due to these underlying assumptions of a business continuing operations normally if repairs are finished. However, the effect will be mitigated when considering that business closure may result in larger/ongoing macro-economic impacts which are not accounted for here.
Additionally, an underlying assumption in the calculation of economic impact estimates is the appropriateness of the 40% deflator for activity reduction (such as where employees may be able to work from home). Appropriate deflator values are likely to vary by land use type/sector of the commercial building, so additional research identifying variations in these deflector values would prove useful when coupled with data specifying these land-use/sector types. Relatedly, the RIMS II multipliers for each state and sector exist as type 1 and type 2, where the type 2 multipliers not only consider the downstream impacts of foregone macro-level market transactions but also the impacts of foregone purchases due to employees' income being reduced from their place of work being closed. A key assumption utilized here is the appropriateness of the RIMS II type 1 multipliers over the type 2 multipliers. The type 1 multipliers were utilized as it was assumed that employee income and purchasing power would not be reduced. This relies on an additional assumption that most employees receive incomes through salary rather than hourly pay. This was accepted as an assumption here as there was not deemed to be adequate information or high resolution data allowing the informed application of type 2 multipliers. Therefore, results are likely more conservative than they would be if type 2 multipliers were used in addition to type 1 multipliers. When considering retail buildings such as restaurants where employees are more likely to be employed on an hourly basis and cannot as often work from home, this presents an obvious opportunity for model improvement when this type of high resolution data is available.
Conclusions
In this study, a framework is developed for flood risk assessment as related to commercial and multi-unit residential buildings and employed across the United States. A key objective of this paper is to create a methodology for estimating flood risk (measured by structural damage costs, downtime days, and economic impacts) at a high-resolution now and across the next 30 years with climate change as related to commercial buildings. Key developments here are the integration of high-resolution hazard information, appropriate depth-damage functions for commercial buildings, and economic data (GDP and multipliers tied to land-use types) for the estimation of commercial risk from probabilistic exposure to flood hazards in the present day and projected 30 years into the future. The structural damage, downtime days, and economic impact metrics provide common measures broadly related to vulnerability which may be useful for improving understanding of relative risk by location and over time. These metrics will also be useful for future research looking to improve risk estimates through the integration of additional high-resolution data such as variables useful for the creation of multivariate damage functions or the improvement of economic impact estimates.
Additionally, the framework developed here for the assessment and mapping of flood risk as related to commercial properties may be applied in other areas around the world which have similar data available, as well as in areas within the United States who have high quality data available for that location. Application of this methodology to other countries/locations is limited when the quantity and quality of data available is poor, and computational effort is high. Without high resolution hazard and property information, depth-damage functions for specific properties cannot be easily developed (multivariate depth damage functions are more difficult to apply, otherwise will need to use simpler depth-damage functions). Damage functions as developed here (since component based) are suitable for application to structural damage cost estimates as well as for downtime estimates. These downtime estimates facilitate the calculation of economic impacts (direct and indirect), so without this calculation these economic estimates will be much more difficult. Additionally, economic impact calculation is facilitated by data availability of GDP contribution and I-O multipliers (which also requires property information on land-use/sector types). These all illustrate the challenges of the application of the methodology developed here in areas where such data is not available.
The methodology and risk estimates provided by this study will be useful for prioritizing investment in purchasing decisions, mitigation and adaptation, and general planning for commercial markets, individuals, and governments. Providing high-resolution flood risk metrics for commercial buildings and markets contributes to a more holistic understanding of flooding and its physical and economic impacts through complementing alternative risk metrics such as those associated with residential properties, community infrastructure, critical infrastructure, and population demographics.
Data Availability Statement
The datasets presented in this study can be found in online repositories. The names of the repository/repositories and accession number(s) can be found at: https://registry.opendata.aws/fsf-flood-risk/.
Author Contributions
Material preparation, data collection, and analysis were performed by JP, MFA, NF, IA, MA, and JM. The first draft of the manuscript was written by ES. All authors contributed to the study conception and design, commented on previous versions of the manuscript, and read and approved the final manuscript.
Conflict of Interest
IA, MA, and JM were employed by ARUP.
The remaining authors declare that the research was conducted in the absence of any commercial or financial relationships that could be construed as a potential conflict of interest.
Publisher's Note
All claims expressed in this article are solely those of the authors and do not necessarily represent those of their affiliated organizations, or those of the publisher, the editors and the reviewers. Any product that may be evaluated in this article, or claim that may be made by its manufacturer, is not guaranteed or endorsed by the publisher.
Acknowledgments
The authors would like to acknowledge the immensely helpful contributions of First Street Foundation members including Sara Chadwick, Michael Lopes, Shannon Keane, Matthew Eby, and Ed Kearns and Arup team members Kenny Buyco, Hussein Moussa, Tom Smith, Karen Barns, Jack Hogan, Jelena Djurovic, Nicholas Bouvier, Kaustubh Bakare, Julian Olley, and Rebecca Birmingham in the development of the model and for feedback on early drafts of this manuscript.
References
Allaire, M. (2018). Socio-economic impacts of flooding: a review of the empirical literature. Water Secur. 3, 18–26. doi: 10.1016/j.wasec.2018.09.002
Applied Technology Council (2013). FEMA P-58 Seismic Performance Assessment of Buildings Volume 1 - Methodology. Available online at: https://femap58.atcouncil.org/documents/fema-p-58/24-fema-p-58-volume-1-methodology-second-edition/file (accessed October 25, 2021).
Armal, S., Porter, J. R., Lingle, B., Chu, Z., Marston, M. L., and Wing, O. E. (2020). Assessing property level economic impacts of climate in the us, new insights and evidence from a comprehensive flood risk assessment tool. Climate 8, 116. doi: 10.3390/cli8100116
Arup (2013). REDi Rating System: Resilience-Based Earthquake Design Initiative for the Next Generation of Buildings. Available online at: https://www.arup.com/perspectives/publications/research/section/redi-rating-system (accessed October 25, 2021).
Bates, P. D., Quinn, N., Sampson, C., Smith, A., Wing, O., Sosa, J., et al. (2021). Combined modeling of US fluvial, pluvial, and coastal flood hazard under current and future climates. Water Resources Res. 57, e2020WR028673. doi: 10.1029/2020WR028673
Bess, R., and Ambargis, Z. O. (2011). “Input-output models for impact analysis: suggestions for practitioners using RIMS II multipliers,” in 50th Southern Regional Science Association Conference (Morgantown, WV: Southern Regional Science Association), 23–27.
Cardona, O. D., van Aalst, M. K., Birkmann, J., Fordham, M., McGregor, G., Perez, R., et al. (2012). Determinants of Risk: Exposure and Vulnerability Coordinating Lead Authors Review Editors: Contributing Authors: Managing the Risks of Extreme Events and Disasters to Advance Climate Change Adaptation - A Special Report of Working Groups I and II of the Intergovernmental Panel on Climate Change (IPCC), 65–108.
Carrera, L., Standardi, G., Bosello, F., and Mysiak, J. (2015). Assessing direct and indirect economic impacts of a flood event through the integration of spatial and computable general equilibrium modelling. Environ. Model. Softw. 63, 109–122. doi: 10.1016/j.envsoft.2014.09.016
Cochrane, H. C. (2004). “Indirect losses from natural disasters: measurement and myth,” in Modeling Spatial and Economic Impacts of Disasters, eds Y. Okuyuma and S. E. Chang (Berlin: Springer), 37–52.
European Environmental Agency (EEA) (2012). Climate Change, Impacts and Vulnerability in Europe 2016. An indicator-based report. New York, NY: EEA Report No. 12/2012.
FEMA (2015). Summary of Databases in HAZUS-MH (General Building Stock). Available online at: http://www.fema.gov/summary-databases-HAZUS-multi-hazard
FEMA (2020). Hazus-MH Multi-hazard Loss Estimation Methodology: Flood Model. Technical Manual, FEMA Mitigation Division. Available online at: https://www.fema.gov/sites/default/files/2020-09/fema_hazus_flood-model_technical-manual_2.1.pdf
Green, C., Viavattene, C., and Thompson, P. (2011). “Guidance for assessing flood losses,” in Guidance for Assessing Flood Losses (Berlin).
Hossain, M. K., and Meng, Q. (2020). A fine-scale spatial analytics of the assessment and mapping of buildings and population at different risk levels of urban flood. Land Use Policy 99, 104829. doi: 10.1016/j.landusepol.2020.104829
Kousky, C., Walls, M., and Chu, Z. (2013). “Flooding and resilience: valuing conservation investments in a world with climate change,” in Resources for the Future Discussion Paper (Washington, DC), 13–38.
Löschner, L., Herrnegger, M., Apperl, B., Senoner, T., Seher, W., and Nachtnebel, H. P. (2017). Flood risk, climate change and settlement development: a micro-scale assessment of Austrian municipalities. Regional Environ. Change 17, 311–322. doi: 10.1007/s10113-016-1009-0
Luers, A. L., Lobell, D. B., Sklar, L. S., Addams, C. L., and Matson, P. A. (2003). A method for quantifying vulnerability, applied to the agricultural system of the Yaqui Valley, Mexico. Global Environ. Change 13, 255–267. doi: 10.1016/S0959-3780(03)00054-2
Lyons, D. (2020). Spirit airlines has seen enough hurricanes; it's moving some employees to Nashville. Sun-Sentinel.com. Available online at: https://www.sun-sentinel.com/business/fl-bz-spirit-moving-operations-center-20200214-puggqeofnneqxks7ici5y4pnny-story.html (accessed December 8, 2021).
Merz, B., Kreibich, H., and Lall, U. (2013). Multi-variate flood damage assessment: a tree-based data-mining approach. Natural Hazards Earth Syst. Sci. 13, 53–64. doi: 10.5194/nhess-13-53-2013
Messner, F. (2007). Evaluating Flood Damages: Guidance and Recommendations on Principles and Methods. T09-06-01. (Wllingford).
Mohleji, S., and Pielke, R. Jr. (2014). Reconciliation of trends in global and regional economic losses from weather events: 1980-2008. Natural Hazards Rev. 15, 04014009. doi: 10.1061/(ASCE)NH.1527-6996.0000141
NOAA National Centers for Environmental Information (NCEI) (2021). U.S. Billion-Dollar Weather and Climate Disasters. Available online at: https://www.ncdc.noaa.gov/billions/ (accessed October 25, 2021).
Nofal, O., and Van de Lindt, J. W. (2020). Minimal building flood fragility and loss function portfolio for resilience analysis at the community-level. Water 12, 2277. doi: 10.3390/w12082277
Nunn, R., O'Donnell, J., Shambaugh, J., Goulder, L. H., Kolstad, C. D., and Long, X. (2019). Ten Facts About the Economics of Climate Change and Climate Policy: A Joint Report From the Hamilton Project and the Stanford Institute for Economic Policy Research. Washington, DC: The Hamilton Prokect Brookings Stanford Institute for Economic Policy Research.
Okuyama, Y. (2007). Economic modeling for disaster impact analysis: past, present, and future. Econ. Syst. Res. 19, 115–124. doi: 10.1080/09535310701328435
Porter, J. R., Shu, E., Amodeo, M., Hsieh, H., Chu, Z., and Freeman, N. (2021). Community flood impacts and infrastructure: examining national flood impacts using a high precision assessment tool in the United States. Water 13, 3125. doi: 10.3390/w13213125
Przyluski, V., and Hallegatte, S. (2011). Indirect costs of natural hazards. CONHAZ Report WP 2, 383–398. doi: 10.1596/1813-9450-5507
Pulsinelli, O. (2017). Hewlett Packard Enterprise to move out of Houston campus due to flooding. Houston Business J. p. 2017.
Reisinger, A., Howden, M., Vera, C., et al. (2020). The Concept of Risk in the IPCC Sixth Assessment Report: A Summary of Cross-Working Group Discussions. Geneva: Intergovernmental Panel on Climate Change.
Romali, N. S., and Yusop, Z. (2021). Flood damage and risk assessment for urban area in Malaysia. Hydrol. Res. 52, 142–159. doi: 10.2166/nh.2020.121
Rose, A. (2004). “Economic principles, issues, and research priorities in hazard loss estimation,” in Modeling Spatial and Economic Impacts of Disasters, eds Y. Okuyuma and S. E. Chang (Berlin: Springer), 13–36.
Santos, J. R., Yu, K. D. S., Pagsuyoin, S. A. T., and Tan, R. R. (2014). Time-varying disaster recovery model for interdependent economic systems using hybrid input-output and event tree analysis. Econ. Syst. Res. 26, 60–80. doi: 10.1080/09535314.2013.872602
Sausser, L., and Johnson, C. (2021). Roper Hospital plans historic move off Charleston peninsula, citing flooding, other issues. The Post and Courier. Available online at: https://www.postandcourier.com/news/roper-hospital-plans-historic-move-off-charleston-peninsula-citing-flooding-other-issues/article_784ad6ae-3c9c-11ec-93ee-77672af5ce24.html (accessed December 8, 2021).
Scawthorn, C., Flores, P., Blais, N., Seligson, H., Tate, E., Chang, S., et al. (2006). HAZUS-MH flood loss estimation methodology. II. Damage and loss assessment. Natural Hazards Rev. 7, 72–81. doi: 10.1061/(ASCE)1527-6988(2006)7:2(72)
Schröter, K., Kreibich, H., Vogel, K., Riggelsen, C., Scherbaum, F., and Merz, B. (2014). How useful are complex flood damage models?. Water Resour. Res. 50, 3378–3395. doi: 10.1002/2013WR014396
Shultz, S. (2017). The extent and nature of potential flood damage to commercial property structures in the Midwestern United States. J. Contemp. Water Res. Educ. 161, 81–91. doi: 10.1111/j.1936-704X.2017.3253.x
Thieken, A. H., Olschewski, A., Kreibich, H., Kobsch, S., and Merz, B. (2008). Development and evaluation of FLEMOps-a new Flood Loss Estimation MOdel for the private sector. WIT Trans. Ecol. Environ. 118, 315–324. doi: 10.2495/FRIAR080301
U.S. Army Corps of Engineers (USACE) (2009). Louisiana Coastal Protection and Restoration Technical Report. New Orleans, LA: U.S. Army Corps of Engineers.
U.S. Army Corps of Engineers (USACE) (2012). Planning SMART Guide. Available online at: https://planning.erdc.dren.mil/toolbox/smart.cfm?Section=1&Part=0 (accessed October 25, 2021).
UMD and TAMUG (2018). The Growing Threat of Urban Flooding: A National Challenge. College Park, MD: A. James Clark School of Engineering. University of Maryland, Center for Disaster Resilience (UMD), and Texas A&M University, Galveston Campus, Center for Texas Beaches and Shores (TAMUG).
Keywords: flood risk, damage, loss functions, commercial real-estate, downtime
Citation: Porter JR, Shu EG, Amodeo MF, Freeman N, Bauer M, Almufti I, Ackerson M and Mehta J (2022) Commercial Real-Estate at Risk: An Examination of Commercial Building and Economic Impacts in the United States Using a High-Precision Flood Risk Assessment Tool. Front. Water 4:875995. doi: 10.3389/frwa.2022.875995
Received: 14 February 2022; Accepted: 24 March 2022;
Published: 03 May 2022.
Edited by:
Alban Kuriqi, Universidade de Lisboa, PortugalReviewed by:
Artan Hysa, Epoka University, AlbaniaMartina Zelenakova, Technical University of Košice, Slovakia
Dariusz Młyński, University of Agriculture in Krakow, Poland
Copyright © 2022 Porter, Shu, Amodeo, Freeman, Bauer, Almufti, Ackerson and Mehta. This is an open-access article distributed under the terms of the Creative Commons Attribution License (CC BY). The use, distribution or reproduction in other forums is permitted, provided the original author(s) and the copyright owner(s) are credited and that the original publication in this journal is cited, in accordance with accepted academic practice. No use, distribution or reproduction is permitted which does not comply with these terms.
*Correspondence: Jeremy R. Porter, anBvcnRlckBnYy5jdW55LmVkdQ==