 Angel Negrete Velasco
 Stéphan Ramseier Gentile
 Stéphane Zimmermann2
 Serge Stoll
95% of researchers rate our articles as excellent or good
Learn more about the work of our research integrity team to safeguard the quality of each article we publish.
Find out more
ORIGINAL RESEARCH article
Front. Water , 05 April 2022
Sec. Water and Human Health
Volume 4 - 2022 | https://doi.org/10.3389/frwa.2022.835451
This article is part of the Research Topic Microplastics in Water and Potential Impacts on Human Health View all 6 articles
Microplastics have been detected all around the globe in freshwaters which are frequently used to produce drinking water. Therefore, the contamination of raw water with microplastics that supplies drinking water treatment plants, and their removal efficiency is raising more concern and interest. In the present study, we evaluated the microplastic contamination in a conventional drinking water treatment plant (Geneva, Switzerland) and the contribution of coagulation on the efficiency of the filtration systems (sand and activated carbon filtrations) in the removal efficiency of microplastics (MPs) and synthetic fibres. This work was performed in a pilot station that replicates the main drinking water treatment process. Raw water and effluents of each filtering processes were analysed for the presence of MPs and synthetic fibres with sizes ≥ 63 μm using infrared spectroscopy. The contamination of MPs in raw water and in drinking water ranged from 19.5 to 143.5 MPs/m3 and from 0 to 8 MPs/m3 (in presence and absence of coagulant), respectively. On the other hand, concentration of synthetic fibres ranged from 7.7 to 23.8 synthetic fibres/m3 in raw water and from 0 to 3 synthetic fibres/m3 in drinking water. Results show that on average 89% of microplastics and 81% of synthetic fibres (≥63 μm) are retained in water treatment in absence of coagulant. Better final removal efficiency of microplastics (97%) and synthetic fibres (96%) was observed in drinking water with coagulation treatment. The chemical composition of microplastics and synthetic fibres is found more heterogeneous in raw water than after sand filtration and activated carbon filtration.
Owing to the relatively low production costs and more attractive physicochemical properties than other materials, the use of plastics has rapidly grown since the 1950's. Plastics are used in many consumer products, like plastic bags, food packaging and dispensable utensils, among other single use objects. Consequently, plastic production has increased over years, arriving to over 350 million tonnes in 2019 (Plastics Europa, 2019). Furthermore, plastics are resistant to degradation that will persist in the environment. These factors, and others, ultimately lead to the accumulation of plastics in the environments (da Costa et al., 2016). In 2015, it was estimated that around 60% of plastics ever produced end up being in natural environments (Geyer et al., 2017).
Plastics have been categorised depending on their sizes as macroplastics (>20 mm), mesoplastics (5–20 mm), and microplastics (1 μm−5 mm) (Barnes et al., 2009). Microplastics can be further classified, depending on their origin, as primary (made of small sizes like pellets, sequins or microbeads which are mainly used in cosmetics or decorative products) or secondary (as a result of the breakdown of bigger plastic materials). Microplastics reach freshwater systems (Eerkes-Medrano et al., 2015; Horton et al., 2017) regardless their sizes, shapes and chemical compositions and are found both at significant concentrations in water columns and sediments (Colton et al., 1974; Kühn et al., 2018). Some important rivers in Europe have been studied to assess the contamination of microplastics, for instance, the Rhine (Klein et al., 2015; Mani et al., 2015), the Seine (Dris et al., 2018), the Danube (Lechner et al., 2014), and the Rhône (Constant et al., 2020). The contamination in lakes (Eriksen et al., 2013; Hu et al., 2020; Bertoldi et al., 2021) have also been assessed in some parts of the world and it has been shown that even remote environments do not escape from this contamination (Allen et al., 2019; González-Pleiter et al., 2020). In Switzerland, microplastic and fibre contamination of water and sediment of a remote alpine lake (Lake Sassolo) was recently reported. Average concentration of microplastics (≥125 μm) in the water column was found equal to 2.6 microplastics/L, whereas 33 microplastics/kg were detected in the sediment (Negrete Velasco et al., 2020). Furthermore, Faure et al. carried out a study to evaluate the contamination of the six biggest lakes in Switzerland (Faure et al., 2015; Faure and De Alencastro, 2016). They found microplastics and textile fibres in the surface waters and beach sediments of Lake Geneva, Lake Constance, Lake Maggiore, Lake Neuchatel, Lake Zurich, and Lake Brienz. On average, 220,000 ± 160,000 and 33,000 ± 46,000 microplastics/km2 were found on the surface of Lake Geneva (Grand Lac and Petit Lac, respectively), we estimated to be around 0.2 microplastics/m3 based on the information given by the authors. Recently, another study carried out by Oceaneye (2020) showed that the average contamination of microplastics (>300 μm) in Lake Geneva was of the same order of magnitude as in North Atlantic sea (53,817 particles/km2) and ocean average value (32,000 particles/km2). In addition to the contamination of microplastics in water resources, the occurrence of hazardous elements (like Cd, Hg, and Pb) at elevated concentrations adsorbed or incorporated on microplastics has been studied in beaches of Lake Geneva (Filella and Turner, 2018).
Since microplastics have been detected in freshwaters (Pivokonsky et al., 2018; Ferraz et al., 2020; Wang et al., 2020) at significant concentrations, assessing the concentration of microplastics in tap water has raised interest so as to evaluate related hazard and risk (Kosuth et al., 2018; Shruti et al., 2020; Kirstein et al., 2021). An investigation conducted by Kosuth et al. (2018) recently shows the contamination of 81% of tap water with microplastic and synthetic fibres from 14 countries sampled around the globe (Kosuth et al., 2018). Samples in the EU (England, France, Germany, Ireland, Italy, Slovakia and Switzerland) presented lower mean concentrations (3.6 particles/L) than other regions in the world, such as in USA (6.24 particles/L) or India (9.24 particles/L). In contrast, Mintenig et al. (2019) reported between 0 and 7 microplastics/m3 (with sizes > 20 μm) in raw water (from groundwater sources) and in the resulting drinking water. Furthermore, the removal efficiency of microplastics in drinking water treatment plants has been reported in some studies. In 2017, Pivokonsky et al. observed the lowest removal efficiency (around 70%) of microplastics in a conventional drinking water treatment plant involving coagulation/ flocculation and sand filtration. It was found that 83% of microplastics were removed on average from raw water in two drinking water treatment plants in Czech Republic performing coagulation/flocculation, in presence of sedimentation or flotation, sand filtration and granular activated carbon filtration (Pivokonsky et al., 2018). Surprisingly, they found microplastic concentration up to 650 microplastics (>1 μm) per litre. The removal efficiency at every treatment step (coagulation/flocculation, sedimentation, sand filtration, and activated carbon filtration) was also assessed in drinking water treatment plants with raw water providing from the Yangtze River (China; Wang et al., 2020) and Úhlava River (Czech Republic; Pivokonský et al., 2020). Cumulative removal efficiencies >72% were achieved in both studies, however, the concentrations of microplastics in drinking water ranged between 930 and 151 microplastics/L. On the other hand, the effects of coagulation-flocculation and filtration systems were studied in laboratory experiments (Ma et al., 2019; Lapointe et al., 2020; Shahi et al., 2020; Skaf et al., 2020), utilising concentrations (10–50 mg/L) of alum coagulant largely exceeding those typically used in conventional water treatment plant (0.3–0.5 mg Al3+/L).
Currently, to the best of our knowledge, no study has been published about the impact of coagulation on sand filtration and activated carbon filtration processes in realistic conditions. Indeed, it is not possible to suppress or interfere with the coagulation in a regular and operational drinking water treatment plant. In the present study, we used a pilot scale drinking water treatment plant (DWTP) which is the replica of the main DWTP of Geneva. This pilot scale reproduces all the processes and conditions which are used in the main station which supplies drinking water for 500,000 consumers. The goal of this study is to evaluate microplastic and fibre contamination and the contribution of coagulation to the overall efficiency of the filtration systems (sand and activated carbon) in the removal of microplastics and synthetic fibres. Sample volumes were at least equal to 1,000 L over a sample period of 23–30 h, hence obtaining a representative sample in terms of volume [as recommended by Koelmans et al. (2019) and Mintenig et al. (2019)] and time.
Synthetic fibres were considered in the present study as a specific type of microplastic. Indeed, in addition to their morphologies, potential difficulties in separation and characterisation, they have also emerged as a relatively new area of study such as the shedding of microfibers from synthetic fabrics during conventional clothes washing (Hartline et al., 2016; De Falco et al., 2019) and fall out in indoor environments (Zhang et al., 2020). Like many other types of microparticles, fibres have been found in natural compartments, fauna and urban areas (Remy et al., 2015; Dris et al., 2017; Gasperi et al., 2018; Collard et al., 2019). Moreover, textile fibres, regardless of their nature, could contain additives and dyes (including nanoparticles), which are in some cases hazardous to wildlife and humans (Darbra et al., 2012; Remy et al., 2015; Gita et al., 2019).
The drinking water pilot station that was subjected to investigation uses raw water from Lake Geneva. This pilot station (Figure 1A) replicates the main drinking water treatment plant (DWTP) in Geneva, which is designed to produce drinking water for 500,000 users. The treatment processes involve essentially raw water pre-treatment, sand filtration, activated carbon filtration and pH correction to achieve calco-carbonic equilibrium, as shown in (Figure 1B). Water from Lake Geneva is first chlorinated, 1 mm screen (strainer) filtered and pumped to supply the drinking water treatment plant and pilot station. The average flow of raw water entering the pilot station is 1 m3/h. Polyaluminum chloride PAlCl, (Al(OH)m Cl(3−m))n Gilufloc 83 (BK Giulini GmbH, Germany) with 83% basicity and containing 23% Al2O3 is used to promote coagulation at a concentration of 0.36 mg Al3+/L. Then pre-treated water flows through a conduct of 40 m to allow the coagulant to react (5 min reaction) before passing through a bilayer sand philtre of quartz sand (h = 80 cm depth) and pumice stone (h = 50 cm depth) at a filtration speed of 5 m/h (rapid sand filtration). The water passes afterwards through an activated carbon philtre that has the same dimension as the sand philtre and is made up of a mixture of Chemviron F300 (75%) and AquaCarb (25%). Both philtres have a quartz gravel support layer of 35 cm. Sampling is performed via fountains (Supplementary Figure 1) providing water from raw water, before (coagulation), after sand filtration and after activated carbon filtration.
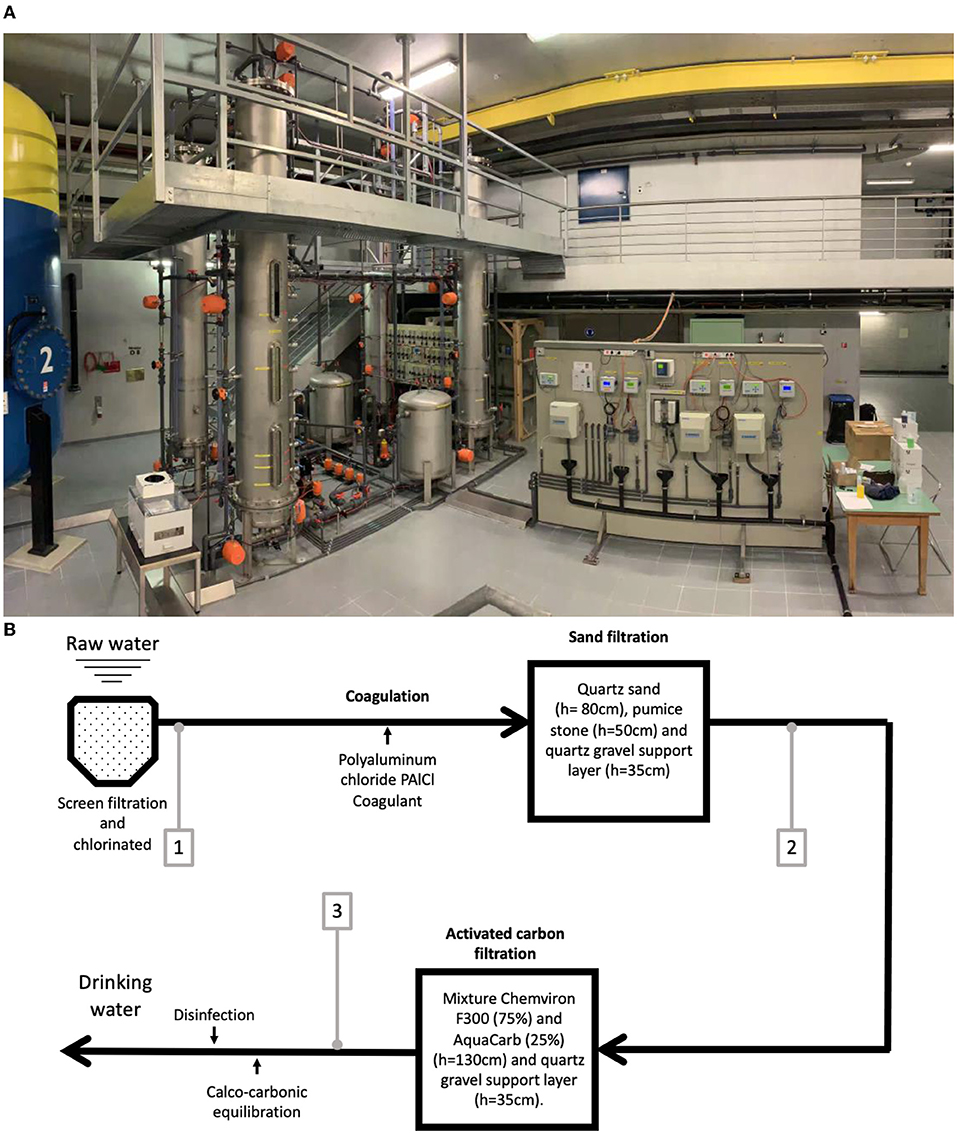
Figure 1. Picture of the corresponding pilot station (1 m3/h) that replicates the main DWTP in Geneva (A) and scheme of the drinking water treatment with marked sampling sites (1/2/3) (B).
The sampling campaigns were carried out in a first time to evaluate the filtration systems (sand and activated carbon) without coagulant, and in a second time in the presence of coagulant. The physicochemical parameters (pH, turbidity, and conductivity) were checked before sampling in order to ensure that the sampling was conducted with stable conditions. Values are given in Supplementary Tables 1, 2. The flow rate of the sampling fountains was carefully measured in triplicate before and after the samplings. We aimed for representative samples and considered volumes between 1,000 and 1,950 L of raw water, before and after sand filtration and after activated carbon filtration (ACF) The samples were passed under gravity at the pilot station fountains through a set of four stainless steel sieves (ISO 3310-1) of 200 mm diameter with 500, 250, 125, and 63 μm mesh sizes.
Special attention needs to be paid when working with drinking water samples regarding contamination issues. In this work, several precautions were taken to reduce the contamination of the sample with microplastics and fibres in accordance with the literature (Schymanski et al., 2021). All experiments were conducted in special laboratory rooms devoted to microplastics analyses. In particular, the working room was closed during manipulations to avoid air currents. Floor was mopped with soap and filtered ultrapure water, and all work surfaces were wiped down with ethanol prior to starting work. The use of plastic materials was reduced as much as possible in the laboratory, although they could not be avoided entirely. The only plastic materials used were nitrile gloves and the washing bottle made of Teflon FEP (Thermo Fischer Scientific, New York, USA). Despite the degree of quality of the ultrapure water (Milli Q water, Millipore, Schaffhausen, Switzerland, with R > 18 MΩ·cm), it was systematically filtered with a nitrate cellulose philtre (0.45 μm, Sartorius stedim biotech, Göttlingen, Germany) in a glass filtration unit (VWR, Leuven, Belgium) to remove all microplastics and fibres that the plastic parts of the Milli Q water instrument could release. This filtered ultrapure water was stored in a glass drum for upcoming uses. All glassware and sieves were washed with soap, natural bristles brushes and rinsed with filtered ultrapure water. Only cotton clothing was always worn, even under the cotton lab coat. A lint roller was used to remove all fibres attached to the clothes and lab coat, in order to reduce a possible intake of fibres into the samples. All materials were covered with aluminium foils when they were stored, transported and during sampling.
Since laboratory working conditions are important to improve the quality and comparability of results (Koelmans et al., 2019; Cowger et al., 2020; Schymanski et al., 2021), the working environment was evaluated with one positive control and one blank per sampling campaign. The positive control was assessed with microplastic glitter particles (n = 50) of 430 μm (smallest dimension), bought in a recreative store, mixed with 20 L filtered ultrapure water. Positive control and blank samples were subjected to the same procedure as a regular sample.
The retained material in the steel sieves were transferred with 100 mL filtered ultrapure water to 250 mL glass beakers to proceed with a digestion of the organic matter. A volume of 100 mL of an hydrogen peroxide (H2O2 30% wt, REACTOLAB SA, Servion, Switzerland) solution was added to the beakers and left at 60°C. Hydrogen peroxide was chosen to digest natural organic matter over other digestion techniques (with strong acids or bases) that could be more aggressive or less convenient (Hanvey et al., 2017; Renner et al., 2018). This oxidant was also used in the digestion of compost, sediments, wastewater and freshwater samples in other experiments conducted in our group, showing good results in degradation of organic matter and not affecting visual identification. Therefore, this extraction protocol was based on Negrete Velasco et al. (2020), but adjusted according to the type of sample and the objectives of this work. After 5 days of digestion, the samples were filtered with a 63 μm stainless steel mesh of 100 mm diameter. The recovered material from the 250 and 500 μm sieves was transferred to 0.45 μm nitrate cellulose philtres (0.45 μm, Sartorius stedim biotech, Göttlingen, Germany). The material retained on the 63 and 125 μm sieves was transferred to aluminium oxide (Al2O3) philtres (Anodisc™ 47, 0.2 μm, GE Healthcare Life Sciences Whatman™, Buckinghamshire, United Kingdom) for chemical identification of the microparticles with FT-IR. All philtres were stored immediately after filtration in clean glass Petri dishes.
The whole surface of the cellulose nitrate philtres was first observed using an optical microscope (Olympus BX-40, Tokyo, Japan) to achieve a qualitative analysis. The microscope is equipped with a 2x, 4x, 10x optical lens for the collection of images of the philtres surface. The microparticles and fibres were then transferred to the support of the spectrometer (Spectrum Two FT-IR, Perkin Elmer, Beaconsfield, United Kingdom) to be analysed by attenuated total reflectance (ATR).
Regarding the aluminium oxide philtres, they were placed in the moving stage of the FT-IR spectrometer coupled to an optical microscope (Spotlight 200i FT-IR microscopy system, PerkinElmer, Beaconsfield, United Kingdom), which is equipped with a mercury cadmium telluride (MCT) detector with aperture range between 10 and 100μm. Due to the time-consuming analysis, no systematic observation of the entire surface of the Al2O3 philtres was performed and only a quarter of the surface was analysed following the model presented in Supplementary Figure 2. This model is a combination of cake slice and random models (Schymanski et al., 2021). All microparticles were observed and in most cases tested by FT-IR, excepted when mineral microparticles were suspected (no transmittance signal). All data were collected with a resolution ≤ 8 cm−1 and ≥ 8 co-added scans in accordance with Schymanski et al. (2021). The obtained spectra with the Spectrum software (version 10.5.3, Perkin Elmer) were subjected to a library search using the ATR Perkin Elmer polymer library (with over 100 spectra). The entire overlap region (600 to 4,000 cm−1) was used for the ATR spectra, while a spectral range was defined between 1,250 and 4,000 cm−1 for FT-IR analysis because of the absorption properties of the Al2O3 philtre. Indeed, the use of the entire overlap region (600 to 4,000 cm−1) using Al2O3 philtres decreases the degree of correlation in FT-IR analysis. Microparticles and fibres having spectra with a search score higher than 75% of coincidence with a polymer in the library were considered as microplastic or synthetic fibres. Therefore, chemical identification with infrared spectroscopy was mainly based on a threshold of 75% correlation rate. Special attention was paid with nylon (polyamide PA) during the interpretation of spectra, since the spectrum of nylon is quite similar to some proteins, and false positive is likely to occur (Schymanski et al., 2021).
In the present study, considered microparticles were comprised in sizes between 63 and 1,000 μm and divided in four classes of sizes (≥63 to <125 μm, ≥125 to <250 μm, ≥250 to <500 μm, and ≥500 μm). The size of particles was defined with the mesh and verified with the software measuring instruments (OLYMPUS cellSens Entry and Spectrum IR) of the respective microscopes. Regarding the size verification with FT-IR coupled to an optical microscope, the marker of the IR light was fixed with the lower and upper boundary (for example 63 × 125 μm) to ensure the correct class of size of the particle. Moreover, microparticle classification was based both on the nature of the microparticles and shape. On one hand, we considered MPs (fragments, films, pellets, beads, and foams), and on the other hand, mineral and organic microparticles that were also extracted from sample analysis. A distinction was made for fibres, since they can be natural, semi synthetic or synthetic and which constitute a specific type of microparticles. Therefore, microparticles were divided into four groups: non plastic microparticles, microplastics (MPs) (including fragments, films, pellets, foam, and beads), non-synthetic fibres (natural and semi-synthetic), and synthetic fibres.
Positive control resulted in recovery rate of 96% of the microplastic glitter particles (Supplementary Figure 3). This value is similar to that reported by Enders et al. (2020) with PA microplastics of 450 μm. One blank of ultrapure water was analysed in parallel with each sampling campaign to assess the potential contamination during sample treatment. No MPs nor synthetic fibres were detected in the blanks. However, between 32 and 80 non-synthetic fibres/L (mainly white) were found in the blanks. Chemical nature of most of these fibres were not possible to identify due to the lack of reference materials in the libraries (home-made and ATR Perkin Elmer library). The values obtained in the blanks were, nevertheless, lower than those obtained during the validation stage of the method (data not presented).
Non plastic microparticles (organic and mineral) were not counted in this study and only the results of fibres identified as synthetic were presented as a significant number of non-synthetic fibres was found in the blank samples. MPs and synthetic fibres were found in all samples of raw water, examples of MPs and synthetic fibres images obtained by microscopy are shown in Table 1. Average concentration of MPs in raw water was found equal to 95 ± 49 MPs/m3 whereas the average concentration of synthetic fibres was 15 ± 7.7 synthetic fibres/m3. These values were higher than those reported by Faure et al. (2015) in the surface of Lake Geneva (around 0.2 MPs/m3, with sizes >300 μm) but lower than those reported in raw waters of DWTP in Yangtze River (China): around 600 MPs/L (Wang et al., 2020) and Úhlava River (Czech Republic): between 4 and 80 MPs/L (Pivokonský et al., 2020) by considering only microplastics with a diameter >50 μm. This difference could be explained by the fact that different sizes were analysed, and that raw water is extracted from Lake Geneva at a depth of 30 m. Indeed, microplastic concentrations has been found to be heterogeneous in the water column, with lower microplastic concentrations in intermediate layers than near-surface or near-bottom layers (Zobkov et al., 2019).
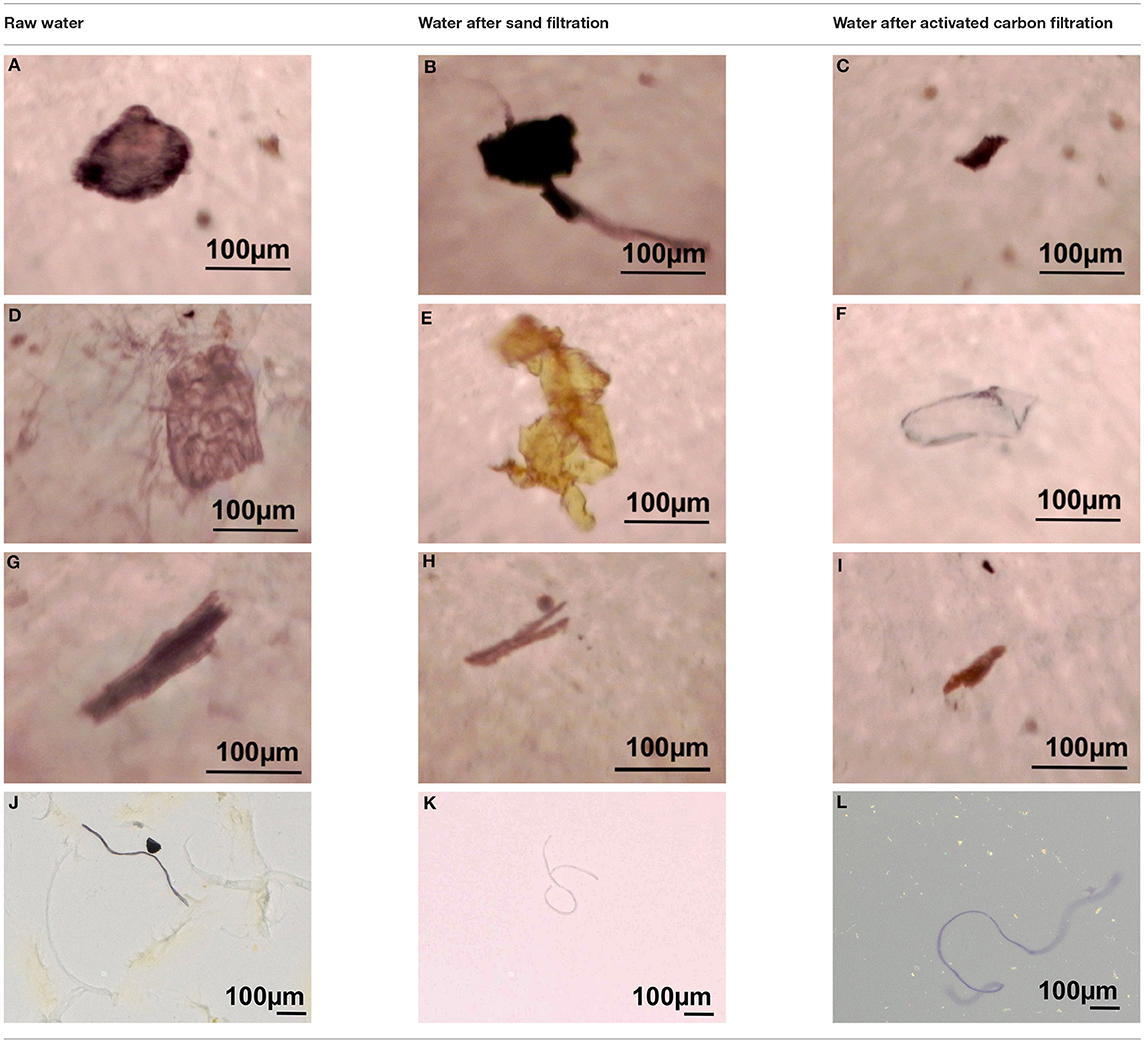
Table 1. Examples of MPs (A–F) and synthetic fibres (G–L) pictures obtained with IR microscope (A–I) and optic microscope (H–L) found in raw water (left column), after sand filtration (middle column), and after activated carbon filtration (right column).
In the presence of coagulant, water after sand filtration contained less MPs and synthetic fibres than in raw water, with values comprised between 0 and 11.4 MPs/m3 and from 0 to 1 SF/m3. Treated water after activated carbon filtration contained a lower number of MPs (Figures 2A, 3A), between 0 and 4 MPs/m3 and synthetic fibres (Figures 2B, 3B) remained in values from 0 to 1 synthetic fibres/m3. On the other hand, the concentration of MPs in water treatment without coagulant ranged from 0 to 5.6 MPs/m3 after sand filtration and the number of synthetic fibres reached values up to 6.3 synthetic fibres/m3. The content of MPs was slightly higher in water after activated carbon (0–8 MPs/m3) than after sand filtration, but the range of concentrations of synthetic fibres decreased (0–3 synthetic fibres/m3).
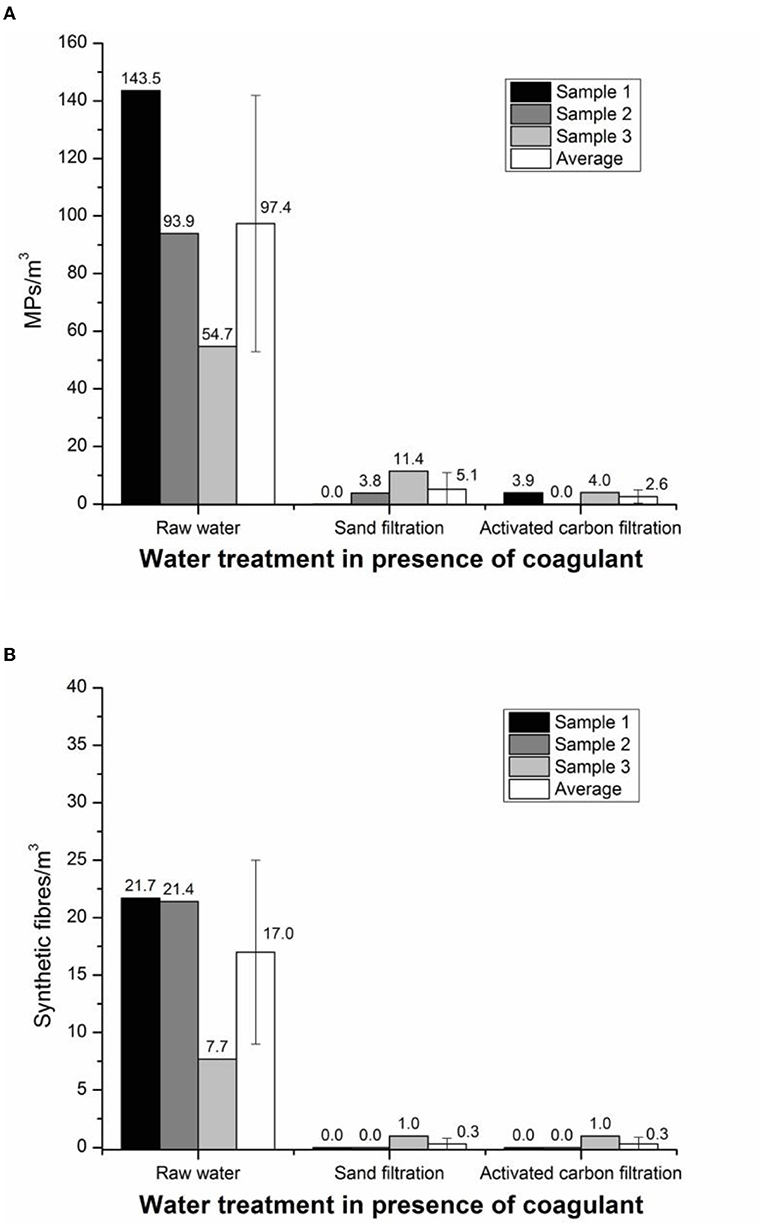
Figure 2. Concentration of MPs (A) and synthetic fibres (B) in raw water, after sand filtration and after activated carbon filtration in presence of coagulant of each sampling and average with standard deviation.
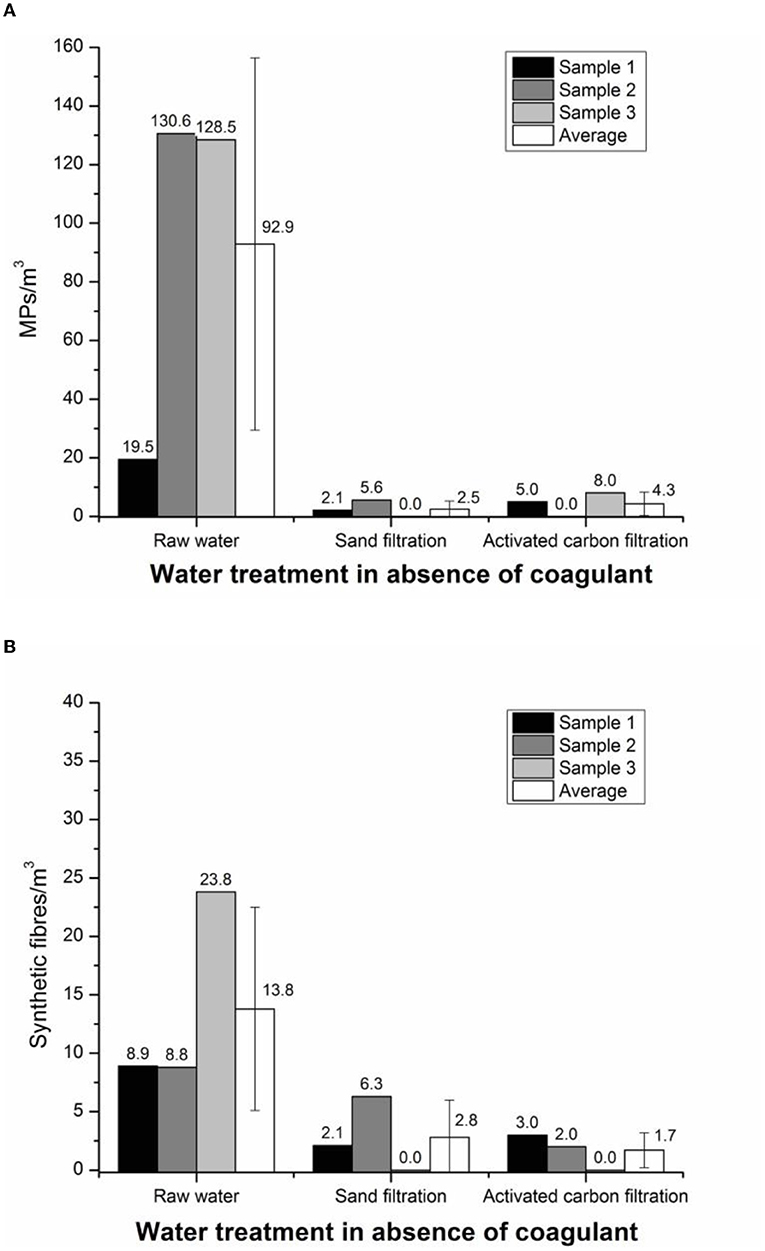
Figure 3. Concentration of MPs (A) and synthetic fibres (B) in raw water, after sand filtration and after activated carbon filtration in absence of coagulant of each sampling and average with standard deviation.
According to these results, we observed that there was a variability from one sampling campaign to another. Moreover, MPs and synthetic fibres were observed in all treatment stages. However, MP and SF concentrations in raw water were low, as previously mentioned. On the other hand, our findings indicate that this pilot station, which replicates the main DWTP in Geneva, did not notably contribute to water contamination with MPs and synthetic fibres. Much higher concentrations of MPs and synthetic fibres were found in the drinking water treatment plants related to Yangtze River (Wang et al., 2020) and Úhlava River (Pivokonský et al., 2020). Indeed, between 0 and 1,000 MPs and synthetic fibres/L of drinking water were determined, however, the sample volumes were significantly smaller (1–2 L). In contrast, Mintenig et al. (2019) determined lower amounts of MPs (0–7 MPs/m3) and synthetic fibres (3–43 fibres/m3) in raw water and drinking water from the Oldenburg-East-Frisian water board in Germany (Mintenig et al., 2019). However, in this case, the source of raw water was ground water (naturaly filtered through the soil), explaining why a significant lower number of MPs and synthetic fibres was found, compared to the studies of Pivokonski et al. and Wang et al. considering the Yangtze and Uhlava rivers, respectively.
Microparticles were divided into four size classes: ≥63 to <125 μm, ≥125 to <250 μm, ≥250 to 500 μm, and ≥500 μm. MPs were found more abundant than synthetic fibres in all size classes. As show in Figures 4A, 5A, no MPs were detected in sizes ≥250 μm in any sample. In raw water 77% of the MPs were found in the smallest size class (63–125 μm). After sand filtration, this ratio changed to 74.5 and 92% with and without coagulation, respectively. In drinking water, the difference was more pronounced in presence of coagulant (50%) and without coagulant (84%).
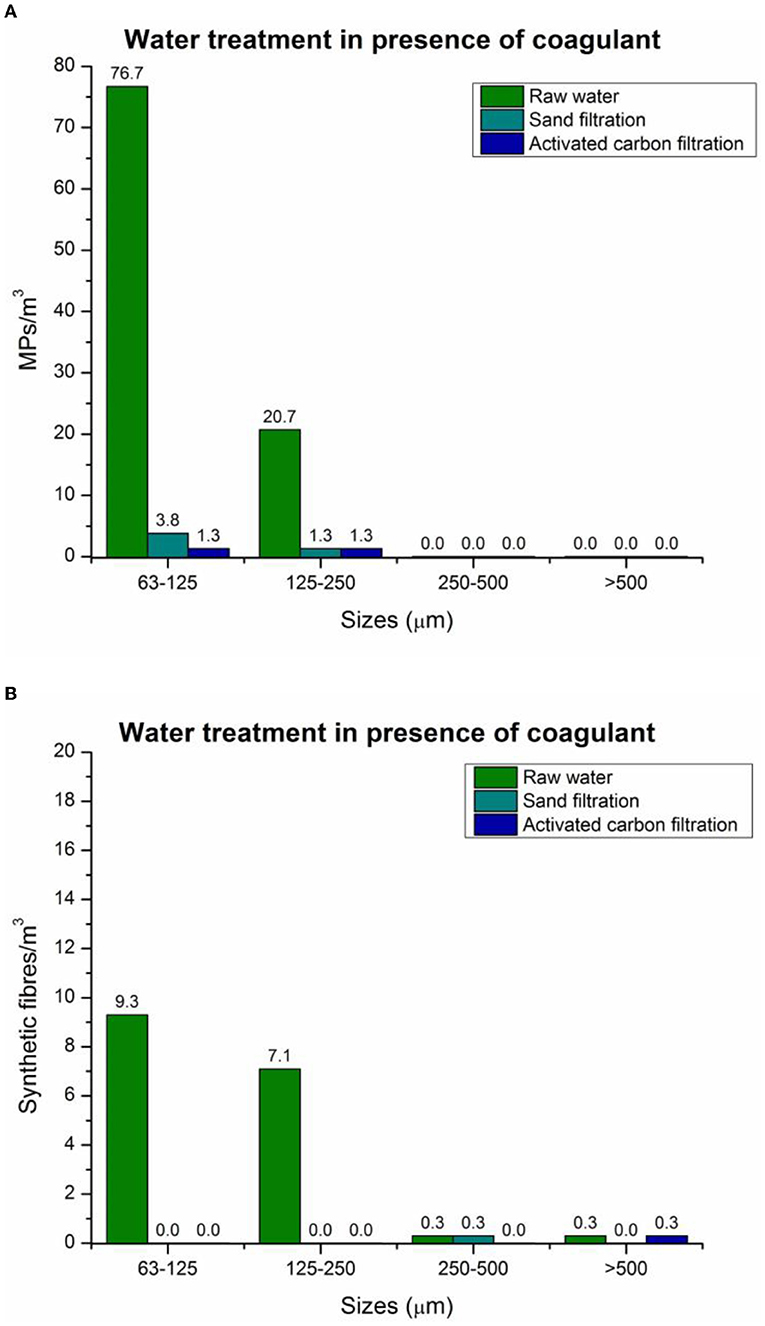
Figure 4. Size distribution concentrations of MPs (A) and synthetic fibres (B) in presence of coagulant.
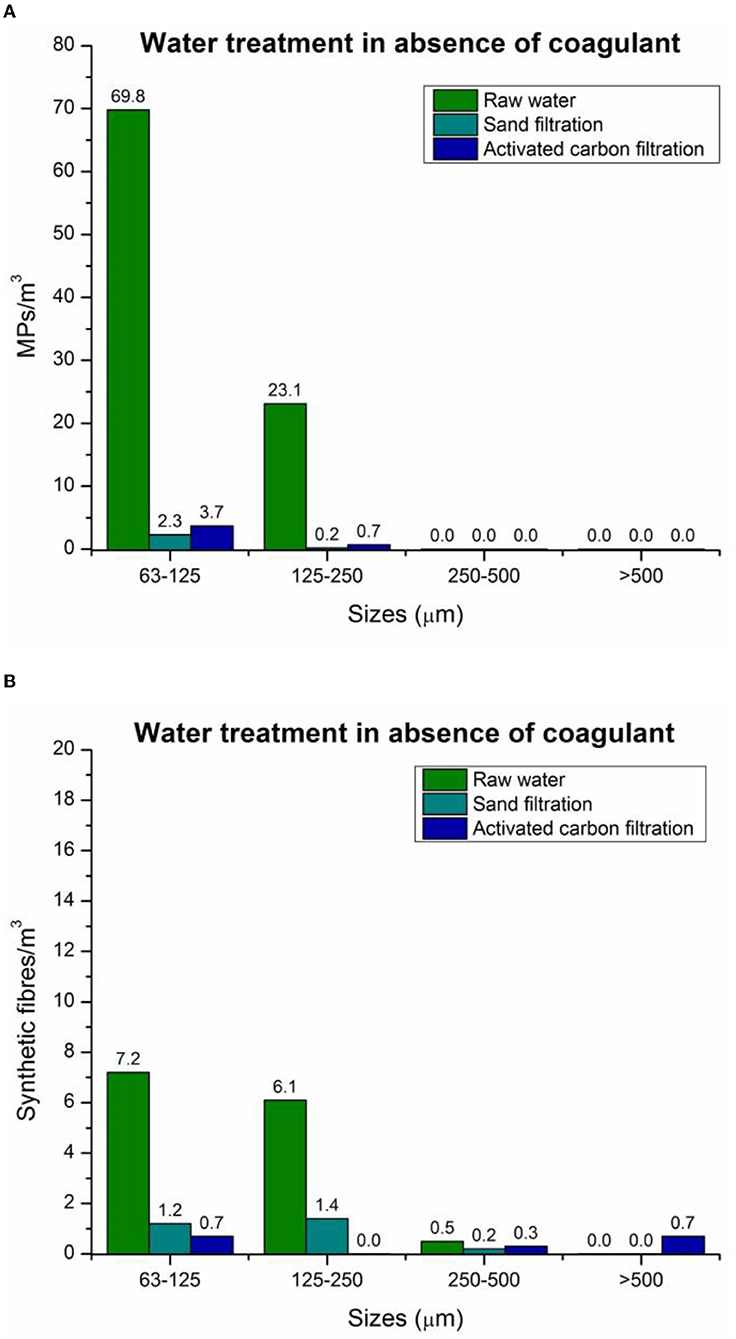
Figure 5. Size distribution concentrations of MPs (A) and synthetic fibres (B) in absence of coagulant.
Contrary to MPs, synthetic fibres were mostly identified in size class ≥250 μm both in the presence and absence of coagulant (Figures 4B, 5B). In the case of raw water, the percentage of synthetic fibres in the smallest size class was around 55%. In presence of coagulant (Figure 4B), synthetic fibres were found significantly removed after sand filtration. No synthetic fibres were identified in drinking water in sizes <250 μm, but synthetic fibres ≥250 μm were still persistent although in low numbers. Without coagulant (Figure 5B), synthetic fibres were mainly found (92%) in size classes <250 μm after sand filtration, however, size distribution was more heterogeneous after ACF, where only 42% of synthetic fibres were found in sizes <250 μm.
Microplastic concentrations reported here in raw water were higher than those reported in the surface of Lake Geneva by Faure et al. (2015) (around 0.2 MPs/m3) (Faure et al., 2015). However, we did not observe microplastic higher than 250 μm, whereas they only studied microparticles higher than 300 μm on surface water of Lake Geneva. The absence of microplastics higher than 250 μm could be explained by the distribution of microplastics in the water column. Water quality (temperature and density gradients) play in fact an important role in the transport and retention of microplastics in water column (Zobkov et al., 2019). In addition, microplastic characteristics (size, form density, roughness, etc.) and biofouling have an impact in the fate of microplastics in the water column. Dai et al. (2018) observed elevated proportions of microplastics smaller than 300 μm with increasing water depth, indicating that a smaller microplastic was more likely to sink than a larger one (Dai et al., 2018).
Our findings indicate that MPs and synthetic fibres concentrations globally increase with smaller sizes, which is in agreement with comparable research dealing with MPs in DWTPs. Indeed, similar research about MPs in DWTPs (Pivokonsky et al., 2018; Pivokonský et al., 2020; Novotna et al., 2019; Johnson et al., 2020; Wang et al., 2020) observed that size distribution were displaced towards smaller sizes. However, higher numbers were determined in those studies which also indicated that MPs <50 μm persisted in drinking water treatment. Therefore, we can also expect here higher number of MPs and synthetic fibres with sizes <63 μm. Nevertheless, the analysis of smaller sizes (<63 μm) was out of scope in the present study.
As mentioned in Section Abundance of Microplastic and Synthetic Fibres, many microparticles, identified as non-plastic by infrared spectroscopy, were observed in all samples. Among the most frequent non-plastic microparticles, we identified cellulose and proteins as products of digested organic matter. Cellulose microparticles and fibres were excluded because this material was used to philtre the ultrapure water (Milli-Q) as mentioned in the methodology section. Due to the contamination of samples with nitrate cellulose, we chose not to consider the corresponding microparticles.
Materials like Polyamide (PA), Polyethylene (PE), Polyester (PES), Polymethyl methacrylate (PMMA), polypropylene (PP), polystyrene (PS), polyvinyl alcohol (PVA) and ethylene (vinyl acetate) copolymer (PEVA), and some other materials were identified by infrared spectroscopy. Examples of infrared spectra and corresponding pictures of MPs and synthetic fibres are given in the Supplementary Figures 4, 5.
Our findings indicate that the chemical composition of MPs was found more heterogeneous in raw water than in samples after sand filtration, as shown in Figures 6, 7. Sand filtration removed most plastic types with or without coagulant (Figures 6A, 7A). MPs like PES, PP, and PVA were not detected after sand filtration in presence or not of coagulant. MPs made of PEVA prevailed over the entire water treatment with coagulant. In drinking water, MPs of PE and PEVA were identified whereas other types of plastic were not detected. In contrast, MPs of PA, PE, PEVA, and others were identified after ACF in water treatment without coagulant.
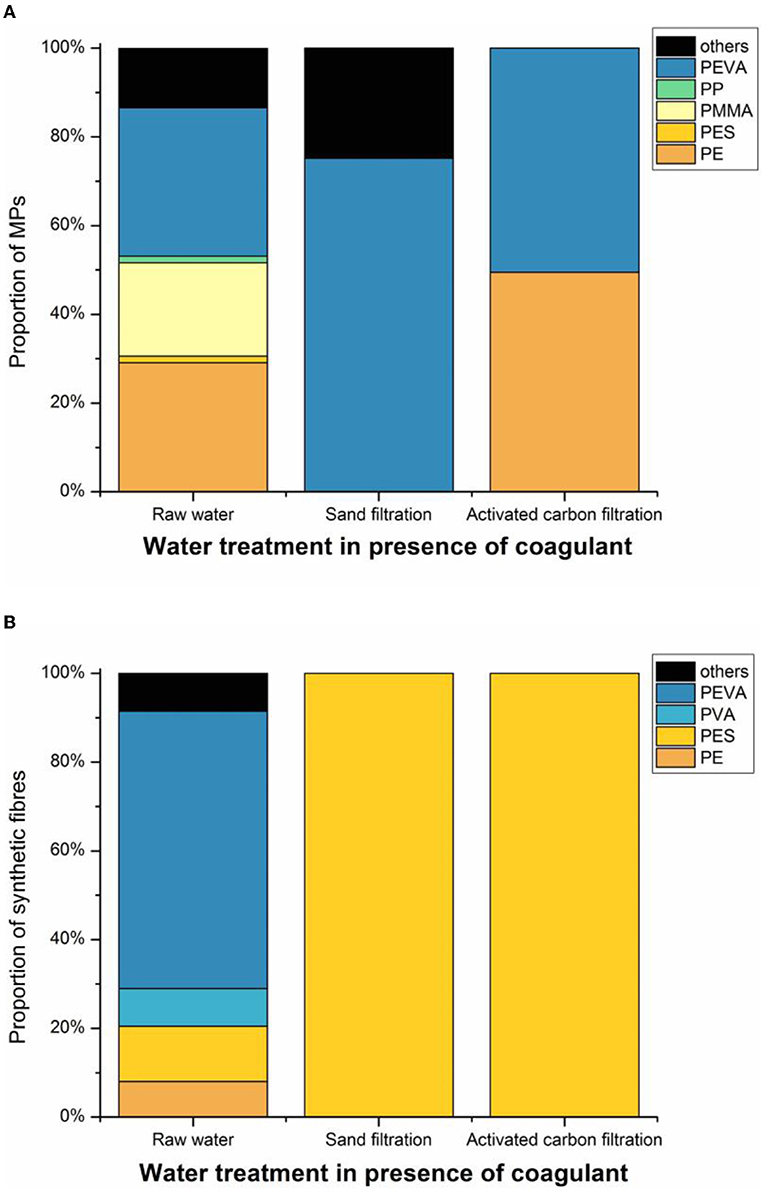
Figure 6. Chemical composition of MPs (A) and synthetic fibres (B) in raw water, after sand filtration and after activated carbon filtration in presence of coagulant.
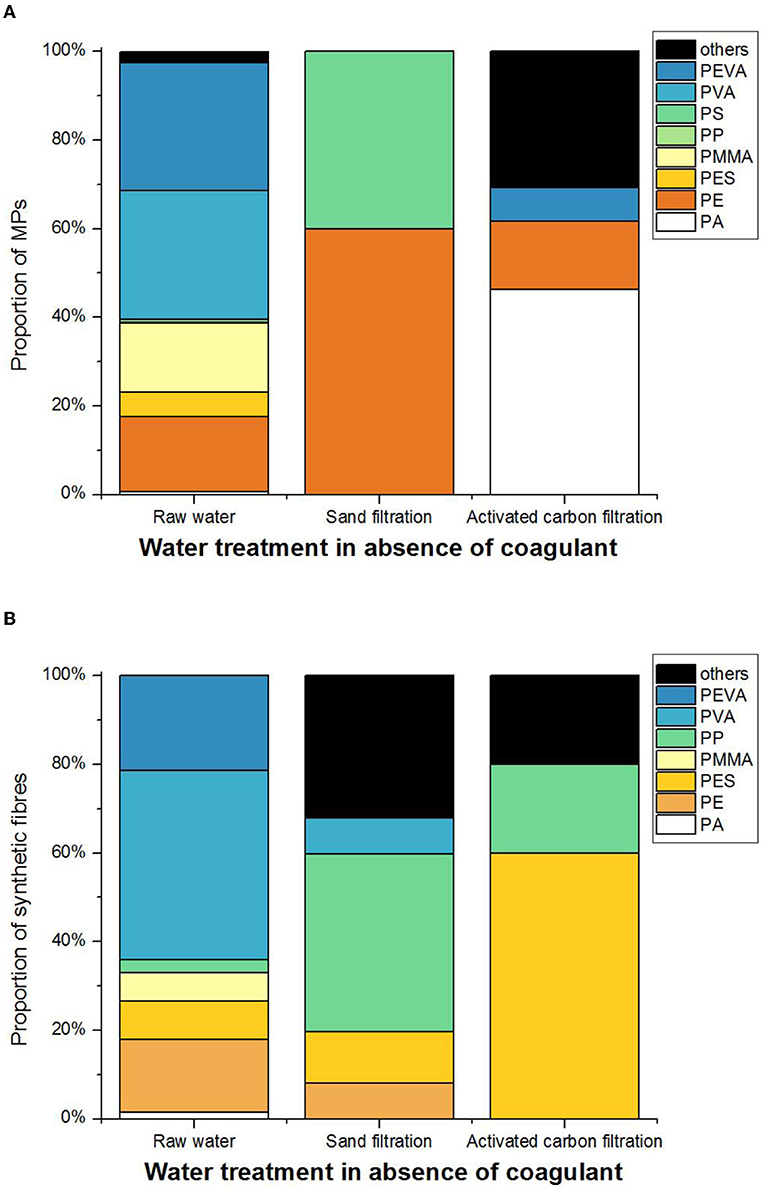
Figure 7. Chemical composition of MPs (A) and synthetic fibres (B) in raw water, after sand filtration and after activated carbon filtration in absence of coagulant.
Fibres (natural, semi-synthetic or synthetic) were easily recognised (visually) in the samples, but their chemical composition was not successfully identified in most of cases because of their elongated shape and reduced thickness. Important concentrations of fibres were found all along the drinking water treatment, even if several actions were taken to prevent contamination. Some fibres such as cotton, viscose and cellulose were observed and subsequently identified in the analysis by infrared spectroscopy. As shown Supplementary Figure 6, <10% of fibres were identified as synthetics after infrared spectroscopy analysis, indicating that natural and semi-synthetic fibres could represent a more significant contribution in numbers than synthetic fibres. The results of fibres concentration with and without coagulant are presented in Supplementary Figure 6.
The heterogeneity of SF chemical composition was more important in raw water, as depicted in Figures 6B, 7B. Synthetic fibres made of PES were identified in all samples, such as polyethylene terephthalate (PET) and polybutylene terephthalate (PBT). In contrast, some synthetic fibres such as PA, PMMA, and PEVA were not detected after sand filtration. In presence of coagulant, only PES fibres were identified after sand filtration and ACF (Figure 6B). In comparison, water treatment without coagulant was found to reduce the heterogeneity of SF chemical composition, but PES, PP, and others the type of synthetic fibres prevailed over the entire water treatment (Figure 7B).
At this point, we can conclude that water treatment did not contribute to water contamination with MPs and synthetic fibres (≥63 μm). Some studies indicate that microplastics less than 63 μm and nano-sized plastics are created from the abrasion of retained microplastics with the filtration masses during water treatment (Cai et al., 2018; Enfrin et al., 2019; Li et al., 2022). This could be indeed a problem in drinking water treatment. However, other studies such as the one of Ramirez Arenas et al. (2022), which investigated the removal efficiency of polystyrene nanoplastics (124 ± 38 nm) negatively charged in conventional water treatment, indicated global removal efficiency equal to 99.4%. Thus, more near nanoscale microplastic and nanoplastic research is necessary, as well as more advanced methodologies and instruments to expand the knowledge regarding these important issues in drinking water.
Chemical heterogeneity from raw water to final drinking water was neither amplified nor stable in the purification process. Indeed, chemical composition of MPs and synthetic fibres were reduced to just a few materials in drinking water. The occurrence of the different chemical types of plastics (MPs and synthetic fibres) that we identified coincide with those reported by Pivokonsky et al. (2018); Pivokonský et al. (2020) and Wang et al. (2020) such as PET, PE, PP, and PEVA. However, compared to our results, no significant difference in the chemical heterogeneity of plastics occurred from raw water to drinking water in that research. In other words, these studies dealing with microplastics in drinking water did not observe an important reduction of plastic heterogeneity.
In presence of coagulant, the total removal of MPs attained 97 ± 3%, which corresponds to a final concentration equal to 2.6 MPs/m3. However, as shown in Figure 8, a non-negligible number of MPs was already removed after sand filtration indicating its efficiency. The removal rate of MPs after sand filtration with coagulant reached 92 ± 11%. In comparison, synthetic fibres were removed with slightly better efficiency than MPs after sand filtration. On average, 96 ± 7% of synthetic fibres were removed after sand filtration, corresponding to 0.3 synthetic fibres/m3. Total removal efficiency of synthetic fibres was equal to 97 ± 7%, which indicated that no significant further removal was obtained after ACF.
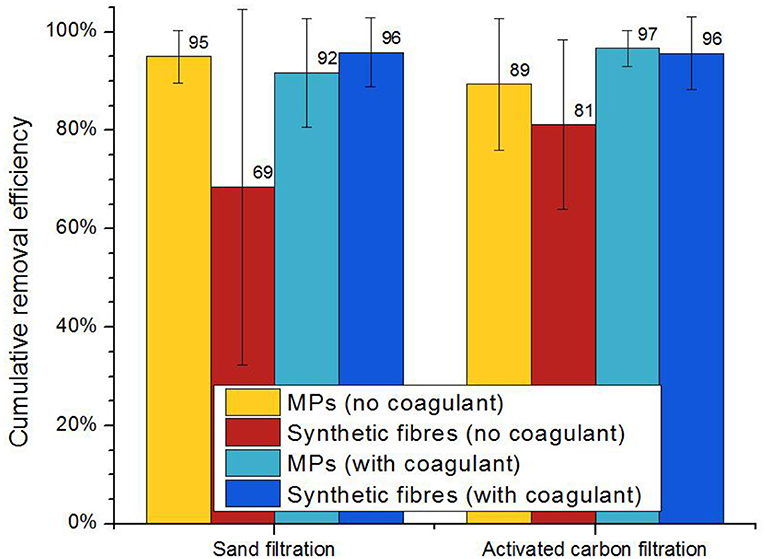
Figure 8. Average MPs and synthetic fibres cumulative removal efficiency with their respective standard deviations.
Removal efficiency of MPs in drinking water treatment without coagulant resulted in 95 ± 5% after sand filtration. Cumulative removal efficiency of MPs decreased to 89 ± 13% after ACF, corresponding to an average of 4.3 MPs/m3. In contrast, the removal efficiency of synthetic fibres was 68 ± 36% after sand filtration. Total removal of synthetic fibres further improved after ACF, reaching 81 ± 17%, which corresponds to 1.7 synthetic fibres/m3, as depicted in Figure 8.
Our results indicate that sand filtration itself retains a significant number of MPs and synthetic fibres. Moreover, coagulation (at least at the low dosage operated in the plant) is not found here to play a key role in the removal of MPs, as shown in Figure 2A. Indeed, removal efficiencies were found very close compared to the absence of coagulation (Figure 3A). However, the concentration of MPs further decreased after ACF in the treatment with coagulant (Figures 2A, 3A). This could indicate that the coagulation process improves the performance of the filtration systems, even if the MPs were not completely removed from water or that a significant reduction was observed. Furthermore, our results indicate that the use of coagulant in drinking water treatment benefits removal of synthetic fibres, by almost eliminating them from the water.
If comparison is now made with the literature, Wang et al. (2020) found no MPs (fibres, fragments nor spheres) >50 μm after sand filtration in a drinking water treatment plant which includes a flocculation/sedimentation process. They reported 100% removal efficiency of MPs after sand filtration. However, they obtain a removal efficiency ranging between 58.9 and 70.5% of fibrous and non-fibrous MPs (1–50 μm). Compared to our findings, similar values were reported by Pivokonský et al. (2020). They found a removal efficiency of microplastics (fibres and fragments >50 μm) greater than 96% after sand filtration in Plzen drinking water treatment plant (Pivokonský et al., 2020). However, a lower removal efficiency was observed for MPs >1 μm (around 80%).
Regarding the cumulative removal efficiency after ACF, Wang et al. (2020) obtained 100 % removal efficiency with MPs >50 μm. However, overall removal efficiency in drinking water was found equal to 86% considering MPs >1 μm which represented a concentration of 930 ± 71 MPs/L. In contrast, Pivokonský et al. observed an enhancement in removal efficiency, considering all range sizes studied (MPs >1 μm). Nonetheless, they did not found an improvement in removal efficiency of MPs (synthetic fibres included) with sizes >50 μm in Plzen DWTP, arriving to around 94% cumulative removal efficiency (Pivokonský et al., 2020). The overall removal efficiencies in four drinking water treatment plants studied by Pivokonsky et al. (2018); Pivokonský et al. (2020) were >81% (Pivokonsky et al., 2018; Pivokonský et al., 2020). MPs and synthetic fibres >50 μm were almost or completely removed in drinking water, with values ranging from 0 to 2 fragment MPs/L and from 0 to 5 synthetic fibres/L. The highest average removal efficiency (99.9%) was reported in drinking water treatment in England and Wales by Johnson et al. (2020) by considering MPs ≥25 μm (Johnson et al., 2020). In addition, lower numbers of MPs (0–3 quantifiable MPs/m3) were reported compared to other studies.
Such a variability of the removal efficiency of MPs in this study and in others must be related to raw water quality and operational process conditions which can influence the DWTPs ability to eliminate or reduce microplastic from drinking water. We sampled under optimal conditions (i.e., 1–2 days after and before backwashing of filtration masses). However, the filtration masses are not always steady and evolves over time, following processes of clogging, washing, starting, and functioning. Further research is needed to assess the evolution of the filtration masses over time and their efficiency over different conditions, i.e., each operational cycle. Furthermore, raw water quality also plays an important role in the capability of DWTP in removing contaminants from water. Water quality parameters, like turbidity, pH, temperature and conductivity also play an important role in comprehending the removal efficiency of microplastics in DWTP, as shown by Sarkar et al. (2021).
The contribution of coagulation to the efficiency of filtration systems (sand and activated carbon) in the removal of MPs and synthetic fibres was investigated in a conventional drinking water plant. The content of MPs and synthetic fibres was limited in raw water (95 MPs/m3 and 15 synthetic fibres/m3), most likely because the water is extracted from Lake Geneva at a depth of 30 m. The results obtained in this study indicates that sand filtration removes a considerable amount of MPs (>79%), regardless of the presence of coagulant. Therefore, coagulation is not found to play an important role here in the elimination of MPs. However, a significant effect was observed for synthetic fibres after sand filtration since their removal efficiency was improved, from 69% in absence of coagulant to 96% in presence of coagulant. The concentration of MPs and synthetic fibres in treated water without coagulant was limited (4.3 MPs/m3 and 1.7 synthetic fibres/m3) with removal efficiencies of MPs and synthetic fibres equal to 89 and 81% respectively. Treated water with coagulation, sand filtration and ACF was found to contain a negligible content of MPs (2.6 MPs/m3) and synthetic fibres (0.3 SF/m3) and removal efficiencies higher than 96%. Moreover, MPs with sizes <250 μm were found prevalent in the drinking water treatment plant.
Plastic contamination was limited; however, the concentration of MPs and synthetic fibres is expected to increase significantly with smaller sizes. This is an important issue indicating that microplastics of small sizes (i.e., <63 μm) as well as nanoplastic contamination could be more significant and more investigation will be necessary to expand the knowledge regarding MPs and synthetic fibres in drinking water treatment under conventional conditions.
The raw data supporting the conclusions of this article will be made available by the authors, without undue reservation.
All authors listed have made a substantial, direct, and intellectual contribution to the work and approved it for publication.
This project was funded by Water Research Fund (FOWA) from Société Suisse de l'Industrie du Gaz et des Eaux (SSIGE/SVGW 026-19) and the Services Industriels de Genève (SIG 026-19).
The authors declare that the research was conducted in the absence of any commercial or financial relationships that could be construed as a potential conflict of interest.
All claims expressed in this article are solely those of the authors and do not necessarily represent those of their affiliated organizations, or those of the publisher, the editors and the reviewers. Any product that may be evaluated in this article, or claim that may be made by its manufacturer, is not guaranteed or endorsed by the publisher.
The authors acknowledge financial support received from SSIGE/SVGW, SIG, and University of Geneva. We also acknowledge the technical support of all the people involved in the use and maintenance of the pilot station and Delphine Borboën for the positive controls data.
The Supplementary Material for this article can be found online at: https://www.frontiersin.org/articles/10.3389/frwa.2022.835451/full#supplementary-material
Allen, S., Allen, D., Phoenix, V. R., Le Roux, G., Durántez Jiménez, P., Simonneau, A., et al. (2019). Atmospheric transport and deposition of microplastics in a remote mountain catchment. Nat. Geosci. 12, 339–344. doi: 10.1038/s41561-019-0335-5
Barnes, D. K. A., Galgani, F., Thompson, R. C., and Barlaz, M. (2009). Accumulation and fragmentation of plastic debris in global environments. Philos. Trans. Royal Soc. B Biol. Sci. 364, 1985–1998. doi: 10.1098/rstb.2008.0205
Bertoldi, C., Lara, L. Z., Mizushima, F. A. de L., Martins, F. C. G., Battisti, M. A., Hinrichs, R., et al. (2021). First evidence of microplastic contamination in the freshwater of Lake Guaíba, Porto Alegre, Brazil. Sci. Tot. Environ. 759:143503. doi: 10.1016/j.scitotenv.2020.143503
Cai, L., Wang, J., Peng, J., Wu, Z., and Tan, X. (2018). Observation of the degradation of three types of plastic pellets exposed to UV irradiation in three different environments. Sci. Tot. Environ. 628–629, 740–747. doi: 10.1016/j.scitotenv.2018.02.079
Collard, F., Gasperi, J., Gabrielsen, G. W., and Tassin, B. (2019). Plastic particle ingestion by wild freshwater fish: a critical review. Environ. Sci. Technol. 53, 12974–12988. doi: 10.1021/acs.est.9b03083
Colton, J. B., Burns, B. R., and Knapp Frederick, D. (1974). Plastic particles in surface waters of the Northwestern Atlantic. Science 185:491. doi: 10.1126/science.185.4150.491
Constant, M., Ludwig, W., Kerhervé, P., Sola, J., Charrière, B., Sanchez-Vidal, A., et al. (2020). Microplastic fluxes in a large and a small Mediterranean river catchments: the Têt and the Rhône, Northwestern Mediterranean Sea. Sci. Tot. Environ. 716:136984. doi: 10.1016/j.scitotenv.2020.136984
Cowger, W., Booth, A. M., Hamilton, B. M., Thaysen, C., Primpke, S., Munno, K., et al. (2020). Reporting guidelines to increase the reproducibility and comparability of research on microplastics. Appl. Spectrosc. 74, 1066–1077. doi: 10.1177/0003702820930292
da Costa, J. P., Santos, P. S. M., Duarte, A. C., and Rocha-Santos, T. (2016). (Nano)plastics in the environment – sources, fates and effects. Sci. Tot. Environ. 566, 15–26. doi: 10.1016/j.scitotenv.2016.05.041
Dai, Z., Zhang, H., Zhou, Q., Tian, Y., Chen, T., Tu, C., et al. (2018). Occurrence of microplastics in the water column and sediment in an inland sea affected by intensive anthropogenic activities. Environ. Poll. 242, 1557–1565. doi: 10.1016/j.envpol.2018.07.131
Darbra, R. M., Dan, J. R. G., Casal, J., Àgueda, A., Capri, E., Fait, G., et al. (2012). “Additives in the textile industry,” in Global Risk-Based Management of Chemical Additives I: Production, Usage and Environmental Occurrence, eds B. Bilitewski, R. M. Darbra, and D. Barceló (Berlin; Heidelberg: Springer Berlin Heidelberg), 83–107. doi: 10.1007/698_2011_101
De Falco, F., Di Pace, E., Cocca, M., and Avella, M. (2019). The contribution of washing processes of synthetic clothes to microplastic pollution. Sci, Rep. 9:6633. doi: 10.1038/s41598-019-43023-x
Dris, R., Gasperi, J., Mirande, C., Mandin, C., Guerrouache, M., Langlois, V., et al. (2017). A first overview of textile fibers, including microplastics, in indoor and outdoor environments. Environ. Poll. 221, 453–458. doi: 10.1016/j.envpol.2016.12.013
Dris, R., Gasperi, J., Rocher, V., and Tassin, B. (2018). Synthetic and non-synthetic anthropogenic fibers in a river under the impact of Paris Megacity: sampling methodological aspects and flux estimations. Sci. Tot. Environ. 618, 157–164. doi: 10.1016/j.scitotenv.2017.11.009
Eerkes-Medrano, D., Thompson, R. C., and Aldridge, D. C. (2015). Microplastics in freshwater systems: a review of the emerging threats, identification of knowledge gaps and prioritisation of research needs. Water Res. 75, 63–82. doi: 10.1016/j.watres.2015.02.012
Enders, K., Lenz, R., Ivar do Sul, J. A., Tagg, A. S., and Labrenz, M. (2020). When every particle matters: a QuEChERS approach to extract microplastics from environmental samples. MethodsX 7:100784. doi: 10.1016/j.mex.2020.100784
Enfrin, M., Dumée, L. F., and Lee, J. (2019). Nano/microplastics in water and wastewater treatment processes – origin, impact and potential solutions. Water Res. 161, 621–638. doi: 10.1016/j.watres.2019.06.049
Eriksen, M., Mason, S., Wilson, S., Box, C., Zellers, A., Edwards, W., et al. (2013). Microplastic pollution in the surface waters of the Laurentian Great Lakes. Mar. Poll. Bullet. 77, 177–182. doi: 10.1016/j.marpolbul.2013.10.007
Faure, F., and De Alencastro, L. F. (2016). Microplastiques : situation dans les eaux de surface en Suisse. Aqua Gas 2016, 72–77. Available online at: http://infoscience.epfl.ch/record/217919/files/AG_Faure-MicroPlas-4-16.pdf
Faure, F., Demars, C., Wieser, O., Kunz, M., and de Alencastro, L. F. (2015). Plastic pollution in Swiss surface waters: nature and concentrations, interaction with pollutants. Environ. Chem. 12, 582–591. doi: 10.1071/EN14218
Ferraz, M., Bauer, A. L., Valiati, V. H., and Schulz, U. H. (2020). Microplastic concentrations in raw and drinking water in the Sinos River, Southern Brazil. Water 12:113115. doi: 10.3390/w12113115
Filella, M., and Turner, A. (2018). Observational study unveils the extensive presence of hazardous elements in beached plastics from Lake Geneva. Front. Environ. Sci. 6:1. doi: 10.3389/fenvs.2018.00001
Gasperi, J., Wright, S. L., Dris, R., Collard, F., Mandin, C., Guerrouache, M., et al. (2018). Microplastics in air: are we breathing it in? Curr. Opin. Environ. Sci. Health 1, 1–5. doi: 10.1016/j.coesh.2017.10.002
Geyer, R., Jambeck, J. R., and Law, K. L. (2017). Production, use, and fate of all plastics ever made. Sci. Adv. 3:e1700782. doi: 10.1126/sciadv.1700782
Gita, S., Shukla, S. P., Saharan, N., Prakash, C., and Deshmukhe, G. (2019). Toxic effects of selected textile dyes on elemental composition, photosynthetic pigments, protein content and growth of a freshwater chlorophycean alga Chlorella vulgaris. Bullet. Environ. Contaminat. Toxicol. 102, 795–801. doi: 10.1007/s00128-019-02599-w
González-Pleiter, M., Velázquez, D., Edo, C., Carretero, O., Gago, J., Barón-Sola, Á., et al. (2020). Fibers spreading worldwide: microplastics and other anthropogenic litter in an Arctic freshwater lake. Sci. Tot. Environ. 722:137904. doi: 10.1016/j.scitotenv.2020.137904
Hanvey, J. S., Lewis, P. J., Lavers, J. L., Crosbie, N. D., Pozo, K., and Clarke, B. O. (2017). A review of analytical techniques for quantifying microplastics in sediments. Anal. Methods 9, 1369–1383. doi: 10.1039/C6AY02707E
Hartline, N. L., Bruce, N. J., Karba, S. N., Ruff, E. O., Sonar, S. U., and Holden, P. A. (2016). Microfiber masses recovered from conventional machine washing of new or aged garments. Environ. Sci. Technol. 50, 11532–11538. doi: 10.1021/acs.est.6b03045
Horton, A. A., Walton, A., Spurgeon, D. J., Lahive, E., and Svendsen, C. (2017). Microplastics in freshwater and terrestrial environments: evaluating the current understanding to identify the knowledge gaps and future research priorities. Sci. Tot. Environ. 586, 127–141. doi: 10.1016/j.scitotenv.2017.01.190
Hu, D., Zhang, Y., and Shen, M. (2020). Investigation on microplastic pollution of Dongting Lake and its affiliated rivers. Mar. Poll. Bullet. 160:111555. doi: 10.1016/j.marpolbul.2020.111555
Johnson, A. C., Ball, H., Cross, R., Horton, A. A., Jürgens, M. D., Read, D. S., et al. (2020). Identification and quantification of microplastics in potable water and their sources within water treatment works in England and Wales. Environ. Sci. Technol. 54, 12326–12334. doi: 10.1021/acs.est.0c03211
Kirstein, I. V., Hensel, F., Gomiero, A., Iordachescu, L., Vianello, A., Wittgren, H. B., et al. (2021). Drinking plastics? – Quantification and qualification of microplastics in drinking water distribution systems by μFTIR and Py-GCMS. Water Res. 188:116519. doi: 10.1016/j.watres.2020.116519
Klein, S., Worch, E., and Knepper, T. P. (2015). Occurrence and spatial distribution of microplastics in river shore sediments of the Rhine-Main Area in Germany. Environ. Sci. Technol. 49, 6070–6076. doi: 10.1021/acs.est.5b00492
Koelmans, A. A., Mohamed Nor, N. H., Hermsen, E., Kooi, M., Mintenig, S. M., and De France, J. (2019). Microplastics in freshwaters and drinking water: critical review and assessment of data quality. Water Res. 155, 410–422. doi: 10.1016/j.watres.2019.02.054
Kosuth, M., Mason, S. A., and Wattenberg, E. V. (2018). Anthropogenic contamination of tap water, beer, and sea salt. PLoS ONE 13:e0194970. doi: 10.1371/journal.pone.0194970
Kühn, S., Jamieson, A., Keighley, R., and Egelkraut-Holtus, M. (2018). In every ocean, at every depth- microfibers and microplastics. Shimadzu News, Den Helder, Netherlands. Available online at: https://www.shimadzu-webapp.eu/magazine/issue-2018-2_en/in-every-ocean-at-every-depth-microfibers-and-microplastics/
Lapointe, M., Farner, J. M., Hernandez, L. M., and Tufenkji, N. (2020). Understanding and improving microplastic removal during water treatment: impact of coagulation and flocculation. Environ. Sci. Technol. 54, 8719–8727. doi: 10.1021/acs.est.0c00712
Lechner, A., Keckeis, H., Lumesberger-Loisl, F., Zens, B., Krusch, R., Tritthart, M., et al. (2014). The Danube so colourful: a potpourri of plastic litter outnumbers fish larvae in Europe's second largest river. Environ. Poll. 188, 177–181. doi: 10.1016/j.envpol.2014.02.006
Li, Y., Li, J., Ding, J., Song, Z., Yang, B., Zhang, C., et al. (2022). Degradation of nano-sized polystyrene plastics by ozonation or chlorination in drinking water disinfection processes. Chem. Eng. J. 427:131690. doi: 10.1016/j.cej.2021.131690
Ma, B., Xue, W., Ding, Y., Hu, C., Liu, H., and Qu, J. (2019). Removal characteristics of microplastics by Fe-based coagulants during drinking water treatment. J. Environ. Sci. 78, 267–275. doi: 10.1016/j.jes.2018.10.006
Mani, T., Hauk, A., Walter, U., and Burkhardt-Holm, P. (2015). Microplastics profile along the Rhine River. Sci. Rep. 5:17988. doi: 10.1038/srep17988
Mintenig, S. M., Löder, M. G. J., Primpke, S., and Gerdts, G. (2019). Low numbers of microplastics detected in drinking water from ground water sources. Sci. Tot. Environ. 648, 631–635. doi: 10.1016/j.scitotenv.2018.08.178
Negrete Velasco, A. D., Rard, L., Blois, W., Lebrun, D., Lebrun, F., Pothe, F., et al. (2020). Microplastic and fibre contamination in a remote mountain lake in Switzerland. Water 12:92410. doi: 10.3390/w12092410
Novotna, K., Cermakova, L., Pivokonska, L., Cajthaml, T., and Pivokonsky, M. (2019). Microplastics in drinking water treatment – current knowledge and research needs. Sci. Tot. Environ. 667, 730–740. doi: 10.1016/j.scitotenv.2019.02.431
Oceaneye (2020). Evaluation de la pollution du Léman par les déchets micro- et mésoplastiques de surface. Available online at: https://www.oceaneye.ch/news/10-07-2020/ (accessed August 4, 2020).
Pivokonsky, M., Cermakova, L., Novotna, K., Peer, P., Cajthaml, T., and Janda, V. (2018). Occurrence of microplastics in raw and treated drinking water. Sci. Tot. Environ. 643, 1644–1651. doi: 10.1016/j.scitotenv.2018.08.102
Pivokonský, M., Pivokonská, L., Novotná, K., Cermáková, L., and Klimtová, M. (2020). Occurrence and fate of microplastics at two different drinking water treatment plants within a river catchment. Sci. Tot. Environ. 741:140236. doi: 10.1016/j.scitotenv.2020.140236
Plastics Europa (2019). Market data: PlasticsEurope. Europa Plastics Assosiation of Platsics Manufacturers. Available online at: https://www.plasticseurope.org/en/resources/market-data (accessed November 12, 2019).
Ramirez Arenas, L., Ramseier Gentile, S., Zimmermann, S., and Stoll, S. (2022). Fate and removal efficiency of polystyrene nanoplastics in a pilot drinking water treatment plant. Sci. Tot. Environ. 813:152623. doi: 10.1016/j.scitotenv.2021.152623
Remy, F., Collard, F., Gilbert, B., Compère, P., Eppe, G., and Lepoint, G. (2015). When microplastic is not plastic: the ingestion of artificial cellulose fibers by macrofauna living in seagrass macrophytodetritus. Environ. Sci. Technol. 49, 11158–11166. doi: 10.1021/acs.est.5b02005
Renner, G., Schmidt, T. C., and Schram, J. (2018). Analytical methodologies for monitoring micro(nano)plastics: which are fit for purpose? Curr. Opin. Environ. Sci. Health 1, 55–61. doi: 10.1016/j.coesh.2017.11.001
Sarkar, D. J., Das Sarkar, S., Das, B. K., Praharaj, J. K., Mahajan, D. K., Purokait, B., et al. (2021). Microplastics removal efficiency of drinking water treatment plant with pulse clarifier. J. Hazard. Mater. 413:125347. doi: 10.1016/j.jhazmat.2021.125347
Schymanski, D., Oßmann, B. E., Benismail, N., Boukerma, K., Dallmann, G., von der Esch, E., et al. (2021). Analysis of microplastics in drinking water and other clean water samples with micro-Raman and micro-infrared spectroscopy: minimum requirements and best practice guidelines. Analyt. Bioanalyt. Chem. 413, 5969–5994. doi: 10.1007/s00216-021-03498-y
Shahi, N. K., Maeng, M., Kim, D., and Dockko, S. (2020). Removal behavior of microplastics using alum coagulant and its enhancement using polyamine-coated sand. Process Saf. Environ. Protect. 141, 9–17. doi: 10.1016/j.psep.2020.05.020
Shruti, V. C., Pérez-Guevara, F., and Kutralam-Muniasamy, G. (2020). Metro station free drinking water fountain- a potential “microplastics hotspot” for human consumption. Environ. Poll. 261:114227. doi: 10.1016/j.envpol.2020.114227
Skaf, D. W., Punzi, V. L., Rolle, J. T., and Kleinberg, K. A. (2020). Removal of micron-sized microplastic particles from simulated drinking water via alum coagulation. Chem. Eng. J. 386:123807. doi: 10.1016/j.cej.2019.123807
Wang, Z., Lin, T., and Chen, W. (2020). Occurrence and removal of microplastics in an advanced drinking water treatment plant (ADWTP). Sci. Tot. Environ. 700:134520. doi: 10.1016/j.scitotenv.2019.134520
Zhang, Q., Zhao, Y., Du, F., Cai, H., Wang, G., and Shi, H. (2020). Microplastic fallout in different indoor environments. Environ. Sci. Technol. 54, 6530–6539. doi: 10.1021/acs.est.0c00087
Keywords: microplastics, synthetic fibres, conventional drinking water, coagulation, infrared spectroscopy
Citation: Negrete Velasco A, Ramseier Gentile S, Zimmermann S and Stoll S (2022) Contamination and Removal Efficiency of Microplastics and Synthetic Fibres in a Conventional Drinking Water Treatment Plant. Front. Water 4:835451. doi: 10.3389/frwa.2022.835451
Received: 14 December 2021; Accepted: 11 February 2022;
Published: 05 April 2022.
Edited by:
Rafael Trevisan, Federal University of Santa Catarina, BrazilReviewed by:
Qiqing Chen, East China Normal University, ChinaCopyright © 2022 Negrete Velasco, Ramseier Gentile, Zimmermann and Stoll. This is an open-access article distributed under the terms of the Creative Commons Attribution License (CC BY). The use, distribution or reproduction in other forums is permitted, provided the original author(s) and the copyright owner(s) are credited and that the original publication in this journal is cited, in accordance with accepted academic practice. No use, distribution or reproduction is permitted which does not comply with these terms.
*Correspondence: Angel Negrete Velasco, YW5nZWwubmVncmV0ZXZlbGFzY29AdW5pZ2UuY2g=; Serge Stoll, c2VyZ2Uuc3RvbGxAdW5pZ2UuY2g=
Disclaimer: All claims expressed in this article are solely those of the authors and do not necessarily represent those of their affiliated organizations, or those of the publisher, the editors and the reviewers. Any product that may be evaluated in this article or claim that may be made by its manufacturer is not guaranteed or endorsed by the publisher.
Research integrity at Frontiers
Learn more about the work of our research integrity team to safeguard the quality of each article we publish.