 James L. Wescoat Jr.
 Jonnalagadda V. R. Murty
 Ranu Singh
 Piyush Verma4
- 1School of Architecture and Planning, Massachusetts Institute of Technology, Cambridge, MA, United States
- 2Consultant, Mumbai, India
- 3Utile Inc., Boston, MA, United States
- 4Manush Labs, Cambridge, MA, United States
Districts across India are progressing toward the national Jal Jeevan Mission goal of piped water supply and 100% Functional Household Tap Connections (FHTC) for all by 2024. While state and national data monitor progress toward tap water connection coverage, the functionality and sustainability of those piped water supplies are less clear. This study presents a Sustainability Planning Framework to assess rural drinking water conditions and needs at the village, block, and district scales. It employs a mobile app to survey five key aspects of sustainability: source water sustainability, water service sustainability, operations and maintenance financial sustainability, village institutional capacity, and asset management. Ordinal scores for these sustainability variables are analyzed and interpreted though GIS mapping to identify locations and types of village support needed. Scores are aggregated to create an overall village drinking water sustainability index. Important hydroclimatic, geomorphological, and socio-economic correlates of the drinking water sustainability index are also examined. This framework and methods can help districts in Maharashtra and other states analyze drinking water services, plan future investments, and make policy adjustments to ensure sustainability.
Introduction
According to the United Nations WHO and UNICEF (2021), approximately two billion people or 26% of the global population lacked access to safe drinking water in 2020. It is well-known that inadequate access to water supply and sanitation services impedes overall development and wellbeing of citizens, especially women and girl children who bear most of the burden of fetching water from long distances, storing, and using it carefully (Zwarteveen et al., 2012; Cronin et al., 2015). A World Health Organization (2012) study estimated global economic losses of about 1.5% of annual GDP due to inadequate water and sanitation services.
National and state governments in India are addressing these issues through ambitious drinking water programs and investments such as the national Jal Jeevan Mission, which strives to provide functional household tap connections to all by 2024. The sustainability of those drinking water systems and investments are key concerns in states like Maharashtra where more than 5.5 million new tap connections have been made since 2019, and an additional 4.2 million taps are envisioned by 2024 (Government of India, Ministry of Jal Shakti, Department of Drinking Water and Sanitation, 2022). Challenges of sustainability are compounded by the reliance on groundwater sources from hard rock aquifers in water-stressed areas of Maharashtra. In 2017, some 23% of Maharashtra's aquifers were classified as “semi-critical,” “critical,” or “over-exploited” (Government of India, Ministry of Jal Shakti, Department of Drinking Water and Sanitation, 2019). This situation is exacerbated by monsoon variability and climate change. After reviewing the evolution of rural drinking water programs in India, we highlight key planning challenges for drinking water sustainability in Maharashtra (cf. Kumar et al., 2016; Miller et al., 2019). To address these challenges, we develop a Sustainability Planning Framework and associated methods. A case study was conducted in Satara district in Maharashtra to demonstrate the utility of this approach (Figure 1).

Figure 1. Map of Satara (red) and surrounding districts (gray) in Maharashtra, India (Ranu Singh).
Evolution of Rural Drinking Water Planning in India
Providing water for rural citizens has long been a priority for the Government of India and state governments such as Maharashtra (Lockwood and Smits, 2011; Schouten and Smits, 2015; Hutchings et al., 2017; Wescoat et al., 2021). State funded programs started in the early 1970s with the Minimum Needs Program, followed by the Accelerated Rural Water Supply Program. These were designed and implemented by state agencies, without much participation of local governments and communities. The 73rd Amendment to the Constitution of India in 1992 empowered local Panchayati Raj Institutions comprising rural governments at the district, block, and village levels. Drinking water and sanitation services were formally brought within the local government mandate in the 1990s, but state governments continued to design and implement major programs through their Public Health Engineering Departments. To strengthen local governments, the central government introduced the Sector Reform Program in 1999, starting with about 67 pilot districts. Reforms were expanded to the entire country under the Swajaldhara program in 2003. This set the trend toward decentralization of rural water management that has continued till date through the National Rural Drinking Water Program, and current Jal Jeevan Mission launched in 2020 (Sangameswaran, 2014; Verma et al., 2014; Murty et al., 2020).
All state water programs, starting from Swajaldhara, have emphasized community participation in the development of Village Action Plans, led by Village Water and Sanitation Committees. Village Action Plans address local infrastructure needs, service delivery gaps, groundwater source sustainability, and operations and maintenance, which is a direct responsibility of village Gram Panchayat governments. Plans are approved in Gram Sabha village forums and consolidated at the intermediate block or taluka level of government. Districts comprising dozens of blocks and many hundreds of Gram Panchayats consolidate those local plans into a District Action Plan to prioritize investments and related capacity building. Districts in Maharashtra have a full-time Deputy Chief Executive Officer for water and sanitation, who has a support team of regular and contracted professionals. District Action Plans are amalgamated in turn into a State Action Plan, which establishes financial allocations to the districts from state and national sources. This planning process is thus a mix of bottom-up and top-down processes (Wescoat and Murty, 2021).
Earlier drinking water programs provided hand pumps, public taps, and stand posts at prescribed maximum distances from households. They aimed to satisfy a standard supply of 40 L per capita per day (lpcd), which was later increased to 55 lpcd for rural areas. Provision of piped water supplies and household tap connections was initially a relatively low priority. As per the Government of India, Census of India (2011), only about 18% of rural households in India had tap water from treated sources.
The recently launched Jal Jeevan Mission aims to cover 460 million rural households in India with piped water supplies and achieve a near-100% coverage with Functional Household Tap Connections that deliver at least 55 lpcd. Tap connection coverage is scaling up and has reportedly reached about 71% in Maharashtra (Government of India, Ministry of Jal Shakti, Department of Drinking Water and Sanitation, 2022). While coverage and expenditures are well-monitored, the sustainability of village water schemes has received less attention.
Key Sustainability Planning Challenges in Maharashtra
Expanding the Scope and Structure of Sustainability Planning
Planning is recognized as an important component of rural drinking water programs in India. The national Jal Jeevan Mission Guidelines (2019) call for Village Action Plans, District Action Plans, and State Action Plans. They mention sustainability, but do not indicate how to plan for sustainability. In Maharashtra, planning has likewise focused on capital expenditure to increase coverage. Despite large capital flows into the sector, there are growing concerns about sustainability, also known as “slipback,” whereby “fully covered” habitations slip back into “partially covered” or “not covered” status, which is variously attributed to poor planning, execution, and/or maintenance (World Bank, 2008, 2014). The Government of Maharashtra wanted to understand these sustainability issues and develop a planning framework and useful tools for addressing them.
Shifting From Spreadsheets of Schemes to Planning for Sustainable Water Services
Districts in Maharashtra prepare Annual Action Plans that take the form of spreadsheets. Spreadsheets have two limitations for planning purposes. First, they tend to emphasize new infrastructure needs, which are important components of sustainability, but not sufficient. Sustainable water services also depend upon sound village financial planning for operation and maintenance, source water protection, cooperative local decision-making, and forward-looking asset management. These indicators were not captured in district spreadsheets.
Developing New Visualization and Communication Methods
The second limitation of spreadsheets, which have hundreds of rows and scores of columns, is that they are not easy to comprehend. They help list and sort potential projects, but they include no maps to visualize the geographic distribution of water problems, needs, and priorities. Nor do they have supporting text to communicate planning goals, criteria, and expected benefits.
This study worked with the Government of Maharashtra to address these three challenges by developing a Sustainability Planning Framework with new planning methods and tools for strengthening the sustainability of drinking water services.
Our Contribution: Sustainability Planning Framework and Methods
The Sustainability Planning Framework developed through an investigation of baseline levels of water service. The Jal Jeevan Mission strives to ensure safe tap water service of 55 L per capita per day. However, the volume of water delivered is not currently measured in most villages. In addition, water service varies seasonally between dry pre-monsoon months and the rest of the year. In some villages, concerns revolve around the adequacy of water sources and supplies. Others lack sufficient finances, O&M, or management capacity to sustain the systems constructed. Sustainability is thus a multidimensional objective that involves careful planning of system inputs, outputs, and outcomes. This study linked the assessment of drinking water services with sustainability planning.
Previous Approaches
The importance of this aim was made clear by a longitudinal study of East African countries, which drew attention to the deterioration of piped water supply schemes and reversion to substandard water services over a period of 30 years (Thompson, 2001, 53–58). Several sustainability planning methods and indices have been developed to address such scenarios. Some of them deal with urban utilities that use benchmarking indices based on financial, organizational, and human resource indicators, as well as water service levels (e.g., Asian Development Bank, 2007; CEPT, 2013; American Water Works Association, 2020). Benchmarking indices are also used to provide comparisons with peers, which is helpful when planning service improvements. In the rural context, Bandyopadhyay (2016) provides a broad review of drinking water sustainability issues and approaches in India. Hutchings et al. (2017) identifies successful models of rural drinking water systems and support organizations, described as “Community Plus” case studies in different regional contexts of India. Maharashtra qualifies as a “high-income developmental state” in their framework. WaterAid's (2011) sustainability framework highlights 12 principles that it employs as an external support organization. Miller et al. (2019) reviewed 218 studies of external support organizations for rural drinking water systems. Some studies employ sophisticated quantitative analyses of sustainability indicators. For example, Singh and Bhakar (2021) present a groundwater sustainability index in Rajasthan using an Analytic Hierarchy Process. Other studies employ cluster analysis, principal components analysis, and multi-criteria models, though those studies tend to involve small to medium sized samples of 10 to 100 water projects (Ibrahim, 2017; Molinos-Senante et al., 2019)—rather than the thousands of villages and hundreds of local staff in the Indian district context. Verma et al. (2014) present detailed chapters on source, service, and governance aspects of sustainability. The WASH Alliance FIETS model draws these aspects of sustainability together under the five broad categories of Financial, Institutional, Environmental, Technological, and Social indicators (FIETS) (WASH Alliance, 2021). Novellino (2015) analyzed the FIETS model's potential and limitations for assessing “slipback” (i.e., unsustainability) in the state of Gujarat, identifying specific drinking water variables for each of the five categories in the Government of India's Integrated Management Information System (IMIS) drinking water database. However, those data are stronger on physical progress, financial expenditure, and water quality than on water service levels, and are not readily accessible or mappable at the village level (Wescoat et al., 2016). The Jal Jeevan Mission has recently developed a mobile app to document rural drinking water sources, assets, and village Har Ghar Jal status (Government of India, Ministry of Jal Shakti, Department of Drinking Water and Sanitation, 2021a).
Our Approach
This study built upon approaches to sustainability in the literature above. On a conceptual level, it defined drinking water supply sustainability as a function of: (1) the water supply source; (2) water delivery service; (3) operations and maintenance finance; (4) village capacity; and (5) asset management. That is:
Working closely with state, district, and local water officials, the study identified specific methods, variables, and tools deemed relevant and practical for scaling up drinking water planning in the villages of a district. This collaborative process led to the development of a mobile app for data collection, consistent metrics for variable scoring and aggregation, GIS visualization of priority villages, and a template for planning recommendations described in the Section on Materials and Methods below. The section Results presents on results of the analysis and mapping in a case study of Satara District. Section Correlates of the Drinking Water Sustainability Index examines three important correlates of drinking water sustainability in Satara district that draw upon other state and national databases. The Discussion section weighs lessons learned while the Conclusions section underscores the major findings and implications of this sustainability planning approach.
Case Study District
This study is part of a wider investigation of district drinking water planning in Maharashtra. Among four case study districts involved in field research, Satara district had a high level of survey completion (86%), which enabled this analysis of drinking water services and sustainability (cf. Singh et al., 2019). It has a high level of Jal Jeevan Mission implementation−77.5% coverage with household tap connections (Government of India, Ministry of Jal Shakti, Department of Drinking Water and Sanitation, 2022).
Satara district is distinguished by a strong east-west gradient of annual rainfall that ranges from an average annual high of 5,000–6,000 mm/year (depending upon the database and period of record) in Mahabaleshwar taluka in the high elevation Western Ghats region of the district to a low of 400–500 mm/year in the semi-arid plateau lands of Man taluka on the eastern edge of the district. Overall, Satara district has an average annual rainfall of 1,200–1,350 mm/year, concentrated in the monsoon months of June-September with lesser amounts in winter. The district has high rainfall variability, and its semi-arid talukas experience drought declarations every 3–5 years. In 2018, the year before our survey, monsoon rainfall was 40% less than the annual average in the eastern Phaltan and Man talukas that carried over into drought impacts during the 2019 survey period.
This steep rainfall gradient reflects an elevation drop from ~1,400 m in the western Sahyadri range to ~400 m in eastern Phaltan taluka. Rapid runoff from streams in the Western Ghats is impounded in several large reservoirs. Precipitation on the central plateau recharges hard rock aquifers and local water impoundments. The district has five major physiographic regions: (1) the Sahyadri range of the Western Ghats that runs north-south; (2) the Mahadev dissected uplands running NW-SE; (3) the Koyna-Krishna River drainage in the southern part of the district; (4) the Nira River tributary of the Bhima River in the north; and (5) semi-arid plateau lands in the eastern part of the district. The district's dissected plateau lands are characterized by highly variable hydrogeological conditions, groundwater supplies, and drinking water sustainability [Maharashtra State, Ground Water Surveys and Development Agency (GSDA), 2011-2012, 2021; Government of India, Central Ground Water Board (CGWB), 2018]. The district has prepared a 240-page Disaster Management Plan for 2020-21 (Satara District Collector, 2020) that addresses these drought and flood hazards.
Administratively, the district consists of 11 blocks that include 1,763 villages, or ~160 villages per block (Figure 2) (Government of India, Ministry of Jal Shakti, Department of Drinking Water and Sanitation, 2022). Each village has an average of three small habitations (Wescoat et al., 2019). Planning for all villages in a district is thus a data-intensive process. Villages in Satara District have an average population of 1,518 permanent residents, and report having an average of 164 temporary residents and migrant laborers, locally referred to as “floating populations”. Temporary residents are important for estimating fluctuations in village water needs, especially in pilgrimage centers and festival periods that respondents described as the most rapidly growing types of local water demand. Many residents migrate to work in block towns or cities like Pune and Mumbai (Dandekar, 1986). Villages near taluka block towns and industrial centers are becoming “rurban” or “peri-urban” with populations that have higher expected water services (Hui and Wescoat, 2018). The Census of India defines a rural village as a settlement that has three characteristics: <5,000 people; <75% of the male population in non-agricultural employment; and a population density of <400 people per square kilometer. Over time, however, this rural-urban dichotomy is breaking down, which will lead to higher expectations for water services.
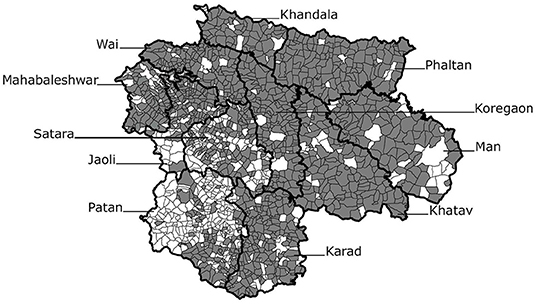
Figure 2. Blocks and villages of Satara District (gray areas completed the survey) (Piyush Verma).
Materials and Methods
After introducing the research process and challenges, this section describes the mobile app that was developed for village field surveys. Detailed discussion follows on the criteria adopted to score survey data for each variable. The section concludes with GIS mapping methods used to visualize and communicate research results.
Research Process
Reconnaissance interviews and field visits with district and village officials led to the design of planning methods and tools in four case study districts of Maharashtra, culminating in the Satara district study reported here. The research team gave presentations on drinking water planning approaches and methods, while district officials gave presentations on current drinking water conditions and projects that aim to address water scarcity, water quality, and peri-urban development. Multiple consultations were undertaken with water officials on types of water service data needed for sustainability planning. Currently, district annual action plans assess and prioritize several hundred out of more than a thousand villages in a district. The principle adopted in this study, however, was that conditions and needs in all villages should be considered as a matter of equity. Sampling is useful for identifying common needs, but it does not give each village an opportunity to be considered as part of an annual district plan. Villages vary greatly, even those in close proximity with one another. Surveying all villages sheds light on spatial heterogeneity and clustering of drinking water conditions and thus on opportunities for multi-village alternatives.
The initial village survey instrument used spreadsheets for transparency and real-time revision. After several iterations, however, a mobile app survey tool was developed in English and Marathi with drop down menus and radio buttons to facilitate field data entry. Local officials (gram sevaks) entered field conditions for each variable, which the app internally scored from 1 (very good) to 5 (very poor). The survey instrument and scoring are described in greater detail below.
Training and field testing ensured that local block officers, known as gram sevaks, responsible for monitoring village development programs, are able to collect reliable data with the mobile app. By comparison, elected village water officials and village heads (sarpanch) vary in their ability and objectivity. Training was conducted in district or block headquarters. Mobile app data entry required several rounds of checking to address incomplete, duplicate, or erroneous entries (which usually involved typed answers).
Data analysis examined each variable through charts, tables, and GIS maps. District officials were familiar with spreadsheet displays as well as bar and pie charts. GIS analysis was new. Each variable was scored from 1 to 5, and common intervals and colors were used in map legends to consistently represent conditions from very good (green) to very poor (red). Maps helped screen individual villages and village clusters that scored poorly, flagging them for more detailed field assessment and potential planning interventions. Follow-up actions can range from source water protection to improved scheduling, operations and maintenance, or financial planning support. In this study, survey results led to an emphasis on sustainability planning.
Mobile App Survey Questions
The mobile app survey was developed with the KoboToolbox open source platform. Data may eventually migrate to a new Government of Maharashtra or Jal Jeevan Mission drinking water monitoring and evaluation platform. The interface is attractive and easy to read in English and Marathi scripts. The survey consists of nine clearly identified sections (see the full drinking water supply survey in Supplementary Materials):
• Village Name, Census ID, and Block Name.
• Water sources and piped water service. This is the largest section of the survey. It includes source water availability in months of supply per year. Tap water service variables focus on availability in days per week and hours per day. Data were collected for both the pre-monsoon water-stress months of summer and wetter months of the year.
• Operation and maintenance. These questions focus on O&M expenditures relative to estimated costs, tariff levels, and percent revenue collection.
• Village water management capacity. Villages were asked about water operator training, and the performance of their Village Water Supply Committees.
• Solid and liquid waste management. These questions asked about the percentage of the village that have closed drains, open drains, or no drainage, which can be compared with data in the Census of India. As piped water supplies and tap connections increase, wastewater drainage issues may increase.
• Water innovations. Each village was asked about water innovations they have made. Some model villages are famous for achieving reliable water supplies and safe sanitation programs. The hypothesis behind this question is that there are many less well-recognized village innovations in each district.
• Water source water classification. The Maharashtra Ground Water Surveys and Development Agency examines village water sources for their sanitary condition and codes them as red, yellow, or green.
• Water quality conditions. Villages were asked about the presence or absence of major water contaminants. These conditions can be compared with more detailed state water quality lab results compiled in the national IMIS database.
• Water supply asset management. Villages were asked about the functionality and adequacy of key water assets, from wells to pumps, storage tanks, and distribution lines.
The full survey provides a rich profile of drinking water conditions in each village. It was deemed practical by state and district officials, and it was streamlined to the point where a knowledgeable gram sevak required about 30–40 min to complete a village survey. Each gram sevak is responsible for several villages, and thus has a deep level of local knowledge about those places.
Sustainability Criteria, Variables, and Scores
Five major criteria from the full survey were selected to develop the sustainability planning framework: (1) source water sustainability; (2) water service sustainability; (3) O&M financial sustainability; (4) village institutional capacity; and (5) asset management. In each case, responses were scored on a scale from 1 (very good) to 5 (very poor), so responses could be compared on an ordinal level across variables (see Supplementary Table 1 in Supplementary Materials). Variable scores were averaged to generate sustainability indices. Future research may address variable weights and statistical distributions as well as mean scores.
Source Water Sustainability Criterion (1 Variable)
Villages were asked about the availability of their surface and groundwater sources in months over the past full year. Responses ranged from 12 months (very good = score 1) to 8 months or less per year (very poor = score 5). Parts of Satara district experienced a weak monsoon and drought in 2018 that contributed to a significant number of “very poor” scores in 2019.
Piped Water Service Sustainability Criterion (Average of the 5 Variables Listed Below)
Water service levels are increasingly important as India transitions toward universal piped water supply and functional household tap connections under the Jal Jeevan Mission. The following water service variables shed light on functional aspects of tap connections.
• Percent household tap connections. This variable ranges from 100% (very good = score 1) to <40% (very poor = 5). This variable is expected to change significantly with the current Jal Jeevan Mission commitment toward full coverage. Pre-Mission coverage is an indicator of potential sustainability of new tap connections, as are service level variables listed below.
• Piped water supply in days per week (summer months). Pre-monsoon summer months are a period of expected water scarcity. Many if not most systems experience some level of scarcity from April to June. Daily water supply during this period is deemed very good (score = 1) while supply 1 day per week or less is deemed very poor (score = 5).
• Piped water supply in days per week (rest of the year). Monsoon and post-monsoon months have more moisture and should have more frequent and reliable water service. Daily water supply is deemed very good (score = 1), while 1 day or less per week is very poor (score = 5). Systems with poor reliability during these wet months are assumed to have serious water service problems (i.e., beyond the problems associated with seasonal scarcity).
• Piped water supply in hours per day (summer). For each day of service, water is supplied to each zone of a village for a set length of time. In the rural context, 3 h or more of service per day is deemed very good (score = 1), while <30 min per day is deemed very poor (score = 5).
• Piped water supply (hours/day in the rest of the year). For moist months of the year, 3 h of service per zone is again deemed very good (score = 1), while <30 min per day is very poor (score = 5).
O&M Financial Sustainability Criterion (Average of the 2 Variables Below)
• Percentage actual O&M expenditure compared to estimated costs. Villages were asked about their actual O&M expenditures compared to their estimated costs. Spending 100% or more of estimated costs is deemed very good (score = 1), while spending <40% of estimated costs is deemed very poor (score = 5).
• Percent revenue recovery. Villages were asked what percentage of their annual water tariffs are actually collected. Some villages reported 100% or more of revenue recovery when actual costs were higher than expected revenues (score = 1); at the low end of the scale some villages reported <40% revenue recovery (score = 5).
Water Management Capacity Criterion (Average of the Two Variables Below)
• Water Operator capacity. Villages were asked about their water operator's training—from a fully-trained professional (score = 1) down to a part-time “valve-man” (score = 5).
• Village Water Supply Committee (VWSC) performance. They were also asked if their VWSC is active and effective (score = 1), irregular (score = 3), or not active (score = 5).
Asset Management Criterion (Average of Two Sets of Variables Below)
• Asset functionality. For each major asset (wells, pumps, tanks, and pipelines), villages were asked if the asset is fully functional (score = 1), semi-functional (score = 3), or not functional (score = 5).
• Asset adequacy. For each major asset, villages were asked if the asset is adequate for village needs (score = 1) or inadequate (score = 5).
Overall Sustainability Index for Screening (Average of the Five Criteria Above)
Scores for the five sustainability criteria were averaged to produce an overall Sustainability Index. This index is important for screening purposes: it flags villages and clusters that have the greatest overall needs and vulnerability. This screening method includes input, output, and outcome issues, which collectively shed light on drinking water system conditions and performance. The scores help screen villages for follow-up field verification and detailed project reports where warranted. Field assessment also helps correct gram sevak errors and changing conditions on the ground.
GIS Mapping Methods
GIS mapping is valuable for visualizing survey results for spatial planning purposes. It has not been used for rural drinking water planning in Maharashtra at the district, block, or village levels to date. Instead, district annual action plans currently take the form of spreadsheets of proposed projects with little supporting text and no maps. The GIS maps in this study used 2011 Census of India administrative boundary shape files. It began with the ArcMap platform and later shifted to the open source QGIS platform (Singh et al., 2019). Maps were prepared for each of the variables and indices in the Sustainability Planning Framework described above (see Supplementary Table 2–Satara GIS in Supplementary Materials). A common color ramp from green (very good) to red (very poor), and common equal interval scale were used to facilitate map comparison.
Results
Village survey results were analyzed, mapped, and interpreted in novel ways. In addition to describing quantitative scores and spatial distributions for each variable, scores were interpreted for potential planning issues and implications. Take the example of source water supply, assessed in months of water availability per year: a high score of 1 may call for source water protection at wellheads and recharge areas to sustain that good condition throughout the year; an intermediate score of 2 or 3 may require source strengthening through well improvements and rainwater harvesting to attain 12 months of service; while a low score of 4 or 5 may require major new water supplies and schemes. Similar interpretations were developed for scores on each of the five sustainability criteria in the framework. The five criteria were then aggregated to produce an overall sustainability index to identify priority areas for planning intervention and support.
Source Water Sustainability
The first sustainability criterion is having a safe, adequate, and reliable supply of water. In the Maharashtrian context of monsoon climatology over hard rock aquifers, drinking water systems rely primarily upon groundwater sources supplemented by local surface water bodies for other domestic and animal needs. Irrigation also draws upon a combination of groundwater and surface water resources, which competes with domestic water uses in times of scarcity. Larger reservoirs serve municipal users, large irrigation systems, and sometimes nearby villages that do not have a reliable local source.
The source water sustainability criterion is defined as the number of months per year when at least one drinking water source is reliably available to the village. The map of source water availability displays a striking range and pattern of conditions (Figure 3). Many villages reported having a full 12-month supply, especially in the western and central areas of the district, though some villages dropped to 11-months of supply (e.g., in northeastern Phaltan taluka along the Nira River valley). Still others dropped down to 8-months or less in the eastern quarter of the district (e.g., in Man and Khatav talukas). This overall pattern reflects the rainfall and drought frequency gradients from west to east. In addition to the rainfall gradient, the dissected Mahadeo range that runs from NW to SE has exposed rock and thin soils that limit groundwater availability (Government of India, Ministry of Jal Shakti, 2013; Government of India, Comptroller Auditor General, 2018). These hydroclimatic and geomorphological conditions are discussed later as important correlates of drinking water service.
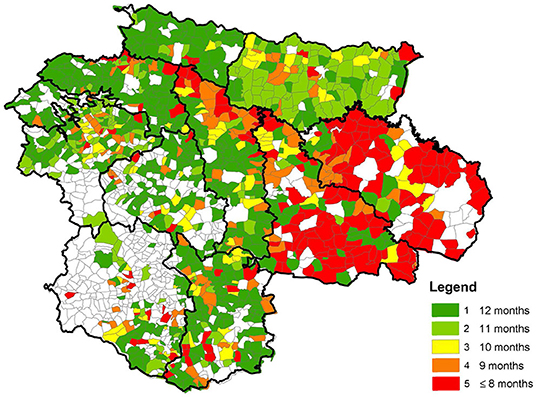
Figure 3. Source water sustainability (months/year).
Even villages with very good scores have to protect source waters at the wellhead, watershed, and aquifer recharge scales. Increases in population, water demand, waste disposal, and land use intensification all impinge upon drinking water sources. Villages that reported fair scores of 2–3 need to strengthen their water sources, e.g., through rainwater harvesting, groundwater recharge, watershed conservation, and well improvements. Few villages reported having rooftop rainwater harvesting, though some successful examples were observed in hilly areas of the nearby Bhor taluka in Pune district to the north. Villages that have poor to very poor scores of 4–5 need to develop more secure supplies, as well as protect and strengthen existing supplies, either locally or through multi-village water schemes.
Water Service Sustainability
In addition to having a reliable year-round water supply, villages that have piped water supplies and tap connections need to achieve sustainable patterns of water service, defined in days per week and hours per day of reliable water delivery. Many villages have multiple water schemes. About three-quarters of the villages in Satara district reported having hand pumps; a third reported community taps; 30% have borewell pumps; a quarter have dug wells; and 10% rely on surface water bodies. Interestingly, only about 4% of villages reported using private water vendors. With the Jal Jeevan Mission, the trend is moving toward piped water supplies and household tap connections, so it will be important to start monitoring the sustainability of water service from new taps.
The piped water service sustainability criterion combines five survey variables: percent household tap connections; days per week of summer service; days per week in the rest of the year; hours per day of summer service; and hours per day for the rest of the year.
Villages reported an average score of 3 (61–80% coverage) for household tap connections, which is consistent with the current Jal Jeevan Mission estimate of 77.5% coverage (Government of India, Ministry of Jal Shakti, Department of Drinking Water and Sanitation, 2022). Our 2019 survey thus provides a good baseline for assessing the sustainability of new taps as coverage increases. It indicates which villages had a large or small proportion of tap connections prior to the Jal Jeevan Mission. Percent coverage is not simply a measure of progress toward universal coverage. Villages with less than full coverage have unequal—and presumably inequitable—levels of service that reflect the limited access of lower income and marginalized socio-economic groups (Birkenholtz, 2013; O'Reilly and Dhanju, 2014). Districts need to ensure that villages plan and provide for functional tap connections for all as a matter of equity.
For villages that had tap connections in 2019, the survey indicated where service was good or poor at that time. Poor scores show where new systems are also likely to face service sustainability problems. Discussions with district water officials in Maharashtra mentioned that service every day is deemed very good (score = 1), and service every other day is also good (score = 2). Less than that is fair or poor (score = 3 or 4). Service once a week or less is very poor (score = 5). On days when villagers do receive tap water, access for 3 h/day or more is deemed very good (score = 1), while access <30 min is deemed very poor (score = 5).
Water service varies over the course of a year. Even in favorable conditions, pre-monsoon summer months are water-stressed in Maharashtra, so it is important to distinguish summer water service from the rest of the year. A village that has good water service or better in summer, as well as the rest of the year, has a sustainable level of water service. Conversely, a village that has poor water service during the monsoon months is likely to have multiple problems that contribute to unreliable and unsustainable water service throughout the year.
Summer Tap Water Service
Satara district has an interesting pattern of pre-monsoon summer conditions where the days of water service per week are generally good (Figure 4)—but the hours of water service per day are low (Figure 5). Piped water service was available to most villages once a day or every other day, even during dry pre-monsoon summer months (Figure 4). Important exceptions occurred in the eastern villages of Man taluka. Those drought-prone villages received water only once or twice a week, which is not reliable or sustainable. A large number of villages in Patan taluka gave no response to this question, which may indicate low piped water coverage. While the overall pattern of weekly piped water supply was reliable for most villages that responded, there are areas of concern in both the western hills and eastern plains.
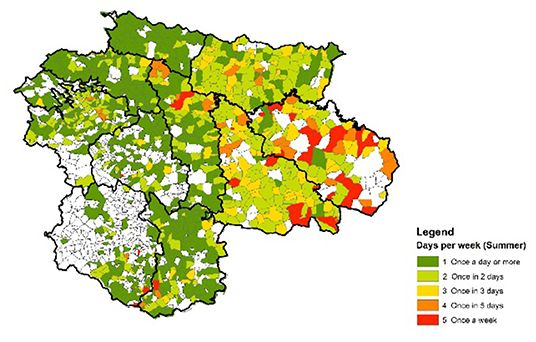
Figure 4. Days of PWS per week (summer).
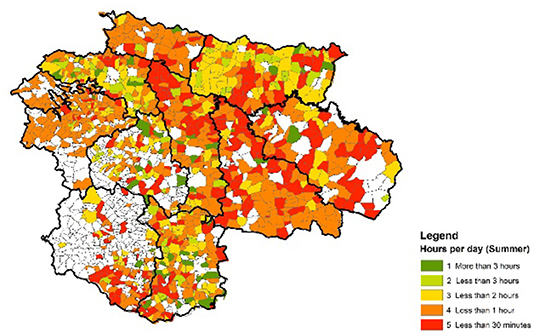
Figure 5. Hours of PWS per day (summer).
Hourly piped water service in summer months is limited in most areas of the district (Figure 5). One-quarter of the villages recorded <30 min of service per day, particularly in central and eastern areas of the district. The practice of supplying only 30 min of water per rotation occurs in humid and mesic as well as semi-arid regions. In humid areas, limited service may reflect increasing demand, scheme design constraints, or system management. While technically a full 30 min of service may be sufficient for a household's needs in volumetric terms, particularly in villages that provide daily service, it can be a borderline condition in the event of system disruptions. Homes have to store water in plastic tanks each day, and if served infrequently they have to make that volume last between rotations. One hour of service per day is a more common and reliable pattern, but even that can be on the margin of sustainability during drought periods or system disruptions. Over the long term, the pattern of frequent daily service but low hourly service in summer months is a risky situation. The district should strive to help villages attain at least 1-h service on a daily basis, and to sustain it through the summer months.
Overall Tap Water Service Index
A key aspect of the Jal Jeevan Mission is to provide functional household tap connections for all. The Jal Jeevan Mission dashboard indicates that the percentage of households with new tap connections is increasing, but it does not provide information on their functionality. This analysis helps fill that gap by surveying daily and hourly service levels, which collectively provide an index of sustainability. The five tap water service variables were averaged to create an index of village water service sustainability (Figure 6). These results reinforce expected concerns about poor water service on the eastern side of the district. However, they indicate mediocre tap water service across much of the district, with some poor conditions in the southern part of the district and even in humid hilly areas.
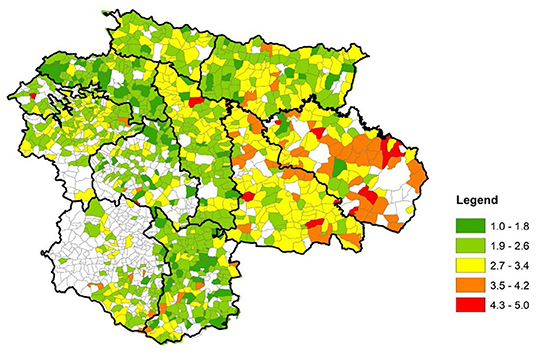
Figure 6. Water service sustainability index.
The mobile app survey included related questions that were not included in the numerical index. For example, it asked about water supply in liters per capita per day (lpcd), which is a standard criterion in India. That variable has a number of issues, foremost of which is that it is not currently measured. Schemes are designed to meet a certain lpcd standard and assumed to do so until scarcity makes it clear that the standard is not being met. Maharashtra's 40 lpcd standard was recently raised to meet the national standard of 55 lpcd. As many systems were designed for 40 lpcd, they may or may not be able to meet the higher 55 lpcd standard. Some drought affected villages in the eastern and northeastern parts of the district reported receiving <20 lpcd, which is a lower-bound threshold for districts to allocate public water tankers. Fifteen percent of villages reported receiving tankers at some point during the year. Other villages reportedly met the 55 lpcd standard, particularly in the western and central parts of the district. However, for the lpcd standard to be used with any confidence, basic measurement with water pumps, meters, or other water use estimation methods are needed. Only 100 villages (8%) reported having meters.
Sustainable Financial Management
Drinking water systems need reliable funding for operations and maintenance to be sustainable. All villages have water tariffs, some billed on a monthly basis and others on an annual basis. They vary in amount and adequacy for O&M and related financial needs. Revenue collection rates also vary. Even when collection methods are sound, the amount budgeted may or may not be adequate to meet the expenses required.
The mobile app survey asked several questions regarding village water finance. One set of questions asked about actual O&M expenditures compared to estimated O&M costs on a scale of 1 (>100% actual expenditures/estimated expenditures) to 5 (<40% actual expenditures/estimated expenditures). A second set of questions asked about water tariffs and tariff collection, the latter on a scale of 1 (>100% of tariffs collected) to 5 (<40% of tariffs collected). Cases where more than 100% was spent or collected indicated that a village was able to secure funds to address unanticipated as well as anticipated needs. These two variables were averaged to produce the O&M financial sustainability criterion.
O&M financial results in Satara District are impressive overall. Figure 7 displays a generally high level of O&M expenditure and revenue recovery, even in some of the areas with source and service deficiencies. That is not always the case, as places with poor service often have inadequate revenues. Villages with acute O&M or revenue deficiencies in Satara District are more randomly distributed than other variables. They can be targeted for financial planning and budgeting support. These generally positive results may reflect a recognition of the importance of keeping wells and pumps repaired for the whole village, as well as distribution lines for those who have tap connections. There is still a possibility that O&M budgets are too low, which is addressed in the asset management section below.
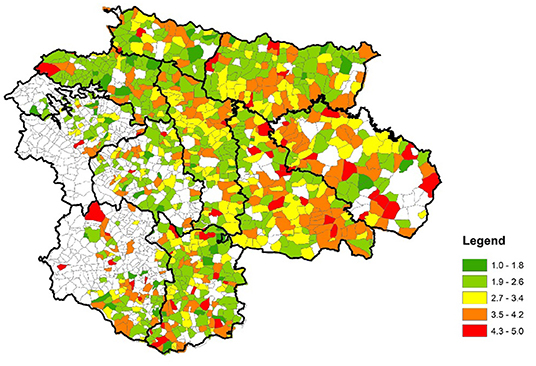
Figure 7. Operations and maintenance financial sustainability.
In addition to revenues collected by villages through water tariffs, 14th Finance Commission grants (2015–2020) and 15th Finance Commission grants (2021–2026) make sizable funds available to villages for water and sanitation services. Under the 15th Finance Commission grants, a total of Indian Rupees 236 billion (equivalent to USD 3.11 billion in late 2021), are earmarked as grants to Panchayati Raj Institutions across the country (Government of India, Finance Commission, 2021). About 30% of these funds are specifically to be used for drinking water, rainwater harvesting, and water recycling, which contribute to the sustainability of drinking water schemes and services. Village access to and expenditure of these funds is important, but not easy to track.
Village Institutional Capacity
In discussions of rural drinking water sustainability, “capacity” and “capacity building” are often mentioned, both at the village and larger block and district levels. Two mobile app survey variables addressed the institutional capacity criterion: Water operator training, and Village Water Supply Committee (VWSC) performance. Very positive results were reported for village institutional capacity in Satara district (Figure 8). Most villages have a full-time water operator who is more than just a “valve-man”, though few have professionally trained water operators. The need for the latter will increase as systems transition toward universal piped water supply and multi-village schemes. Most villages stated that their Village Water Supply Committees meet regularly and perform effectively. Satara district staff can thus focus on strengthening village capacity in the relatively small number of localities that have low 4–5 level scores. Future research should develop this criterion more fully, e.g., by assessing current levels of problem-solving and conflict management, especially in villages with major social-economic disparities.
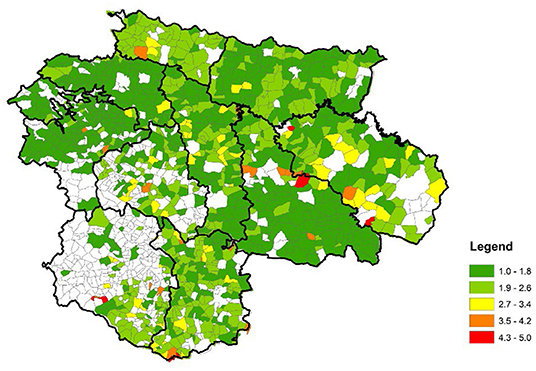
Figure 8. Village capacity criterion.
Sustainable Asset Management
Asset management is crucial for long-term sustainability of water systems. It requires planning and budgeting for periodic replacement of deteriorating and obsolete equipment. It extends short-term O&M practices to longer-term and larger-scale strategic improvements. No villages that we have studied in Maharashtra have formal asset management strategies at present, which is the case for most small systems worldwide (though see US Environmental Protection Agency, 2003).
Villages do informally assess the condition of water asset and infrastructure needs. To identify these needs, this survey asked two types of questions regarding a common set of village drinking water assets (i.e., wells, pumps, rising mains, storage facilities, distribution lines, etc.). First, if the village has that asset, is it functional (score = 1), semi-functional (score = 3), or non-functional (score = 5)? Responses to this question speak directly to the Jal Jeevan Mission goal of functionality. They also shed light on the opposite process known as “slipback” to non-functional systems (Novellino, 2015). The main semi-functional to non-functional assets reported in the district were rising mains and sumps (with scores of 4–4.4), followed by water treatment plants. These are expensive assets to rebuild or replace, so it is important for district action plans to prioritize them.
The second set of questions asked whether the village regards each of the listed assets as adequate (score = 1) or inadequate (score = 5) in their village? This allows them to identify assets they would like to acquire or upgrade when resources are available. Interestingly, villages reported that the main new assets needed are water treatment plants. Most villages reported using some form of treatment, e.g., filtration or chlorination, but wanted additional treatment, possibly for hardness, nitrates, and biological contaminants that occur in the district.
Asset conditions and needs vary among villages, so scores for each asset on the common scale of 1–5 were averaged to yield an overall Asset Management Index, again on the scale of 1–5. This index differs from other maps in interesting ways (Figure 9). It identifies large areas of concern in the hilly western talukas (Wai, Mahabaleshwar, and Jaoli), as well as in Khatav taluka in the eastern part of the district. Northern talukas along the Nira River and southern talukas reported very good asset provision and functionality. A wide range of conditions from good to poor were reported in central parts of the district. Villages with very poor scores of 4–5 are relatively few in number, which suggests that infrastructure replacement is not as pressing as source water supply and service.
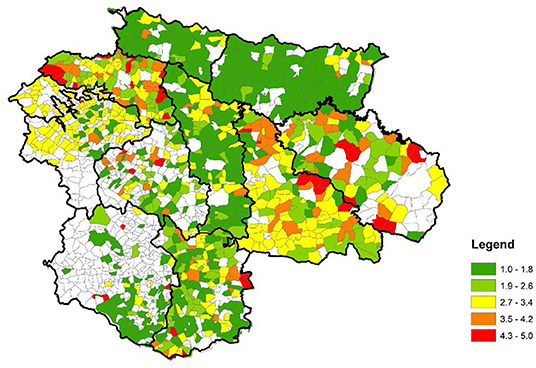
Figure 9. Asset management index.
Support for multi-year asset management planning would help ensure that villages improve assets and secure funding for asset replacement to avoid slipback. This analysis represents a first step toward asset management. Future planning studies should help villages assess when assets need to be replaced, based on life-cycle and risk analysis; how much villagers prioritize different assets; and how they might plan to finance them.
Overall Drinking Water Supply Sustainability Index
The mobile app data analysis concludes with an overall Drinking Water Supply Sustainability Index that averages scores of the five criteria presented above. Only villages with scores for all five criteria were included. As variables included ordinal and interval levels of measurement, the index can be regarded simply as an ordinal scale, i.e., where lower scores are “better” than higher scores. It is not possible to say how much better or worse, beyond the consistent qualitative categories that they range from very good to very poor.
Figure 10 helps stakeholders focus on localities most in need of field attention in the next iteration of village and district annual action plans (Government of India, Ministry of Jal Shakti, Department of Drinking Water and Sanitation, 2019). It also identifies clusters of villages where larger multi-village programs and schemes might be considered. For example, Man taluka has clusters of villages in the very poor category, and Khatav taluka has a large cluster in the poor category where block-wide programs might be useful. Central, hilly, and northern talukas have relatively high or mixed scores where plans might prioritize individual village investment and support programs.
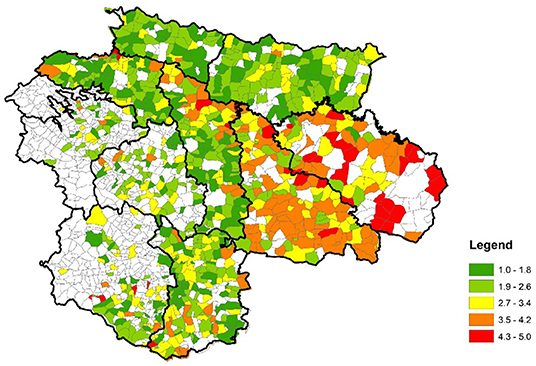
Figure 10. Overall drinking water sustainability index.
This overall sustainability index aggregates five sustainability criteria, but it does not analyze the likely interactions among them. For example, piped water service depends upon and is presumably correlated with the other four criteria. Failure of one aspect of the system affects the functionality and sustainability of the others. Future research should focus on interactions among variables, different variable weights, and aggregation methods. This study screened for conditions reported as very good or very poor, which helps direct follow-up field research to explain those patterns. We also identified several correlates of drinking water sustainability that are discussed in the next section.
Correlates of the Drinking Water Sustainability Index
The literature review, village survey, and field research identified important correlates of sustainability, several of which can be assessed with national or state data. Three are briefly explored in this section: (1) hydroclimatic variability; (2) geomorphological conditions; and (3) socio-economic factors.
Hydroclimatic Variability
As discussed in the introduction, Satara district has a pronounced rainfall gradient (Mankar, 2008; Shaikh et al., 2017). Western blocks have high levels of rainfall, especially from Mahabaleshwar taluka which is anomalously high at ~5,700 mm/year, followed by Patan and Jaoli talukas at about 1,500 mm/year (Satara District, 2021). By contrast, the eastern blocks of Man, Phaltan, and Khatav receive an order of magnitude less rainfall on an annual basis (Figure 11). These eastern blocks also have high variability and frequent droughts, experiencing moderate or worse droughts every 3–5 years [Government of India, Central Ground Water Board (CGWB), 2018]. The 2019–20 study period followed one of those droughts, as indicated in Figure 11. Not surprisingly, these blocks also have some of the greatest sustainability challenges.
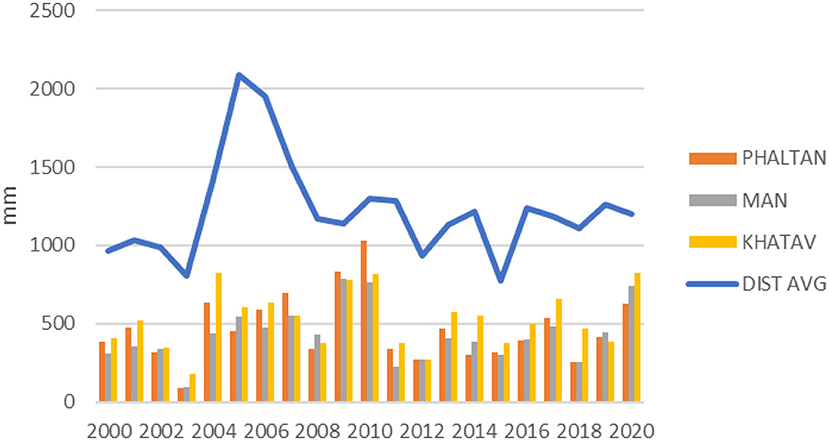
Figure 11. Average annual rainfall in Satara district and in selected semi-arid eastern talukas, 2000–2020 (Source: Satara District, 2021 for 2002–2018 and Maharain.maharashtra.gov.in for the remaining years).
Droughts are a perennial concern in semi-arid areas of Maharashtra (McAlpin, 1983; Adamson and Nash, 2014) to which the eastern half of Satara district belongs (Jagannath, 2014; Udmale et al., 2016; Matkar and Zende, 2017). While no longer the cause of deadly famines, they periodically cause severe economic and nutritional distress for humans, animals, and crops. In the mobile app survey, 42% of villages reported water shortages that impacted their animal herds. District collectors issued drought declarations and promoted relief measures, culminating in the allocation of water tankers. The most frequent drought relief measures involved repairs to wells, followed by desilting of recharge areas and tanks, well deepening, and temporary irrigation well acquisition (cf. also Gaikwad and Pawar, 2020 on rainwater harvesting). The national Disaster Management Act of 2005 mandates that central, state, and district governments prepare district disaster management plans and identify hotspot areas for disaster events (Government of India, 2005; Satara District Collector, 2020). There is a need to integrate hydroclimatic and climate change hazards assessment with sustainable drinking water planning.
Geomorphological Constraints
In addition to its rainfall gradient, Satara District has pronounced landform, soil, and hydrogeological conditions that affect drinking water sustainability. Collaboration with the Maharashtra Ground Water Surveys and Development Agency led to the use of ground water prospect maps, village recharge maps, and geomorphological maps to understand these conditions. Figure 12 displays major geomorphological patterns in the district. Most of the district is classified as a dissected plateau with a duricrust area in the western part of the district, through which the upper Koyna River has cut a steep valley (dark red). As noted in the introduction, the Mahadeo hills are highly dissected plateau lands with exposed rock and little or no soil cover (bright red). Dissected plateaus with thin soil cover are extensive in the northern and eastern parts of the district (orange). They have limited moisture holding capacity, though the map indicates that extensive surface water tanks have been impounded for seasonal water storage (blue). Only the major drainage valleys have moderate to deep soils conducive for agricultural settlement (yellow and green). While favorable for groundwater storage, these valleys also support irrigation that competes with drinking water supplies. The key observation here is that geomorphological conditions compound hydroclimatic constraints on drinking water sustainability in the upland and eastern parts of the district.
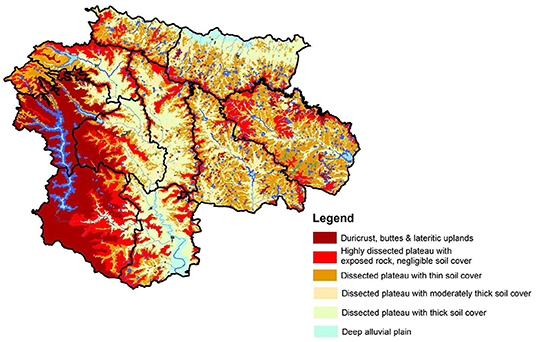
Figure 12. Geomorphological patterns and constraints (GSDA data interpreted by authors).
Socio-Economic Factors
Socio-economic factors also influence rural drinking water sustainability, though they are complex especially at the intra-village scale. The mobile app asked questions about village population. Those variables were supplemented by a GIS analysis of Census data on population and the social-economic variables of Scheduled Caste, Scheduled Tribes, and Agricultural Laborers, discussed below.
Village population size was shown to be positively correlated with water and sanitation services in a study of Pune district's peri-urbanizing areas, with some exceptions (Hui and Wescoat, 2018). Figure 13 displays village population sizes in Satara district in relation to Census of India settlement categories. Very small villages with <500 people are concentrated in hilly areas that receive limited funding and support. At the other end of the spectrum, an increasing number of villages exceed the rural population threshold of 5,000 persons, which means that they will need to develop additional water sources to meet higher levels of service for their peri-urbanizing populations. A significant number of these towns are located in the central and high water-stress eastern zones of the district. In between are villages with highly variable populations due to seasonal migration, festivals, and tourism that pose challenges for variable demand management.
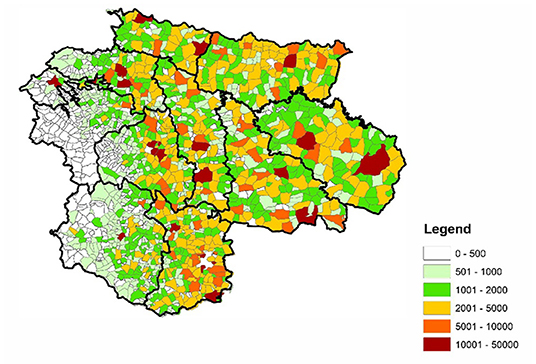
Figure 13. Village population size according to major Census categories.
Drinking water programs in India must also address disparities in service for Scheduled Castes and Scheduled Tribes (Birkenholtz, 2013; O'Reilly and Dhanju, 2014; Figure 14). While their numbers are not large as a percentage of the total population of Satara district, there are important areas of spatial concentration along with many small habitations. Figure 14 indicates that Scheduled Tribes are concentrated in the western hills of the district while Scheduled Castes have significant concentrations in the northeastern river valley of Phaltan taluka and eastern Man taluka, which are areas of relatively low drinking water service and sustainability. These areas also face physical water supply planning challenges in remote and hilly regions. Thus, in addition to prioritizing villages with large minority populations, village and district action plans need to address disparities in intra-village water access and service, and innovative approaches to water planning in remote and hilly areas.
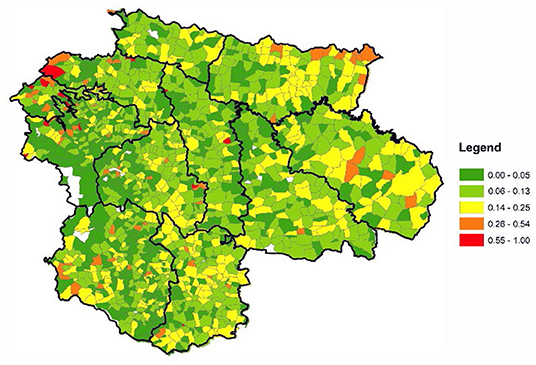
Figure 14. Proportion of the population who are Scheduled Castes and Scheduled Tribes.
Previous research has shown that the proportion of agricultural laborers is an indicator of socio-economic stress that can contribute to sustainability challenges (cf. Mohanty, 1999; Ramotra and Divate, 2018; Rathod, 2021). These occupations are less able to pay for new infrastructure, O&M tariffs, or asset management assessments. Figure 15 indicates that the highest concentrations of agricultural laborers are again located in the northeastern Phaltan taluka, followed by eastern Man and Khatav talukas, with a cluster of red and orange villages in the southwestern Patan taluka. Financial support for villages with a high proportion of socio-economically disadvantaged classes is needed to ensure sustainable water service for all.
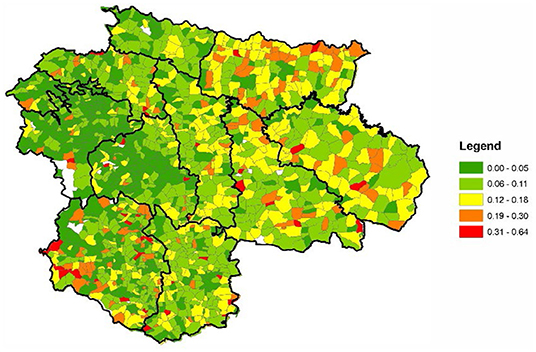
Figure 15. Proportion of the population who are agricultural laborers.
These environmental and socio-economic patterns reinforce the broad pattern of results observed in the mobile app analysis of sustainability variables and indices. Drinking water needs tend to be higher in areas of hydro-climatic and socio-economic stress—but not uniformly so. These—and additional—correlates of drinking water sustainability help interpret the mobile app survey results and suggest avenues for future research that are discussed below.
Discussion
This study of rural drinking water developed a Sustainability Planning Framework and associated methods that addressed several key challenges in Maharashtra and posed lessons for future research. For example, the framework incorporated the state's current emphasis on water sources and schemes with greater emphasis on water services, measured in days per week and hours per day in pre-monsoon and post-monsoon months of the year. It considered water supply in liters per capita per day, but concluded that those values are not currently measured and that gross field estimates are not useful for planning purposes. As water metering and Internet of Things tools expand, volumetric measures of water service may become useful (Government of India, Ministry of Jal Shakti, Department of Drinking Water and Sanitation, 2021b). The mobile app did not include questions about rainfall patterns or landforms that affect groundwater sustainability because better data are available for those variables from the Indian Meteorology Department and Maharashtra Groundwater Surveys and Development Agency, as discussed in the correlates sections on Hydroclimatic Variability and Geomorphological Constraints. Future research will need to focus on quantitative and spatial data assimilation from mobile app, remote sensing, and government databases.
The mobile app survey was able to assess, analyze, and map three key criteria of sustainable drinking water services, which are not currently addressed in district annual action plans, notably: financial management; village institutional capacity; and asset management. The importance of those variables and inferences about them are presented in detail above. These results also raise some limitations. For example, an early iteration of the survey design in another district included additional questions about the equity of water service, e.g., to scheduled caste households. When all of the survey responses reported “no difference” in water service, they were assumed to be unreliable and were set aside. Partial proxies for socio-economic inequalities were inferred from three sources. First, the mobile app question about water service problems reported in remote and hilly habitations was deemed reliable, and it often corresponds with patterns of socio-economic marginality. Second, intermediate levels of water coverage and service (e.g., in Section Water Service Sustainability) were interpreted as proxies for socio-economic inequalities. Future research will need to address the complex socio-economic and institutional aspects of drinking water sustainability that are documented in local qualitative research, but have not yet been scaled up for district surveys of thousands of villages.
A third source of insight into socio-economic and environmental involved expanding the mobile app analysis to include several important correlates of drinking water service in Census of India and Maharashtra government data presented in the section on Correlates of the Drinking Water Sustainability Index. Those data supported the broad pattern of mobile app survey results, with nuanced observations about water service in areas with significant populations of scheduled caste, tribe, and agricultural labor. We recognize that much more can be done to assess the socio-economic profiles and dynamics of village water management. Again, an earlier iteration of the survey included a question about political aspects of local water funding, as they are important, but there was no consensus among district staff about how to reliably code political behavior related to drinking water systems. Future iterations of the mobile app survey can develop such variables, but they will need to be tested for reliable field data entry by gram sevaks. For example, the Jal Jeevan Mission has developed a new mobile app to document water sources, assets, and Har Ghar Jal villages. Until that time, the “screening” approach developed here, which identifies places with poor water service for more detailed local investigation provides a useful approach at the district-wide scale where thousands of villages are involved.
In summary, an important lesson from this drinking water planning study is that an initial question to be addressed in all villages of a district concerns current levels of water service. If water services register as “very poor,” they can be prioritized for follow-up field assessment with close attention to local socio-economic and environmental factors. The sustainability of those services depends in turn upon local financial, institutional, and asset management. If one or more of them register as poor that provides a screen for focused field investigation and programmatic support.
Conclusions
This study addressed three key gaps in rural drinking water planning at the district scale in Maharashtra, India by developing a broad Sustainability Planning Framework and tools that complement and go beyond current spreadsheet methods. It has special relevance in the current context of the Government of India and state of Maharashtra's Jal Jeevan Mission efforts by shedding light on the functional dimensions of Functional Household Tap Connections for all.
The planning framework encompassed five major criteria of drinking water sustainability: source water sustainability, water service sustainability, O&M financial sustainability, village institutional capacity, and asset management. These recognized aspects of rural drinking water sustainability were analyzed individually and jointly. Jointly, they helped screen high priority villages for district attention and support. Individually, they indicated the types of support needed—source strengthening, improved service delivery, sound financial management, institutional capacity building, and so on. Future research should explore interactions among and different weights for these sustainability variables, based on district priorities and resources. It should also incorporate related water quality, socio-economic, and public health variables (Patel et al., 2009; Dhawde et al., 2018).
A second major contribution involves the methods and tools developed to assess drinking water needs in every village of a district, so that they all receive consideration, as a matter of equity. The mobile app tool, scoring, prioritization methods, and GIS mapping proved innovative and practical in this regard. These tools could be creatively enhanced by interactive engagement with stakeholders, e.g., whereby initial GIS mapping elicits new questions for follow-up field investigation and planning alternatives. Informal discussion of mapping results was undertaken in other case study districts and at the state level, but that could be advanced through rigorous experiments with map-based problem framing, screening experiments, and plan formulation.
Third, this research showed how each sustainability criterion can be specified along a consistent ordinal scale from 1 to 5, which includes interpretations of equity as well as coverage and sustainability. While a score of 3 or 4 may represent progress toward the goal of water for all, we argued that it also represents unequal and likely inequitable patterns of water service that require further field investigation and planning measures to correct. In addition to experimenting with stakeholder-defined variables, weights and interpretations, future studies could focus on methods for scaling-up the joint assessment of drinking water equity and sustainability at the district level.
These drinking water sustainability tools and methods can be used by districts for multiple purposes. This article discussed implications for near-term Annual Action Plans and strategic plans that require 3–5 years to execute. They can be used for sustainability monitoring tools for mid-course program corrections where warranted. By identifying types and patterns of poor water service, they help focus attention on financial, institutional, and socio-economic support. The tools developed are flexible, with the ability to add or remove indicators, and create new indices, particularly in socio-economic, environmental, and political domains, as described in the correlates and discussion sections of the paper.
As noted at various points, the study identified priorities for future research. Assessment of financial sustainability would benefit from closer analysis of access to and use of devolution grants and other funds for O&M and asset management. Village institutional capacity will be an increasingly important element in the context of piped water systems, as well as larger peri-urban villages that require skilled water operators, managers, and water supply committees. Villages in remote and hilly areas will need creative physical planning strategies that take advantage of watershed protection, rainwater harvesting, and innovative gravity flow and reuse systems. The state's current expansion of village observation wells, water budget analysis, and cooperative aquifer management will be important to incorporate in future studies, as will the multi-sector challenge of integrating rural drinking water planning with irrigation agriculture (which consumes ~80% of water withdrawals) and municipal and industrial demand (Satara District Collector, 2019). Water treatment for successive reuse could facilitate some transitions. While no one set of tools is available to address the multiple use frontier for sustainable water planning, there are movements in that direction (Kumar et al., 2016; Shah and Harris, 2022). This study contributes a Sustainability Planning Framework with scalable methods for rural drinking water at the district level in Maharashtra and beyond.
Data Availability Statement
The datasets presented in this study can be found in online repositories. The names of the repository/repositories and accession number(s) can be found in the article/Supplementary Material.
Ethics Statement
The studies involving human participants were reviewed and approved by Massachusetts Institute of Technology, Institutional Review Board. Written informed consent for participation was not required for this study in accordance with the national legislation and the institutional requirements.
Author Contributions
JW contributed to field research, paper conceptualization, analysis, and writing. JM contributed to conceptualization, analytics, and writing. RS developed the mobile app and contributed to analysis and writing. PV contributed to field research, GIS mapping, and writing. All authors contributed to the article and approved the submitted version.
Funding
This research was funded by internal Grants from the MIT Tata Center for Technology and Design from 2015 to 2020. JM received funding from the World Bank and served as liaison between the Government of Maharashtra Jalswarajya II Project and MIT Team.
Conflict of Interest
RS is currently employed by Utile Inc.,which began after the work in this manuscript was completed. PV was employed by Manush Labs.
The remaining authors declare that the research was conducted in the absence of any commercial or financial relationships that could be construed as a potential conflict of interest.
Publisher's Note
All claims expressed in this article are solely those of the authors and do not necessarily represent those of their affiliated organizations, or those of the publisher, the editors and the reviewers. Any product that may be evaluated in this article, or claim that may be made by its manufacturer, is not guaranteed or endorsed by the publisher.
Acknowledgments
The authors gratefully acknowledge funding from the MIT Tata Center for Technology and Design. We thank officers in the Government of Maharashtra Water Supply and Sanitation Department (WSSD), the Jalswarajya II Project Management Unit (RSPMU), and Satara District staff and gram sevaks for their creative engagement and support. Valuable insights in the larger project came from former MIT graduate students Marianna Novellino, Riddhi Shah, Paige Midstokke, and Rebecca Hui. We thank reviewers and editors for their valuable comments and suggestions.
Supplementary Material
The Supplementary Material for this article can be found online at: https://www.frontiersin.org/articles/10.3389/frwa.2022.804845/full#supplementary-material
References
Adamson, G., and Nash, D. (2014). Documentary reconstruction of monsoon rainfall variability over western India, 1781–1860. Clim. Dyn. 42, 749–769. doi: 10.1007/s00382-013-1825-6
American Water Works Association (2020). AWWA Utility Benchmarking: Performance Management for Water and Wastewater. Denver: AWWA.
Asian Development Bank (2007). 2007 Benchmarking and Data Book of Water Utilities in India. Manila: ADB.
Bandyopadhyay, S. (2016). “Sustainable access to treated drinking water in rural India,” in Rural Water Systems for Multiple Uses and Livelihood Security, eds M. Dinesh Kumar, A. J. James, and Y. Kabir (Amsterdam: Elsevier), 203–227. doi: 10.1016/B978-0-12-804132-1.00009-3
Birkenholtz, T. (2013). ‘On the network, off the map': developing intervillage and intragender differentiation in rural water supply. Environ. Plan. D-Soc. Space. 31, 354–371. doi: 10.1068/d11510
CEPT (2013). A Review of Performance Benchmarking Urban Water Supply and Sanitation. Ahmedabad: CEPT University.
Cronin, A., Mehta, P. K., and Prakash, A. (eds.). (2015). Gender Issues in Water and Sanitation Programmes: Lessons from India. New Delhi: Sage.
Dandekar, H. C. (1986). Men to Bombay, Women at Home. Urban Influence on Sugao Village, Deccan Maharashtra, India, 1942-1982. Ann Arbor, MI: University of Michigan, Center for South and Southeast Asian Studies.
Dhawde, R., Surve, N., Macaden, R., Wennberg, A. C., Seifert-Dähnn, I., Ghadge, A., et al. (2018). Physicochemical and bacteriological analysis of water quality in drought prone areas of Pune and Satara Districts of Maharashtra, India. Environments 5, 61. doi: 10.3390/environments5050061
Gaikwad, P., and Pawar, S. N. (2020). A case study of rooftop rainwater harvesting potentiality in rural settlement in drought prone area of Satara District, Maharashtra. Stud. Indian Place Names. 40, 6443–6456.
Government of India, Census of India (2011). Satara District Census Report India govt. Available online at: https://www.census2011.co.in/census/district/365-satara.html (accessed October 27, 2021).
Government of India, Central Ground Water Board (CGWB) (2018). Report on Aquifer Maps and Ground Water Management Plan. Khatav, Man, Phaltan, Satara and Wai Talukas, Satara District, Maharashtra, Vol. 3. New Delhi: Government of India.
Government of India, Comptroller and Auditor General (2018). Performance Audit of National Rural Drinking Water Programme. New Delhi: Government of India.
Government of India, Finance Commission (2021). Finance Commission in COVID Times. Report for 2021-26. New Delhi: Government of India.
Government of India, Ministry of Jal Shakti (2013). Ground Water Information, Satara District, Maharashtra. New Delhi: Government of India.
Government of India, Ministry of Jal Shakti, Department of Drinking Water and Sanitation (2019). Operational Guidelines for the Implementation of Jal Jeevan Mission. New Delhi: Government of India. Available online at: https://jalshakti-ddws.gov.in/sites/default/files/JJM_Operational_Guidelines.pdf (accessed June 24, 2022).
Government of India, Ministry of Jal Shakti, Department of Drinking Water and Sanitation (2022). Jal Jeevan Mission Dashboard and IMIS (Integrated Management Information System) Reports. New Delhi: Government of India. Available online at: https://ejalshakti.gov.in/jjmreport/JJMIndia.aspx (accessed June 24, 2022).
Government of India, Ministry of Jal Shakti, Department of Drinking Water and Sanitation. (2021a). JJM Field-force Mobile app & Web panel Introduction Training. New Delhi: Government of India. Available online at: https://jalshakti-ddws.gov.in/sites/default/files/Training-of-JJM-mobile-app.pdf (accessed June 24, 2022).
Government of India, Ministry of Jal Shakti, Department of Drinking Water and Sanitation. (2021b). Jal Jeevan Mission (Har Ghar Jal). Technical/Expert Committee Report. Measurement and Monitoring of Water Service Delivery in rural areas. New Delhi: Government of India. Available online at: https://jalshakti-ddws.gov.in/sites/default/files/technical-expert-committee-report-on-measuring-and-monitoring.pdf (accessed June 24, 2022).
Hui, R., and Wescoat, J. L. Jr. (2018). Visualizing peri-urban and rurban water conditions in Pune District, Maharashtra, India. Geoforum. 102, 255–266. doi: 10.1016/j.geoforum.2018.01.008
Hutchings, P., Franceys, R., Smits, S., and Mekala, S. (2017). Community Management of Rural Water Supply. New York, NY: Routledge.
Ibrahim, S. H. (2017). Sustainability assessment of community-based water supply projects in sudan using sustainability index and multivariate analysis. J. Water Sustain. 7, 1–16.
Jagannath, B. A. (2014). Rainfall trend in drought prone region in eastern part of Satara District of Maharashtra, India. Eur. Acad. Res. II1, 329–340. doi: 10.51396/ANRCM.2.2.2021.146-150
Kumar, M. D., James, A. J., and Kabir, Y. (eds.). (2016). Rural Water Systems for Multiple Uses and Livelihood Security. Amsterdam: Elsevier.
Lockwood, H., and Smits, S. (2011). Supporting Rural Water Supply: Moving Towards a Service Delivery Approach. Rugby: Practical Action.
Maharashtra State, Ground Water Surveys and Development Agency (GSDA) (2011-2012). Report on the Dynamic Ground Water Resources of Maharashtra. Pune: GSDA.
Maharashtra State, Ground Water Surveys Development Agency (GSDA) (2021). Village recharge priority maps. Accessed 27 October 2021 online at: https://gsda.maharashtra.gov.in/english/index.php/GWRechargePriorityMap
Mankar, G. (2008). A study of rainfall characteristics of Satara District, Maharashtra State. Deccan Geograp. 46, 39–48.
Matkar, P. S., and Zende, A. (2017). “Rainfall trend in drought prone region of Satara District of Maharashtra in India,” in International Conference on Innovations and Recent Trends in Engineering (ICIRTE)-2017. Available onine at: https://www.researchgate.net/publication/316684325_Rainfall_Trend_in_Drought_Prone_Region_of_Satara_District_of_Maharashtra_in_India (accessed October 27, 2021).
McAlpin, M. B. (1983). Subject to Famine: Food Crisis and Economic Change in Western India, 1860–1920. Princeton: Princeton University Press.
Miller, M., Cronk, R., Klug, T., Kelly, E. R., Behnke, N., and Bartram, J. (2019). External support programs to improve rural drinking water service sustainability: a systematic review. Sci. Total Environ. 670, 717–731. doi: 10.1016/j.scitotenv.2019.03.069
Mohanty, B. B. (1999). Agricultural modernisation and social inequality: case study of Satara District. Econ. Polit. Weekly. 34, A50–A61.
Molinos-Senante, M., Muñoz, S., and Chamorro, A. (2019). Assessing the quality of service for drinking water supplies in rural settings: a synthetic index approach. J. Environ. Manag. 247, 613–623. doi: 10.1016/j.jenvman.2019.06.112
Murty, J.V.R., Wescoat, J. L., Jr., and Verma, P. (2020). Towards Data-Driven District Rural Drinking Water Planning Framework, India Water Portal. Available online at: https://www.indiawaterportal.org/articles/towards-data-driven-district-rural-drinking-water-planning-framework (accessed October 25, 2021).
Novellino, M. (2015). Analysis of slipback of rural water supply systems in india using FIETS framework and imis database: Gujarat case study (Master's Thesis). Massachusetts Institute of Technology, Cambridge, MA, United States.
O'Reilly, K., and Dhanju, R. (2014). Public taps and private connections: the production of caste distinction and common sense in a Rajasthan drinking water supply project. Trans. Instit. Br. Geograp. 39, 373–386 doi: 10.1111/tran.12039
Patel, D., Shah, P., and Islam, M. (2009). Impact of Social Accountability Mechanisms on Achieving Service Delivery and Health Development Outcomes in Satara District, Maharashtra, India. Social Accountability Series. New Delhi: World Bank.
Ramotra, K. C., and Divate, S. P. (2018). A geographical study of agricultural development in Satara District of Maharashtra. Int. J. Res. Econ. Soc. Sci. 8, 39–47.
Rathod, S. B. (2021). Regional disparities in socio-economic development of satara district: a geographical analysis. Aayushi Int. Interdiscip. Res. J. 8, 1–5.
Sangameswaran, P. (2014). Neoliberalism and Water: Complicating the Story of Reform. Delhi: Orient Blackswan.
Satara District (2021). Tehsilwise Actual and Average Rainfall in last Fifteen Years – Satara District. Available online at: https://cdn.s3waas.gov.in/s33493894fa4ea036cfc6433c3e2ee63b0/uploads/2019/02/2019021322.pdf (accessed June 23, 2022).
Satara District Collector (2019). District Irrigation Plan (DIP) of Satara District. Under Pradhan Mantri Krishi Sinchayee Yojana (PMKSY). Mumbai: Government of Maharashtra, 41.
Schouten, T., and Smits, S. (eds.). (2015). From Infrastructure to Services: Trends in Monitoring Sustainable Water, Sanitation, and Hygiene Services. Rugby: Practical Action.
Shah, S. H. and Harris, L. M. (2022). Beyond local case studies in political ecology: Spatializing agricultural water infrastructure in Maharashtra using a critical, multimethods, and multiscalar approach, Ann Assoc Am Geogr. 112, 988–1007. doi: 10.1080/24694452.2021.1941746
Shaikh, A. A., Jadhav, A. G., Sthool, V. A., and Kharabade, S. B. (2017). Onset and withdrawal pattern of monsoon in Satara District of Maharashtra State. Trends Biosci. 10, 7898–7907.
Singh, A. P., and Bhakar, P. (2021). Development of groundwater sustainability index: a case study of western arid region of Rajasthan, India. Environ. Develop. Sustain. 23, 1844–1868. doi: 10.1007/s10668-020-00654-9
Singh, R., Brahmankar, R., Murty, J. V. R., Verma, P., and Wescoat, J. L. Jr. (2019). Analyzing rural drinking water services for district planning in Maharashtra, India. Water Policy. 22, 37–51. doi: 10.2166/wp.2019.086
Thompson, J. (2001). Drawers of Water II: 30 Years of Change in Domestic Water Use and Environmental Health in East Africa. London: IIED.
Udmale, P., Ichikawa, Y., Nakamura, T., Shaowei,1, N., Ishidaira, H., and Kazama, F. (2016). Rural drinking water issues in India's drought-prone area: a case of Maharashtra state. Environ. Res. Lett. 11, 074013. doi: 10.1088/1748-9326/11/7/074013
United Nations WHO and UNICEF (2021). Joint Monitoring Programme. Available online at: https://washdata.org/ (accessed October 25, 2021).
US Environmental Protection Agency (2003). Asset Management: A Handbook for Small Water Systems. Washington, DC: USEPA.
Verma, K., Bisht, B.S., and Cronin, A. (eds.). (2014). Decentralized Governance in Water and Sanitation in Rural India. New Delhi: Academic Foundation.
WASH Alliance (2021). FIETS Sustainability Portal. Available online at: https://wash-alliance.org/our-approach/sustainability/ (accessed December 8, 2021).
WaterAid (2011). Sustainability Framework. London: WaterAid. Available online at: https://washmatters.wateraid.org/sites/g/files/jkxoof256/files/sustainability%20framework.pdf (accessed December 7, 2021).
Wescoat, J. L,. Jr. and Murty, J. V. R. (2021). District drinking water planning for sustainability in maharashtra: between local and global scales. Sustainability 13, 8288. doi: 10.3390/su13158288
Wescoat, J. L., Jr., Bramhankar, R., Murty, J. V. R., Singh, R., and Verma, P. (2021). A macrohistorical geography of rural drinking water institutions in India. Water History. 13, 161–188. doi: 10.1007/s12685-021-00274-8
Wescoat, J. L., Jr., Fletcher, S., and Novellino, M. (2016). National rural drinking water monitoring: progress and challenges with India's IMIS database. Water Policy. 18, 1015–1032. doi: 10.2166/wp.2016.158
Wescoat, J. L., Jr., Shah, R., Singh, R., and Murty, J. V. R. (2019). Habitations, villages and gram panchayats: local drinking water planning in rural India. J. Water Sanit. Hyg. Dev. 9, 522–530. doi: 10.2166/washdev.2019.196
World Bank (2008). Review of Effectiveness of Rural Water Supply Schemes in India. Washington, DC: World Bank.
World Bank (2014). Maharashtra Rural Water Supply and Sanitation Program. Project Appraisal Document. Report no. 76172-IN. Washington, DC: World Bank.
World Health Organization (2012). Global Costs and Benefits of Drinking-Water Supply and Sanitation Interventions to Reach the MDG Target and Universal Coverage. Geneva: WHO/HSE/WSH/12.01.
Keywords: rural drinking water, district planning, mobile app, GIS mapping, Jal Jeevan Mission, Satara, Maharashtra, India
Citation: Wescoat JL Jr, Murty JVR, Singh R and Verma P (2022) A Sustainability Planning Framework and Methods for Rural Drinking Water in Satara District, Maharashtra, India. Front. Water 4:804845. doi: 10.3389/frwa.2022.804845
Received: 29 October 2021; Accepted: 14 June 2022;
Published: 14 July 2022.
Edited by:
Saket Pande, Delft University of Technology, NetherlandsReviewed by:
Dinis Juizo, Eduardo Mondlane University, MozambiqueMurugesu Sivapalan, University of Illinois at Urbana-Champaign, United States
Maneesha Vinodini Ramesh, Amrita Vishwa Vidyapeetham, India
Copyright © 2022 Wescoat, Murty, Singh and Verma. This is an open-access article distributed under the terms of the Creative Commons Attribution License (CC BY). The use, distribution or reproduction in other forums is permitted, provided the original author(s) and the copyright owner(s) are credited and that the original publication in this journal is cited, in accordance with accepted academic practice. No use, distribution or reproduction is permitted which does not comply with these terms.
*Correspondence: James L. Wescoat Jr., d2VzY29hdEBtaXQuZWR1