 Prakrut Kansara
 Venkataraman Lakshmi
94% of researchers rate our articles as excellent or good
Learn more about the work of our research integrity team to safeguard the quality of each article we publish.
Find out more
ORIGINAL RESEARCH article
Front. Water, 13 December 2021
Sec. Environmental Water Quality
Volume 3 - 2021 | https://doi.org/10.3389/frwa.2021.765957
This article is part of the Research TopicQuality of Water Used for Irrigation PurposesView all 4 articles
The Narmada River is one of the largest rivers in Western India encompassing a watershed area of 92,672 km2. It is one of the most important rivers for water needs of the state of Gujarat, Maharashtra, and Madhya Pradesh. The climate of the basin is humid and tropical but region surrounding this river watershed is predominantly dry and resembles semi-arid conditions. The population inside the states covering this watershed increased by an average of 23% from 1991 to 2011 causing multitude of water scarcity and water quality deterioration issues. These problems were caused by increase in sewage waste and untreated industrial discharge dumped into the river stream along with chemical fertilizers washing off from the farmlands flowing into the river. While there are several studies that model the watershed hydrology and water balance components, there has been no study that analyses the transport of nutrients inside the watershed. This study aims at using a semi-distributed hydrological model—Soil Water Assessment Tool (SWAT) to model the nitrogen (NO2 + NO3) transport and distribution inside the basin for 2001–2019. Nutrients and discharge data from Central Water Commission (CWC) of India were used to build this model along with other required input forcing obtained through remotely sensed datasets. We found that the subbasins near boundary of the Narmada watershed are experiencing significant increase in nitrogen concentrations at an estimated rate of 0.0001–0.002 mg/L/yr. The potential reason for such increase is high rate of conversion of forested land to agricultural land causing usage of fertilizers that are rich in nitrogen.
In the current times, climate change, urbanization, population growth, and over-exploited unsustainable usage of water resources have exponentially increased the importance of water resource management. These problems have compounded into complex interactions with the water quantity and quality, especially in rapidly growing developing countries like India (Gosain et al., 2006; Mall et al., 2006; Madhusoodhanan et al., 2016). With the second highest population in the world (1.4 billion), India faces a major challenge in terms of the sustainable use of limited water resources that the country has, to support such a large population. In addition to the limited quantity of water, the semi-arid and arid regions in India are also facing the problem of deteriorating water quality (Gupta and Chakrapani, 2005; Saraswat et al., 2019; van Vliet et al., 2021). These studies recognize the need for an immediate perspective on the development and management of water resources to manage the diminishing and deteriorating water resources in a manner that it does not affect the routine household and industrial water usage (Rijsberman, 2006; van Beek et al., 2011). Climate models predicting the future climatic conditions predict an increase of 1.5°C in average temperatures across South-East India (Basha et al., 2017). With the increasing population, there will be an increase in per capita water demand in terms of irrigation, household and industrial usage. Additionally, this causes increase in food demand leading to more and more agricultural lands. This in turn leads to increased usage of fertilizers which are rich in essential nutrients like nitrogen and phosphorus which are required by crops in order to grow. Excessive use of these fertilizers over decadal time scale has led to nutrient pollution in several regions of India (Krishna et al., 2016; Sen et al., 2018). This paper estimates the potential regions of increasing nitrogen concentration and flux, causing nutrient pollution on the river system and people impacted by the water of Narmada River.
The Narmada River basin has undergone rapid changes in the past three decades with significant increase in agricultural lands, industries caused by development in this region due to the increasing population. The population in Gujarat and Madhya Pradesh covering majority of this river basin has increased by an average of 23% from 1991 to 2011 to ~132 million in 2011 (Census Bureau of India). Due to this increase in population, several regions in the Narmada River watershed are being polluted with point sources—sewage and industrial discharge as well as non-point sources—chemical fertilizers used in agricultural lands (Sharma et al., 2008). Most of the studies in literature analyze nutrient contamination at specific sites inside the Narmada River basin, but there are no studies which analyse the nutrient contamination at the watershed scale.
Previous studies on large scale modeling using satellite and publicly-available model outputs have studied large continental river basins (Lakshmi et al., 2018; Kansara et al., 2021) or global (Kim and Lakshmi, 2019; Kim et al., 2021), models and satellite data (Lakshmi et al., 1997; Lakshmi and Wood, 1998; Billah et al., 2015; Mohammed et al., 2018; Le et al., 2020) or mainly using satellite data (Mondal and Lakshmi, 2021). Accurate and high spatial resolution mapping of precipitation (Hashemi et al., 2017; Mondal et al., 2018) and soil moisture (Fang et al., 2013, 2018, 2019, 2020; Fang and Lakshmi, 2014) over continental regions using satellite remote sensing are instrumental for input (as in the case of precipitation) and validation/data assimilation (as in the case of soil moisture) for hydrological models. However, all of these research efforts have focused solely on the components of the water cycle, viz. precipitation, evapotranspiration, soil moisture, infiltration, streamflow, and total water and have not considered the transport of nutrients.
In this study, we use SWAT (Soil Water Analysis Tool) to model hydrology of the Narmada Basin from 2001 to 2019. The model was calibrated for streamflow related parameters for the period from 2001 to 2010 and validated for a period from 2011 to 2019 using observed streamflow data from Central Water Commission (CWC). Performance metrics such as the Nash-Sutcliffe efficiency, correlation coefficient, root mean square error, and percent bias were used to evaluate the model. Model simulated inorganic Nitrogen (N) - (NO2 + NO3) outputs were compared against in-situ nutrient measurement data from Central Water Commission India obtained from river water samples. We use the model simulated N outputs for comparison with in-situ nutrient data from CWC to analyse the spatio-temporal variability of nutrient concentrations and fluxes across the Narmada Basin from 2001 to 2019.
The following research questions are addressed in this study:
1) What is the spatio–temporal variability of N concentrations across the entire Narmada Basin for the monsoon season?
2) What is the spatio-temporal variability of N fluxes exported to the outlet of the Narmada Basin at the sub-basin scale for the monsoon season?
The remainder of this paper has been organized into 4 sections as follows: Section 2: Study Area and datasets—gives description of the study area and datasets used in the study (Table 1), Section 3: Methods—describes the methodology followed in building the SWAT model and the analysis of nutrients data, Section 4: Results and Discussion: discusses the important results from the analysis in this study, and finally Section 5: Conclusions: summarizes the work as well as discusses limitations of our approach and lists future questions.
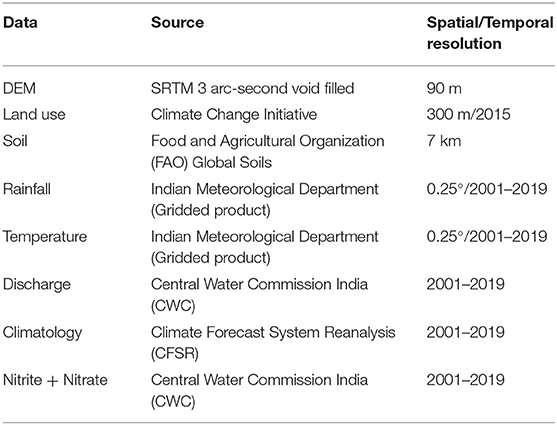
Table 1. Description of the datasets used in the study.
Narmada basin lies between longitudes 72° 38'E to 81°43'E and latitudes 21° 27'N to 23° 37'N and it spans over an area of ~92,000 square kilometers. The geographical location of Narmada Basin is shown in Figure 1. The basin is bounded by the Vindhyachal mountain ranges in the north, by the Maikala range on the east, by the Satpuras on the south and by the Arabian Sea on the west. The river basin shares its area with the states of Madhya Pradesh and Gujarat majorly, while small parts of the basin also lie within Maharashtra and Chhattisgarh. The entire watershed is relatively flat with highest elevation of 1,200 m in the Eastern part and slope <10° for the majority of the area (Figures 2A,B). These upstream hilly regions generate more than 70% of the streamflow in the Narmada River, depositing essential nutrients, and sediments for agriculture to the fertile plains in the central and downstream areas of the basin. In addition, there are two majority land cover types encompassing the watershed with agricultural land covering 53% and forests covering 42% of the basin area. Clay and clay loam are the majority soil types in the Narmada River basin.
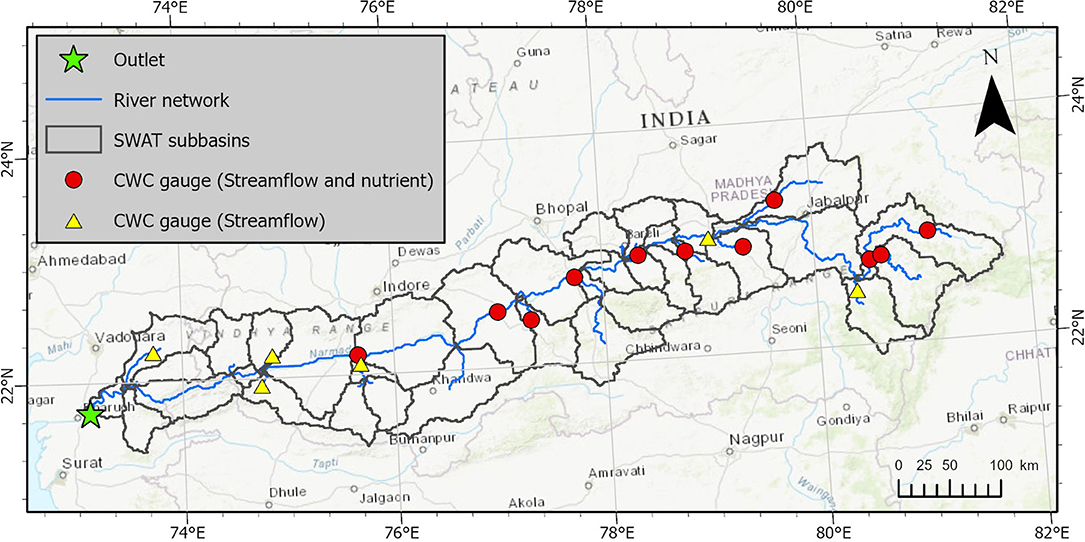
Figure 1. Map shows the Narmada River basin, main channel river network of Narmada, and CWC gauge locations for streamflow and nutrients. There are a total of 17 stations, out of which 11 stations have both streamflow and nutrient data and rest only have streamflow data. It is important to note that the map only shows stations for which we have used data in this study. CWC also maintains several other stations but these stations did not have enough data points, hence they were not included in the study.
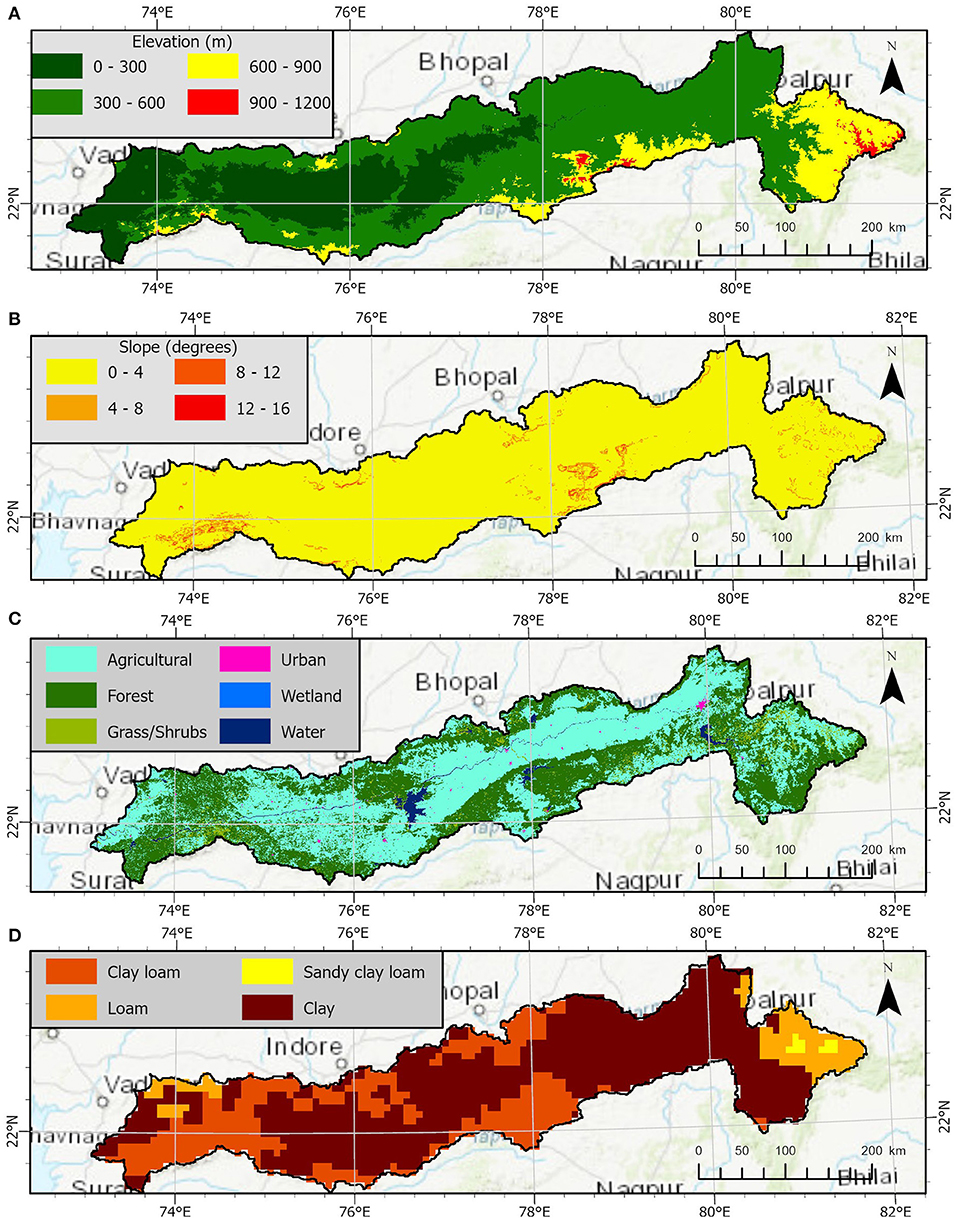
Figure 2. (A–D): (A) Digital Elevation Model (DEM) map; (B) Slope map; (C) Land cover map. (D) Soil map used as topographical and spatial input forcing for setting up the SWAT model.
Elevation data was obtained using DEM from the Shuttle Radar Topography Mission (SRTM) (Farr et al., 2007). SRTM generated high-resolution topographical data from its mission conducted in 2000. It is a global dataset with high-resolution (30 m) as well as low-resolution (90 m) products extending from 60° N to 60° S (Berry et al., 2007). This dataset is distributed by the United States Geological Survey (USGS) and is available from the Earth explorer platform. The SRTM system consisted of two radar antennas to obtain interferometric imagery of the topography of the Earth's surface. This dataset has been assessed using non-oceanic Ground Control Points (GCPs) measured from kinematic GPS (Rodríguez et al., 2005) and displays good performance of DEM specifically for regions with low gradients. In this study, we use the 90 m void filled product.
In this study, we used the land cover data from European Space Agency (ESA) Climate Change Initiative (CCI) land cover products. CCI provides global annual land-cover maps for 1992–2018 at a spatial resolution of 300 m. The land cover map for 1992–1999 were obtained from AVHRR, for 1998–2012 were obtained from SPOT Vegetation, and for 2013 onwards were obtained from PROBA-V and Sentinel-3 OLCI. The product classifies the imagery into 22 distinct land-cover classes. We use the Version 2.0.7 land cover product from 2010 which accurately classifies irrigated cropland, rainfed cropland, forested areas, urban and barren areas validated using the Globcover 2009 validation dataset (ESA, 2017). There are 6 major land cover types in the Narmada River basin with “Agricultural land” being the most common type (Table 2) with 53.7% of the geographical area inside the watershed. Following specific crops were used for the “Agricultural” land-cover type: Rice, sorghum, soybean, and wheat. And for the “Forest” land-cover type, “Broadleaved Deciduous,” and “Needleleaved Deciduous” were the specific forest types used. This study does not take into account crop rotation patterns inside the river basin.
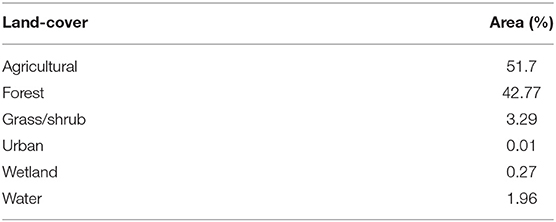
Table 2. Land cover class distribution in the Narmada River basin.
The soils data from the Food and Agriculture Organization (FAO) is used for this study. The soil map was available at a scale of 1:5,000,000 at global level. This dataset was produced as a collaboration of FAO and UNESCO in 1961 and it took 20 years to compose the global dataset (http://www.fao.org/soils-portal/data-hub/soil-maps-and-databases/faounesco-soil-map-of-the-world/en/).
Rainfall and air temperature data were obtained from the Indian Meteorological Department (IMD). IMD provides gridded rainfall and minimum and maximum air temperature at 0.25° spatial resolution. IMD maintains rainfall records from a network of ~6,329 rain gauges and 395 temperature gauges across different parts of India with varying time spans of data collection. The data collected by these in-situ stations had been interpolated to the latitudinal and longitudinal grids using Shepard's interpolation technique (Rajeevan et al., 2006; Srivastava et al., 2009). In this study, we used the gridded rainfall and temperature product from 2001 to 2019. The remaining meteorological datasets—solar radiation, wind speed, and relative humidity were obtained from the global Climate Forecast System Reanalysis (CFSR) system (Saha et al., 2010).
The observed streamflow data required for the SWAT hydrological model calibration was obtained from the Central Water Commission (CWC)—the central water resource management body of the Government of India. CWC maintains a network of 29 surface water measurement locations. Out of these 29 stations, only 17 locations had adequate streamflow observations (Figure 1). These stations were selected on the basis of more than 50% observational data points for the study time period of 2001–2019 (Table 3).
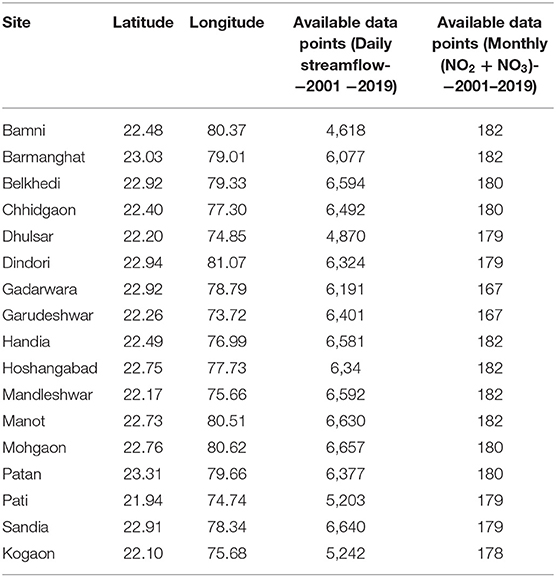
Table 3. Table shows the streamflow and nutrients data available at each gauge location in the Narmada River basin.
CWC monitors nutrients in water at 29 different locations inside the Narmada River Basin. Out of 29, only 11 stations had adequate (NO2 + NO3) observations (Figure 1). These stations were again selected on the basis of more than 50% observational data points for the study time period of 2001–2019. The study utilizes only (NO2 + NO3) data out of the 24 nutrient parameters given. Table 3 provides a comprehensive list of all the streamflow and nutrient measurement observations collected from the stations. This data can be downloaded from the Water Resources Information System (WRIS) India website. Further information about this data can be found at https://indiawris.gov.in/wiki/doku.php.
This section describes the methods used in our study—the hydrological model and analysis of the nutrients. The section is divided into three sub-sections. The first sub-section explains the SWAT model setup and the pre-processing of the input data for the model. The second sub-section describes the calibration and validation process for the SWAT model. In the final sub-section, we describe the analysis performed on the comparison of simulated with the observations for the nutrients.
Soil Water Assessment Tool (SWAT) is a semi-distributed, continuous daily timestep hydrological model developed by the United States Department of Agriculture (USDA) in collaboration with Texas A&M University. This model can simulate the hydrology of small to river-basin scale watersheds (Neitsch et al., 2011; Abbaspour et al., 2015). The SWAT model has application that range from soil erosion to analyzing non-point source pollution (Arnold et al., 1998). This model can simulate quality and quantity of surface water and can assess the impact of environmental change due to land-use and agricultural management practices (Jayakrishnan et al., 2005). The inputs to this model are spatial data which includes DEM, land-use/land cover, soils and meteorological data including precipitation, temperature, solar radiation, wind speed, and relative humidity (Figure 2). The model divides the watershed into sub-basins and further divides them into Hydrological Response Units (HRUs) which are a combination of slope class, land cover type, and soil type. The modeling of the watershed is done in two phases: land phase and routing phase. The land phase estimates the runoff for each of these HRUs using the water balance equation:
Where SW = Soil Moisture content, R = Precipitation, Q = Surface runoff, E = Evapotranspiration, W = Infiltration, and Q = Groundwater.
Penman-Monteith method was used for estimation of the potential evapotranspiration. The generated runoff is then routed through the stream network to the outlet of the watershed in the routing phase. The Muskingum routing method was used for the routing of water in the streams. The percentage distribution of each land-cover type has changed marginally over the study period (Supplementary Table S1). Hence, we use a single land-use land-cover map for the study.
The model is then calibrated using the software called SWAT Calibration and Uncertainty Procedures (SWAT-CUP). For model calibration, the Sequential Uncertainty Fitting (SUFI2) method was used (Abbaspour et al., 2004). The model was run with warm up period of 3 years (1998–2000), then was calibrated for streamflow from 2001 to 2010, and finally validated for 2011–2019. (Pandey et al., 2019) used 14 parameters associated with streamflow to calibrate their SWAT model for the Upper Narmada basin. In this study, those 14 parameters were used with 10 iterations of 500 simulations to perform multi-site calibration of the model for entire Narmada River basin (Table 4). The 14 parameters were calibrated for streamflow at 5 different locations along the main channel and tributaries of Narmada River basin (Table 5). Simulated streamflow was compared with observed streamflow using the statistical metrics: Nash-Sutcliffe Efficiency (NSE), correlation coefficient (R2), percent bias (p-bias), and Root Mean Squared Error (RMSE) (Table 5).
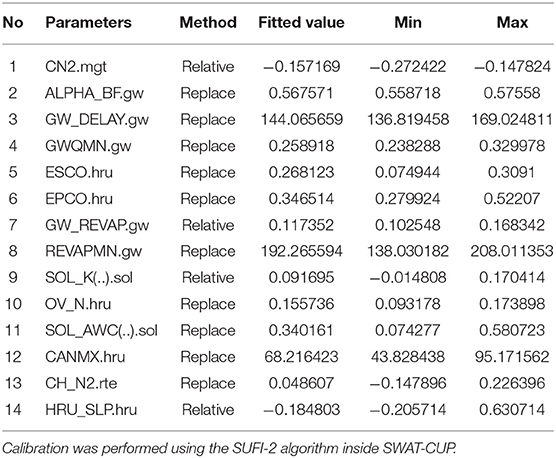
Table 4. Calibrated SWAT parameter ranges for the Narmada River basin.
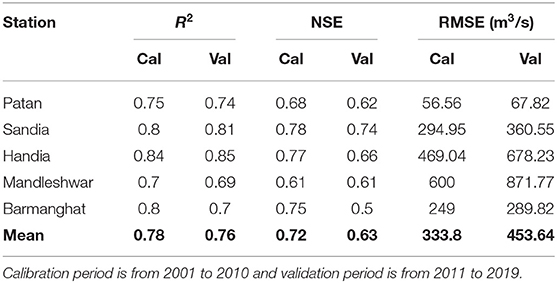
Table 5. Performance of the SWAT model for streamflow calibration and validation at the five calibration sites.
An average value of fertilizer obtained from the Department of Fertilizers, India at district level was used as input to the SWAT model. The average fertilizer consumption in Narmada River basin was for 42 kg/hectares in 2010 as per the Ministry of Agriculture and Farmers Welfare of India. This was used a constant input to all the agricultural land-cover types in the study. We analyze the performance of SWAT model simulated (NO2 + NO3) using three statistical measures—Correlation coefficient (R2), Root mean squared error (RMSE), and Percent Bias (P-Bias). We study the spatial variability of nitrogen concentration and flux as simulated by the SWAT model in monsoon months (June-September). In a river channel, a majority inorganic/mineral nitrogen is present in the form of nitrites (NO2) and nitrates (NO3). Since, the concentration of nitrite is very less in water (not more than 7% of total dissolved nitrogen), nitrogen is reported as (NO2 + NO3). In addition to the spatial variability of mean monsoon concentration and mean monsoon flux, trends in concentration and flux were estimated using Mann-Kendall trend test and Sen's slope estimator (Lettenmaier, 1988).
In the calibration phase, the SWAT model achieved a mean NSE of 0.72 and a mean R2 of 0.78 (Table 5). These values indicate that the model performs well in the calibration phase. Similar studies conducted for Narmada River Basin also show comparable performance (Mishra and Lilhare, 2016; Pandey et al., 2019). Multi-site calibration by Pandey et al. (2019) had NSE in of 0.77 for the streamflow locations inside the Narmada River Basin whereas Mishra and Lilhare (2016) had NSE of 0.96 and correlation coefficient of 0.98 for the calibration period of 1973–77. The model was only calibrated for the streamflow related parameters (Table 4). We found CN2 and ESCO as the most important parameters in the calibration of the SWAT model. CN2 represents the curve number for corresponding HRU which is a function of antecedent soil moisture conditions and soil's permeability. ESCO represents the Soil Evaporation Compensation Factor which allows the user to modify depth distribution for evaporative demand. These two factors combined represent primary HRU characteristic affecting overland flow for the Narmada River Basin. For the validation phase, the SWAT model achieved a NSE of 0.63 and R2 of 0.76 (Table 5). The literature on hydrological model building suggests NSE > 0.5 as a good model (Moriasi et al., 2015; Mishra and Lilhare, 2016; Anand et al., 2018; Pandey et al., 2019). Since the model showed NSE > 0.5 for both the calibration and validation phase, we used this model to compare the observed and simulated nutrients (N). We evaluate the time series of calibrated and validated streamflow data (Figure 3). We observe that the simulated streamflow peaks match the observed streamflow peaks and the low flows have been captured well in the calibration as well as the validation phase for all 5 calibration sites. The extreme flow values are also correctly simulated as observed from 2013 high flow peak for all sites except for Barmanghat. In addition to this, the Narmada basin experiences several extreme flood events every decade which are captured sufficiently well in the calibrated model. For instance, from 2001 to 2010, there were two significant flood events in 2003 and 2005, respectively, and for 2011–2019, there was one significant flood event in 2013. After calibration and validation of the parameters, the SWAT model was run for the entire time period of 2001–2019 using calibrated parameter values. The performance of streamflow at 17 stations and of N at 11 stations were estimated using hydrological model evaluation statistics (Figures 4, 5). Eight stations had NSE <0.5 and 11 stations had R2 > 0.75 for streamflow comparison. No patterns were observed in terms of the presence of biased model performance in upstream or downstream part of the river basin. For nutrient comparison, only four out of eleven stations had R2 > 0.2. These stations belong to the mainstream channel of Narmada River whereas rest of the stations with lower R2 with most of them located along the tributaries of the Narmada River.
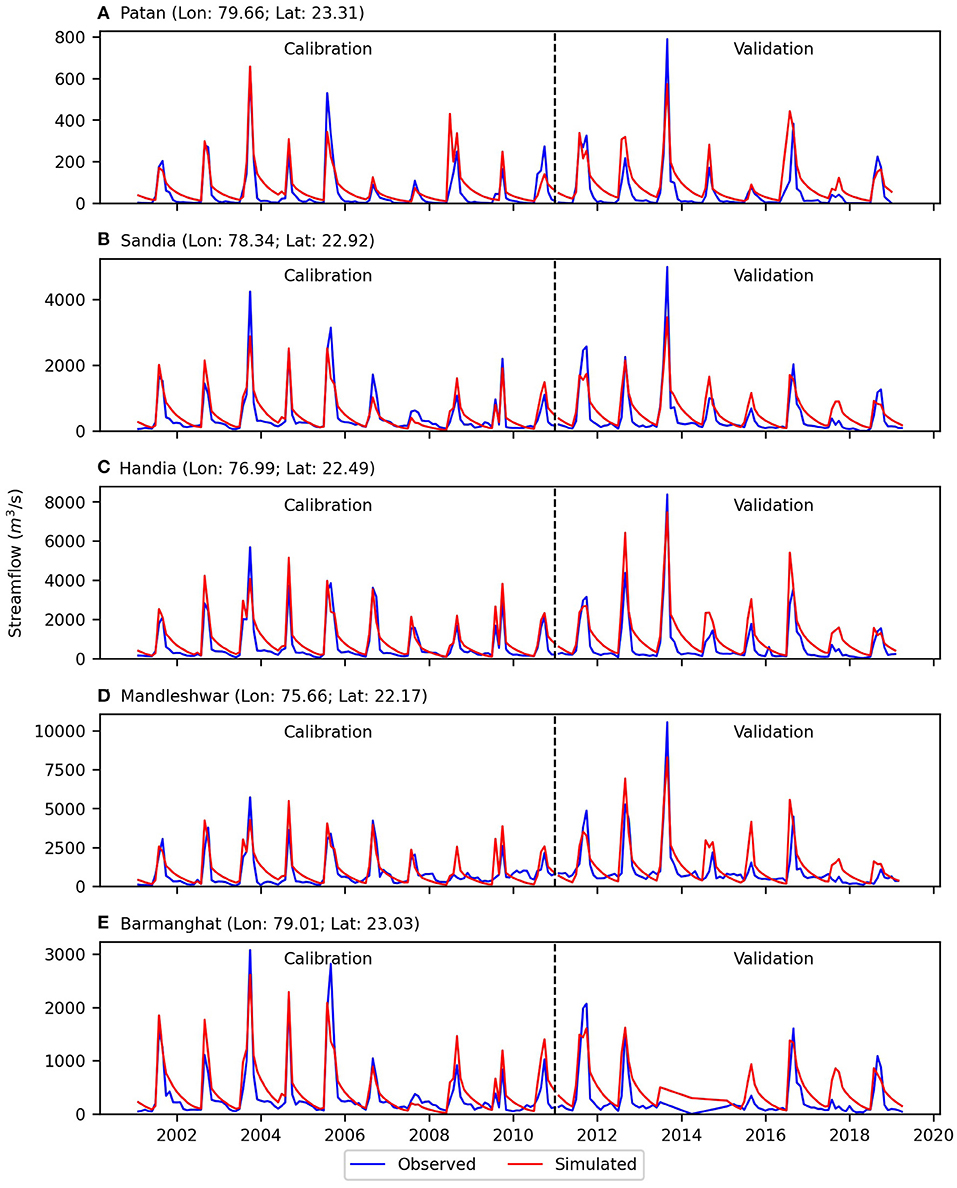
Figure 3. (A–E): Time series of streamflow comparison between simulated and observed (CWC) streamflow for calibration and validation phase. Calibration was performed for 2001–2010 and validation was performed for 2011–2019. Black dotted line represents the end of calibration period and start of validation period for simulation.
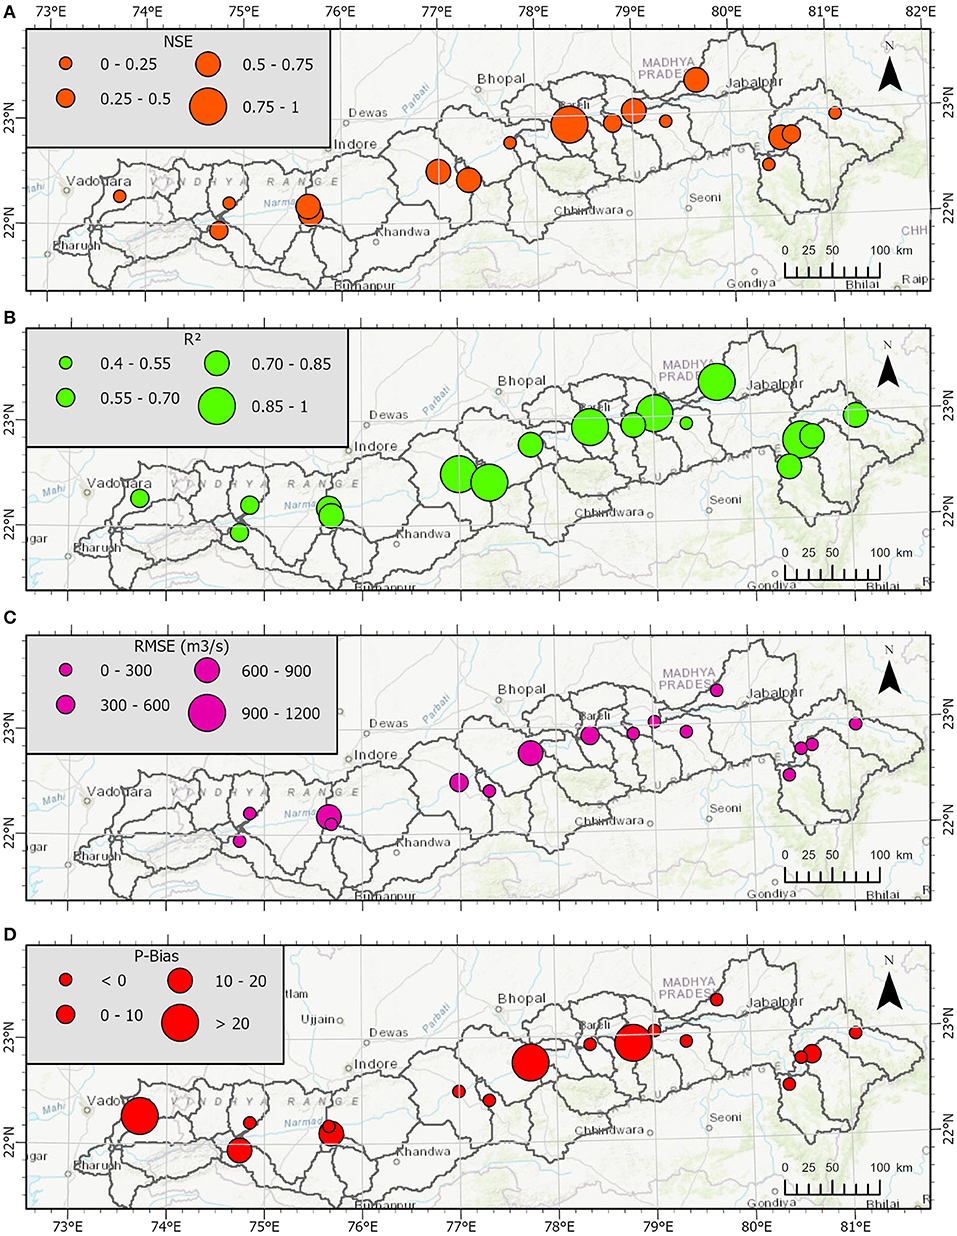
Figure 4. (A–D): SWAT model performance statistics for streamflow simulation. (A) Nash-Sutcliffe efficiency, (B) Correlation coefficient squared, (C) Root mean squared error, and (D) Percent bias, for 17 gauge locations inside the Narmada River basin.
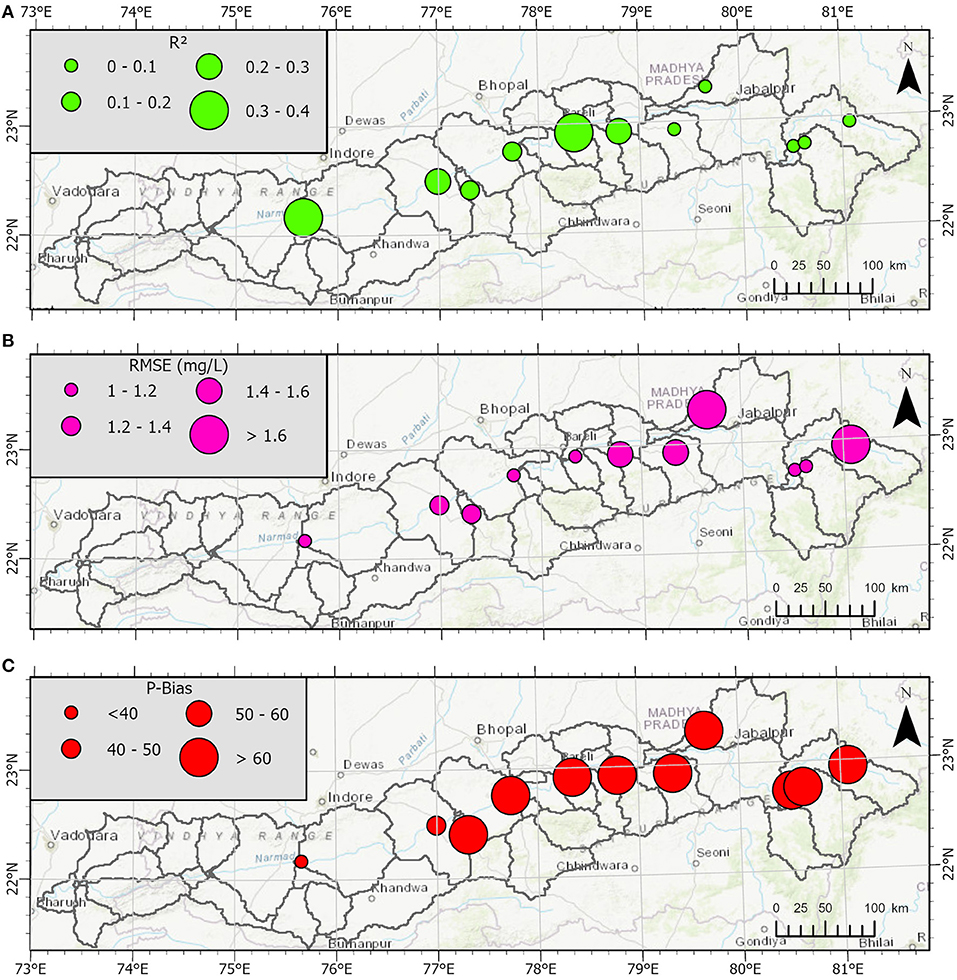
Figure 5. (A–C): SWAT model performance statistics for nutrient simulation. (A) Correlation coefficient squared, (B) Root mean squared error, (C): Percent bias, for 11 gauge locations inside the Narmada River basin.
To understand the temporal variations, we examine the time-series of N (NO2 + NO3) concetration at a few selected reach locations (Figure 6). Three sites—Handia, Mandleshwar, and Sandia were selected for the time series analysis. Mandleshwar is located toward the downstream end whereas Sandia is located at the upstream end and Handia is between these two locations along the main chanel. For the upstream locations of Handia and Sandia, we observe that there exists low correlation between the simulated and observed nutrient concentration which is significant at a p-value of 0.05. Sandia shows the highest correlation amongst the upstream locations with R2 = 0.36. For all three locations, there was no observation data for (NO2 + NO3) after 2016. For the early simulation period (2001–2005), it is seen that the simulated and observed time-series are highly correlated. Additionally, the peaks for the simulated nutrient load were underestimated by the model for all the upper reach locations for a major portion of the 2005–2015 period. The extreme values of nutrient concentrations were underestimated by the model. For instance, the bias for extreme event ranges up to 7 mg/L for Handia as observed in the monsoon of 2013. Bias for Mandleshwar is relatively less (3 mg/L) as compared to Handia and Sandia. High values of nutrient concentrations were observed during the monsoon than pre-monsoon or post-monsoon season for both upstream and downstream stations. In Mandleshwar and Sandia, (NO2 + NO3) concentrations vary between 0 and 1.5 mg/L, during the pre-monsoon and 0.3–2.0 mg/L during the post-monsoon season. During monsoon months, Handia showed higher (NO2 + NO3) (2–10 mg/L) concentrations. The reason for high concentration of (NO2 + NO3) during monsoon season is due to the fact that higher precipitation during monsoon season causes the surface runoff to increase and this washes out fertilizer and sewage wastes from the overland locations and moves it to the stream network and then to the river.
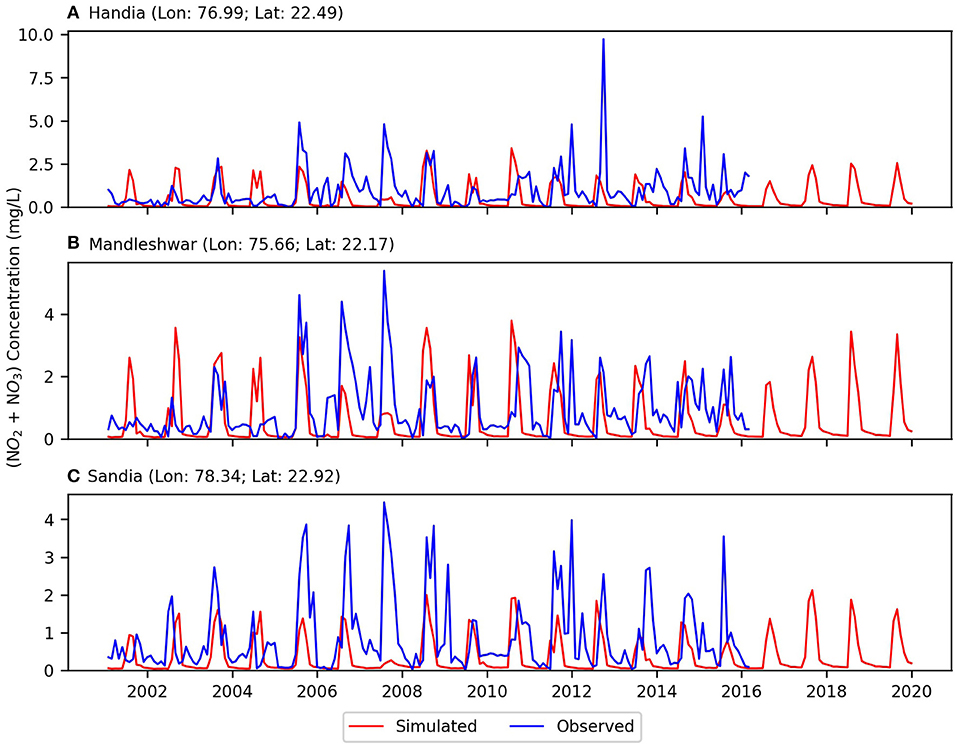
Figure 6. (A–C): Time series of (NO2 + NO3) concentration for comparison between SWAT simulated nutrients and CWC observed nutrient data.
We also examine the time-series of N (NO2 + NO3) flux at three sites—Handia, Mandleshwar, and Sandia (Figure 7). For the upstream locations of Handia and Sandia, we observe that there exists fairly good correlation between the simulated and observed nutrient flux after 2008. For all three locations, there was no observation data for (NO2 + NO3) after 2016. For the early simulation period (2001–2005), it is seen that the simulated and observed time-series are poorly correlated. Additionally, the peaks for the simulated nutrient load were overestimated by the model for all the upper reach locations for normal events of the 2001–2008 period but significantly underestimated during the extreme events of high concentration. For instance, the bias for extreme event ranges up to 40 Kilo Tons (KT) for Handia as observed in Monsoon 2013. Bias for Mandleshwar is relatively less (20 KT) as compared to Handia and Sandia. High values of nutrient flux were observed during the monsoon than pre-monsoon or post-monsoon season for both upstream and downstream stations.
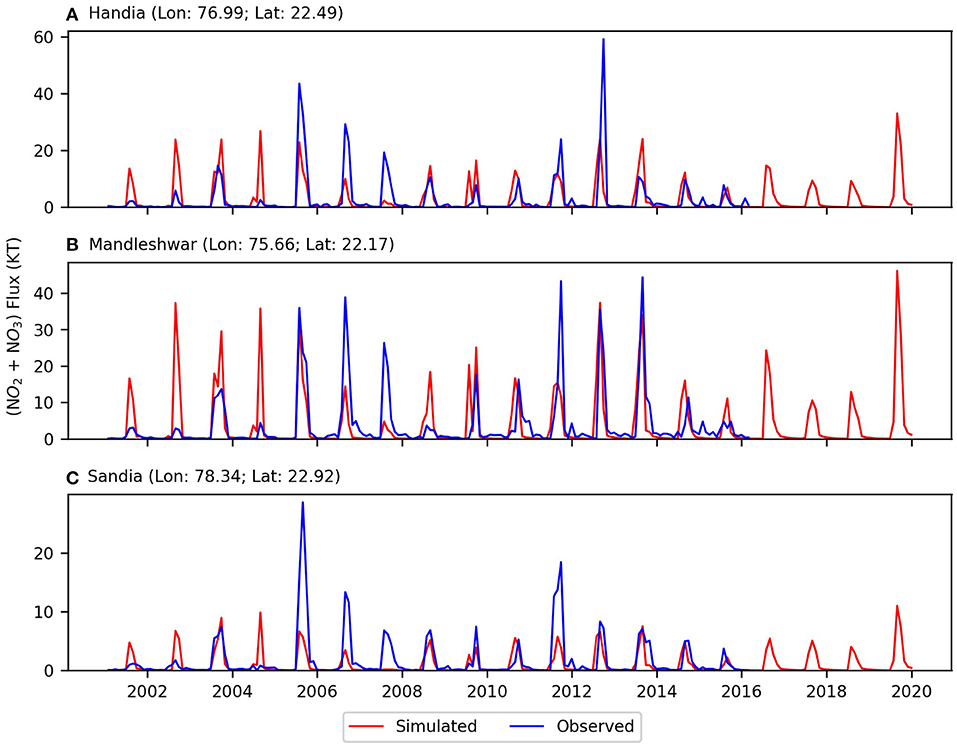
Figure 7. (A–C) Time series of (NO2 + NO3) flux for comparison between SWAT simulated nutrients and CWC observed nutrient data. The unit of flux is Kilo Tons (KT).
The mean monsoonal concentration (mg/L) and flux (Kilo Tons - KT) for each subbasin of the Narmada River Basin for nitrogen are shown in Figure 8. From the distribution, it is observed that nutrient concentration and flux map spatially correlate very well. The downstream locations have high nutrient concentration along the main channel in the range of 0.4–0.8 mg/L for the entire subbasin. Similarly, the downstream locations have high nutrient flux along the main channel with a range of 200–500 KT. One possible reason for high concentrations and fluxes in the main channel is due to the presence of a large area of agricultural land in these regions where N based fertilizer is utilized. From the land use map (Figure 2), it can be observed that all the agricultural land are present only near the main channel leading to overland flow washing the soil and carrying nutrients to the main channel. Further, we also observe that in terms of absolute quantities, the nutrient concentration in main channel is 6–8 times higher than that tributary subbasins.
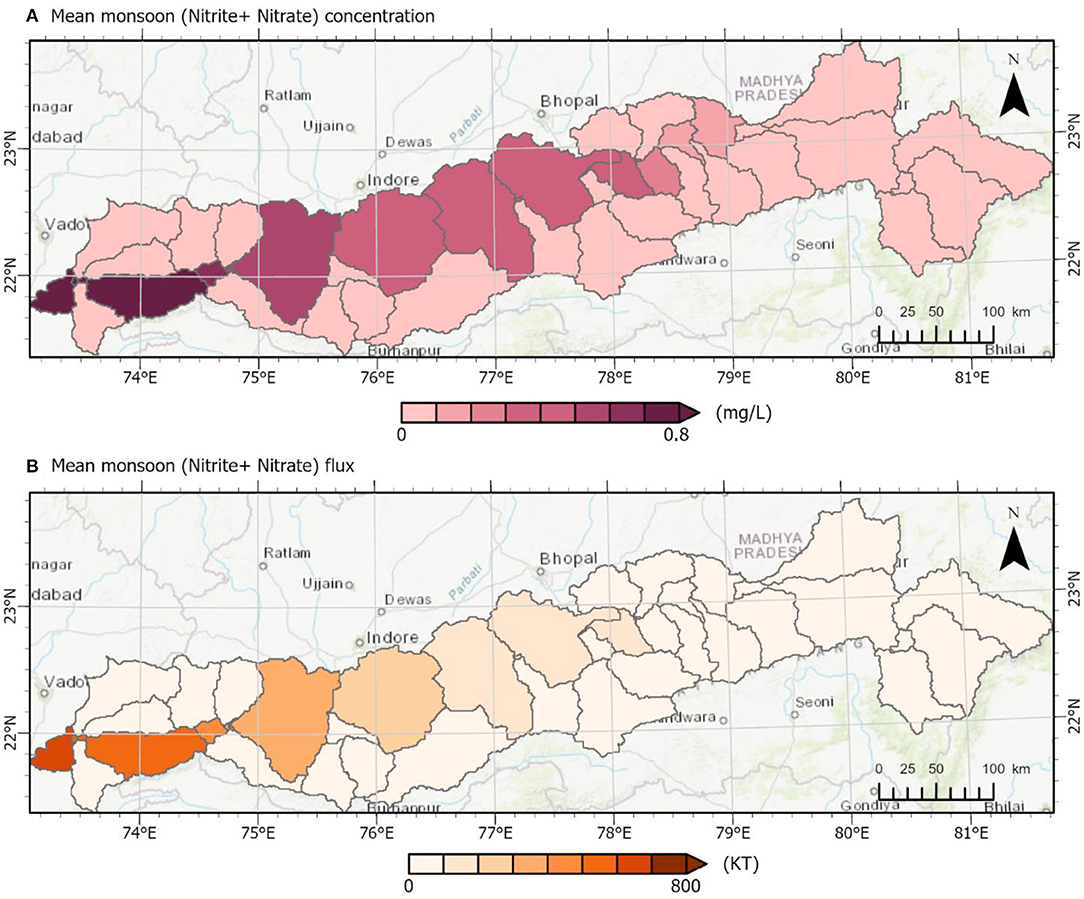
Figure 8. (A,B): (A) Mean monsoonal (NO2 + NO3) concentration spatial variation across the subbasins in the Narmada River basin. (B) Mean monsoonal (NO2 + NO3) flux spatial variation across the subbasins in the Narmada River basin. The flux values are in the order Kilo Tons (KT). Monsoonal concentration was obtained by taking mean of concentration values for individual months from June to September. Monsoonal flux was obtained by summation of flux values for individual months from June to September.
In addition to spatial comparison of mean concentration and mean flux, we estimated the monotonic trends in subbasins for monsoon season using Mann-Kendall non-parametric trend test from 2001 to 2019 (Figure 9). It is interesting to note that for concentration trends, we only found increasing concentration trends which are significant at 95% confidence level. Tributary subbasins lying on the outer boundaries of the Narmada watershed showed an increasing trend in N concentration. One possible reason is that these subbasins have undergone land cover changes from forest to agricultural lands leading to more usage nitrogen containing fertilizers and hence leading to pockets of increasing nitrogen concentrations. Rest of the subbasins showed neither increasing nor decreasing trends in nutrient concentration. Additionally, we also estimated the trends in nutrient flux for all the subbasins of Narmada River basin. We found only one subbasin with a decreasing trend in nutrient fluxes. This subbasin belong to the area where outlet of the Narmada River basin is present. In spite of increasing concentration trend in this subbasin, it depicts decreasing flux of nitrogen. The only possible explanation for this observation is that the streamflow has decreased over this subbasin (Flux = Concentration * Discharge). Rest of the subbasins showed neither increasing nor decreasing trend of nutrient flux.
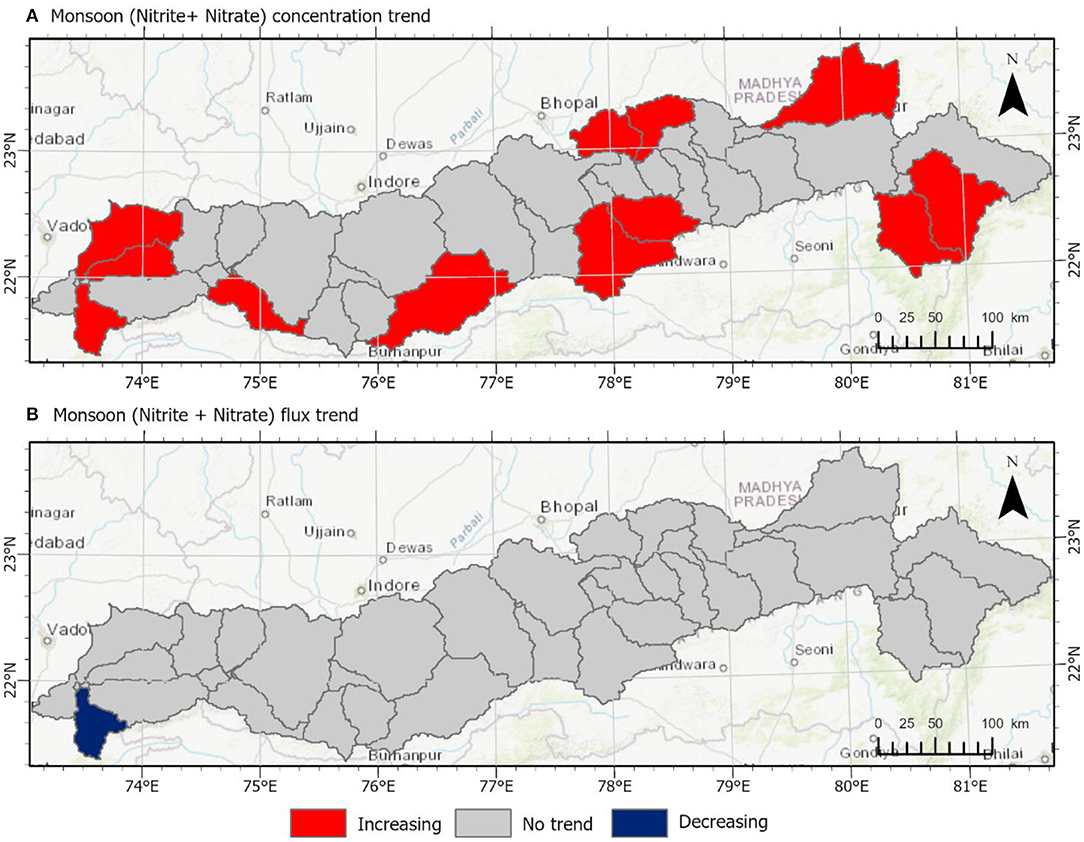
Figure 9. (A,B): (A) Monsoonal (NO2 + NO3) concentration trend spatial variation across the Narmada River basin. (B) Monsoonal (NO2 + NO3) flux trend spatial variation across the Narmada River basin. Mann-Kendall trend test was used to estimate the monotonic trends for each subbasin. All trends are significant at p < 0.05.
This study builds a semi-distributed physically based hydrological model (SWAT) to characterize the catchment hydrology and nutrient transport for the Narmada River Basin. Using the flow calibrated hydrological model, we compare simulated and observed nutrients flows (N) at 17 locations inside the Ganga River Basin.
The SWAT model proved to be a useful hydrological model especially for an agriculture dominant watershed like the Narmada River Basin. Through the calibration of flow parameters, we obtain mean R2 of 0.77 during the calibration phase (2001–2010) and mean R2 of 0.76 during the validation phase (2011–2019) for streamflow at the five calibration sites. The analysis shows that the SWAT model adequately captures the hydrologic characteristics of the Narmada River basin. This model can be effectively used for water resource and land use management.
The capabilities of the SWAT model that facilitate extensive modeling of nutrient fluxes also has certain limitations. The SWAT model requires forcing data, which involves significant pre-processing of the input datasets which is computationally expensive for a large river basin. There are also problems in modeling reservoir processes as well as point and non-point source pollution due to the absence of adequate observation data, required data for input parameters, and lack of technical understanding pertaining to the Narmada River Basin. The SWAT model is a semi-distributed model which implies all the spatial variability within a HRU is ignored in the model, which limits applications at high spatial resolution. Finally, constant land use was assumed for the period of analysis which might influence the results of the model. The study does not account for major reservoirs and their operations as there was a lack of consistent operational data available for reservoirs inside the river basin.
The time series and spatial plots of total N reveal that the main channel of the Narmada River basin have 4–8 times higher concentration and fluxes of N as compared to the other regions. The mean monsoonal N concentration at reach locations such as Sandia and Patan are in the range of 2–6 mg/L, whereas upper reach locations such as Mandleshwar are in the range of 6–12 mg/L. This is due to the fact that anthropogenic activities—specifically farming, are more extensive near the main channel of the basin (compared to the tributaries), and these activities use large amounts of N and P based fertilizers, excess of which is drained into the river through run-off. An average value of fertilizer input for all the agricultural land cover type for our SWAT model was used. In addition, the SWAT model was calibrated for nutrient related parameters only. This led to a significant mismatch in observed and simulated nutrient concentration. But the nutrient fluxes simulated by our model match up quite well. We conclude that our SWAT model can be used for accurate analysis for fluxes.
From our land-cover change analysis, we find that the agricultural land increased from 62.1 to 66.7% from 2000 to 2018. An average value of fertilizer input for all agricultural land inside the river basin obtained from Department of Fertilizers India at district level was used. Since the focus of this study was to account for the non-point sources of pollution mainly caused by fertilizers, we did not include any point source pollution inside our model simulations. Inclusion of point sources involves tremendous amount of work with preparing the list of industries and sewage treatment plants inside the river basin. Also, there is no central platform which reports the amount of effluents discharged into the river. Hence, this was out of scope for this study and this inspires future work which can build on this study.
Nitrogen concentration during Kharif season was observed to be more than two times higher as compared to the Rabi season. In Narmada River basin, the agricultural lands are cultivated for both Kharif and Rabi seasons with different crop cycles around the year. Due to this reason, we observe high concentrations of nitrogen for the whole year with concentration being highest in Monsoon season. The highest concentration in Monsoon season is due to the fact that this river basin lied in a temperate climate and it receives majority of rainfall during Monsoon season. Farmers in this region try to maximize the usage of rainwater to cultivate their lands causing high nitrogen concentration and flux in monsoon season.
The study attempts to analyse the impact of farming on river flow by comparing the nutrient changes from the in-situ measured data with the simulated data from the SWAT model. The analysis shows that in the tributary subbasins, which predominantly remain unexploited, there are lower absolute concentration of N but, there is a noticeable increase in their nutrient concentration over the study period of 2001–2019. This study establishes the general understanding of nutrient pollution using non-point sources mainly caused by fertilizer usage in agriculture. With future work focusing on crop cycles and incorporating LULC changes in SWAT model simulations, we can further identify the crop cycling patterns affecting the concentrations of nitrogen inside the river basin. This will further help in planning of crop cycles for the region for the most efficient and sustainable use of land.
The results of this and similar studies can help water resources planners. As the main channel contains higher concentrations of nitrogen, this water may need to be treated for domestic consumption to ensure safe health. Higher concentration of nitrogen in water may have implications in agricultural and/or industrial water use as well. Water resources planning using these results can help in controlling the agricultural application of fertilizers (specifically in the pre-monsoon/monsoon periods) when a higher rate of flux of nutrients may reach the main channel.
The raw data supporting the conclusions of this article will be made available by the authors, without undue reservation.
PK and VL: conceptualization, methodology, and writing (review and editing). PK: data analysis, validation, and writing (original draft). All authors have read and agreed to the published version of the manuscript.
The authors declare that the research was conducted in the absence of any commercial or financial relationships that could be construed as a potential conflict of interest.
All claims expressed in this article are solely those of the authors and do not necessarily represent those of their affiliated organizations, or those of the publisher, the editors and the reviewers. Any product that may be evaluated in this article, or claim that may be made by its manufacturer, is not guaranteed or endorsed by the publisher.
I would like to acknowledge Mr. Hung Manh Le for his critical insights and feedback in the preparation of this manuscript.
The Supplementary Material for this article can be found online at: https://www.frontiersin.org/articles/10.3389/frwa.2021.765957/full#supplementary-material
Abbaspour, K. C., Johnson, C. A., and van Genuchten, M. T. (2004). Estimating uncertain flow and transport parameters using a sequential uncertainty fitting procedure. Vadose Zo. J. 3, 1340–1352. doi: 10.2136/vzj2004.1340
Abbaspour, K. C., Rouholahnejad, E., Vaghefi, S., Srinivasan, R., Yang, H., and Kløve, B. (2015). A continental-scale hydrology and water quality model for Europe: calibration and uncertainty of a high-resolution large-scale SWAT model. J. Hydrol. 524, 733–752. doi: 10.1016/j.jhydrol.2015.03.027
Anand, J., Gosain, A. K., Khosa, R., and Srinivasan, R. (2018). Regional scale hydrologic modeling for prediction of water balance, analysis of trends in streamflow and variations in streamflow: the case study of the Ganga River basin. J. Hydrol. Reg. Stud. 16, 32–53. doi: 10.1016/j.ejrh.2018.02.007
Arnold, J. G., Srinivasan, R., Muttiah, R. S., and Williams, J. R. (1998). Large area hydrologic modeling and assessment part I: model development. J. Am. Water Resour. Assoc. 34, 73–89. doi: 10.1111/j.1752-1688.1998.tb05961.x
Basha, G., Kishore, P., Ratnam, M. V., Jayaraman, A., Kouchak, A. A., Ouarda, T. B. M. J., et al. (2017). Historical and projected surface temperature over India during the 20th and 21st century. Sci. Rep. 7:2987. doi: 10.1038/s41598-017-02130-3
Berry, P. A. M., Garlick, J. D., and Smith, R. G. (2007). Near-global validation of the SRTM DEM using satellite radar altimetry. Remote Sens. Environ. 106, 17–27. doi: 10.1016/j.rse.2006.07.011
Billah, M. M., Goodall, J. L., Narayan, U., Reager, J. T., Lakshmi, V., and Famiglietti, J. S. (2015). A methodology for evaluating evapotranspiration estimates at the watershed-scale using GRACE. J. Hydrol. 523, 574–586. doi: 10.1016/j.jhydrol.2015.01.066
ESA (2017). Land cover cci product user guide version 2. Technical Report. Available online at: maps.elie.ucl.ac.be/CCI/viewer/download/ESACCI-LC-Ph2-PUGv2_2.0.pdf.
Fang, B., and Lakshmi, V. (2014). Soil moisture at watershed scale: remote sensing techniques. J. Hydrol. 516, 258–272. doi: 10.1016/j.jhydrol.2013.12.008
Fang, B., Lakshmi, V., Bindlish, R., and Jackson, T. J. (2018). Downscaling of SMAP soil moisture using land surface temperature and vegetation data. Vadose Zo. J. 17:170198. doi: 10.2136/vzj2017.11.0198
Fang, B., Lakshmi, V., Bindlish, R., Jackson, T. J., Cosh, M., and Basara, J. (2013). Passive microwave soil moisture downscaling using vegetation index and skin surface temperature. Vadose Zo. J. 12:vzj2013.05.0089. doi: 10.2136/vzj2013.05.0089
Fang, B., Lakshmi, V., Bindlish, R., Jackson, T. J., and Liu, P. W. (2020). Evaluation and validation of a high spatial resolution satellite soil moisture product over the Continental United States. J. Hydrol. 588:125043. doi: 10.1016/j.jhydrol.2020.125043
Fang, B., Lakshmi, V., Jackson, T. J., Bindlish, R., and Colliander, A. (2019). Passive/active microwave soil moisture change disaggregation using SMAPVEX12 data. J. Hydrol. 574, 1085–1098. doi: 10.1016/j.jhydrol.2019.04.082
Farr, T. G., Rosen, P. A., Caro, E., Crippen, R., Duren, R., Hensley, S., et al. (2007). The shuttle radar topography mission. Rev. Geophys. 45:G2004. doi: 10.1029/2005RG000183
Gosain, A., Rao, S., and Basuray, D. (2006). Climate change impact assessment on hydrology of Indian river basins on JSTOR. Curr. Sci. 90, 346–353. Available online at: http://www.jstor.org/stable/24091868
Gupta, H., and Chakrapani, G. J. (2005). Temporal and spatial variations in water flow and sediment load in Narmada River Basin, India: natural and man-made factors. Environ. Geol. 48, 579–589. doi: 10.1007/s00254-005-1314-2
Hashemi, H., Nordin, M., Lakshmi, V., Huffman, G. J., and Knight, R. (2017). Bias correction of long-term satellite monthly precipitation product (TRMM 3B43) over the conterminous United States. J. Hydrometeorol. 18, 2491–2509. doi: 10.1175/JHM-D-17-0025.1
Jayakrishnan, R., Srinivasan, R., Santhi, C., and Arnold, J. G. (2005). Advances in the application of the SWAT model for water resources management. Hydrol. Process. 19, 749–762. doi: 10.1002/hyp.5624
Kansara, P., Li, W., El-Askary, H., Lakshmi, V., Piechota, T., Struppa, D., et al. (2021). An assessment of the filling process of the grand ethiopian renaissance dam and its impact on the downstream countries. Remote Sens. 13:711. doi: 10.3390/rs13040711
Kim, H., and Lakshmi, V. (2019). Global dynamics of stored precipitation water in the topsoil layer from satellite and reanalysis data. Water Resour. Res. 55, 3328–3346. doi: 10.1029/2018WR023166
Kim, H., Lakshmi, V., Kwon, Y., and Kumar, S. V. (2021). First attempt of global-scale assimilation of subdaily scale soil moisture estimates from CYGNSS and SMAP into a land surface model. Environ. Res. Lett. 16. doi: 10.1088/1748-9326/ac0ddf
Krishna, M. S., Prasad, M. H. K., Rao, D. B., Viswanadham, R., Sarma, V. V. S. S., and Reddy, N. P. C. (2016). Export of dissolved inorganic nutrients to the northern Indian Ocean from the Indian monsoonal rivers during discharge period. Geochim. Cosmochim. Acta 172, 430–443. doi: 10.1016/j.gca.2015.10.013
Lakshmi, V., Fayne, J., and Bolten, J. (2018). A comparative study of available water in the major river basins of the world. J. Hydrol. 567, 510–532. doi: 10.1016/j.jhydrol.2018.10.038
Lakshmi, V., and Wood, E. F. (1998). Diurnal cycles of evaporation using a two-layer hydrological model. J. Hydrol. 204, 37–51. doi: 10.1016/S0022-1694(97)00108-X
Lakshmi, V., Wood, E. F., and Choudhury, B. J. (1997). A soil-canopy-atmosphere model for use in satellite microwave remote sensing. J. Geophys. Res. Atmos. 102, 6911–6927. doi: 10.1029/96JD03763
Le, M. H., Lakshmi, V., Bolten, J., Bui, D., and Du (2020). Adequacy of satellite-derived precipitation estimate for hydrological modeling in vietnam basins. J. Hydrol. 586:124820. doi: 10.1016/j.jhydrol.2020.124820
Lettenmaier, D. P.. (1988). Multivariate nonparametric tests for trend in water quality1. JAWRA J. Am. Water Resour. Assoc. 24, 505–512. doi: 10.1111/j.1752-1688.1988.tb00900.x0
Madhusoodhanan, C. G., Sreeja, K. G., and Eldho, T. I. (2016). Climate change impact assessments on the water resources of India under extensive human interventions. Ambio 45, 725–741. doi: 10.1007/s13280-016-0784-7
Mall, R. K., Gupta, A., Singh, R., Singh, R. S., and Rathore, L. S. (2006). Water resources and climate change: An Indian perspective. Curr. Sci. 90, 1610–1626. Available online at: https://doi.org/http://www.jstor.org/stable/24091910
Mishra, V., and Lilhare, R. (2016). Hydrologic sensitivity of Indian sub-continental river basins to climate change. Glob. Planet. Change 139, 78–96. doi: 10.1016/j.gloplacha.2016.01.003
Mohammed, I. N., Bolten, J. D., Srinivasan, R., and Lakshmi, V. (2018). Satellite observations and modeling to understand the Lower Mekong River Basin streamflow variability. J. Hydrol. 333, 413–430. doi: 10.1016/j.jhydrol.2018.07.030
Mondal, A., and Lakshmi, V. (2021). Estimation of total water storage changes in India. 14, 1294–1315. doi: 10.1080/17538947.2021.1914759
Mondal, A., Lakshmi, V., and Hashemi, H. (2018). Intercomparison of trend analysis of multisatellite monthly precipitation products and gauge measurements for river basins of India. J. Hydrol. 565, 779–790. doi: 10.1016/j.jhydrol.2018.08.083
Moriasi, D. N., Gitau, M. W., Pai, N., and Daggupati, P. (2015). Hydrologic and water quality models: Performance measures and evaluation criteria. Trans. ASABE 58, 1763–1785. doi: 10.13031/trans.58.10715
Neitsch, S. L., Arnold, J. G., Kiniry, J. R., and Williams, J. R. (2011). College Of Agriculture And Life Sciences Soil and Water Assessment Tool Theoretical Documentation Version Temple, Texas (2009).
Pandey, B. K., Khare, D., Kawasaki, A., and Mishra, P. K. (2019). Climate change impact assessment on blue and green water by coupling of representative CMIP5 climate models with physical based hydrological model. Water Resour. Manag. 33, 141–158. doi: 10.1007/s11269-018-2093-3
Rajeevan, M., Bhate, J., Kale, J., and Lal, B. (2006). High resolution daily gridded rainfall data for the Indian region: Analysis of break and active monsoon spells. Curr. Sci. 91, 296–306.
Rijsberman, F. R.. (2006). Water scarcity: fact or fiction? Agric. Water Manag. 80, 5–22. doi: 10.1016/j.agwat.2005.07.001
Rodríguez, E., Morris, C. S., Belz, J. E., Chapin, E. C., Martin, J. M., Daffer, W., et al. (2005). An Assessment of the SRTM Topographic Products. doi: 10.14358/PERS.72.3.249
Saha, S., Moorthi, S., Pan, H.- L., Wu, X., Wang, J., Nadiga, S., et al. (2010). The NCEP climate forecast system reanalysis. Bull. Am. Meteorol. Soc. 91, 1015–1057. doi: 10.1175/2010BAMS3001.1
Saraswat, C., Kumar, P., Dasgupta, R., Avtar, R., and Bhalani, P. (2019). Sustainability assessment of the groundwater quality in the Western India to achieve urban water security. Appl. Water Sci. 9, 1–17. doi: 10.1007/s13201-019-0956-2
Sen, I. S., Boral, S., Ranjan, S., and Tandon, S. K. (2018). Small but important: the role of small floodplain tributaries to river nutrient budgets. ACS Earth Sp. Chem. 2, 64–71. doi: 10.1021/acsearthspacechem.7b00112
Sharma, S., Dixit, S., Jain, P., Shah, K. W., and Vishwakarma, R. (2008). Statistical evaluation of hydrobiological parameters of Narmada River water at Hoshangabad City, India. Environ. Monit. Assess. 143, 195–202. doi: 10.1007/s10661-007-9968-8
Srivastava, A. K., Rajeevan, M., and Kshirsagar, S. R. (2009). Development of a high resolution daily gridded temperature data set (1969–2005) for the Indian region.Atmos. Sci. Lett. 10, 249–254. doi: 10.1002/asl.232
van Beek, L. P. H., Wada, Y., and Bierkens, M. F. P. (2011). Global monthly water stress: 1. Water balance and water availability. Water Resour. Res. 47. doi: 10.1029/2010WR009791
Keywords: Narmada river, SWAT, inorganic nitrogen, concentration, flux, trend analysis
Citation: Kansara P and Lakshmi V (2021) Application of Soil Water Assessment Tool (SWAT) Model in Analyzing Nitrogen Transport Inside the Narmada River Basin. Front. Water 3:765957. doi: 10.3389/frwa.2021.765957
Received: 27 August 2021; Accepted: 18 November 2021;
Published: 13 December 2021.
Edited by:
Chandra Ojha, Indian Institute of Technology Roorkee, IndiaReviewed by:
Praveen Kumar Thakur, Indian Institute of Remote Sensing, IndiaCopyright © 2021 Kansara and Lakshmi. This is an open-access article distributed under the terms of the Creative Commons Attribution License (CC BY). The use, distribution or reproduction in other forums is permitted, provided the original author(s) and the copyright owner(s) are credited and that the original publication in this journal is cited, in accordance with accepted academic practice. No use, distribution or reproduction is permitted which does not comply with these terms.
*Correspondence: Prakrut Kansara, cGhrNWVAdmlyZ2luaWEuZWR1
Disclaimer: All claims expressed in this article are solely those of the authors and do not necessarily represent those of their affiliated organizations, or those of the publisher, the editors and the reviewers. Any product that may be evaluated in this article or claim that may be made by its manufacturer is not guaranteed or endorsed by the publisher.
Research integrity at Frontiers
Learn more about the work of our research integrity team to safeguard the quality of each article we publish.