 Samuel A. Miller
 Steve W. Lyon
- Ohio Agricultural Research and Development Center, School of Environment and Natural Resources, Ohio State University, Wooster, OH, United States
Artificial subsurface (tile) drainage is used in many agricultural areas where soils have naturally poor drainage to increase crop yield and field trafficability. Studies at the field scale indicate that tile drains disproportionately export large soluble reactive phosphorus (SRP) and nitrate loads to downstream waterbodies relative to other surface and subsurface runoff pathways, but knowledge gaps remain understanding the impact of tile drainage to nutrient export at watershed scales. The Western Lake Erie Basin is susceptible to summertime eutrophic conditions driven by non-point source nutrient pollution due to a shallow mean water depth and land use dominated by agriculture. The purpose of this study is to analyze the impact of tile drainage on downstream discharge, nutrient concentrations, and nutrient loads for 16 watersheds that drain to the Western Lake Erie Basin. Daily discharge and nutrient concentrations were summarized annually and during the main nutrient loading period (March–July) for 2 years representing normal nutrient loading period precipitation (2018) and above normal precipitation (2019). Results indicate positive correlations between watershed tile drainage percentage and runoff metrics during 2019, but no relationship during 2018. Additionally, SRP concentration and load were positively correlated to watershed tile drainage percentage in 2019, but not in 2018. Watershed tile drainage percentage was correlated with nitrate concentration and load for both years. The SRP concentration-discharge relationships suggested relatively weak, chemodynamic behavior, implying a slight enriching effect where SRP concentrations were greater at higher stream discharge conditions during both years. In contrast, nitrate concentration-discharge relationships suggested strong, enriching chemodynamic behavior during 2018, but chemostatic behavior during 2019. The difference in SRP and nitrate export patterns in the 2 years analyzed highlights the importance of implementing appropriate best management practices that target specific nutrients and treat primary delivery pathways to effectively improve downstream aquatic health conditions.
Introduction
Increased severity and frequency of Harmful Algal Blooms (HABs) caused by elevated toxin-producing phytoplankton and cyanobacterial biomass occurred in a majority of lakes around the globe from 1984 to 2012 (Ho et al., 2019). While HABs can be caused by various anthropogenic activities on the land, e.g., wastewater treatment plant discharges, septic system leaks, fertilizer runoff from residential lawns, fertilizer or manure runoff from farm fields and runoff or leaks from animal agriculture manure lagoons are the main HAB drivers in agricultural landscapes. Ultimately, severe HABs are costly for both human and ecological systems and can negatively impact drinking water sources, wildlife, tourism, recreation, property values, and commercial fishing. Annually, freshwater HABs are estimated to result in $4.6 billion of economic loss in the U.S. alone (Kudela et al., 2015). Direct HAB remediation is costly and typically involves either biological, physical, or chemical control measures; thus, mitigating nutrient losses at the source in agricultural fields could prove to be a cost-effective alternative to reduce HABs in receiving waters and lakes. It seems that a combination of both hydrologic and nutrient management practices are likely needed to reduce nutrient losses from agricultural fields and improve downstream aquatic health (Hanrahan et al., 2019).
Excess nutrients and HABs are not just problems for small inland lakes but can have significant impacts for large lake systems such as the Laurentian Great Lakes in the United States. Consider Lake Erie, the southern-most, shallowest, and most productive of the Laurentian Great Lakes, which contains <2% of the water held in the Great Lakes, but produces 50% of all fish harvested from the Great Lakes (Hushak et al., 1988). Summer-long HABs in Lake Erie can result in $5.6 million in lost fishing revenue, the world's largest walleye fishery (Wolf et al., 2017). The Western Lake Erie Basin (WLEB) supports about 80% of the sportfishing activity (Hushak et al., 1988) and is the most susceptible of the three Lake Erie basins to eutrophic conditions. The emergence of HABs in the WLEB can be partially attributed to the shallow depth (mean depth 7.3 m; ODNR, 2018) resulting in warm summer water temperatures, conducive to phytoplankton and cyanobacterial growth, and a drainage basin land use dominated by agriculture (71% of WLEB land area; USDA, 2005), which often transport excessive nutrient loads to the WLEB, particularly during the main nutrient-loading period occurring between March and July (e.g., Stumpf et al., 2012; Baker et al., 2019).
The most severe HABs occurring in the WLEB since 2002, indicated by the Lake Erie Harmful Algal Bloom severity index, have occurred in wetter than average years. Previous studies have identified very strong correlations between March–July stream discharge and March–July SRP and particulate phosphorus loads (R2 = 0.83 and 0.90, respectively) from the major tributaries of the WLEB from 2002 to 2019 (Guo et al., 2020), implying phosphorus export is transport limited as indicated by chemostatic behavior with stream discharge (i.e., lower variability in concentration compared to stream discharge) (Williams et al., 2016a). From 1975 to 2017 annual precipitation in the Maumee River Basin, the largest tributary of the WLEB, increased by 102 mm, with increases in heavy (25.4–76.2 mm) and very heavy (>76.2 mm) precipitation events accounting for a majority of the increase, resulting in increased stream discharge and runoff ratio (defined as the ratio of area-normalized stream discharge to precipitation) in a majority of monitored streams (Williams and King, 2020). If this pattern of increased total rainfall and rainfall intensity continues, severe HABs will likely continue to be an economic and ecological problem for the region.
Recent studies have concluded that changes in SRP concentration vs. discharge (C-Q) relationships in WLEB tributaries, reflecting higher concentrations for a particular discharge compared to historic values, have been responsible for about two-thirds of the increase in SRP loads into the WLEB since the early 2000s, while the remaining one-third can be attributed to increased stream discharge (Jarvie et al., 2017; Choquette et al., 2019). Interestingly, changes in C-Q relationships for total phosphorus and three nitrogen species (total nitrogen, nitrate-nitrogen, and total Kjeldahl nitrogen) in WLEB tributaries were much less pronounced or showed decreases in C-Q relationships, resulting in little or no change in total load for these nutrient species (Choquette et al., 2019). Increases in SRP C-Q relationships have been hypothesized to be related to unintended consequences of long-term, large-scale changes in land management involving reduced tillage to decrease losses of particulate phosphorus, and increased artificial subsurface (tile) drainage in order to increase field trafficability and crop production while minimizing surface runoff (Jarvie et al., 2017). Collectively, these management practices have been suggested to have cumulative and converging impacts that have contributed to increased SRP loads to the WLEB.
Even today, tile drainage continues to be installed throughout the Midwest and the WLEB with many agricultural watersheds estimated to have over half their land under tile drainage. The large-scale prevalence of tile drainage has been shown to significantly alter the hydrology, and subsequent nutrient transport, at field and watershed scales. In Iowa, for example, tile drainage was shown to homogenize streamflow metrics across both high and low discharge conditions (Boland-Brien et al., 2014). The authors found that heavily tile-drained watersheds did not show the relationships between watershed size and streamflow metrics expected from natural systems (e.g., decrease in peak streamflow and increase in baseflow proportion with watershed drainage area). Other studies from Iowa indicated that tile drainage primarily affects the baseflow portion of the hydrograph (Schilling and Helmers, 2008a) and water exiting tile drains is primarily sourced from baseflow (Schilling and Jones, 2019). Contrasting results were recently reported in Ohio watersheds, whereby watersheds with extensive tile drainage had significantly lower streamflow recession constants and baseflow percentages, suggesting a flashier streamflow behavior in watersheds with high percentages of tile drainage (Miller and Lyon, 2021). The opposite pattern observed in Ohio watersheds compared to Iowa was hypothesized to be due to increased precipitation, decreased drainage capacity of soils derived from clay- and silt-sized glaciolacustrine deposits, and shallower water tables in Ohio compared to Iowa. Because of these differences in precipitation patterns and soil drainage properties, tile drains in Ohio tend to be installed at shallower depths and smaller lateral spacing (i.e., greater density) compared to installations in Iowa. In essence, tile drainage creates a more direct connection between precipitation, shallow subsurface water, and adjacent receiving streams in Ohio, compared to Iowa. What remains to be seen is the impact this more direct connection has on subsequent nutrient concentrations and loads to recipient freshwater systems – and the implications this could potentially have for management strategies to help alleviate HABs in the WLEB.
As such, the purpose of this study is to evaluate the impact of tile drainage on watershed-scale hydrologic response and nutrient export behavior. Specifically, we determined the effect of tile drainage on (1) total runoff, (2) runoff ratio, (3) SRP and nitrate concentrations, (4) SRP and nitrate loads, and (5) C-Q dynamics annually and during the main nutrient loading period (March–July) for 16 watersheds located in the WLEB with varying proportions of tile drainage. For each watershed, tile drainage percentage was calculated from a recently developed 30-m dataset (Valayamkunnath et al., 2020). Results were compared for two recent years, representing relatively normal (2018) and wet (2019) March–July conditions, which led to moderate, and severe algal bloom severity in the WLEB, respectively. Due to the strong surface connection that tile drainage creates (e.g., Smith et al., 2015; Jiang et al., 2021), we hypothesize that watersheds with the greatest percentages of tile drainage not only have greater SRP and nitrate concentrations and subsequent loads but also display more chemostatic C-Q behavior, especially during the main nutrient loading season (March–July).
Materials and Methods
Study Area
The WLEB is primarily contained within the Huron/Erie Lake Plain and Eastern Corn Belt Plains level III ecoregions (U.S. EPA, 2013). The Huron/Erie Lake Plain is a fertile, nearly flat plain with relic sand dunes, beach ridges, and end moraines. Historically, soil drainage was poor and elm-ash swamps, oak savannas, and beech forests were common. The 4,000 km2 Great Black Swamp once existed in this ecoregion (Mitsch, 2017), but is now considered one of the most intensively artificially drained regions in the United States (Smith et al., 2008). The region now contains highly productive corn, soybean, and livestock farms due to the widespread installation of tile drainage. Bedrock topography is smooth in this ecoregion and is thought to have little impact on hydrology due to thick deposits of fine-grained clay- and silt-size glaciolacustrine sediments and glacial deposits of Wisconsin age (Ohio Division of Geological Survey, 2005; Macrae et al., 2021). The Eastern Corn Belt Plains are slightly hillier compared to the Huron/Erie Lake Plain and contain glacial deposits from Wisconsin-age end moraines. Soils in this ecoregion are loamier and slightly better drained compared to the Huron/Erie Lake Plain. Extensive corn, soybean, and livestock production replaced most of the original elm-ash swamps and beech forests.
Data
Daily stream discharge was downloaded from 16 United States Geological Survey (USGS) gages from 2018 to 2019 using the R package “dataRetrieval” (De Cicco and Hirsch, 2014) (Table 1; Figure 1). This time period was chosen to maximize the number of sites with available daily nutrient data in the WLEB and to align with the responses from the 2017 agricultural census data used to generate a tile drainage distribution map (Valayamkunnath et al., 2020). Daily streamflow was normalized by watershed area to calculate total daily runoff (“runoff”). Watershed characteristics and boundaries were obtained from the GAGES-II dataset (Falcone, 2011). Monthly precipitation data from 2018 to 2019 was aggregated to watershed boundaries to calculate monthly and annual precipitation (PRISM Climate Group, 2019).
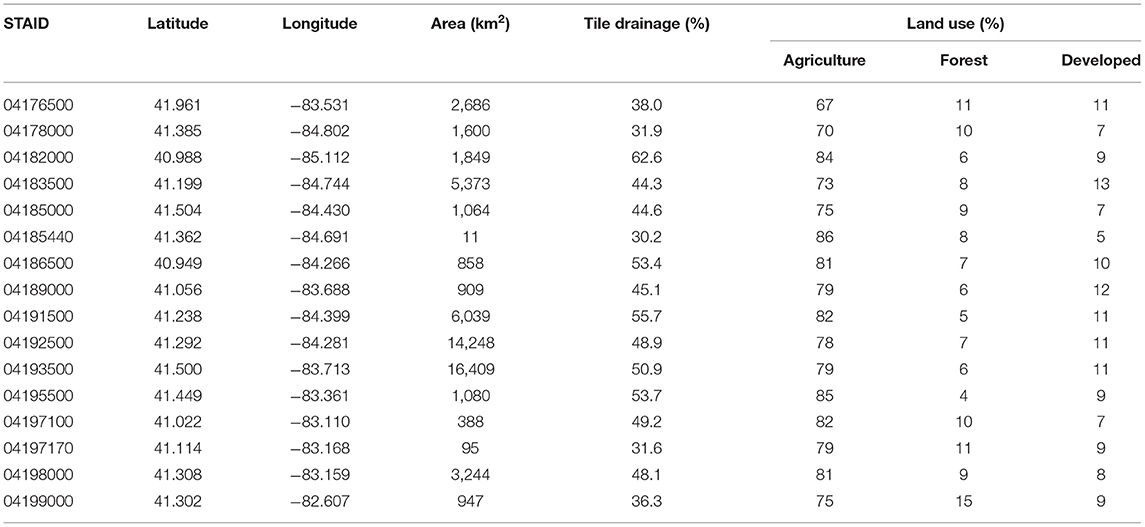
Table 1. Location of stream gages and watershed characteristics.
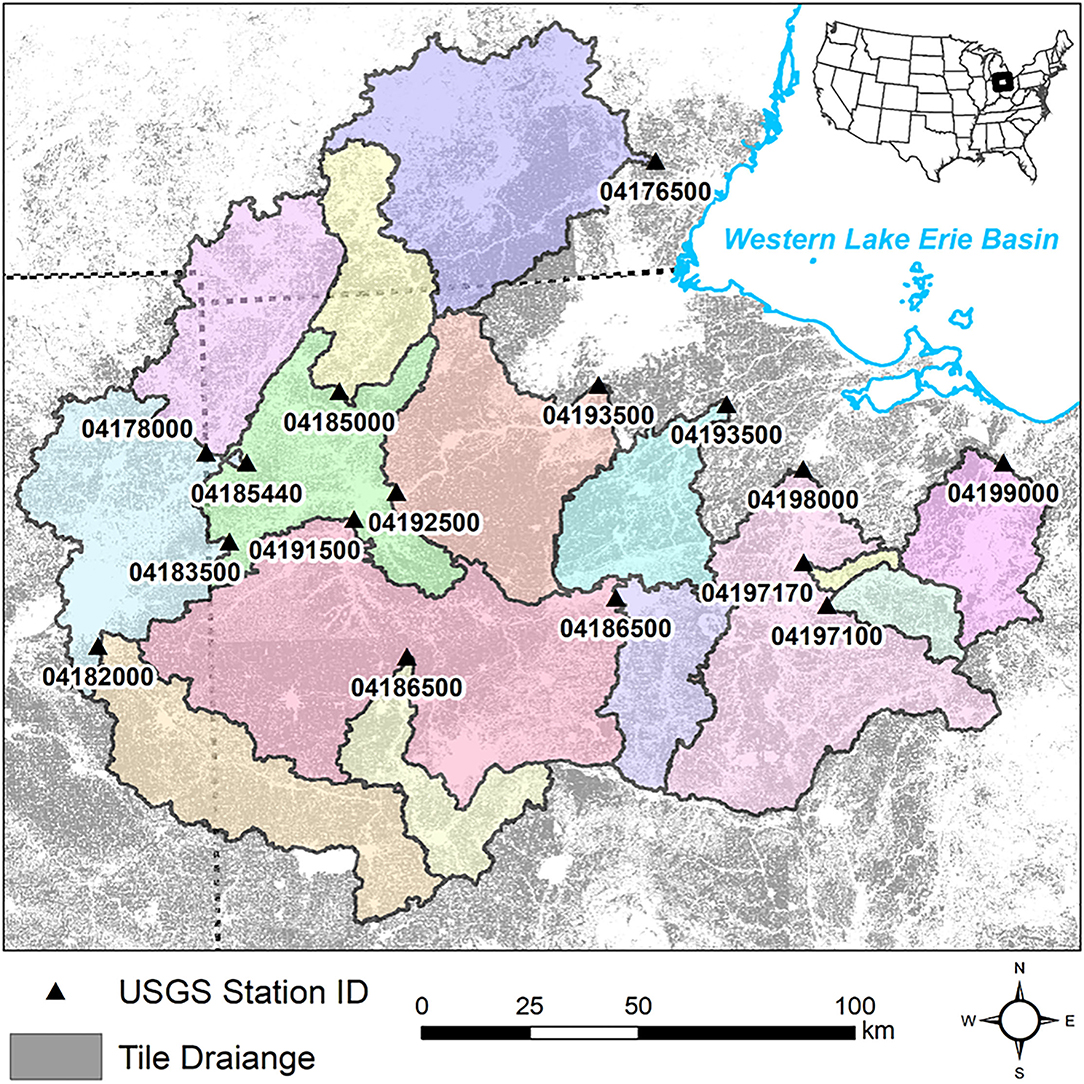
Figure 1. Location of the 16 USGS gaging sites with their corresponding drainage areas. Tile drainage distribution shown in gray. The dotted line refers to state boundaries. The 16 watersheds are shaded in unique colors to distinguish their locations.
These 2 years also had substantially different size of algal blooms develop in the WLEB as indicated by the Western Lake Erie Bloom Severity Index created by the U.S. National Oceanic and Atmospheric Administration's (NOAA) National Centers for Coastal Ocean Science (NCCOS). The severity index was created in 2002 and is based on the bloom's algae biomass over the peak 30-days. A goal of bloom severity ≤ 3 was established by NOAA and their research partners; however, the goal has only been met in 6 years since the index was created in 2002 and only once since 2008. For the years considered in this current analysis, the bloom severity index in 2018 was slightly higher than the goal (3.6), while the value in 2019 was much higher (7.5). An index above 5 indicates more severe blooms, and values > 7 are particularly severe, with extensive coverage affecting the lake. As such, this current effort targets a relatively low and high bloom severity year, respectively.
For each watershed, a 30-m resolution tile drainage map (AgTile-US) was used to calculate the percent of tile drainage occurrence (Valayamkunnath et al., 2020). This dataset used topographic slope, soil drainage, and county-level tile drainage census data to determine the most-likely tile-drained area in the contiguous United States with accuracy in the Midwest ranging from 82.7 to 93.6%. Cells with likely presence of tile drainage are indicated with a “1,” while no occurrence is indicated by a “0.” The percentage of tile drainage was calculated by summing the total amount of tile-drained area by the total watershed area.
Daily nutrient concentrations (SRP and nitrate) were obtained from the National Center for Water Quality at Heidelberg University (“HU”; Tiffin, OH) and the USGS (Table 1). Data from HU was downloaded from the Tributary Loading Website (https://ncwqr-data.org/HTLP/Portal), while the R package “dataRetrieval” was used to download daily USGS nutrient data (De Cicco and Hirsch, 2014). All nutrient sites considered are collocated at stream gages to allow for the calculation of nutrient loads. When multiple concentrations were reported for individual days, the mean, discharge-weighted, concentration was calculated.
Precipitation and Runoff Metrics
Monthly precipitation and daily runoff were summarized for each watershed annually, during the main nutrient loading period (Mar–Jul), and the months following the main nutrient loading period (Aug–Dec) for both 2018 and 2019. Runoff ratios were calculated by dividing runoff by precipitation, expressed as a percent. In addition, mean daily runoff for the highest 5% (Q05) and the lowest 5% (Q95) of annual observations was calculated for each watershed in 2018 and 2019. Annual and March–July runoff, and runoff ratios, were compared to watershed percentage tile drainage using Pearson's correlation. We used the Wilcoxon signed-rank non-parametric hypothesis test to evaluate differences in runoff, nutrient concentrations, and nutrient loads between 2018 and 2019, since the Shapiro-Wilk determined that the data were not normally distributed.
Nutrient Concentrations and Loads
Mean discharge-weighted SRP and nitrate concentrations were calculated annually, during the main nutrient loading period (Mar–Jul), and the months following the main nutrient loading period (Aug–Dec) for each year. Daily nutrient loads were calculated by multiplying stream discharge by the nutrient concentration and summarized annually, during the main nutrient loading period (Mar–Jul), and the months following the main nutrient loading period (Aug–Dec).
Concentration–Discharge Characterization
The transfer of nutrients and water through a watershed is inherently related. Nutrient concentrations at watershed outlets reflect differences in application rates, flow paths, residence times and can be considered a “fingerprint” of watershed transport, reaction, and mixing processes (Knapp et al., 2020). Calculating the variation in nutrient concentration as function of stream discharge therefore provides insight into how watersheds store and release water and nutrients. We quantified SRP and nitrate C-Q relationships two separate ways: (1) by fitting power-law relationships between nutrient concentrations and discharge (e.g., Godsey et al., 2009; Musolff et al., 2015; Knapp et al., 2020) and (2) by calculating the ratio of coefficient of variation (CV) for nutrient concentrations and discharge to assess the relative variability of each (Thompson et al., 2011; Gorski and Zimmer, 2021).
Nutrient concentration-discharge (C-Q) behavior was estimated by fitting the following power-law relationship:
which is identical to the linear relationship in double-logarithmic space:
where log10(a) and b are the intercept and slope of the C-Q relationship, respectively (Godsey et al., 2009; Knapp et al., 2020). Chemostatic C-Q behavior is defined as b ≈ 0 and implies little to no variation of C with changes in Q, while a value of 1 or −1 suggests nutrient concentrations vary proportionately positively or negatively to discharge, respectively. Nutrients with b = 1 display higher concentrations at high discharge conditions (i.e., mobilization), while nutrients with b = −1 indicate lower concentrations at high discharge conditions (i.e., dilution). However, b ≈ 0 does not indicate that the variability in concentration is small and the goodness of fit of the power-law C-Q relationship is uninformative as b approaches zero (Thompson et al., 2011). The slope of the power-law C-Q relationship (b) does not reveal whether changes in concentration, discharge, or a combination of both were responsible for the observed relationship. For these reasons, an additional, non-parametric measure of chemostatic behavior was calculated defined by the ratio of the coefficients of variation (CV) between concentration and discharge:
where μ and σ represent the mean and standard deviation, respectively. Chemostatic C-Q behavior is observed when CVC is much smaller than CVQ resulting in CVC/CVQ < <1. Both C-Q metrics (b and CVC/CVQ) are consistent with each other, but CVC/CVQ is more general and does not imply nutrient concentrations are truly invariant, or uncorrelated with changes in discharge (Thompson et al., 2011).
Results
Watershed Characteristics
Mean watershed area (Figure 1) was 3,550 km2 and ranged from 11 to 14,248 km2 (Table 1). The average percent of watershed area under tile drainage was 45.3% and ranged from 30.2 to 62.6%. Agriculture, which includes pasture and cultivated crops, was the dominant land use for all watersheds and ranged from 67 to 86% (mean = 78%).
Precipitation and Runoff
Annual and March–July precipitation and runoff (Table 2) were significantly greater in 2019 compared to 2018. Both years had significantly greater annual precipitation and runoff compared to 1991–2019 averages; however, March–July precipitation and runoff were similar in 2018 compared to 1991–2019 averages, while March–July precipitation and runoff were significantly greater in 2019 compared to 2018 or 1991–2019 averages. Mean daily runoff for the highest (Q05) and lowest (Q95) 5% of observations was similar in 2018 compared to 2019 - but both years were significantly greater compared to 1991–2019 averages. Annual and March–July runoff ratios were significantly greater in 2019 compared to both 2018 and 1991–2019 averages. Precipitation, runoff, and runoff ratios were significantly greater in the months following the main nutrient loading period (Aug-Dec) during 2018 compared to 2019 or 1991–2019 averages.
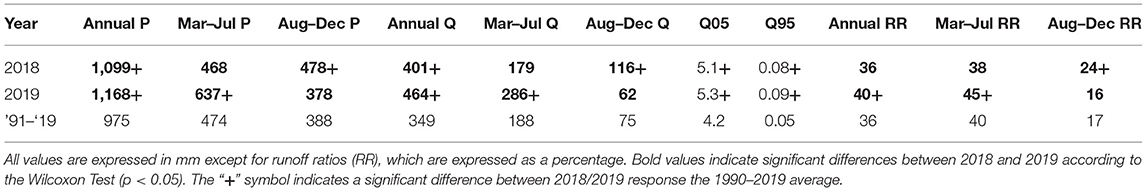
Table 2. Mean precipitation (P) and runoff (Q) characteristics among the 16 watersheds for 2018, 2019, and the 1990–2019 period.
Total monthly precipitation was similar in March and June in 2018 and 2019, but significantly greater in April, May, and July in 2019 compared to 2018 (Figure 2). The wetter March–July conditions in 2019 led to significantly greater runoff and runoff ratios occurring during this time compared to 2018, which had similar precipitation and runoff compared to 1991–2019 averages (Table 2).
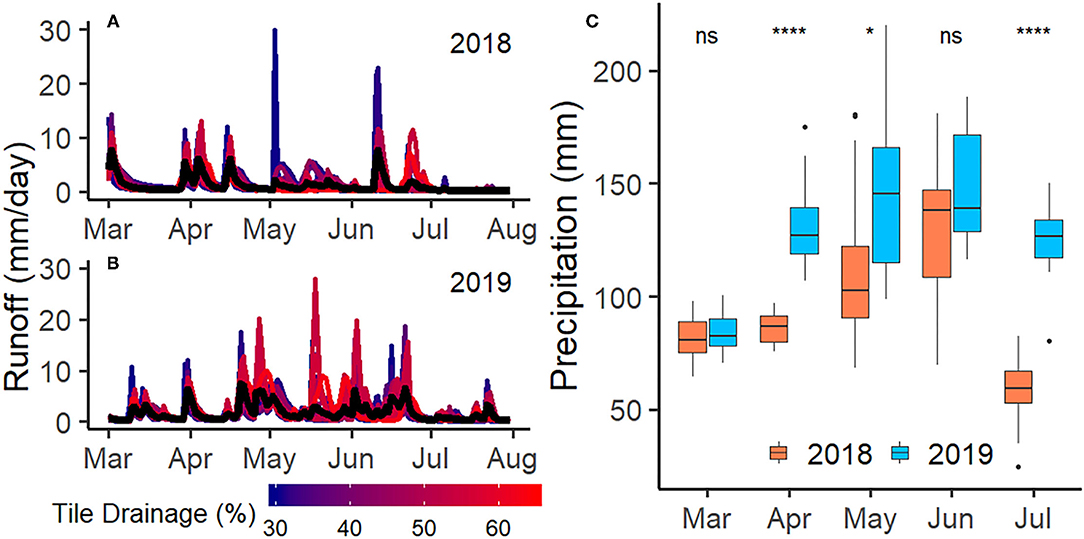
Figure 2. March–July daily runoff in 2018 (A) and 2019 (B). The color corresponds to the tile drainage percentage for each watershed, while the black line denotes the average daily runoff among the 16 sites. Total monthly precipitation between March and July for 2018 and 2019 (C). The symbols * and **** indicate p < 0.05 and p < 0.0001 according to the Wilcoxon test, respectively. The letters “ns” indicate non-significant differences (p > 0.05).
Tile drainage was significantly positively correlated to annual runoff (Pearson's r = 0.52), March–July runoff (Pearson's r = 0.70), annual runoff ratio (Pearson's r = 0.53), and March–July runoff ratio (Pearson's r = 0.60) in 2019 but was not related to any runoff metrics in 2018 (Figure 3). Neither August–December runoff or runoff ratio was found to be correlated with tile drainage.
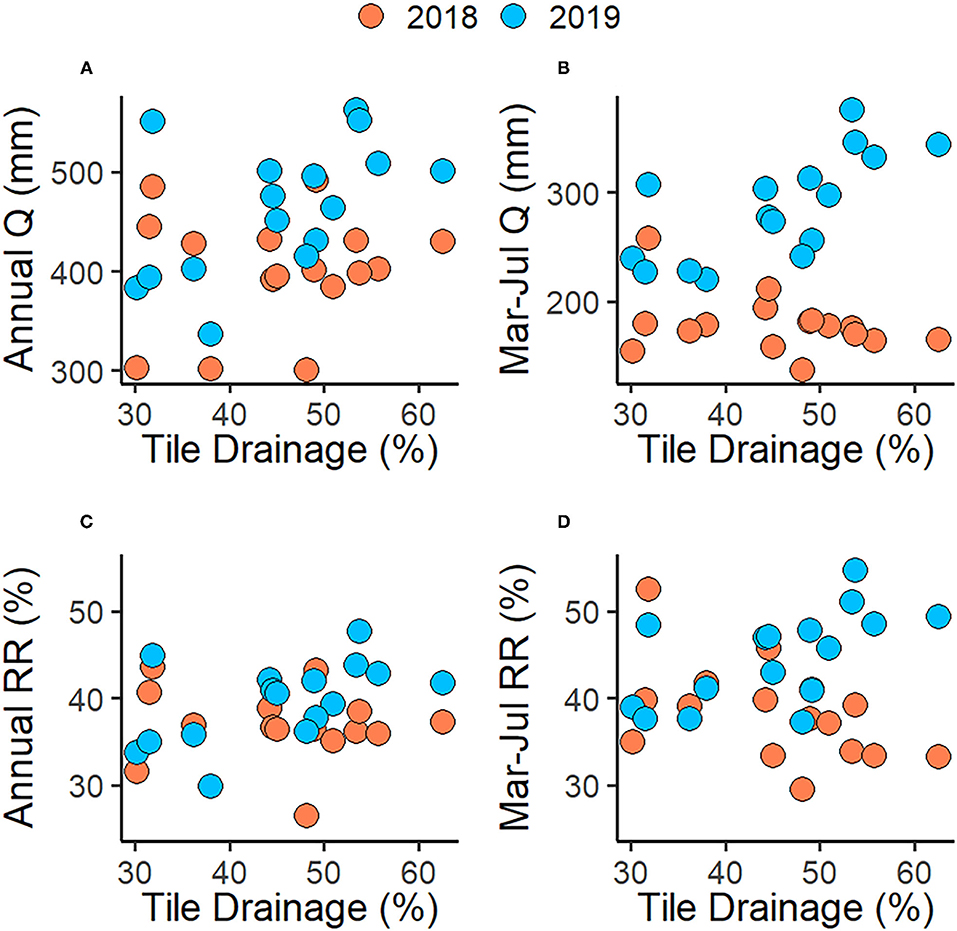
Figure 3. Annual (A; Pearson's r = 0.11 and 0.52, respectively) and March–July (B; Pearson's r = −0.33 and 0.70, respectively) runoff (Q) vs. tile drainage during 2018 and 2019. Annual (C; Pearson's r = −0.04 and 0.53, respectively) and March–July (D; Pearson's r = −0.49 and 0.70, respectively) runoff ratio (RR) vs. tile drainage for 2018 and 2019.
Nutrient Concentrations and Loads
SRP and nitrate concentrations and loads are summarized for the 16 study watersheds annually, during the main nutrient loading period (Mar–Jul), and the months following the main nutrient loading period (Aug–Dec) for 2018 and 2019 in Table 3. Mean annual, March–July, and August–December concentrations of SRP and nitrate were similar between the 2 years. Mean annual and March–July nitrate loads and annual SRP loads were similar between the 2 years; however, there was a significantly greater March–July SRP load in 2019 compared to 2018. The SRP and nitrate loads from August–December were significantly greater in 2018 compared to 2019.
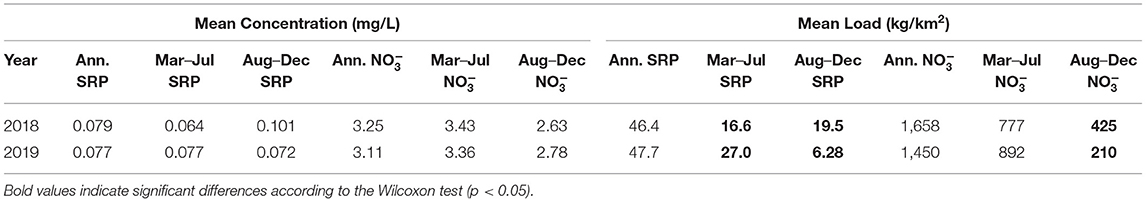
Table 3. Mean annual and March–July (Mar–Jul) soluble reactive phosphorus (SRP) and nitrate () concentrations and loads for 2018 and 2019.
Watershed tile drainage (%) was significantly correlated with March–July SRP concentrations (Pearson's r = 0.64) and loads (Pearson's r = 0.66) during 2019, but not in 2018 (Figure 4). Tile drainage was significantly correlated with March–July nitrate concentrations (Pearson's r = 0.74, 0.50) and loads (Pearson's r = 0.80, 0.76) in 2018 and 2019, respectively. Tile drainage was significantly correlated with August–December SRP and nitrate concentrations (Pearson's r = 0.60 and 0.53, respectively) and loads (Pearson's r = 0.63 and 0.69, respectively) in 2018, but not in 2019.
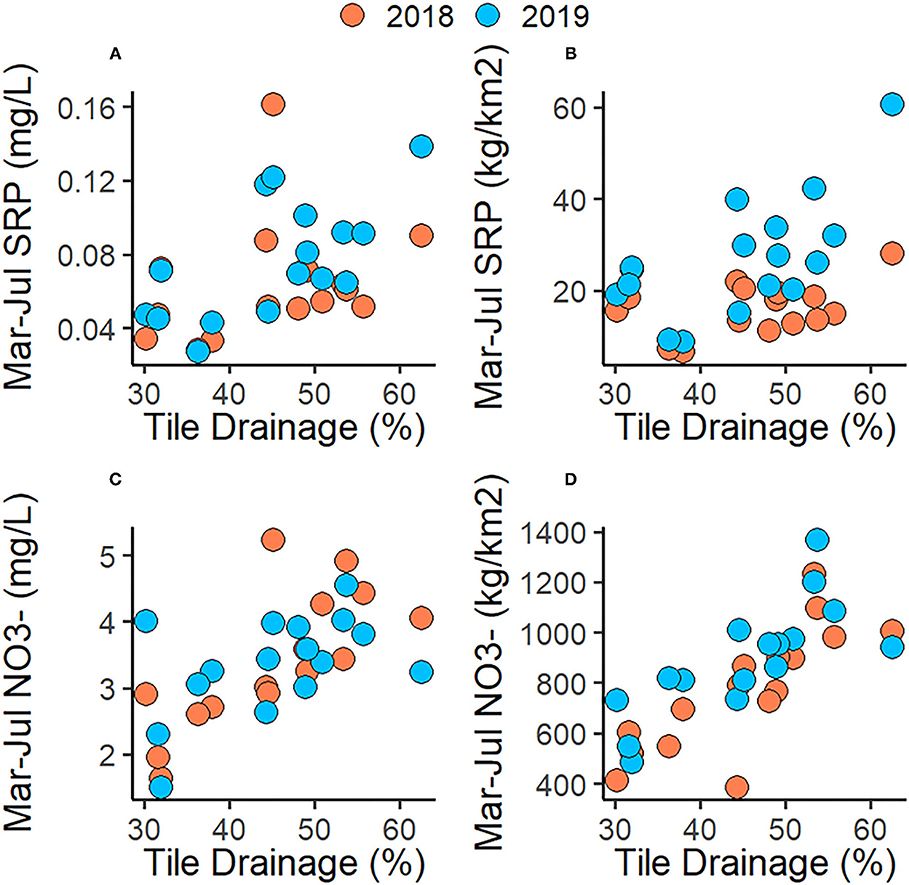
Figure 4. March–July SRP concentration (A; Pearson's r = 0.30 and 0.64, respectively) and load (B; Pearson's r = 0.23 and 0.66, respectively) vs. tile drainage during 2018 and 2019. March–July nitrate () concentration (C; Pearson's r = 0.74 and 0.50, respectively) and load (D; Pearson's r = 0.80 and 0.76, respectively) vs. tile drainage during 2018 and 2019.
Concentration–Discharge Characterization
The slopes of the SRP concentration-discharge relationship were similar during the 2 years when comparing annual and March–July data (Table 4). However, the slopes of the nitrate C-Q relationship were significantly greater in 2018 compared to 2019.
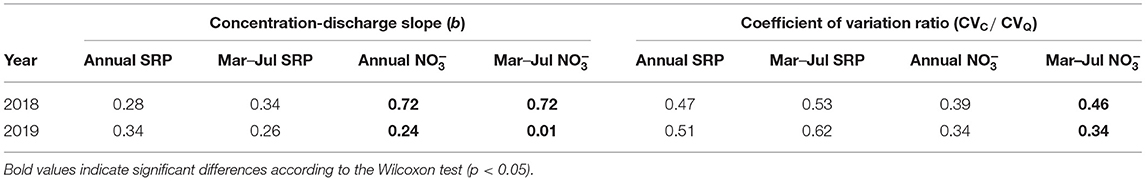
Table 4. Mean annual and March–July (Mar–Jul) soluble reactive phosphorus (SRP) and nitrate () concentration-discharge slope (b) and concentration-discharge coefficient of variation ratio for 2018 and 2019.
Annual and March–July SRP coefficient of variation ratios were similar for SRP. The annual coefficient of variation ratios for nitrate were similar for the 2 years, but the March–July coefficient of variation ratio was significantly greater in 2018 compared to 2019.
Watershed tile drainage (%) was not related to the slope of the March–July SRP or nitrate C-Q relationship in 2018 or 2019 (Figure 5). However, the SRP coefficient of variation ratios were significantly negatively correlated to tile drainage using annual (Pearson's r = −0.65) and March–July (Pearson's r = −0.72) data in 2019, but not in 2018. The nitrate coefficients of variation ratios were not related to tile drainage in either year using both annual and March–July data.
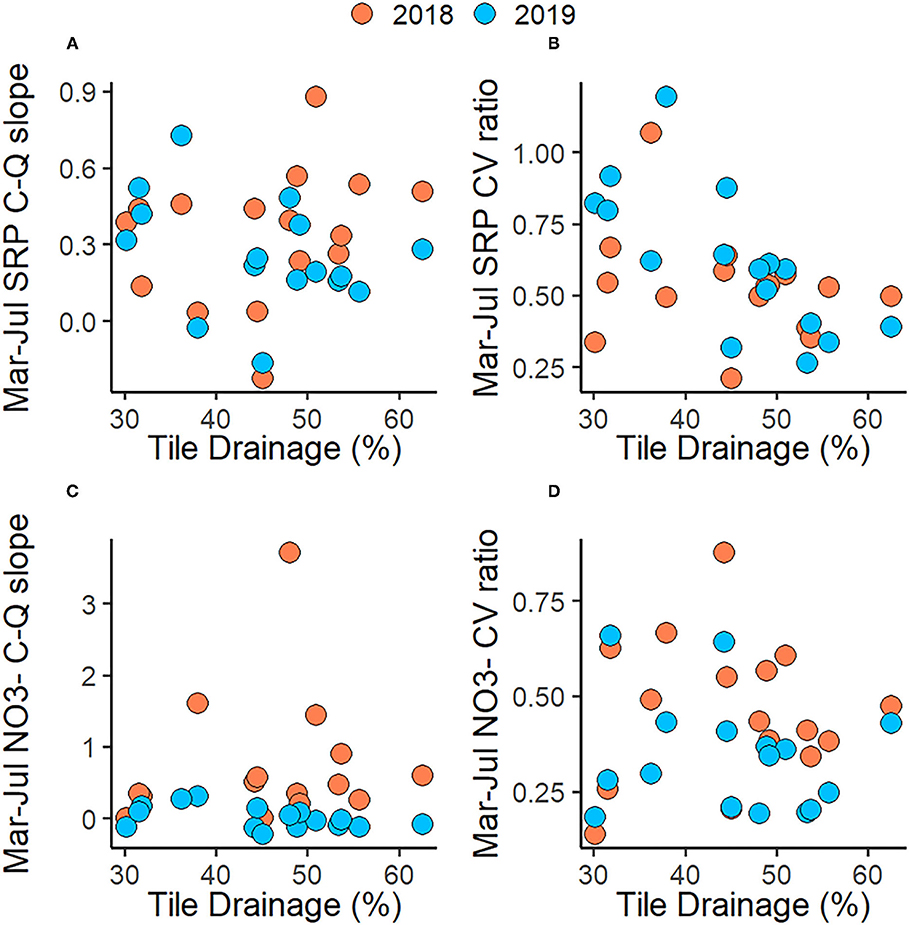
Figure 5. March–July soluble reactive phosphorus (SRP) concentration-discharge (C-Q) slope (A; Pearson's r = 0.27 and −0.36, respectively) and coefficient of variation (CV) ratio (B; Pearson's r = −0.26 and −0.72, respectively) vs. tile drainage during 2018 and 2019. March–July nitrate () concentration-discharge (C-Q) slope (C; Pearson's r = 0.16 and −0.46, respectively) and coefficient of variation (CV) ratio (D; Pearson's r = 0.07 and −0.17, respectively) vs. tile drainage during 2018 and 2019.
Discussion
Connections Between Tile Drainage, Stream Discharge, and Nutrient Transport
In 2019, which had above average annual precipitation and March–July precipitation, watershed tile drainage percentage was significantly correlated with annual and March–July runoff and annual and March–July runoff ratios (Figure 3). These results are supported by recent research from Miller and Lyon (2021) who observed a flashier streamflow response in watersheds with high percentages of tile drainage in Ohio compared to watersheds with little to no tile drainage. The lack of relationship between tile drainage and annual or March–July runoff and runoff ratios during 2018 suggests that the presence of tile drainage amplifies the flashiness during wetter than average years in this region, while the effect is less noticeable in years with normal (or low) amounts of precipitation. Given the trend in more frequent large rain events occurring in the WLEB (Williams and King, 2020), we suspect that tile drainage will likely contribute to flashier downstream behavior in the future. Management efforts that reduce the flashiness of rivers following storms events such as drainage water management, drainage water recycling, vegetated buffers, or wetland restoration are likely to reduce the amount of nutrient-rich water leaving farm fields and improve downstream aquatic health.
There was a noticeable difference between March–July SRP and nitrate concentrations and loads between for the 2 years analyzed. The wetter than average conditions during March–July of 2019 resulted in significant correlations between tile drainage and SRP mean concentrations and loads (Figures 4A,B). However, during 2018 there were no relationships between tile drainage and mean SRP concentrations and loads (Figures 4A,B). This suggests that tile drainage exacerbates the transport of SRP in particularly wet conditions. In fact, at the field-scale, numerous studies have documented how tile drainage is connected to the surface through macropores and other preferential flow paths (Smith et al., 2015; Williams et al., 2016a; Macrae et al., 2019). Storm events have been found to accelerate the transport of particulate and dissolved nutrient species in tile drainage (Jiang et al., 2021). Significantly greater precipitation and runoff occurred during the months following the main nutrient loading period (Aug–Dec) in 2018 compared to 2019. Tile drainage was found to be significantly correlated with SRP and nitrate concentrations and loads during this period in 2018, but not in 2019. This supports evidence that watersheds with large percentages tile drainage accelerate the transport of nutrients during wet conditions, but do not amplify nutrient export during drier conditions.
Repetitive applications of fertilizer or manure to soils has led to an accumulation of phosphorus at the soil surface and pronounced degrees of vertical soil phosphorus stratification whereby soil phosphorus levels decrease greatly with depth (Robbins and Voss, 1991; Sharpley, 2003). Vertical soil phosphorus stratification is generally more noticeable in no-till or conservation-till soils compared to conventional tilled soils (Vu et al., 2009; Sharpley et al., 2012). Initial recommended fertilizer levels were established based on a long history of conventional tillage, whereby phosphorus would be expected to be incorporated into the plow-layer (0–20 cm). However, currently, a majority of fertilizer is not incorporated into the plow layer, but broadcast onto the surface, which has likely contributed to increases in SRP into the WLEB in recent decades (Smith et al., 2015, 2017). This underscores the importance for measuring soil test phosphorus concentrations to identify fields that are at risk for greater phosphorus loss (Duncan et al., 2017). During wetter than average years, shallow groundwater tables are elevated relative to dryer years and near-surface macropores are activated more often resulting in more potential phosphorus loss from heavily stratified soils (Williams et al., 2016b).
In both 2018 and 2019 tile drainage was significantly correlated with March–July nitrate concentrations and loads, despite significantly greater precipitation occurring in 2019 (Figures 4C,D). The strong correlation between nitrate concentrations and loads with tile drainage suggests that watersheds with greater percentages of tile drainage export larger nitrate loads regardless of precipitation conditions. Nitrate concentrations are generally thought to be greater in groundwater compared to surface runoff. Schilling and Helmers (2008b) found that 70% of nitrate in tile-drained fields was transported via diffuse flow, while suspended sediment and phosphorus transport were more associated with faster flow regimes. This helps explain the similar nitrate concentrations recorded in 2018 and 2019, despite more rain occurring in 2019.
Tile drainage is designed to reduce surface runoff and erosion. While particulate phosphorus and erosion have likely reduced partially due to widespread installation of tile drainage, the significant increase in dissolved phosphorus in the last 20 years has been proposed as an unintended consequence of an increase in tile drainage installations and reduced tillage designed to improve soil stability (Jarvie et al., 2017). In fact, research suggests that tilling soil may be beneficial in breaking up macropores that are more likely to develop under reduced or no-till conditions (Williams et al., 2016a).
We explored the relationship between various watershed characteristics, runoff, and nutrient concentrations to determine how variation in watershed properties affected nutrient transport. Interestingly, agricultural land use (percentage of watershed area) was not found to be correlated with annual or March–July SRP concentrations for either year, but significantly positively correlated with nitrate both annually and during March–July. Widespread accumulation of nitrogen in the root zone of agricultural soils from decades of fertilizer application is likely a major reason why tile drainage and agricultural land were highly correlated with nitrate in both 2018 and 2019 (Van Meter et al., 2016). Whereas, the transport of SRP is confined to shallower soil layers that are activated only in wetter years.
Variability of Nutrient Concentration-Discharge Dynamics With Tile Drainage Intensity
Annual and March–July SRP displayed relatively weak, enriching chemodynamic behavior as indicated by low positive SRP C-Q slopes in both 2018 and 2019 (b = 0.26–0.34; Table 4; Gorski and Zimmer, 2021). The lack of difference in SRP C-Q slopes between the 2 years, both annually and during March–July, suggests that transport of SRP is more strongly influenced by precipitation and stream discharge than C-Q dynamics. In fact, mean March–July SRP loads were significantly different between the 2 years, but not mean March–July concentrations (Table 3).
Interestingly, annual and March–July nitrate C-Q dynamics displayed different behavior in 2018 and 2019 (Table 4), despite similar mean nitrate concentrations and loads between the 2 years (Table 3). Annual and March–July nitrate C-Q slopes had stronger, enriching chemodynamic behavior in 2018 (b = 0.72). However, the annual nitrate C-Q slope in 2019 showed a moderate, enriching chemodynamic behavior (b = 0.24), while March–July nitrate C-Q slopes indicated chemostatic behavior (b = 0.01).
Chemostatic nitrate C-Q behavior has previously been demonstrated in systems dominated by agriculture (e.g., Basu et al., 2010; Thompson et al., 2011), due to consistent nitrate availability from contributing areas that have uniform nitrate concentrations. However, as the contributing area shrinks following precipitation events, near-stream areas with greater denitrification rates and lower nitrate concentrations contribute relatively more to stream discharge compared to upland areas with greater nitrate concentrations (Marinos et al., 2020), resulting in contributing areas with more heterogeneous nitrate concentrations and a more chemodynamic nitrate C-Q behavior. For examples Marinos et al. (2020) and Gorski and Zimmer (2021) found chemodynamic nitrate C-Q behavior to be dominant at low flows, while chemostatic nitrate C-Q behavior was more common during high flow events. These observations are consistent with our results showing more chemodynamic nitrate C-Q behavior in 2018, compared to the chemostatic response observed in 2019.
All annual and March–July coefficient of variation ratios for SRP and nitrate displayed moderate, enriching chemodynamic behavior as indicated by values > 0.3 (Thompson et al., 2011). The mean annual calculated coefficient of variation ratio for SRP from the 16 watersheds was very similar to the results obtained by Williams et al. (2016a) from two watersheds in the WLEB (0.52 and 0.54). The coefficient of variation ratios for SRP and nitrate aligned with most of the SRP and nitrate C-Q slopes, except for March–July nitrate C-Q behavior in 2019, which indicated chemostatic behavior according to the C-Q slope. This lack of agreement between the two metrics suggests that there are other reasons for concentration variation beyond variability in stream discharge. The coefficient of variation ratio does not explain the variance in concentration, but avoids assuming a particular underlying concentration-discharge relationship (Thompson et al., 2011).
The general lack of relationship between watershed tile drainage (%) and nutrient C-Q parameters eludes to other management factors effecting solute concentration dynamics. Marinos et al. (2020) found a significant correlation between tile drainage and nitrate C-Q behavior in the Upper Mississippi Basin, where watersheds with high percentages of tile drainage spent a greater amount of time displaying chemostatic behavior. However, the distribution of tile drainage in the watersheds analyzed in their study was much greater than those compared in this study and included many sites with little to no tile drainage. The watersheds compared in this study had at least 30% of their land area underlaid by tile drainage and thus the true effect of tile drainage on nutrient C-Q dynamics is perhaps not attainable with the current selection of sites without a comparison to watersheds with little to no tile drainage. Unfortunately, most of this region has been extensively tiled (Figure 1) to increase agricultural yields and thus unimpacted watersheds with water quality and discharge records do not exist.
Potential Limitations and Concluding Remarks
Clearly, data availability may impact the interpretation of our results since only 2 years were compared. However, including more years of stream data would have resulted in many fewer watersheds to compare. In addition, the tile drainage dataset used to create watershed-scale estimates of tile drainage coverage is based on data collected in 2017, thus including older stream data in our analysis may not be appropriate. Further, watersheds with lower percentages of tile drainage were only monitored more recently meaning these sites would be excluded if the analysis were extended further back in time. Regardless of the limited amount of data available, the 2 years chosen for analyses offer stark differences in nutrient loading period precipitation and subsequent WLEB algal bloom severity. From this perspective, these 2 years offer contrasting conditions and insights when we, for example, consider catchment management practices that target nutrient load reductions.
Specifically, there was significantly greater precipitation in the WLEB during 2019 for the primary nutrient loading period compared to 2018, which experienced a normal level of precipitation during this time. During this wetter year we identified significant positive correlations between watershed tile drainage density, runoff and SRP concentrations that were not found in the drier year. From a phosphorous management perspective, this difference in response suggests that tile drainage may amplify nutrient export during years with wetter than average precipitation. When considering how we manage for nitrogen at the watershed-scale, tile drainage density was significantly correlated with nitrate in both years. Such constant importance of drainage density implies precipitation amounts may be less important for nitrate transport during this time. Further, the concentration-discharge metrics were, in general, not correlated with tile drainage density and suggested moderate, enriching, chemodynamic behavior. Nitrate concentration-discharge metrics appeared to be more affected by the different precipitation amounts in 2018 and 2019, whereas SRP concentration-discharge metrics were similar in 2018 and 2019. Collectively, these relationships would point to nitrogen being more impacted by deeper legacy sources compared to SRP being related or confined to more shallow soil layer sources. Understanding these dynamic relationships between hydrologic response and nutrient concentrations in streams forms a cornerstone to adequate design and management capable of limiting loading across a range of climatic forcing. This latter aspect is increasingly important as weather extremes and climatic variability increase globally.
Data Availability Statement
The original contributions presented in the study are included in the article/supplementary material, further inquiries can be directed to the corresponding author/s.
Author Contributions
SM designed the study, performed the analyses, and prepared the first draft of the manuscript. SL secured funding for the project, advised the interpretation of the data, and helped draft and edit the manuscript. Both authors contributed to the article and approved the submitted version.
Funding
Funding was provided by the Ohio Department of Higher Education's Harmful Algal Bloom Research Initiative (Award 105335).
Conflict of Interest
The authors declare that the research was conducted in the absence of any commercial or financial relationships that could be construed as a potential conflict of interest.
Publisher's Note
All claims expressed in this article are solely those of the authors and do not necessarily represent those of their affiliated organizations, or those of the publisher, the editors and the reviewers. Any product that may be evaluated in this article, or claim that may be made by its manufacturer, is not guaranteed or endorsed by the publisher.
References
Baker, D. B., Johnson, L. T., Confesor, R. B., Crumrine, J. P., Guo, T., and Manning, N. F. (2019). Needed: early-term adjustments for Lake Erie phosphorus target loads to address western basin cyanobacterial blooms. J. Great Lakes Res. 45, 203–211. doi: 10.1016/j.jglr.2019.01.011
Basu, N. B., Destouni, G., Jawitz, J. W., Thompson, S. E., Loukinova, N. V., Darracq, A., et al. (2010). Nutrient loads exported from managed catchments reveal emergent biogeochemical stationarity. Geophys. Res. Lett. 37, 1–5. doi: 10.1029/2010GL045168
Boland-Brien, S. J., Basu, N. B., and Schilling, K. E. (2014). Homogenization of spatial patterns of hydrologic response in artificially drained agricultural catchments. Hydrol. Process. 28, 5010–5020. doi: 10.1002/hyp.9967
Choquette, A. F., Hirsch, R. M., Murphy, J. C., Johnson, L. T., and Confesor, R. B. (2019). Tracking changes in nutrient delivery to western Lake Erie: approaches to compensate for variability and trends in streamflow. J. Great Lakes Res. 45, 21–39. doi: 10.1016/j.jglr.2018.11.012
De Cicco, L. A., and Hirsch, R. M. (2014). The dataRetrieval R package (Reston, VA: U.S. Geological Survey), 1–26.
Duncan, E. W., King, K. W., Williams, M. R., Labarge, G., Pease, L. A., Smith, D. R., et al. (2017). Linking soil phosphorus to dissolved phosphorus losses in the midwest. Agric. Environ. Lett. 2:170004. doi: 10.2134/ael2017.02.0004
Falcone, J. (2011). GAGES-II: Geospatial Attributes of Gages for Evaluating Streamflow. Reston, VA: US Geological Survey.
Godsey, S. E., Kirchner, J. W., and Clow, D. W. (2009). Concentration–discharge relationships reflect chemostatic characteristics of US catchments. Hydrol. Process. 23, 1844–1864. doi: 10.1002/hyp.7315
Gorski, G., and Zimmer, M. (2021). Hydrologic regimes drive nutrient export behavior in human impacted watersheds. Hydrol. Earth Syst. Sci. Discuss. 25, 1333–1345. doi: 10.5194/hess-25-1333-2021
Guo, T., Johnson, L. T., Labarge, G. A., Penn, C. J., Stumpf, R. P., Baker, D. B., et al. (2020). Less agricultural phosphorus applied in 2019 led to less dissolved phosphorus transported to Lake Erie. Environ. Sci. Technol. 55, 283–291. doi: 10.1021/acs.est.0c03495
Hanrahan, B. R., King, K. W., Williams, M. R., Duncan, E. W., Pease, L. A., and LaBarge, G. A. (2019). Nutrient balances influence hydrologic losses of nitrogen and phosphorus across agricultural fields in northwestern Ohio. Nutr. Cycl. Agroecosyst. 113, 231–245. doi: 10.1007/s10705-019-09981-4
Ho, J. C., Michalak, A. M., and Pahlevan, N. (2019). Widespread global increase in intense lake phytoplankton blooms since the 1980s. Nature 574, 667–670. doi: 10.1038/s41586-019-1648-7
Hushak, L. J., Winslow, J. M., and Dutta, N. (1988). Economic value of great lakes sportfishing : the case of private- boat fishing in Ohio's Lake Erie economic value of great lakes sportfishing : the case of private-boat fishing in Ohio's Lake Erie. Trans. Am. Fish. Soc. 117, 363–373. doi: 10.1577/1548-8659(1988)117 <0363:EVOGLS>2.3.CO;2
Jarvie, H. P., Johnson, L. T., Sharpley, A. N., Smith, D. R., Baker, D. B., Bruulsema, T. W., et al. (2017). Increased soluble phosphorus loads to Lake Erie: unintended consequences of conservation practices? J. Environ. Qual. 46, 123–132. doi: 10.2134/jeq2016.07.0248
Jiang, X., Livi, K. J. T., Arenberg, M. R., Chen, A., Chen, K., yue, Gentry, L., et al. (2021). High flow event induced the subsurface transport of particulate phosphorus and its speciation in agricultural tile drainage system. Chemosphere 263:128147. doi: 10.1016/j.chemosphere.2020.128147
Knapp, J., von Freyberg, J., Studer, B., Kiewiet, L., and Kirchner, J. (2020). Concentration-discharge relationships vary among hydrological events, reflecting differences in event characteristics. Hydrol. Earth Syst. Sci. Discuss. 24, 1–27. doi: 10.5194/egusphere-egu2020-5981
Kudela, R. M., Berdalet, E., Bernard, S., Burford, M., Fernand, L., Lu, S., et al. (2015). Harmful Algal Blooms A Scientific Summary for Policy Makers. Paris: IOC/UNESCO.
Macrae, M., Jarvie, H., Brouwer, R., Gunn, G., Smith, D., Reid, K., et al. (2021). One size does not fit all: toward regional conservation practice guidance to reduce phosphorus loss risk in the Lake Erie watershed. J. Environ. Qual. 50, 529–546. doi: 10.1002/jeq2.20218
Macrae, M. L., Ali, G. A., King, K. W., Plach, J. M., Pluer, W. T., Williams, M., et al. (2019). Evaluating hydrologic response in tile-drained landscapes: implications for phosphorus transport. J. Environ. Qual. 1355, 1347–1355. doi: 10.2134/jeq2019.02.0060
Marinos, R. E., Van Meter, K. J., and Basu, N. B. (2020). Is the river a chemostat?: Scale versus land use controls on nitrate concentration-discharge dynamics in the upper Mississippi River Basin. Geophys. Res. Lett. 47, 1–11. doi: 10.1029/2020GL087051
Miller, S. A., and Lyon, S. W. (2021). Tile drainage causes flashy streamflow response in Ohio watersheds. Hydrol. Process. 35:e14326. doi: 10.1002/hyp.14326
Mitsch, W. J. (2017). Solving Lake Erie's harmful algal blooms by restoring the Great Black Swamp in Ohio. Ecol. Eng. 108, 406–413. doi: 10.1016/j.ecoleng.2017.08.040
Musolff, A., Schmidt, C., Selle, B., and Fleckenstein, J. H. (2015). Catchment controls on solute export. Adv. Water Resour. 86, 133–146. doi: 10.1016/j.advwatres.2015.09.026
Ohio Division of Geological Survey (2005). Glacial Map of Ohio: Ohio Department of Natural Resources, Division of Geological Survey, Page-Size Map With Text, 2 p., Scale 1:2,000,000. Columbus, OH: Ohio Division of Geological Survey.
PRISM Climate Group, O. S. U. (2019). PRISM Climate Data. Available online at: http://prism.oregonstate.edu (accessed October, 11 2021).
Robbins, S. G., and Voss, R. D. (1991). Phosphorus and potassium stratification in conservation tillage systems. J. Soil Water Conserv. 46, 298–300.
Schilling, K. E., and Helmers, M. (2008a). Effects of subsurface drainage tiles on streamflow in Iowa agricultural watersheds: exploratory hydrograph analysis. Hydrol. Process. 4506, 4497–4506. doi: 10.1002/hyp.7052
Schilling, K. E., and Helmers, M. (2008b). Tile drainage as karst: conduit flow and diffuse flow in a tile-drained watershed. J. Hydrol. 349, 291–301. doi: 10.1016/j.jhydrol.2007.11.014
Schilling, K. E., and Jones, C. S. (2019). Hydrograph separation of subsurface tile discharge. Environ. Monit. Assess. 191:231. doi: 10.1007/s10661-019-7377-4
Sharpley, A., Richards, P., Herron, S., and Baker, D. (2012). Case study comparison between litigated and voluntary nutrient management strategies. J. Soil Water Conserv. 67, 442–450. doi: 10.2489/jswc.67.5.442
Sharpley, A. N. (2003). Soil mixing to decrease surface stratification of phosphorus in manured soils. J. Environ. Qual. 32:1375. doi: 10.2134/jeq2003.1375
Smith, D. R., Huang, C., and Haney, R. L. (2017). Phosphorus fertilization, soil stratification, and potential water quality impacts. J. Soil Water Conserv. 72, 417–424. doi: 10.2489/jswc.72.5.417
Smith, D. R., King, K. W., Johnson, L., Francesconi, W., Richards, P., Baker, D., et al. (2015). Surface runoff and tile drainage transport of phosphorus in the Midwestern United States. J. Environ. Qual. 44, 495–502. doi: 10.2134/jeq2014.04.0176
Smith, D. R., Livingston, S. J., Zuercher, B. W., Larose, M., Heathman, G. C., and Huang, C. (2008). Nutrient losses from row crop agriculture in Indiana. J. Soil Water Conserv. 63, 396–409. doi: 10.2489/jswc.63.6.396
Stumpf, R. P., Wynne, T. T., Baker, D. B., and Fahnenstiel, G. L. (2012). Interannual variability of cyanobacterial blooms in Lake Erie. PLoS ONE 7:e42444. doi: 10.1371/journal.pone.0042444
Thompson, S. E., Basu, N. B. Jr, J. L., Aubeneau, A., and Rao, P. S. C. (2011). Relative dominance of hydrologic versus biogeochemical factors on solute export across impact gradients. Water Resources Res. 47, 1–20. doi: 10.1029/2010WR009605
U.S. EPA (2013). Level III Ecoregions of the Continental United States. Corvallis, Oregon. Available online at: https://www.epa.gov/eco-research/level-iii-and-iv-ecoregions-continental-united-states (accessed October, 11 2021).
Valayamkunnath, P., Barlage, M., Chen, F., Gochis, D. J., and Franz, K. J. (2020). Mapping of 30-meter resolution tile-drained croplands using a geospatial modeling approach. Sci. Data 7, 1–10. doi: 10.1038/s41597-020-00596-x
Van Meter, K. J., Basu, N. B., Veenstra, J. J., and Burras, C. L. (2016). The nitrogen legacy: emerging evidence of nitrogen accumulation in anthropogenic landscapes. Environ. Res. Lett. 11:035014. doi: 10.1088/1748-9326/11/3/035014
Vu, D. T., Tang, C., and Armstrong, R. D. (2009). Tillage system affects phosphorus form and depth distribution in three contrasting Victorian soils. Aust. J. Soil Res. 47, 33–45. doi: 10.1071/SR08108
Williams, M. R., and King, K. W. (2020). Changing rainfall patterns over the Western Lake Erie Basin (1975 – 2017): effects on tributary discharge and phosphorus load. Water Resour. Res. 56:e2019WR025985. doi: 10.1029/2019WR025985
Williams, M. R., King, K. W., Baker, D. B., Johnson, L. T., Smith, D. R., and Fausey, N. R. (2016a). Hydrologic and biogeochemical controls on phosphorus export from Western Lake Erie tributaries. J. Great Lakes Res. 42, 1403–1411. doi: 10.1016/j.jglr.2016.09.009
Williams, M. R., King, K. W., Ford, W., Buda, A. R., and Kennedy, C. D. (2016b). Effect of tillage on macropore flow and phosphorus transport to tile drains. Water Resour. Res. 52, 2868–2882. doi: 10.1002/2015WR017650
Keywords: tile drainage, agriculture, nutrients, streamflow, concentration-discharge (C-Q) relationships
Citation: Miller SA and Lyon SW (2021) Tile Drainage Increases Total Runoff and Phosphorus Export During Wet Years in the Western Lake Erie Basin. Front. Water 3:757106. doi: 10.3389/frwa.2021.757106
Received: 11 August 2021; Accepted: 30 September 2021;
Published: 27 October 2021.
Edited by:
Beata Ferencz, University of Life Sciences of Lublin, PolandReviewed by:
Lindsey M. W. Yasarer, United States Department of Agriculture (USDA), United StatesColeen Carranza, Wageningen University and Research, Netherlands
Copyright © 2021 Miller and Lyon. This is an open-access article distributed under the terms of the Creative Commons Attribution License (CC BY). The use, distribution or reproduction in other forums is permitted, provided the original author(s) and the copyright owner(s) are credited and that the original publication in this journal is cited, in accordance with accepted academic practice. No use, distribution or reproduction is permitted which does not comply with these terms.
*Correspondence: Samuel A. Miller, bWlsbGVyLjEwNTEzJiN4MDAwNDA7b3N1LmVkdQ==