 Robert A. Newbould
 D. Mark Powell
 Michael J. Whelan
- School of Geography, Geology and the Environment, University of Leicester, Leicester, United Kingdom
Plastic accumulation in the marine environment is a major concern given the harmful effects and longevity of plastics at sea. Although rivers are likely to significantly contribute to the flux of plastic to marine systems, the behaviour of plastic debris in fluvial systems remains poorly understood and estimates of riverine plastic flux derived from field measurements and modelling efforts are highly uncertain. This paper presents a new probabilistic model of plastic transport in rivers which describes the main processes controlling plastic displacement and which predicts the statistical distribution of travel distances for individual items of buoyant macroplastic debris. Macroplastic transport is controlled by retention in temporary stores (or traps) created by vegetation, bank roughness elements and other obstacles. The behaviour of these traps is represented in the model via a series of Bernoulli trials conducted in a Monte Carlo simulation framework. The model was applied to a tracer experiment in a small 1.1 km river reach. Three replicates were used for calibration and three for validation. For each replicate, 90 closed air-filled polyethylene terephthalate (PET) bottles were introduced at the upstream end of the reach and the location of each bottle was recorded after 24 h. Bottles were chosen as “model” macroplastic litter items given their high usage and littering rate. Travel distances were low. The average and maximum distances travelled over 24 h were 231 m and 1.1 km, respectively. They were also variable. The coefficient of variation of travel distances was 0.94. Spatial patterns were controlled by the location and characteristics of discrete traps. The model was able to describe the observed travel distance distributions reasonably well, suggesting that modelling plastic behaviour in longer reaches and even whole catchments using a stochastic travel distance approach is feasible. The approach has the potential to improve estimates of river plastic flux, although significant knowledge gaps remain (e.g., the rate and location of plastic supply to river systems, the transport behaviours of different types of plastic debris and trap effectiveness in different types of river system, season, and discharge).
Introduction
Plastic contamination of the environment, particularly the oceans, has become a major global concern in recent years. This concern has arisen, in part, due to the longevity of many types of plastic material which has resulted in accumulation and an apparent ubiquity of plastic at sea (Welden, 2020). Evidence of plastic debris has been found in every major ocean basin (Barnes et al., 2009). The potentially harmful effects of plastic on wildlife include physical entanglement, reduced stomach capacity, intestinal blockage and internal injury following ingestion (Oehlmann et al., 2009; Eriksen et al., 2014; Sigler, 2014). It has also been suggested that plastics can enhance exposure to toxic hydrophobic organic compounds which sorb to plastic particles (Teuten et al., 2007; Chua et al., 2014) although this notion has recently been challenged (e.g., Gouin et al., 2011; Koelmans et al., 2017). In any case, the fact that plastic pollution negatively affects environmental aesthetics is uncontroversial (Sheavly and Register, 2007).
Although rivers have been recognised as major sources for marine plastic debris (Jambeck et al., 2015; Lebreton et al., 2017; Schmidt et al., 2017; Meijer et al., 2021), their exact contribution remains highly uncertain. To identify the most polluting rivers and to prioritise mitigation efforts, accurate estimates of global riverine plastic emissions are required. So far, three modelling studies have estimated this emission: Lebreton et al. (2017), Schmidt et al. (2017), and Meijer et al. (2021). In all three cases, global plastic flux was estimated from the sum of fluxes from individual catchments predicted using models which were calibrated against observations of riverine plastic flux reported in the literature. Lebreton et al. (2017) and Schmidt et al. (2017) used similar approaches to estimate catchment flux, based on river discharge and mismanaged plastic waste (MMPW) generation. They estimated the global flux range to be 1.15–2.41 Mt yr−1 and 0.41–4 Mt yr−1, respectively. Meijer et al. (2021) used a different approach to estimate catchment flux, based on MMPW generation, the probability of debris entering the river network, and the probability of debris transfer to the ocean. These probabilities were derived from physical factors believed to drive MMPW transfer to the coast (precipitation, wind, land use, distance to river, stream order, river discharge and distance to river mouth). This resulted in an estimated flux in the range 0.8–2.7 Mt yr−1. Although similar in magnitude, the large difference between the upper and lower estimates of plastic flux in these studies reflect considerable uncertainty in model predictions. Additionally, the spatial distribution of plastic inputs was different in each study, particularly in the study of Meijer et al. (2021). They suggest over 1,000 rivers are accountable for 80% of global riverine plastic emission, compared to 47 and 5 rivers in Lebreton et al. (2017) and Schmidt et al. (2017), respectively.
Given that modelled estimates of plastic flux have been generated using some form of calibration based on field measurements, the quality of these estimates are directly affected by the quality of these field measurements. Field measurements, however, are scarce, not standardised, spatially and temporally variable and are biassed by the higher frequency of studies in North American and European rivers (González-Fernandez and Hanke, 2017; van Emmerik et al., 2018, 2019a,b; González-Fernandez et al., 2021). Research is ongoing to improve field measurements of plastic concentration (e.g., van Emmerik et al., 2018). However, relatively little is known about how plastic debris is displaced in fluvial systems and research is urgently needed. In particular, dominant modes of transport, residence times, accumulation processes (temporary and permanent) and storage zones in different reach types and under different flow regimes remain uncertain (see Figure 1, which summarises the main processes affecting macroplastic displacement in rivers). One recent study which contributes to closing these knowledge gaps is that reported by Tramoy et al. (2020), who used GPS trackers to understand the transfer dynamics of macroplastic in the River Seine and its estuary. They found that macroplastic debris moved intermittently and its residence time was much longer than the transit time of water.
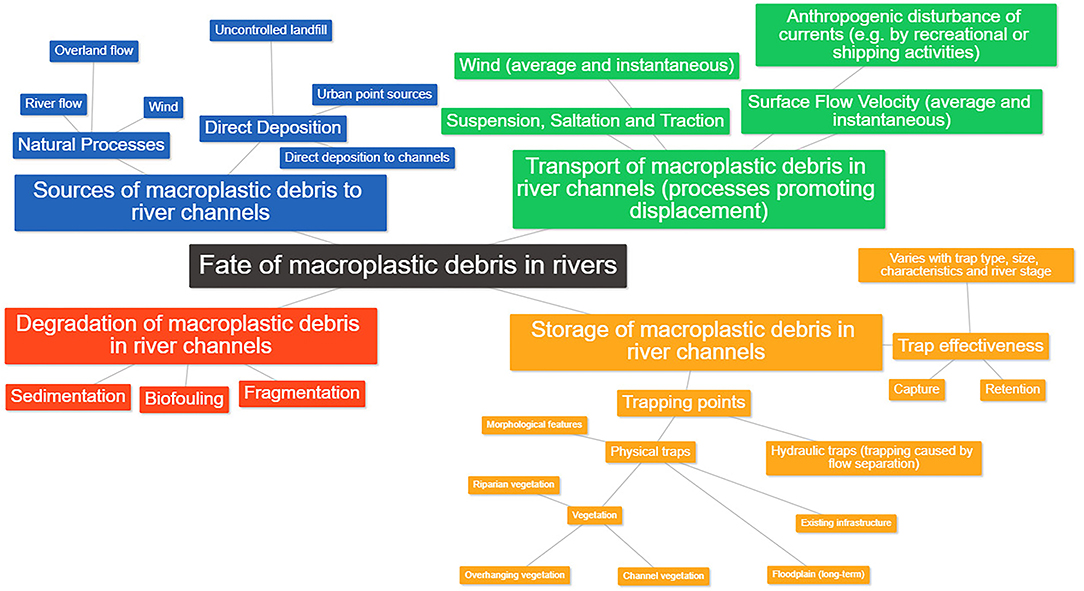
Figure 1. Processes controlling the fate of macroplastic debris in rivers, including: the sources, transport, degradation, and storage of macroplastic debris in river channels.
The mechanisms promoting macroplastic debris displacement in rivers are analogous to those which transport sediment—suspension, saltation and traction (see Charlton, 2008). However, unlike sediment, many plastic materials are buoyant. This means they can be transported on the surface by the current and by wind (Ivar do Sul et al., 2014; Kooi et al., 2018). Displacement is likely to be controlled by a combination of factors including the specific characteristics of each river reach (hydraulic geometry, discharge, and velocity) and plastic properties (e.g., density, buoyancy, shape and size). Plastic properties may be altered by fragmentation, biofouling and other degradation mechanisms (Ryan, 2015; Kooi et al., 2018).
The transport of plastic debris can be conceptualised over a series of discrete “step” (the movement phase) and “rest” (the stationary phase) periods between sites of temporary storage (or “trapping points”). This is the same conceptualisation as for sediment transport (see Hassan et al., 1991). Trapping points can be broadly categorised as either hydraulic (trapping by flow separation structures) or physical (trapping by physical obstacles). Flow separation generates recirculation eddies, turbulence and “dead zones” of weak reverse flow (Ferguson et al., 2003), within which macroplastic debris can potentially become trapped. This often occurs where there are topographic irregularities at the channel boundary, which include undulations caused by erosion and the slumping of bank material, channel obstructions (e.g., channel bars) and meander bends (Ferguson et al., 2003; Kean and Smith, 2006). Physical traps include aquatic (instream), riparian (bankside), and overhanging vegetation, morphological features (e.g., channel bars, rough banks, and exposed boulders) and infrastructure (e.g., dams, weirs, bridges, fords, culverts, and flow deflectors). Vegetation is a potentially significant trap of macroplastic debris. In a study on the Saigon River, Vietnam, Schreyer et al. (2021) found that plastic transport was strongly linked to the presence of water hyacinths in the river, which act as accumulation zones of plastic debris. Similarly, Ivar do Sul et al. (2014) demonstrated that plastic debris can be retained by mangrove forest patches for long periods of time (months-years). Clearly, hydraulic and physical traps interact with one another: flow separation can cause macroplastic debris to become trapped in physical traps; and physical traps can promote flow separation. Thus, individual traps may be the result of a combination of hydraulic processes and the presence of barriers.
In this study, we present a “proof of concept” macroplastic tracer experiment, in which plastic tracers were introduced at the upstream boundary of a lowland river reach and displacement and trapping of these tracers were characterised. We also developed a general framework for modelling macroplastic debris transport in rivers, which was informed by the experiment. The model is intended to be used to: (1) estimate a travel distance distribution for plastic debris; (2) identify sites of temporary storage and; (3) estimate the residence time distribution of plastic debris at plastic accumulation zones. It should be noted that this study focusses on the macroplastic size fraction (items larger than 5 mm). The transport of microplastic particles (<5 mm) is also an important issue, but their fate and behaviour differs markedly from that of macroplastic and is, thus, beyond the scope of this study.
Methods
Study Area
Travel distances of macroplastic tracers were measured along a 1.1 km study reach of the River Sence (a tributary of the River Soar), near Wistow, Leicester, UK (injection point at 52°33.498′N, 1°03.092′W) between January and March 2020 (Supplementary Figure 1). The Sence catchment is small (catchment area ≈ 65 km2 at the injection point) with moderate to low relief and a land cover dominated by arable farming with some grazed and cut grassland. Mean annual rainfall is ~650 mm and catchment geology consists of low permeability bedrock, overlain by boulder clay and alluvium deposits, generating a mean annual runoff of ~266 mm (1971–2020: National River Flow Archive). The study reach is narrow (width ≈ 4 m at the injection point), meandering (sinuosity index ≈ 1.7) and contains patches of in-channel and overhanging vegetation that interact with the flow. Regrading operations have been conducted historically along the study reach, which have altered the river channel through straightening, widening and deepening (Sear, 1993). These operations have also caused some bank failure/slumping (Sear, 1993). Good access for the retrieval of tracers along its entire length makes the reach ideal for investigating macroplastic debris trapping.
Tracer Experiments
Macroplastic travel distance distributions were determined using tagged polyethylene terephthalate (PET) bottles. Plastic bottles were selected as model litter items because they are a significant component of plastic pollution—the UK uses 13 billion plastic bottles each year, plastic bottles make up a third of all plastic pollution in the sea and 14% of identifiable plastic litter items found in European freshwater environments were plastic bottles (Environmental Audit Committee, 2017; Earth Watch Institute, 2019). The bottles were obtained from recently discarded waste at our university campus and the plastic was in pristine condition (i.e., it was unweathered, with no opportunity given for biofilm development). They were introduced into the study reach at regular intervals (every 5 s) to ensure they travelled independently of each other. Their location was then recorded after 24 h before retrieval using fishing nets. Temporary mesh fencing was erected at the end of the study reach to prevent downstream losses. The development of the experimental protocol was guided by pilot experiments, in which plastic bottles were injected and retrieved after only a few hours. The key findings from the pilot studies suggested that travel distances (x) were typically relatively low ( = 128 m), but highly variable (16 m ≤ x ≤ 699 m). As a result, the study was restricted to a reach of ~1 km and a relatively large sample size of 90 bottles was employed in each replicate injection in the main study. Six replicate injections (R1–R6) were made. Each replicate was conducted at a similar stage and the discharge in each experiment (measured using salt-dilution gauging) was approximately the same each time ( = 0.303 m3s−1, σ = 0.077 m3s−1). We also regularly monitored stage (water depth at a concrete platform close to the upstream end of the study reach) to ensure that there were no major changes during introduction of the bottles and over the 24-h monitoring period.
To investigate macroplastic debris trapping, it was necessary to map the location and nature of trapping points along the study reach. The following trap types were identified in the pilot experiments: (1) aquatic, riparian and overhanging vegetation; (2) rough channel banks, and (3) meander bends. In a survey of the study reach, overhanging tree and meander bend locations were recorded since they were typically discrete and associated with particular locations. The other types of trap were not mapped since they are continuously distributed along the reach and were less-easily identified.
Modelling
Probability of Trapping
A new probabilistic model of fluvial plastic transport was constructed to describe the main processes controlling plastic displacement and storage and to estimate travel distance distributions for plastic debris. The model is conceptual in nature and deliberately simple. The total reach is divided into a set of equally spaced sub-reaches (cells). Macroplastic is assumed to travel in a downstream direction from cell to cell (Figure 2). Each cell is assigned a probability of trapping a particle (bottle), p(T). In straight, wide, uniform channels, without any discrete trapping points, p(T) is assumed to be zero over the (short) timeframe considered in the experiments. Elsewhere, p(T) is affected hypothetically by: (1) trapping along meander bends, p(M); (2) trapping in overhanging vegetation, p(V), and (3) trapping along channel banks, p(CB). Formally, p(T) is given as:
p(M) is assumed to increase with channel sinuosity (Supplementary Figure 2A) as follows:
where a is an empirical parameter and S is the ratio of channel length (C in m) to downvalley length (D in m), after Leopold et al. (1964):
p(CB) is assumed to decrease with increasing channel width (w, m) above a minimum width (w0, m) as the interaction between the bulk river flow and channel banks decreases (Supplementary Figure 2B) via:
where b and c are empirical (calibrated) parameters. Setting b to unity yields a value of p(CB) = 1 for w = w0 so b is always >1. w can either be directly measured or estimated from discharge using a hydraulic geometry relation (see Leopold and Maddock, 1953).
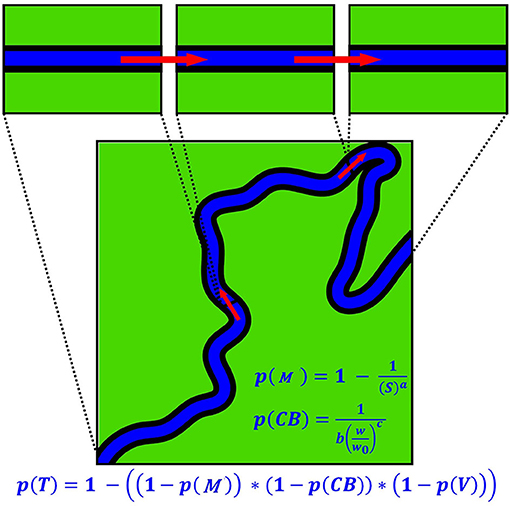
Figure 2. Schematic illustration of the transfer of macroplastic debris downstream from cell to cell. Also shown are the equations used to calculate the combined probability of trapping, p(T), probability of trapping along meander bends, p(M), and probability of trapping along channel banks, p(CB).
p(V) is assumed to be equal to zero everywhere except in cells containing an overhanging tree. In these cells, p(V) is assigned by model calibration. Overhanging trees were identified from field surveys. However, it is feasible that tree identification can be automated using aerial photographs or satellite imagery (see Tomsett and Leyland, 2019).
Model Operation
Two model scenarios were considered: (1) introduction of a large number of bottles at a single point at the start of the simulation, representing the tracer experiment described above, and (2) random emission of bottles at multiple points along the river over time, representing real-world inputs of macroplastic litter. Model calculations are performed iteratively (Supplementary Figure 3). In each iteration, the fate of each bottle in motion is considered: bottles either pass from cell to cell in a downstream direction or they become “trapped.” This is a stochastic process based on a series of Bernoulli trials (i.e., a random experiment with exactly two possible outcomes: pass or trap). For each bottle moving into a new cell, trapping is predicted when a random number generated from a uniform distribution (0–1) is less than or equal to p(T) for the destination cell. Values of p(T) are automatically calculated based on reach characteristics (Equation 1).
In all iterations after the first, trapped bottles can also be reset in motion based on another Bernoulli trial in which another uniform random variate (0–1) is compared to a pre-defined probability of release, q(i). Like p(T), values of q(i) are likely to be related to reach characteristics, but in the absence of more information, a constant value of 0.5 is assumed for all cells here. This means that the spatial pattern of bottle accumulation is controlled by the pattern of p(T). Bottles that are reset in motion are subjected to the same stochastic process (pass or trap) as other moving bottles. Each iteration ends after all bottles have been trapped or have passed through the downstream section of the whole reach. This process is intended to reflect the stochastic nature of plastic debris transport in the field. A tally of bottles trapped in each cell is maintained, along with a count of bottles which have left the system. This tally can be compared to the observed data on bottle counts in each cell and to counts of bottles passing through the downstream boundary.
In Scenario 2, a Bernoulli trial is conducted to determine whether bottles are emitted to each cell [i.e., when a random variate generated from a standard uniform distribution is less than a pre-defined probability of emission to that cell, pe(i)]. Here, values of pe(i) were fixed arbitrarily for illustrative purposes. However, these could be derived from environmental characteristics, such as proximity to bridges or footpaths, where there is enhanced opportunity for the direct deposition of litter to the channel. Macroplastic littering is likely to be lower in rural areas, relative to urban areas due to lower population densities. Emission could also be described using specific probability density functions related to MMPW generation data (e.g., Lebreton and Andrady, 2019). The displacement and trapping of bottles in Scenario 2 are described in the same way as for Scenario 1. Each iteration of the model represents a unit of time. This can either be a specific (arbitrary) period (e.g., 24 h) or may represent the transit time of water. Here, the bottle location data used for calibration was collected 24 h after injection, so one time iteration equals one day.
Calibration
The model was calibrated by adjusting p(V), a, b, and c to optimise the fit between the spatial distribution of modelled frequencies and the measured data derived from three replicate runs of the tracer experiment (~50% of the observed data). Calibration was performed using an iterative combinatorial procedure involving multiple model runs and employing a range of parameter combinations. This method is also known as a parameter sweep (Malleson, 2014) or calibration via factorial analysis (Hamby, 1994). The calibration parameter space was sampled from a = 0 to 1.7 (with an increment of 0.1), b = 1 to 10 (with an increment of 1), c = 1 to 7 (with an increment of 1) and p(V) = 0 to 0.4 (with an increment of 0.05). This gave 11,340 different combinations.
To match the observed data, p(M) and p(CB) were calculated for individual sub-reaches at 10 m resolution using Equations (2–4). A non-zero value of p(V) was applied only to cells containing an overhanging tree. Although p(T) was calculated at 10 m resolution, the calculation of p(T) is easily scalable to different sub-reach lengths. Note, however, that parameter values are likely to be scale-dependent. Modelled and measured travel distance distributions were compared using a two-sample Kolmogorov-Smirnov (KS) goodness-of-fit test. The KS test statistic (DStat) was recorded during each run. This test was used as an alternative to the more popular two-sample Chi-squared (χ2) test because χ2 does not allow expected frequencies to equal zero. This is important because in many sub-reaches the observed or modelled frequency of trapped particles was zero.
The optimal combination of parameters was that with the lowest value of DStat. The maximum proportion of bottles trapped in a 10 m sub-reach in the tracer experiments was ~35% of the bottles available for trapping. This was used to constrain the calibration parameter space of a and p(V) by setting an upper limit of 0.4 to the possible values of p(FS), p(CB), p(V), and p(T). The parameters b and c were constrained via trial and error with preliminary runs of the model (see Refsgaard and Storm, 1990).
Validation
The model was validated on the remaining three (independent) replicate runs of the tracer experiment (~50% of the observed data), with no further adjustment in parameter values. Again, DStat, was used as the measure of model performance.
Sensitivity Analysis
To assess the influence of different parameters on model output, a one-at-a-time sensitivity analysis was conducted (Hamby, 1994). The value of each calibrated parameter was varied by the same percentage away from its optimum (i.e., the best fit value from the calibration) from +/−10% to +/−100%, while other parameters were held fixed at their optimal values. Sensitivity was measured with changes in DStat, using the data from the three replicates used for calibration.
Results
Observations
Figure 3 shows the observed travel distance distribution for each replicate and for the combined data. The mean travel distance in each replicate ranged from 105 m in R3 to 357 m in R4, with an overall mean of 231 m. Maximum travel distances ranged from 680 m in R5 to 1,071 m in R6. No bottles were observed to exit the study reach in any of the 24-h replicate periods. The coefficient of variation of travel distances (CV), which is a measure of dispersion in relation to the mean, ranged from 0.54 in R4 to 1.41 in R5, with an overall CV of 0.94. The travel distance distributions for each replicate and the combined data set were all positively skewed with skewness ranging from 0.46 in R1 to 2.13 in R3. In each replicate, the tracer recovery rate ranged from 93% in R2 to 99% in R4 with an overall recovery rate of 96%. Bottles not retrieved from the channel were often found on the floodplain, presumably removed by external agencies (e.g., people, dogs, and wildlife). These bottles were not included in the calculated travel distance distributions. We also retrieved untagged bottles and other macroplastic litter during tracer retrieval so there was never any net macroplastic legacy from the experiments.
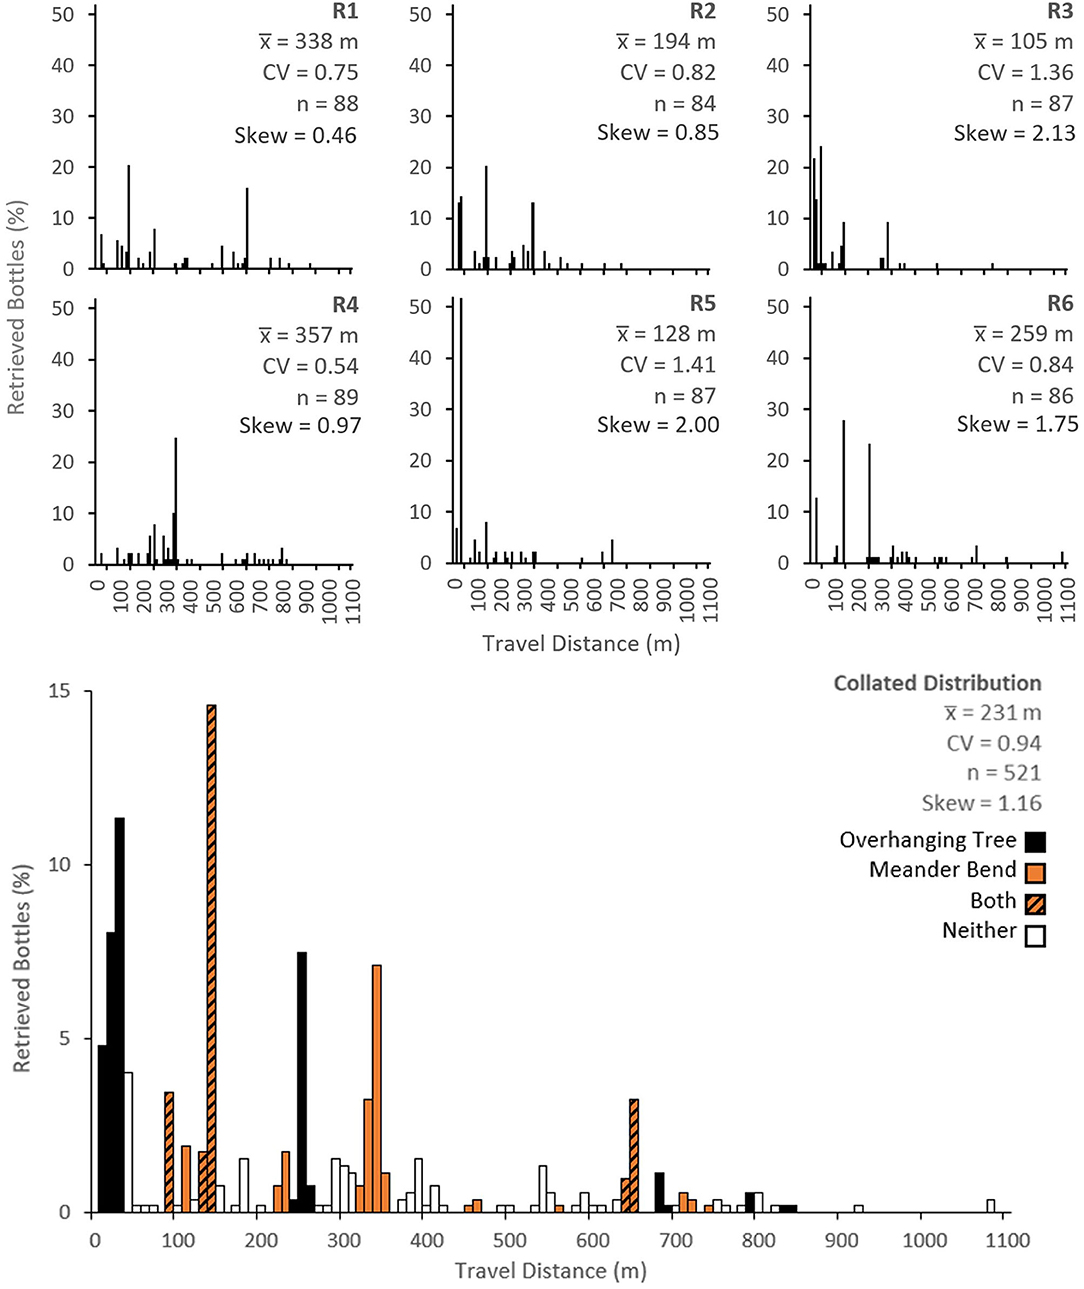
Figure 3. Observed plastic bottle travel distance distributions from the six replicate experiments (R1–R6) in the top panels and the combined data (bottom panel). The combined data is colour-coded according to the presence or absence of overhanging tree and meander bend traps. , mean travel distance; CV, coefficient of variation; n, number of bottles recovered.
The data highlight clear “hotspots” where the bottles consistently tended to get trapped (e.g., 20, 30, 140, 250, 340, and 650 m downstream of the injection point). The sub-reaches where most plastic bottles were trapped were 30 m downstream for R5 (trapping 52% of plastic bottles), 40 m downstream for R3 (trapping 24% of plastic bottles), 140 m downstream for R1, R2, and R6 (trapping 20, 20, and 28% of plastic bottles, respectively) and 340 m downstream for R4 (trapping 25% of bottles). Overall, the sub-reach which trapped most plastic bottles was 140 m downstream, where 15% of the bottles were trapped. Sub-reaches in the combined travel distance distribution in Figure 3 are colour-coded according to trap types (overhanging trees, meander bends or both). Note that some traps extend over multiple 10 m sub-reaches and some act at a specific points within the colour coded cell. Trapping hotspots generally coincided with the presence of overhanging trees (the only exception is the trapping hotspot 340 m downstream) or a meander bend. Just over half (59%) of the plastic bottles were trapped in sub-reaches containing overhanging tree branches and nearly half (43%) were trapped along meander bends. In sub-reaches containing both overhanging trees and meander bends, some interaction is likely to have occurred.
There was considerable variability in plastic bottle travel distances between replicates. For example, at the point where most plastic bottles were trapped (140 m downstream), the proportion of bottles trapped ranged from 2 to 28%. It should be noted that for increasing distance downstream, fewer bottles were available for trapping. This made identifying consistent trapping hotspots more difficult. In addition to the data reported here, we conducted some pilot experiments, in which bottles were collected within a couple of hours after they were introduced. The spatial patterns of these bottles were similar to those observed after 24 h (particularly the clusters caught in overhanging tree branches). This supports the idea that residence times in many of the traps are likely to be at least 24 h. However, we did observe that some bottles did move over shorter periods (typically those less-securely trapped along channel banks etc.).
Model Outputs and Comparison With Observations
Figure 4A shows the modelled frequency of injected bottles with distance after 24 h for the optimum combination of parameters (a = 0.3; b = 6, c = 5, and p(V) = 0.2). Equivalent measured frequencies are shown in Figures 4B,C for the calibration and validation data, respectively. Cumulative measured and modelled travel distance distributions for the calibration and validation data are shown in Figures 4D,E, respectively. The value for DStat for the calibration step was 0.114 which indicates that the predicted cumulative travel distance was not significantly different from the measured data. For the validation step, the value for DStat was 0.208 which indicates that the cumulative distribution was not as well-predicted (and that the two distributions were significantly different). It should be noted that several different parameter combinations yielded similar values of DStat (a phenomenon known as equifinality; von Bertalanffy, 1968; Beven and Freer, 2001; Whelan et al., 2019). For example, a DStat value of 0.115 was obtained with a = 0.2, b = 8, c = 2, and p(V) = 0.2. The lack of a clear global optimum may, in part, reflect the fact that the model is stochastic, giving slightly different predicted outcomes in each simulation.
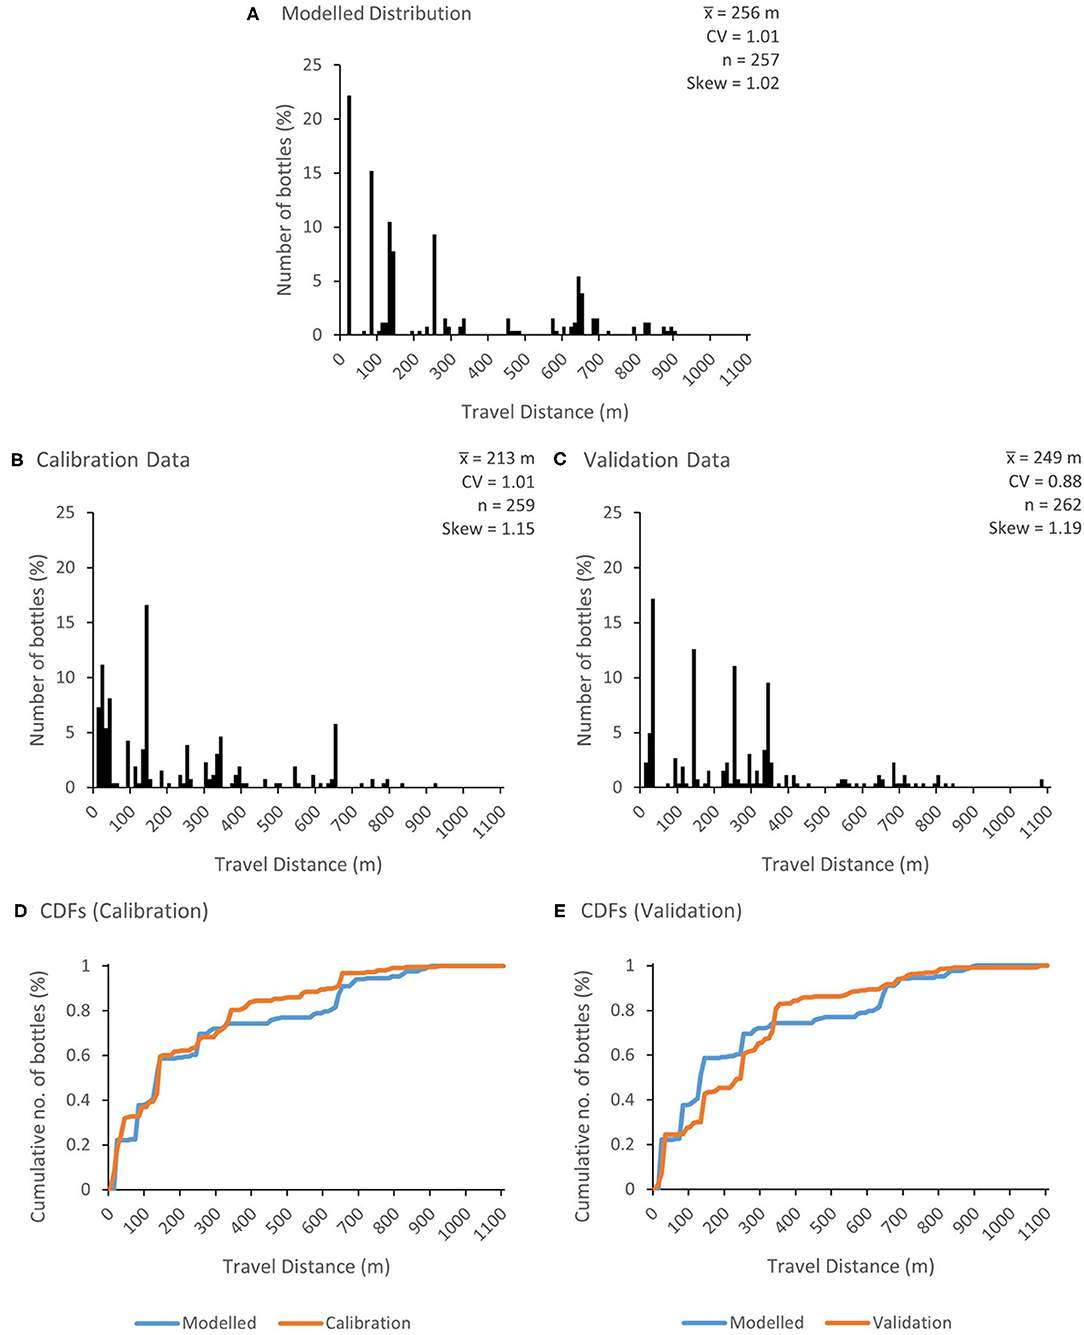
Figure 4. Travel distance distributions of plastic bottles after 24 h for (A) the optimum combination of parameters (a = 0.3, b = 6, c = 5, and p(V) = 0.2); (B) the calibration dataset and (C) the validation dataset. The cumulative distribution functions (CDFs) for travel distances in the calibration and validation datasets are shown in (D,E), respectively. , mean travel distance; CV, coefficient of variation; n, number of bottles. Note that n is different in (A,B) due to the predicted loss of two bottles from (A).
The reasonable model performance, particularly during calibration, reflects, in part, the importance of overhanging trees as discrete macroplastic traps, which were identified in the model a priori (at 20, 80, 140, 250, and 650 m downstream of the injection point) from channel survey data. Bottle trapping along meander bends was less well-simulated. For example, several bottles were trapped at the meander bend 340 m downstream of the injection point during the tracer experiments (7% across all replicates) but no trapped bottles were predicted.
Model Performance Beyond the Tracer Study
In general, the centroid of the distribution of trapped bottles should gradually shift downstream over time and the variance of the distribution should increase, approximately in accordance with advection-dispersion theory (e.g., Gandolfi et al., 2001). This is illustrated in Figure 5 which shows the predicted plastic bottle travel distance distribution 2, 5, and 10 days after injection, assuming arbitrarily that q(i) = 0.5 for all sub-reaches. In addition to the translation of the distribution downstream ( = 368, 628 and 758 m at 2, 5, and 10 days, respectively) and an increase in variance, there is a gradual increase in the number of bottles predicted to have left the study reach, nOUT (nOUT = 30, 119, and 226, respectively). In each cell, the residence time distribution will also depend on q(i). Figure 6 illustrates an example predicted residence time distribution 20 m downstream of the injection point for q(i) = 0.5. This point is the first major trap along the study reach, but the same output could be produced for any sub-reach. The distribution is positively skewed with a modal residence time for trapped bottles of just one day. Although the assumption of q(i) = 0.5 may be appropriate for some trap types under certain conditions, further work is needed to reveal how macroplastic debris behaves in different traps and over a range of conditions. It is likely that q(i) will vary substantially over time and space and that it will be substantially lower than 0.5 for some traps.
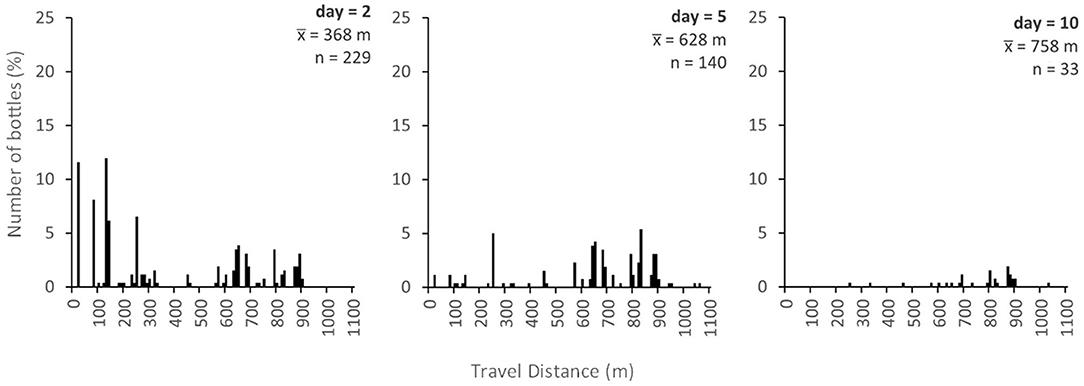
Figure 5. Modelled travel distance distribution of plastic bottles after 2, 5, and 10 days, assuming q(i) = 0.5 for all traps.
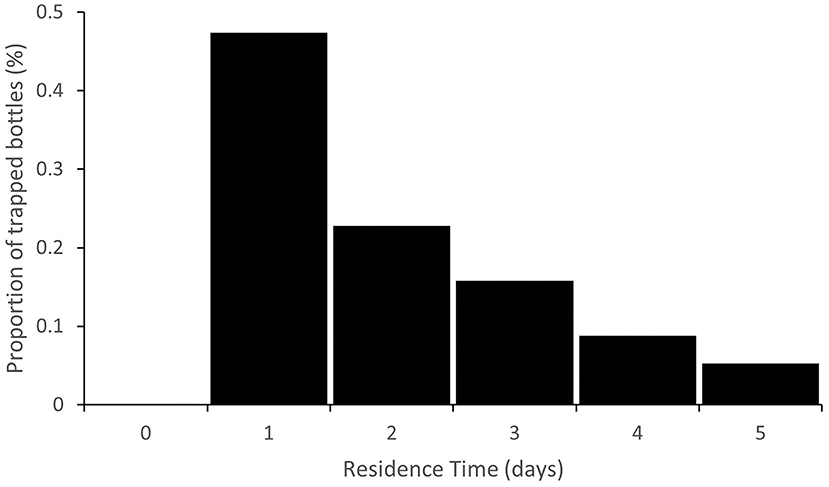
Figure 6. Example residence time distribution at the sub-reach 20 m downstream of the injection point, assuming q(i) = 0.5 for all traps.
Model predictions for Scenario 2 (i.e., the random emission of bottles at multiple points along the river over time) are illustrated in Figure 7, which shows an example distribution of bottle storage for three points in time. In this case, the pattern of bottle storage is affected by a combination of the probability of emission to a cell, pe(i), the probability of trapping, p(T), and the probability of release, q(i). Here, pe(i) was set to 0.25 and the number of bottles assumed to enter each cell during an emission event was set to 5 (for illustrative purposes) for every cell. Model predictions from this scenario could be compared to “real world” spatial patterns of plastic accumulation. In this case, there appears to be a predicted accumulation zone 820 m downstream of the upstream boundary on the second and third days. This zone is not revealed in the measured data from the tracer experiment nor in the Scenario 1 simulations because most bottles are trapped upstream of this point. Long-term surveys and or monitoring of pulse-injected bottles could ascertain whether this point really acts as a zone of preferential macroplastic accumulation or not. In general, the model run in Scenario 2 could be used to target mitigation efforts. With realistic estimates of the location, rate and frequency of emission, model predictions could also be used to estimate riverine plastic fluxes (via nOUT) at different catchment scales.
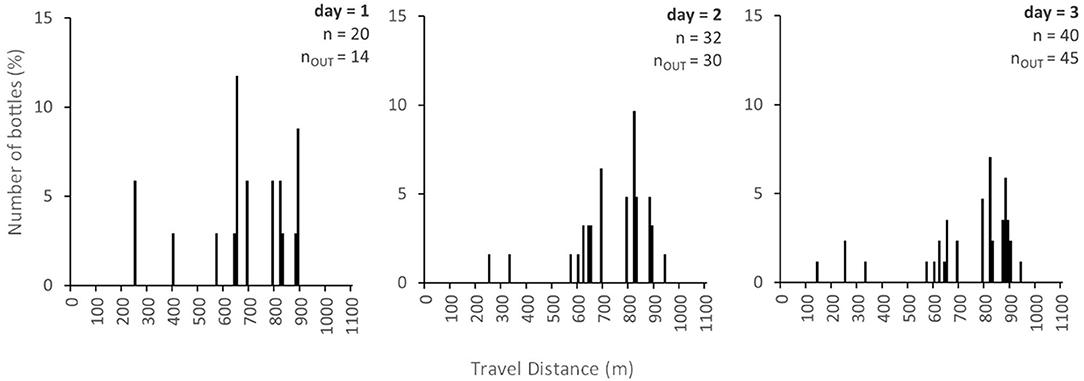
Figure 7. Bottle storage distribution for the diffuse-injection of plastic bottles after 1, 2, and 3 days under the assumption that q(i) was equal to 0.5, pe(i) was equal to 0.25, and the number of bottles entering during an emission event was equal to 5.
Sensitivity Analysis
Results of the sensitivity analysis are shown in Figure 8. Sensitivity was anisotropic with most sensitivity observed in response to a decrease in the value of parameter c. This controls the relationship between channel width (w) and the probability of trapping along channel banks (p(CB); Equation 4). An increase in c results in a decrease in p(CB). Increases in c from its optimum resulted in relatively minor changes in DStat. The parameter b also controls the relationship between w and p(CB). Increases in b also results in decreases in p(CB). Relatively minor changes in DStat were also observed in response to a change in b. Optimal model performance was obtained when p(CB) was assumed (calibrated) to be very low, reflecting observations that trapping along channel banks is relatively minor. Further investigation, especially along rivers with varying channel widths, is required.
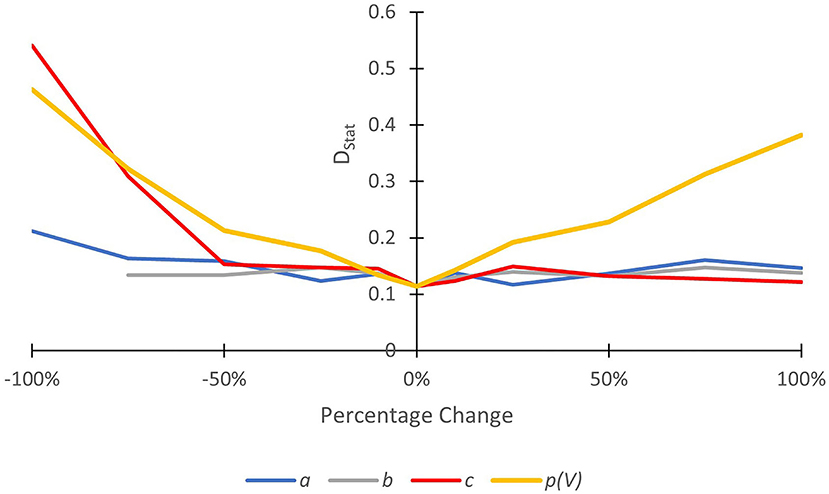
Figure 8. Results from a one-at-a-time sensitivity analysis, showing the change in model goodness of fit (deviation between the predicted and observed CDFs, DStat) for the parameters a, b, c, and p(V). High change in DStat for a given percentage increment in the parameter value away from its optimum (0%) indicates a high degree of sensitivity to that parameter.
Model fit was not sensitive to parameter a. This parameter controls the relationship between channel sinuosity (S) and the probability of trapping along meander bends [p(M); Equation 2]. Low changes in DStat in response to changes in a were largely caused by S being very close to unity in every cell (1 ≤ S ≤ 1.32). By extension, p(M) was close to zero in every cell (see Equation 2). This may explain the poor simulation of trapping at meander bends because all sub-reaches were characterised as straight (rather than sinuous or meandering; see Leopold et al., 1964). The use of S as a proxy for the number of meander bends along the study reach, therefore, may not be appropriate (at least at 10 m resolution). At a coarser resolution, S may be a better proxy for identifying meander bends. Finally, and unsurprisingly, model fit appeared to be relatively sensitive to p(V), meaning that even small differences in p(V) affected predictive quality. This highlights the important role of vegetation (especially overhanging trees) in the trapping of floating macroplastic. More research is urgently needed to understand the role of different types of vegetation in the transport and trapping of plastic debris.
Discussion and Conclusions
Plastic pollution is a significant and growing global threat. The potential issues in marine systems are now widely recognised. However, despite the fact that rivers are potentially significant contributors to ocean plastic pollution, the transport of macroplastic debris in rivers remains poorly understood. In addition, plastic pollution can result in direct deleterious impacts within riverine ecosystems (Blettler and Wantzen, 2019). Here, we present the results from a “proof of concept” macroplastic tracer experiment, which was used to characterise the displacement and trapping of macroplastic debris in rivers. In the experiment, PET bottle tracers were introduced at the upstream boundary of an experimental reach of a lowland river and their locations were recorded after 24 h. A similar approach was employed by Ivar do Sul et al. (2014) in mangrove forests. As reported by Ivar do Sul et al. (2014), we also found that travel distances were low, highly variable and mediated by the location of discrete “trapping points” (particularly, in our case, overhanging trees and meander bends). In most cases, stranding appeared to be independent of other plastic debris—i.e., bottles were trapped individually or were lodged individually but in clusters behind overhanging branches or in emergent vegetation. However, there were some occasions when trapped bottles may have disrupted the movement of others and enhanced their potential to strand. We attempted to reduce such interactions by introducing the bottles individually and believe that the overall interactive effect was minimal. Since macroplastic debris appears to be captured and retained relatively easily, it is likely that many items of debris never make it to the ocean, or do so only after very long periods of time.
We also present the results from a new probabilistic model of fluvial plastic transport, which was calibrated using data from the tracer experiment. The model is based on the probability of trapping, which is constructed from the probabilities of trapping along meander bends, in overhanging vegetation and along channel banks. These probabilities were described by hypothetical relationships with reach and vegetation characteristics. The calibrated model was able to match the observed distribution of macroplastic storage reasonably well. However, model performance with respect to independent data (validation) was inferior to that during calibration. This may, in part, reflect the stochastic nature of macroplastic transport itself (as illustrated by differences in observed bottle distributions between replicate runs: Figure 3). The generation of larger measured and simulated datasets is needed to fully assess the extent to which the model is statistically robust. Nevertheless, the fact that the broad spatial pattern of plastic accumulation appears to have been captured by the model, even during validation, suggests that there is wider potential to utilise the same approach to model macroplastic transfer in rivers more generally—possibly up to the catchment scale. The explicit recognition that most riverine macroplastic resides in stores with variable residence times, and that plastic transport between these stores is intermittent needs to be more explicitly recognised in models of terrestrial to ocean flux. For example, the model of Meijer et al. (2021) employs an estimated bulk probability of plastic transport in river channels to the ocean which is based on stream order, discharge and distance to the sea, but this does not explicitly recognise the number and nature of plastic traps which will exist in all channel networks. Experimental and modelling work along the lines described in this paper may allow riverine plastic transfer efficiencies between sources and the sea to be better quantified and potentially disaggregate the bulk parameters estimated in catchment scale models, such as that of Meijer et al. (2021).
The predictive quality of our model is currently limited by (inter alia): (1) an imperfect understanding of what controls plastic transport in rivers; (2) a poor understanding of the relationships between reach characteristics and the probability of trapping and (3) the limited size of the calibration dataset. To improve the fundamental understanding of the processes controlling plastic displacement (and, therefore, the quality of the model), additional tracer experiments should be conducted on reaches of varying characteristics (e.g., straight, wide or sparsely vegetated). These experiments should also be conducted with other types of litter (e.g., plastic carrier bags, snack packets and straws), made from different plastic materials and under different flow conditions to understand how plastic properties (e.g., buoyancy, shape, and size) and river stage/discharge affect plastic transport. Our experiments focused on buoyant (air filled) particles. However, many non-air filled particles (including PET) have densities similar to or greater than that of water and will, therefore, be suspended within the water column or even travel by saltation along the bed. Furthermore, weathering (e.g., from exposure to ultraviolet light or physical abrasion) and biofouling (the development of a microbial film on the surface of the particle) are known to alter fundamental properties of the original item (such as particle size, shape and density) which can change transport behaviours. For example, Kowalski et al. (2016) showed that plastic sinking rates were affected by particle shape as well as by density and size. Kowalski et al. (2016) also showed that abrasion in turbulent sedimentary systems (such as rivers or the surf zone) can result in the incorporation of quartz grains, which can also potentially influence the behaviour of the particle. The development of biofilms on plastic particles can increase their density and enhance settling rates (Chubarenko et al., 2016; Semcesen and Wells, 2021). Future work should also consider these effects by comparing the behaviour of virgin and weathered/fouled debris.
In principle, the model is able to make estimates of real-world plastic retention and flux. However, more information on the residence time of plastic debris in different trap types and accurate estimates of the location, frequency and volume of plastic emission to channels are required. The residence time of plastic debris in rivers is of primary importance because it directly controls riverine plastic flux and can be used to quantify q(i). Again, this can be determined with additional tracer experiments, but across longer temporal scales. For practicality, these types of experiment could usefully employ GPS trackers (see Tramoy et al., 2020). These have the added advantage of providing high temporal resolution data on the location of plastic tracers. This information can be used to understand the movement of plastic during shorter periods than the 24 h monitoring period employed in our study. Data we collected from pilot studies (not shown here) suggest that some stranded bottles are remobilised (and almost always re-trapped) over shorter periods. Trackers could also be used to understand the behaviour of macroplastic debris over longer periods. Although our model was calibrated for a 24 h sampling period, this type of information could be used to incorporate better probabilistic descriptions of trap and release dynamics in the model, which could make it more generally applicable, without calibration. Disadvantages of GPS trackers include inter alia their relatively high procurement and running costs and limited accuracy. Other research is emerging to predict the amount and volume of plastic entering river channels. For example, Melink et al. (2021) have developed a modelling concept to predict plastic transport on land, but this research is at a very early stage. Additional experimental and modelling work should consider the effects of emission location characteristics on the initiation of plastic displacement (i.e., considering more realistic release scenarios). Initiation of motion could be affected by, for example, the type and density of riparian and in-channel vegetation, the presence of physical obstacles (e.g., bridge piers, lock gates and weirs) and the presence of other (plastic) debris.
The model also has the potential to be scaled up to the catchment scale. For large catchments, it would probably not be practical to estimate p(T) at 10 m resolution. Instead, a representative value of p(T) could be applied to longer reach segments based on aggregate characteristics. These values could be determined empirically from experiments conducted along different study reaches (as above) with model parameters derived from statistical relationships. To assist with scaling up the model, reach characteristics could be automatically calculated in a geographical information system from existing channel network datasets (e.g., the WWF's HydroSHEDS data; see Lehner et al., 2008). Channel width could be estimated from bankfull discharge (Qbf) using hydraulic geometry (see Leopold and Maddock, 1953). Qbf itself can be estimated from the discharge with a recurrence interval of 1.5 years using readily available gauged flow data, if available; see Benson and Thomas, 1966). If gauged flow data are not available (as is the case in many parts of the world), mean annual discharge could be estimated from a combination of modelled runoff fields (e.g., from water balance calculations; see Fekete et al., 1999) and accumulated area. A large number of long-term and refined experiments are likely to be needed to get a good quantitative understanding of the different controls on macroplastic transport and release. This represents a significant challenge going forward, which needs to be met in order to scale up the model. Nevertheless, the approach presented here has significant potential to investigate and model macroplastic debris transfer in rivers and potentially improve estimates of riverine plastic flux at river-basin scale.
Perhaps the most important finding of the study reported here is that travel distances for macroplastic debris in rivers are short and variable. This is consistent with the finding of Tramoy et al. (2020) in the Seine and implies that some previous estimates of the terrestrial to marine macroplastic flux may not be accurate. Of course, fluxes are likely to vary with river stage but may not necessarily be higher as discharge increases. For example, at very high stage, rivers often flow overbank. In these situations, plastic debris may also leave the channel and be deposited on floodplains or in oxbow lakes when water levels subside. Further work is needed to investigate the potential sink effect of this phenomenon which, along with other long-term plastic sinks in river channel and riparian zone networks, may go some way to explaining the missing plastic question (the disparity between estimated emissions of plastics to the environment and the estimated stock of plastic which in the world's oceans: e.g., Cózar et al., 2014; Owens and Kamil, 2020; Weiss et al., 2021). Our work broadly supports the general conclusion of Weiss et al. (2021) that previous estimates of riverine plastic flux to the oceans may have been over-estimated.
Data Availability Statement
The raw data supporting the conclusions of this article will be made available by the authors, without undue reservation.
Author Contributions
This study was conceived by RAN, DMP, and MJW. Fieldwork and data analysis were conducted pre-dominantly by RAN with contributions by DMP and MJW. The model was developed by RAN and MJW. The paper was written by RAN with inputs from DMP and MJW. All authors contributed to the article and approved the submitted version.
Funding
This work was funded via a University of Leicester bursary to RAN.
Conflict of Interest
The authors declare that the research was conducted in the absence of any commercial or financial relationships that could be construed as a potential conflict of interest.
Publisher's Note
All claims expressed in this article are solely those of the authors and do not necessarily represent those of their affiliated organizations, or those of the publisher, the editors and the reviewers. Any product that may be evaluated in this article, or claim that may be made by its manufacturer, is not guaranteed or endorsed by the publisher.
Supplementary Material
The Supplementary Material for this article can be found online at: https://www.frontiersin.org/articles/10.3389/frwa.2021.724596/full#supplementary-material
References
Barnes, D. K. A., Galgani, F., Thompson, R. C., and Barlaz, M. (2009). Accumulation and fragmentation of plastic debris in global environments. Philos. Trans. R. Soc. B 364, 1985–1998. doi: 10.1098/rstb.2008.0205
Benson, M. A., and Thomas, D. M. (1966). A definition of dominant discharge. Hydrol. Sci. J. 11, 76–80. doi: 10.1080/02626666609493460
Beven, K. J., and Freer, J. (2001). Equifinality, data assimilation, and uncertainty estimation in mechanistic modelling of complex environmental systems using the GLUE methodology. J. Hydrol. 249, 11–29. doi: 10.1016/S0022-1694(01)00421-8
Blettler, M. C. M., and Wantzen, K. M. (2019). Threats underestimated in freshwater plastic pollution: mini-review. Water Air Soil Pollut. 230:174. doi: 10.1007/s11270-019-4220-z
Chua, E. M., Shimeta, J., Nugegoda, D., Morrison, P. D., and Clarke, B. O. (2014). Assimilation of polybrominated diphenyl ethers from microplastics by the marine amphipod, Allorchestes compressa. Environ. Sci. Technol. 48, 8127–8134. doi: 10.1021/es405717z
Chubarenko, I., Bagaev, A., Zobkov, M., and Esiukova, E. (2016). On some physical and dynamical properties of microplastic particles in marine environment. Mar. Pollut. Bull. 108, 105–112. doi: 10.1016/j.marpolbul.2016.04.048
Cózar, A., Echevarria, F., Gonzalez-Gordillo, J. I., Irigoien, X., Ubeda, B., Hernandez-Leon, S., et al. (2014). Plastic debris in the open ocean. Proc. Natl. Acad. Sci. U.S.A. 111, 10239–10244. doi: 10.1073/pnas.1314705111
Earth Watch Institute (2019). Plastic Rivers—reducing the plastic pollution on our doorstep. Available online at: https://earthwatch.org.uk/images/plastic/PlasticRiversReport.pdf (Accessed November 23, 2019).
Environmental Audit Committee (2017). Plastic bottles: Turning Back the Plastic Tide. (HC339, 2017-19). London: The Stationary Office.
Eriksen, M., Lebreton, L. C., Carson, H. S., Thiel, M., Moore, C. J., Borerro, J. C., et al. (2014). Plastic pollution in the world's oceans: more than 5 trillion plastic pieces weighing over 250,000 tons afloat at sea. PLoS ONE 9:e111913. doi: 10.1371/journal.pone.0111913
Fekete, B. M., Vorosmarty, C. J., and Grabs, W. (1999). Global Composite Runoff Fields on Observed River Discharge and Simulated Water Balances (GRDC Report No. 22). Koblenz: Global Runoff Data Centre.
Ferguson, R. I., Parsons, D. I., Lane, S. L., and Hardy, R. J. (2003). Flow in meander bends with recirculation at the inner bank. Water Resour. Res. 39:1322. doi: 10.1029/2003WR001965
Gandolfi, C., Facchi, A., and Whelan, M. J. (2001). On the relative role of hydrodynamic dispersion for river water quality. Water Resour. Res. 37, 2365–2375. doi: 10.1029/2001WR000249
González-Fernandez, D., Cozar, A., Hanke, G., Viejo, J., Morales-Casellas, C., Bakiu, R., et al. (2021). Floating macrolitter leaked from Europe into the ocean. Nat. Sustain. 4, 474–483. doi: 10.1038/s41893-021-00722-6
González-Fernandez, D., and Hanke, G. (2017). Toward a harmonized approach for monitoring of riverine floating macro litter inputs to the marine environment. Front. Mar. Sci. 4:86. doi: 10.3389/fmars.2017.00086
Gouin, T., Roche, N., Lohmann, R., and Hodges, G. (2011). Thermodynamic approach for assessing the environmental exposure of chemicals absorbed to microplastic. Environ. Sci. Technol. 45, 1466–1472. doi: 10.1021/es1032025
Hamby, D. (1994). A review of techniques for parameter sensitivity analysis of environmental models. Environ. Monit. Assess. 32, 135–154. doi: 10.1007/BF00547132
Hassan, M. A., Church, M., and Schick, A. (1991). Distance of movement of coarse particles in gravel bed streams. Water Resour. Res. 27, 503–511. doi: 10.1029/90WR02762
Ivar do Sul, J. A., Costa, M. F., Silva-Cavalcanti, J. S., and Araújo, M. C. B. (2014). Plastic debris retention and exportation by a mangrove forest patch. Mar. Pollut. Bull. 78, 252–257. doi: 10.1016/j.marpolbul.2013.11.011
Jambeck, J. R., Geyer, R., Wilcox, C., Siegler, T. R., Perryman, M., Andrady, A., et al. (2015). Plastic waste inputs from land into the ocean. Science 347, 768–771. doi: 10.1126/science.1260352
Kean, J. W., and Smith, J. D. (2006). Form drag in rivers due to small-scale natural topographic features: 1. Regular sequences. J. Geophys. Res. 11:F04009. doi: 10.1029/2006JF000467
Koelmans, A. A., Besseling, E., Foekema, E., Kooi, M., Mintenig, S., Ossendorp, B. C., et al. (2017). Risks of plastic debris: unravelling fact, opinion, perception, and belief. Environ. Sci. Technol. 51, 11513–11519. doi: 10.1021/acs.est.7b02219
Kooi, M., Besseling, E., Kroeze, C., van Wezel, A. P., and Koelmans, A. A. (2018). “Modeling the fate and transport of plastic debris in freshwaters: review and guidance,” in Freshwater Microplastics. The Handbook of Environmental Chemistry, eds M. Wagner and S. Lambert (Cham: Springer), 125–152.
Kowalski, N., Reichardt, A. M., and Waniek, J. J. (2016). Sinking rates of microplastics and potential implications of their alteration by physical, biological, and chemical factors. Mar. Pollut. Bull. 109, 310–319. doi: 10.1016/j.marpolbul.2016.05.064
Lebreton, L., and Andrady, A. (2019). Future scenarios of global plastic waste generation and disposal. Palgrave Commun. 5:6. doi: 10.1057/s41599-018-0212-7
Lebreton, L. C. M., van der Zwet, J., Damsteeg, J. W, Slat, B., Andrady, A., and Reisser, J. (2017). River plastic emissions to the world's oceans. Nat. Commun. 8:15611. doi: 10.1038/ncomms15611
Lehner, B., Verdin, K., and Jarvis, A. (2008). New global hydrography derived from spaceborne elevation data. Eos 89, 93–94. doi: 10.1029/2008EO100001
Leopold, L. B., and Maddock, T. (1953). The Hydraulic Geometry of Stream Channels and Some Physiographic Implications. Washington, DC: USGS Professional Paper 252.
Leopold, L. B., Wolman, M. G., and Miller, J. P. (1964). Fluvial Processes in Geomorphology. San Francisco, CA: W.H. Freeman and Company.
Malleson, N. (2014). “Calibration of simulation models,” in Encyclopedia of Criminology and Criminal Justice, eds G. Bruinsma and D. Weisburd (New York, NY: Springer), 243–252.
Meijer, L. J. J., van Emmerik, T., van der Ent, R., Schmidt, C., and Lebreton, L. (2021). More than 1000 rivers accountable for 80% of global riverine plastic emissions into the ocean. Sci. Adv. 7:eaaz5803. doi: 10.1126/sciadv.aaz5803
Melink, Y. A. M., van Emmerik, T. H. M., Kooi, M., Laufkötter, C., and Niemann, H. (2021). The trash tracker: a macroplastic transport and fate model at river basin scale. EarthArXiv [Preprint]. doi: 10.31223/X5303G
Oehlmann, J., Schulte-Oehlmann, U., Kloas, W., Jagnytsch, O., Lutz, I., Kusk, K. O., et al. (2009). A critical analysis of the biological impacts of plasticizers on wildlife. Philos. Trans. R. Soc. B 364, 2047–2062. doi: 10.1098/rstb.2008.0242
Owens, K. A., and Kamil, P. I. (2020). Adapting coastal collection methods for river assessment to increase data on global plastic pollution: examples from india and Indonesia. Front. Environ. Sci. 7:208. doi: 10.3389/fenvs.2019.00208
Refsgaard, J. C., and Storm, B. (1990). “Construction, calibration, and validation of hydrological models,” in Distributed Hydrological Modelling, eds M. B. Abbott and J. C. Refsgaard (Dordrecht: Springer), 41–54.
Ryan, P. G. (2015). Does size and buoyancy affect the long-distance transport of floating debris? Environ. Res. Lett. 10:084019. doi: 10.1088/1748-9326/10/8/084019
Schmidt, C., Krauth, T., and Wagner, S. (2017). Export of plastic debris by rivers into the sea. Environ. Sci. Technol. 51, 12246–12253. doi: 10.1021/acs.est.7b02368
Schreyer, L., van Emmerik, T., Nguyen, T. L., Castrop, E., Phung, N. A., Kieu-Le, T. C., et al. (2021). Plastic plants: the role of water hyacinths in plastic transport in tropical rivers. Front. Environ. Sci. 9:686334. doi: 10.3389/fenvs.2021.686334
Sear, D. A. (1993). Siltation and Bank Instability on the River Sence, Leicestershire. Report to Severn-Trent Region NRA. NRA Research and Development Project C5/384.
Semcesen, P. O., and Wells, M. G. (2021). Biofilm growth on buoyant microplastics leads to changes in settling rates: implications for microplastic retention in the Great Lakes. Mar. Pollut. Bull. 170:112573. doi: 10.1016/j.marpolbul.2021.112573
Sheavly, S. B., and Register, K. M. (2007). Marine debris and plastics: environmental concerns, sources, impacts, and solutions. J. Polym. Environ. 15, 301–305. doi: 10.1007/s10924-007-0074-3
Sigler, M. (2014). The effects of plastic pollution on aquatic wildlife: current situations and future solutions. Water Air Soil Pollut. 225:2184. doi: 10.1007/s11270-014-2184-6
Teuten, E. L., Rowland, S. J., Galloway, T. S., and Thompson, R. C. (2007). Potential for plastics to transport hydrophobic contaminants. Environ. Sci. Technol. 41, 7759–7764. doi: 10.1021/es071737s
Tomsett, C., and Leyland, J. (2019) Remote sensing of river corridors: a review of current trends future directions. River Res. Appl. 35, 779–803. doi: 10.1002/rra.3479
Tramoy, R., Gasperi, J., Colasse, L., Silvestre, M., Dubois, P., Nous, C., et al. (2020). Transfer dynamics of macroplastics in estuaries—new insights from the Seine estuary: Part 2. Short-term dynamics based on GPS-trackers. Mar. Pollut. Bull. 160:111566. doi: 10.1016/j.marpolbul.2020.111566
van Emmerik, T., Kieu-Le, T. C., Loozen, M., van Oeveren, K., Strady, E., Bui, X. T., et al. (2018). A methodology to characterize riverine macroplastic emission into the ocean. Front. Mar. Sci. 5:372. doi: 10.3389/fmars.2018.00372
van Emmerik, T., Loozen, M., van Oeveren, K., Buschman, F., and Prinsen, G. (2019a). Riverine plastic emission from Jakarta into the ocean. Environ. Res. Lett. 14:084033. doi: 10.1088/1748-9326/ab30e8
van Emmerik, T., Strady, E., Kieu-Le, T. C., Nguyen, L., and Gratiot, N. (2019b). Seasonality of riverine macroplastic transport. Sci. Rep. 9:13549. doi: 10.1038/s41598-019-50096-1
Weiss, L., Ludwig, W., Heussner, S., Canals, M., Ghiglione, J.-F., Estournel, C., et al. (2021). The missing ocean plastic sink: gone with the rivers. Science 373, 107–111. doi: 10.1126/science.abe0290
Welden, N. A. (2020). “The environmental impacts of plastic pollution,” in Plastic Waste and Recycling: Environmental Impact, Societal Issues, Prevention, and Solutions, ed T. M. Letcher (London: Academic Press),195–222.
Keywords: plastic, macroplastic, pollution, tracer, transport, travel distance, river, model
Citation: Newbould RA, Powell DM and Whelan MJ (2021) Macroplastic Debris Transfer in Rivers: A Travel Distance Approach. Front. Water 3:724596. doi: 10.3389/frwa.2021.724596
Received: 13 June 2021; Accepted: 13 August 2021;
Published: 21 September 2021.
Edited by:
Tim van Emmerik, Wageningen University and Research, NetherlandsReviewed by:
Romain Tramoy, École des ponts ParisTech, FranceFrank Collas, Radboud University Nijmegen, Netherlands
Katharine Owens, University of Hartford, United States
Copyright © 2021 Newbould, Powell and Whelan. This is an open-access article distributed under the terms of the Creative Commons Attribution License (CC BY). The use, distribution or reproduction in other forums is permitted, provided the original author(s) and the copyright owner(s) are credited and that the original publication in this journal is cited, in accordance with accepted academic practice. No use, distribution or reproduction is permitted which does not comply with these terms.
*Correspondence: Robert A. Newbould, cmFuMTRAbGVpY2VzdGVyLmFjLnVr